Prediction of Metastasis in Paragangliomas and Pheochromocytomas Using Machine Learning Models: Explainability Challenges
Abstract
1. Introduction
2. Related Work
3. Explainability Methods
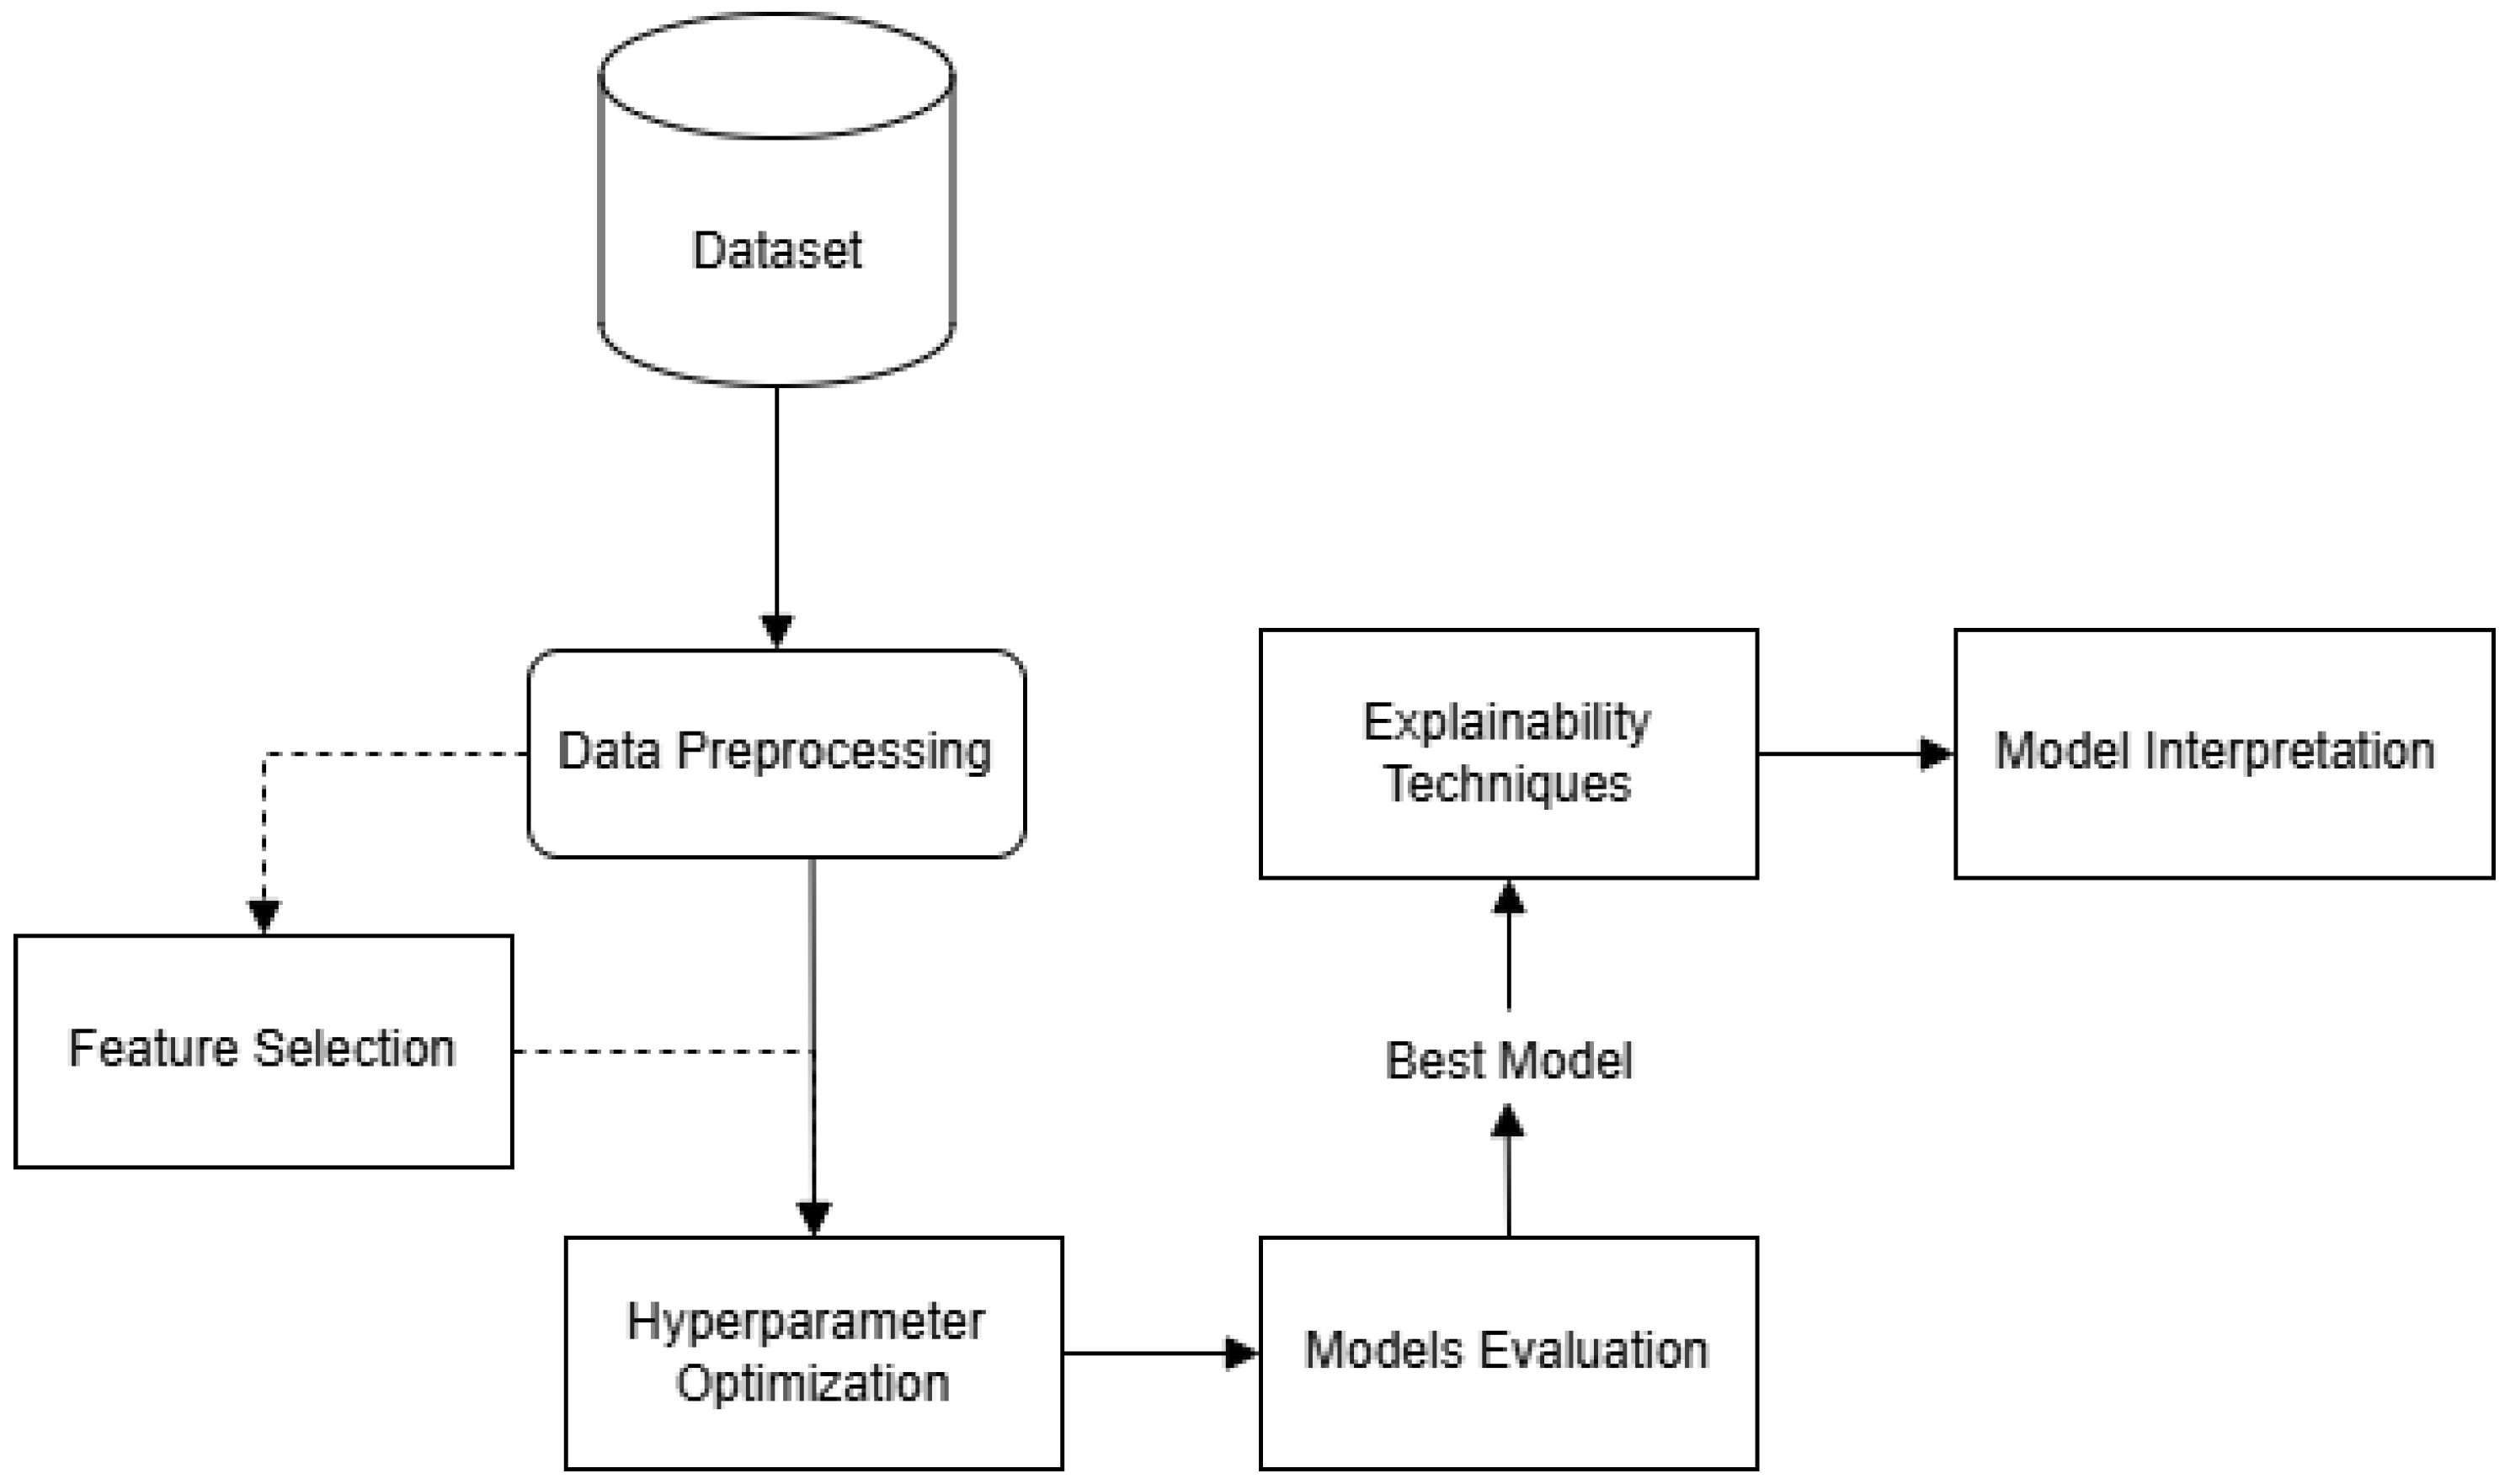
4. Methodology
4.1. Dataset
4.2. Data Preprocessing
- Class Imbalance Handling: In order to address the class imbalance problem, the Random OverSampling technique was applied. This method increases the representation of the minority class by replicating its instances, thereby promoting a more balanced class distribution and improving the reliability of model predictions.
- Missing Value Treatment: Missing values were identified, revealing a small number of omissions in the dataset. To preserve data integrity, imputation was applied, using the mean value for missing entries in the numeric variables Age, Plasma NMN, Plasma MN, Plasma MTY, and Spherical volume.
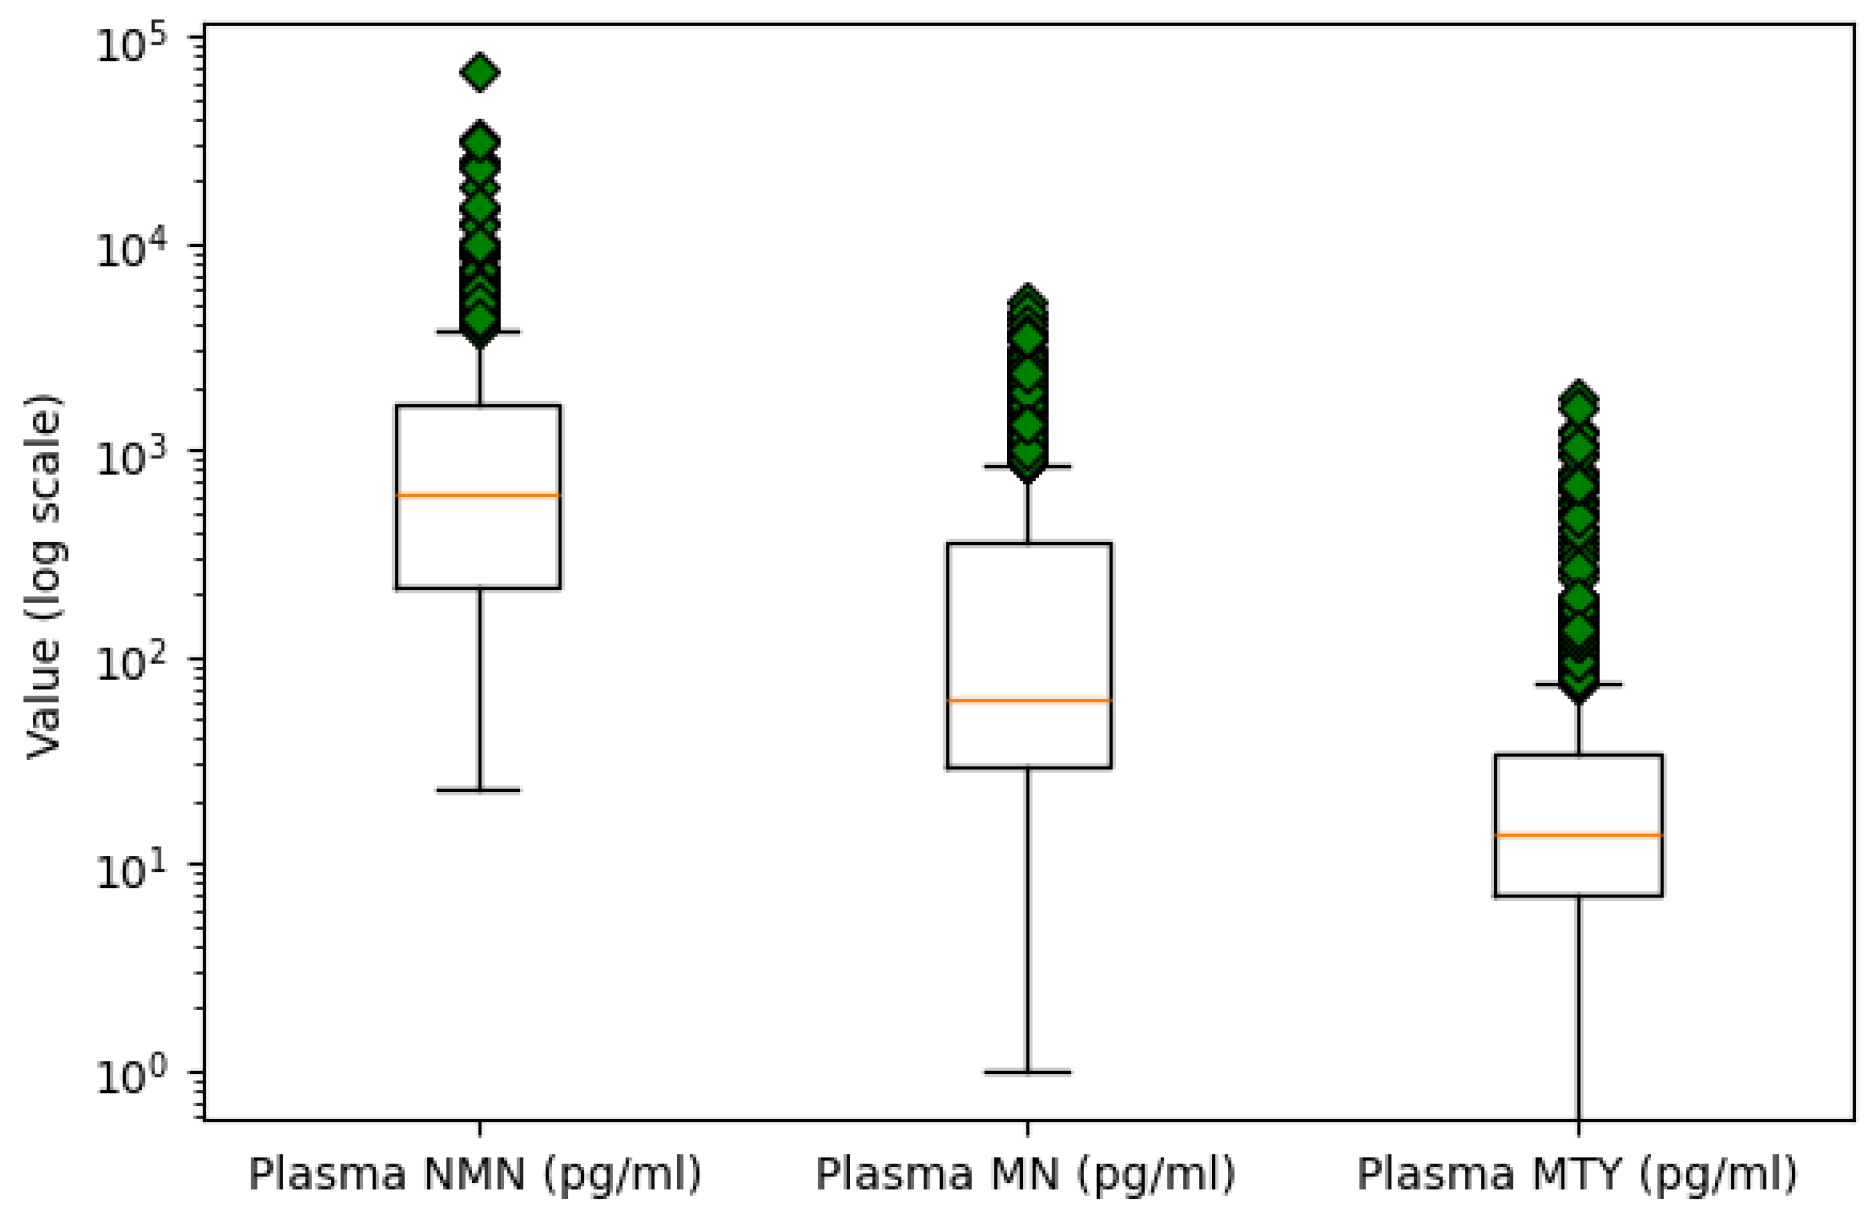
- Outlier Detection: Outlier detection was performed using box plot analysis for numeric variables. An extreme value was identified in the Plasma NMN variable, with a concentration over twice as high as the next largest measurement. Due to its significant deviation from the central tendency, it is likely a result of measurement error. Consequently, this outlier was removed to maintain the quality of the data. Figure 2 presents the boxplots of the three plasma metabolites on a logarithmic scale to better visualize and compare their distributions.
- Encoding Categorical Variables: Categorical columns were transformed into a numerical format using one-hot encoding, where each unique category was represented as a separate binary column. This transformation avoids introducing ordinal relationships between categories and ensures compatibility with machine learning algorithms.
4.3. Optimization Procedure and Evaluation Metrics
- Accuracy measures the proportion of correctly classified instances among all samples.
- Precision measures the proportion of correctly predicted positive instances out of all instances predicted as positive, indicating the model’s ability to avoid false positives.
- Recall (also known as sensitivity) measures the proportion of correctly identified positive instances among all actual positive cases, reflecting the model’s ability to capture all true positives.
- F1-Score represents the harmonic mean between Precision and Recall, offering a single metric that balances both concerns.
- AUC (Area Under the Curve) quantifies the overall ability of the model to discriminate between positive and negative classes across all classification thresholds; a higher AUC indicates better overall model performance.
5. Results
5.1. Evaluation of the Models
- Decision Tree Classifier: The baseline study reported an accuracy of 91.4%, an F1-score of 75.0%, and an AUC of 0.893 for the Decision Tree classifier. In contrast, our Decision Tree model achieved an accuracy of 93.5%, an F1-score of 93.5%, and an AUC of 0.935. These results represent a 2.1% increase in accuracy, a 18.5% improvement in F1-score, and a 0.042 increase in AUC.
- Support Vector Classifier (SVC): The linear SVC model in previous work achieved an accuracy of 83.4%, an F1-score of 65.1%, and an AUC of 0.924. In our study, we tested three different SVC kernels: linear, polynomial, and RBF. The SVC with the RBF kernel outperformed the others, achieving an accuracy of 91.9%, an F1-score of 91.9%, and an AUC of 0.919. This represents an improvement of 8.5% in accuracy, a 26.8% increase in F1-score, and a slight decrease of 0.005 in AUC.
- Best Model Comparison. AdaBoost vs. Random Forest: The best model in the baseline study was the AdaBoost ensemble, which achieved an accuracy of 85.6%, an F1-score of 67.2%, and an AUC of 0.940. Our best model, the Random Forest classifier, outperformed this with an accuracy of 96.3%, an F1-score of 96.3%, and an AUC of 0.963. These results represent a 10.7% improvement in accuracy, a 29.1% increase in F1-score, and a 0.023 improvement in AUC.
5.2. Feature Selection
5.2.1. Study with the Three Most Important Features
5.2.2. Comparison of Results
5.3. Explainability of the Random Forest Model
5.3.1. Global Explainability
5.3.2. Local Explainability
6. Conclusions and Future Work
Author Contributions
Funding
Institutional Review Board Statement
Informed Consent Statement
Data Availability Statement
Acknowledgments
Conflicts of Interest
References
- National Cancer Institute. Metastasis. NCI Dictionary of Cancer Terms. Available online: https://www.cancer.gov/publications/dictionaries/cancer-terms/def/metastasis (accessed on 4 April 2024).
- Hanahan, D.; Weinberg, R. The hallmarks of cancer. Cell 2000, 100, 57–70. [Google Scholar] [CrossRef]
- National Cancer Institute. Pheochromocytoma and Paraganglioma Treatment. Available online: https://www.cancer.gov/espanol/tipos/feocromocitoma (accessed on 12 April 2024).
- Pamporaki, C.; Berends, A.; Filippatos, A.; Prodanov, T.; Meuter, L.; Prejbisz, A.; Eisenhofer, G. Prediction of metastatic pheochromocytoma and paraganglioma: A machine learning modelling study using data from a cross-sectional cohort. Lancet Digit. Health 2023, 5, e551–e559. [Google Scholar] [CrossRef]
- Miranda-Aguirre, A.P.; Hernández-García, S.; Tenorio-Torres, J.A.; Farias-Alarcón, M.; Erazo-Valle, S.A. Experiencia en el manejo de los tumores neuroendocrinos en el Servicio de Oncología del Centro Médico Nacional “20 de noviembre”, ISSSTE, en los últimos 10 años. Clin. Case 2012, 11, 18. [Google Scholar]
- Neumann, H.; Young, W.; Eng, C. Pheochromocytoma and Paraganglioma. N. Engl. J. Med. 2019, 381, 552–565. [Google Scholar] [CrossRef]
- Al Subhi, A.R.; Boyle, V.; Elston, M.S. Systematic review: Incidence of pheochromocytoma and paraganglioma over 70 years. J. Endocr. Soc. 2022, 6, bvac105. [Google Scholar] [CrossRef]
- Sharma, A.; Rani, R. A systematic review of applications of machine learning in cancer prediction and diagnosis. Arch. Comput. Methods Eng. 2021, 28, 4875–4896. [Google Scholar] [CrossRef]
- Von Eschenbach, W. Transparency and the black box problem: Why we do not trust AI. Philos. Technol. 2021, 34, 1607–1622. [Google Scholar] [CrossRef]
- Bharati, S.; Mondal, M.R.H.; Podder, P. A Review on Explainable Artificial Intelligence for Healthcare: Why, How, and When? IEEE Trans. Artif. Intell. 2024, 5, 1429–1442. [Google Scholar] [CrossRef]
- Bera, K.; Schalper, K.; Rimm, D.; Velcheti, V.; Madabhushi, A. Artificial intelligence in digital pathology—New tools for diagnosis and precision oncology. Nat. Rev. Clin. Oncol. 2019, 16, 703–715. [Google Scholar] [CrossRef]
- Jagga, Z.; Gupta, D. Classification models for clear cell renal carcinoma stage progression, based on tumor RNAseq expression trained supervised machine learning algorithms. BMC Proc. 2014, 8, 1–7. [Google Scholar] [CrossRef]
- Wang, Z.; Gerstein, M.; Snyder, M. RNA-Seq: A revolutionary tool for transcriptomics. Nat. Rev. Genet. 2009, 10, 57–63. [Google Scholar] [CrossRef]
- National Cancer Institute. The Cancer Genome Atlas (TCGA). Available online: https://www.cancer.gov/about-nci/organization/ccg/research/structural-genomics/tcga (accessed on 12 February 2025).
- Thompson, L. Pheochromocytoma of the Adrenal gland Scaled Score (PASS) to separate benign from malignant neoplasms: A clinicopathologic and immunophenotypic study of 100 cases. Am. J. Surg. Pathol. 2002, 26, 551–566. [Google Scholar] [CrossRef]
- Kimura, N.; Takayanagi, R.; Takizawa, N.; Itagaki, E.; Katabami, T.; Kakoi, N.; Naruse, M. Pathological grading for predicting metastasis in phaeochromocytoma and paraganglioma. Endocr.-Relat. Cancer 2014, 21, 405–414. [Google Scholar] [CrossRef]
- Wu, D.; Tischler, A.; Lloyd, R.; DeLellis, R.; de Krijger, R.; van Nederveen, F.; Nosé, V. Observer variation in the application of the Pheochromocytoma of the Adrenal Gland Scaled Score. Am. J. Surg. Pathol. 2009, 33, 599–608. [Google Scholar] [CrossRef]
- Stenman, A.; Zedenius, J.; Juhlin, C. The value of histological algorithms to predict the malignancy potential of pheochromocytomas and abdominal paragangliomas—A meta-analysis and systematic review of the literature. Cancers 2019, 11, 225. [Google Scholar] [CrossRef]
- Cho, Y.; Kwak, M.; Lee, S.; Ahn, S.; Kim, H.; Suh, S.; Lee, S. A clinical prediction model to estimate the metastatic potential of pheochromocytoma/paraganglioma: ASES score. Surgery 2018, 164, 511–517. [Google Scholar] [CrossRef]
- Alzahrani, A.; Alharithi, F. Machine learning approaches for advanced detection of rare genetic disorders in whole-genome sequencing. Alex. Eng. J. 2024, 106, 582–593. [Google Scholar] [CrossRef]
- SweGen. SweGen—Database Commons. Available online: https://ngdc.cncb.ac.cn/databasecommons/database/id/4976 (accessed on 15 February 2025).
- Ayala-Ramirez, M.; Feng, L.; Johnson, M.; Ejaz, S.; Habra, M.; Rich, T.; Jimenez, C. Clinical risk factors for malignancy and overall survival in patients with pheochromocytomas and sympathetic paragangliomas: Primary tumor size and primary tumor location as prognostic indicators. J. Clin. Endocrinol. Metab. 2011, 96, 717–725. [Google Scholar] [CrossRef]
- Pamporaki, C.; Hamplova, B.; Peitzsch, M.; Prejbisz, A.; Beuschlein, F.; Timmers, H.; Eisenhofer, G. Characteristics of pediatric vs adult pheochromocytomas and paragangliomas. J. Clin. Endocrinol. Metab. 2017, 102, 1122–1132. [Google Scholar] [CrossRef]
- Zelinka, T.; Musil, Z.; Dušková, J.; Burton, D.; Merino, M.; Milosevic, D.; Pacak, K. Metastatic pheochromocytoma: Does the size and age matter? Eur. J. Clin. Investig. 2011, 41, 1121–1128. [Google Scholar] [CrossRef]
- Eisenhofer, G.; Lenders, J.; Siegert, G.; Bornstein, S.; Friberg, P.; Milosevic, D.; Pacak, K. Plasma methoxytyramine: A novel biomarker of metastatic pheochromocytoma and paraganglioma in relation to established risk factors of tumour size, location and SDHB mutation status. Eur. J. Cancer 2012, 48, 1739–1749. [Google Scholar] [CrossRef]
- Jhawar, S.; Arakawa, Y.; Kumar, S.; Varghese, D.; Kim, Y.S.; Roper, N.; Del Rivero, J. New insights on the genetics of pheochromocytoma and paraganglioma and its clinical implications. Cancers 2022, 14, 594. [Google Scholar] [CrossRef]
- Brouwers, F.M.; Eisenhofer, G.; Tao, J.J.; Kant, J.A.; Adams, K.T.; Linehan, W.M.; Pacak, K. High frequency of SDHB germline mutations in patients with malignant catecholamine-producing paragangliomas: Implications for genetic testing. J. Clin. Endocrinol. Metab. 2006, 91, 4505–4509. [Google Scholar] [CrossRef]
- Allgaier, J.; Mulansky, L.; Draelos, R.; Pryss, R. How does the model make predictions? A systematic literature review on the explainability power of machine learning in healthcare. Artif. Intell. Med. 2023, 143, 102616. [Google Scholar] [CrossRef]
- Lundberg, S.M.; Lee, S.I. A Unified Approach to Interpreting Model Predictions. In Proceedings of the 31st International Conference on Neural Information Processing Systems, Long Beach CA, Long Beach, CA, USA, 4–9 December 2017; Volume 30. Advances in Neural Information Processing Systems. [Google Scholar]
- Selvaraju, R.R.; Cogswell, M.; Das, A.; Vedantam, R.; Parikh, D.; Batra, D. Grad-CAM: Visual Explanations from Deep Networks via Gradient-Based Localization. In Proceedings of the IEEE International Conference on Computer Vision (ICCV), Venice, Italy, 22–29 October 2017; pp. 618–626. [Google Scholar]
- Alabi, R.O.; Elmusrati, M.; Leivo, I.; Almangush, A.; Mäkitie, A.A. Machine learning explainability in nasopharyngeal cancer survival using LIME and SHAP. Sci. Rep. 2023, 13, 8984. [Google Scholar] [CrossRef]
- Ribeiro, M.T.; Singh, S.; Guestrin, C. “Why should I trust you?” Explaining the predictions of any classifier. In Proceedings of the 22nd ACM SIGKDD International Conference on Knowledge Discovery and Data Mining, San Francisco, CA, USA, 13–17 August 2016; pp. 1135–1144. [Google Scholar]
- Jansen, T.; Geleijnse, G.; Van Maaren, M.; Hendriks, M.P.; Ten Teije, A.; Moncada-Torres, A. Machine learning explainability in breast cancer survival. In Digital Personalized Health and Medicine; IOS Press: Amsterdam, The Netherlands, 2020; pp. 307–311. [Google Scholar]
- Pathan, R.K.; Shorna, I.J.; Hossain, M.S.; Khandaker, M.U.; Almohammed, H.I.; Hamd, Z.Y. The efficacy of machine learning models in lung cancer risk prediction with explainability. PLoS ONE 2024, 19, e0305035. [Google Scholar] [CrossRef]
- Gilpin, L.; Bau, D.; Yuan, B.; Bajwa, A.; Specter, M.; Kagal, L. Explaining explanations: An overview of interpretability of machine learning. In Proceedings of the 2018 IEEE 5th International Conference on Data Science and Advanced Analytics (DSAA), Turin, Italy, 1–3 October 2018; pp. 80–89. [Google Scholar]
- Linardatos, P.; Papastefanopoulos, V.; Kotsiantis, S. Explainable AI: A review of machine learning interpretability methods. Entropy 2020, 23, 18. [Google Scholar] [CrossRef]
- Friedman, J.H. Greedy function approximation: A gradient boosting machine. Ann. Stat. 2001, 29, 1189–1232. [Google Scholar] [CrossRef]
- Louppe, G.; Wehenkel, L.; Sutera, A.; Geurts, P. Understanding Variable Importances in Forests of Randomized Trees. In Proceedings of the 27th International Conference on Neural Information Processing Systems, Lake Tahoe, NV, USA, 5–10 December 2013; Volume 26. Advances in Neural Information Processing Systems. [Google Scholar]
- Goldstein, A.; Kapelner, A.; Karaletsos, T.; Horsch, C.; Newton, M.A. Peeking inside the black box: Visualizing statistical learning with plots of individual conditional expectation. J. Comput. Graph. Stat. 2015, 24, 44–65. [Google Scholar] [CrossRef]
- Burkart, N.; Huber, M.F. A survey on the explainability of supervised machine learning. J. Artif. Intell. Res. 2021, 70, 245–317. [Google Scholar] [CrossRef]
- Peitzsch, M.; Prejbisz, A.; Kroiß, M.; Beuschlein, F.; Arlt, W.; Januszewicz, A.; Siegert, G.; Eisenhofer, G. Analysis of plasma 3-methoxytyramine, normetanephrine and metanephrine by ultraperformance liquid chromatography-tandem mass spectrometry: Utility for diagnosis of dopamine-producing metastatic phaeochromocytoma. Ann. Clin. Biochem. 2013, 50, 147–155. [Google Scholar] [CrossRef]
- Snezhkina, A.; Pavlov, V.; Dmitriev, A.; Melnikova, N.; Kudryavtseva, A. Potential Biomarkers of Metastasizing Paragangliomas and Pheochromocytomas. Life 2021, 11, 1179. [Google Scholar] [CrossRef]
- Martinelli, S.; Amore, F.; Canu, L.; Maggi, M.; Rapizzi, E. Tumour microenvironment in pheochromocytoma and paraganglioma. Front. Endocrinol. 2023, 14, 1137456. [Google Scholar] [CrossRef]
- Liu, C.; Zhou, D.; Yang, K.; Xu, N.; Peng, J.; Zhu, Z. Research progress on the pathogenesis of the SDHB mutation and related diseases. Biomed. Pharmacother. 2023, 167, 115500. [Google Scholar] [CrossRef]
- Taïeb, D.; Nölting, S.; Perrier, N.D.; Fassnacht, M.; Carrasquillo, J.A.; Grossman, A.B.; Clifton-Bligh, R.; Wanna, G.B.; Schwam, Z.G.; Amar, L.; et al. Management of phaeochromocytoma and paraganglioma in patients with germline SDHB pathogenic variants: An international expert consensus statement. Nat. Rev. Endocrinol. 2024, 20, 168–184. [Google Scholar] [CrossRef]
| Feature Name | Type | Description |
|---|---|---|
| Patient ID | Integer | Unique identifier assigned to each patient |
| Sex | Categorical | Patient’s gender (Male/Female) |
| Age | Float | Age of the patient at the time of first tumor diagnosis (in years) |
| Plasma NMN | Float | Concentration of Normetanephrine (NMN) in plasma (pg/mL) |
| Plasma MN | Float | Concentration of Metanephrine (MN) in plasma (pg/mL) |
| Plasma MTY | Float | Concentration of Methoxytyramine (MTY) in plasma (pg/mL) |
| Previous history | Categorical | Indicates whether the patient had previous PPGL diagnoses (Yes/No) |
| Location | Categorical | Tumor location: adrenal or extra-adrenal |
| Presence of SDHB | Categorical | Indicates presence of SDHB gene mutation (Positive/Negative/Not tested) |
| Tumor category | Categorical | Tumor type: Solitary (S), Bilateral (B), or Multifocal (M) |
| Spherical volume | Float | Estimated spherical volume of the tumor (cm3) |
| Metastatic | Categorical | Indicates whether metastasis is present (target variable) (Yes/No) |
| Model | Accuracy | Precision | Recall | F1-Score | AUC | |||||
|---|---|---|---|---|---|---|---|---|---|---|
| Mean | Std | Mean | Std | Mean | Std | Mean | Std | Mean | Std | |
| RandomForest | 0.963 | 0.014 | 0.965 | 0.013 | 0.963 | 0.014 | 0.963 | 0.014 | 0.963 | 0.014 |
| XGBoost | 0.953 * | 0.016 | 0.956 * | 0.014 | 0.953 * | 0.016 | 0.953 * | 0.016 | 0.954 * | 0.016 |
| DecisionTree | 0.935 ** | 0.025 | 0.940 ** | 0.022 | 0.935 ** | 0.025 | 0.935 ** | 0.026 | 0.935 ** | 0.027 |
| SVC_rbf | 0.919 ** | 0.031 | 0.921 ** | 0.031 | 0.919 ** | 0.031 | 0.919 ** | 0.031 | 0.919 ** | 0.031 |
| SVC_poly | 0.876 ** | 0.032 | 0.877 ** | 0.032 | 0.876 ** | 0.032 | 0.876 ** | 0.032 | 0.876 ** | 0.033 |
| KNN | 0.869 ** | 0.043 | 0.871 ** | 0.042 | 0.869 ** | 0.043 | 0.869 ** | 0.043 | 0.868 ** | 0.043 |
| MLP | 0.856 ** | 0.024 | 0.857 ** | 0.024 | 0.856 ** | 0.024 | 0.855 ** | 0.024 | 0.853 ** | 0.028 |
| LogisticRegression | 0.850 ** | 0.029 | 0.852 ** | 0.030 | 0.850 ** | 0.029 | 0.850 ** | 0.029 | 0.849 ** | 0.031 |
| SVC_linear | 0.847 ** | 0.018 | 0.849 ** | 0.017 | 0.847 ** | 0.018 | 0.847 ** | 0.018 | 0.846 ** | 0.018 |
| BernoulliNB | 0.829 ** | 0.032 | 0.830 ** | 0.032 | 0.829 ** | 0.032 | 0.829 ** | 0.032 | 0.827 ** | 0.034 |
| Feature | Chi-Square | Mutual Information | Information Gain |
|---|---|---|---|
| Previous history | 1.000 | 1.000 | 1.000 |
| Presence of SDHB | 0.739 | 0.563 | 0.574 |
| Location | 0.587 | 0.607 | 0.633 |
| Tumor category | 0.086 | 0.014 | 0.084 |
| Spherical volume | 0.072 | 0.586 | 0.251 |
| Plasma MTY | 0.069 | 0.594 | 0.126 |
| Age Group | 0.024 | 0.000 | 0.000 |
| Sex | 0.021 | 0.026 | 0.020 |
| Plasma MN | 0.015 | 0.243 | 0.093 |
| Plasma NMN | 0.010 | 0.051 | 0.073 |
| Age | 0.000 | 0.117 | 0.100 |
| Model | Accuracy | Precision | Recall | F1-Score | AUC | |||||
|---|---|---|---|---|---|---|---|---|---|---|
| Mean | Std | Mean | Std | Mean | Std | Mean | Std | Mean | Std | |
| RandomForest | 0.835 | 0.030 | 0.844 | 0.032 | 0.835 | 0.030 | 0.834 | 0.031 | 0.834 | 0.033 |
| BernoulliNB | 0.835 | 0.030 | 0.836 | 0.030 | 0.835 | 0.030 | 0.835 | 0.030 | 0.834 | 0.031 |
| LogisticRegression | 0.835 | 0.030 | 0.836 | 0.030 | 0.835 | 0.030 | 0.835 | 0.030 | 0.834 | 0.031 |
| SVC_poly | 0.835 | 0.030 | 0.836 | 0.030 | 0.835 | 0.030 | 0.835 | 0.030 | 0.834 | 0.031 |
| MLP | 0.835 | 0.031 | 0.835 | 0.031 | 0.835 | 0.031 | 0.834 | 0.031 | 0.833 | 0.032 |
| DecisionTree | 0.830 | 0.023 | 0.838 | 0.023 | 0.830 | 0.023 | 0.829 | 0.023 | 0.829 | 0.024 |
| SVC_rbf | 0.829 | 0.034 | 0.839 | 0.036 | 0.829 | 0.034 | 0.829 | 0.034 | 0.831 | 0.036 |
| XGBoost | 0.827 | 0.023 | 0.835 | 0.024 | 0.827 | 0.023 | 0.827 | 0.024 | 0.828 | 0.024 |
| SVC_linear | 0.826 | 0.035 | 0.828 | 0.034 | 0.826 | 0.035 | 0.826 | 0.035 | 0.824 | 0.036 |
| KNN | 0.647 ** | 0.053 | 0.780 ** | 0.033 | 0.647 ** | 0.053 | 0.600 ** | 0.059 | 0.647 ** | 0.029 |
Disclaimer/Publisher’s Note: The statements, opinions and data contained in all publications are solely those of the individual author(s) and contributor(s) and not of MDPI and/or the editor(s). MDPI and/or the editor(s) disclaim responsibility for any injury to people or property resulting from any ideas, methods, instructions or products referred to in the content. |
© 2025 by the authors. Licensee MDPI, Basel, Switzerland. This article is an open access article distributed under the terms and conditions of the Creative Commons Attribution (CC BY) license (https://creativecommons.org/licenses/by/4.0/).
Share and Cite
García-Barceló, C.; Gil, D.; Tomás, D.; Bernabeu, D. Prediction of Metastasis in Paragangliomas and Pheochromocytomas Using Machine Learning Models: Explainability Challenges. Sensors 2025, 25, 4184. https://doi.org/10.3390/s25134184
García-Barceló C, Gil D, Tomás D, Bernabeu D. Prediction of Metastasis in Paragangliomas and Pheochromocytomas Using Machine Learning Models: Explainability Challenges. Sensors. 2025; 25(13):4184. https://doi.org/10.3390/s25134184
Chicago/Turabian StyleGarcía-Barceló, Carmen, David Gil, David Tomás, and David Bernabeu. 2025. "Prediction of Metastasis in Paragangliomas and Pheochromocytomas Using Machine Learning Models: Explainability Challenges" Sensors 25, no. 13: 4184. https://doi.org/10.3390/s25134184
APA StyleGarcía-Barceló, C., Gil, D., Tomás, D., & Bernabeu, D. (2025). Prediction of Metastasis in Paragangliomas and Pheochromocytomas Using Machine Learning Models: Explainability Challenges. Sensors, 25(13), 4184. https://doi.org/10.3390/s25134184


