4.1. Static Aerodynamic Characteristics
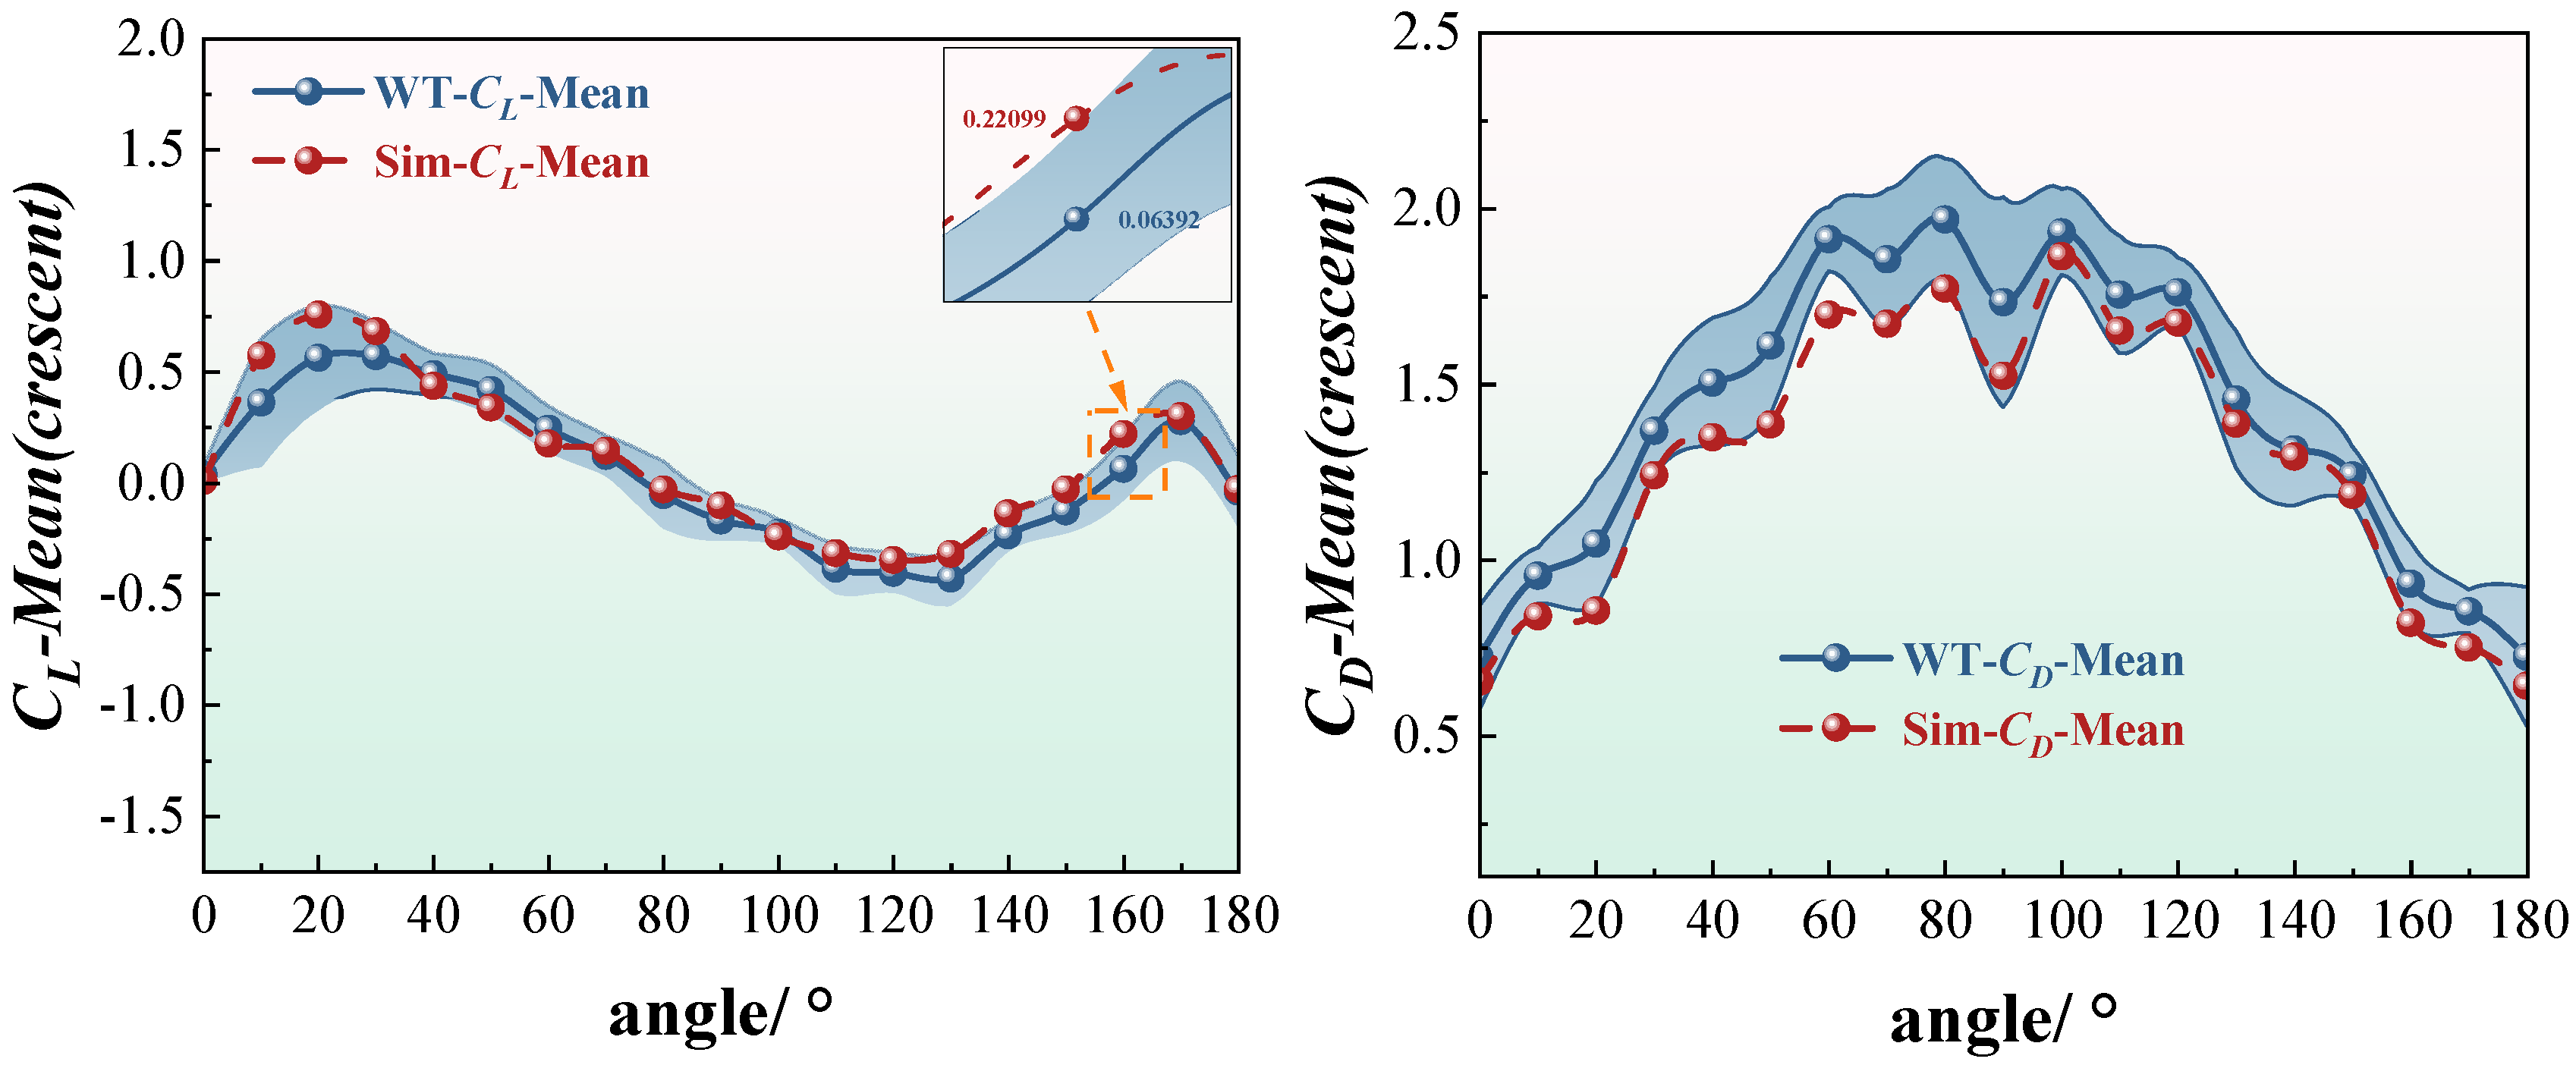
To investigate the static aerodynamic response of iced conductors at varying angles of attack, this study compares the distribution patterns of lift and drag coefficients for two typical ice accretion profiles: crescent-shaped and sector-shaped. The average aerodynamic coefficients obtained from wind tunnel tests (WT) and numerical simulations (Sim) over the angle-of-attack range from 0° to 180° are presented in
Figure 5 and
Figure 6. The results demonstrate good agreement between the experimental and simulated data across most angles of attack, thereby confirming the reliability of the numerical approach in reproducing the static aerodynamic behavior of iced conductors.
For the crescent-shaped iced conductors (
Figure 5), the lift coefficient exhibits a distinctly asymmetric distribution. The maximum lift occurs near an angle of attack of approximately 20°, with a peak value of
Cl ≈ 1.3. As the angle increases, the lift coefficient gradually decreases, approaching zero near 90°, and reaching negative peaks between 120° and 150°. This forms a characteristic asymmetric bimodal pattern, indicating a significant difference in aerodynamic force distribution between windward and leeward conditions for this ice accretion geometry. In contrast, the drag coefficient displays a nearly symmetric distribution. It increases gradually with the angle of attack, peaking between 80° and 100°, with a maximum value of approximately
Cd ≈ 2.1, followed by a slight decline at higher angles. The numerical simulation results closely replicate the experimental trends near both lift and drag peaks. The maximum relative error remains within 5%, demonstrating that the SST
k-
ω turbulence model performs robustly in capturing flow separation and stall characteristics associated with irregular ice-covered conductor surfaces.
For the sector-shaped iced conductors (
Figure 6), the variation in lift coefficient is more pronounced compared to the crescent-shaped case. The curve exhibits clear asymmetry, with a peak value slightly above 1.5 occurring near an angle of attack of approximately 90°. This sharp variation, accompanied by multiple local oscillation peaks, is attributed to the angular geometry of the sector shape. As the angle of attack changes, the flow separation point undergoes dynamic migration and sudden shifts along the surface. This unsteady behavior intensifies flow separation and reattachment, leading to strong shear layer oscillations and the formation of secondary vortex pairs. The resulting asymmetric wake vortex structures contribute to the observed local fluctuations in lift. In contrast, the drag coefficient is consistently higher than that of the crescent-shaped profile, reaching a maximum value of approximately 2.8 around a 100° angle of attack. This elevated drag is primarily due to the larger windward area and the wider, less streamlined trailing-edge wake of the sector-shaped geometry. Although the simulated peak values in the high-drag region were slightly lower than the experimental results, overall trends demonstrated strong agreement. The fitting accuracy is high across both low and high angles of attack, with the relative error remaining within acceptable limits.
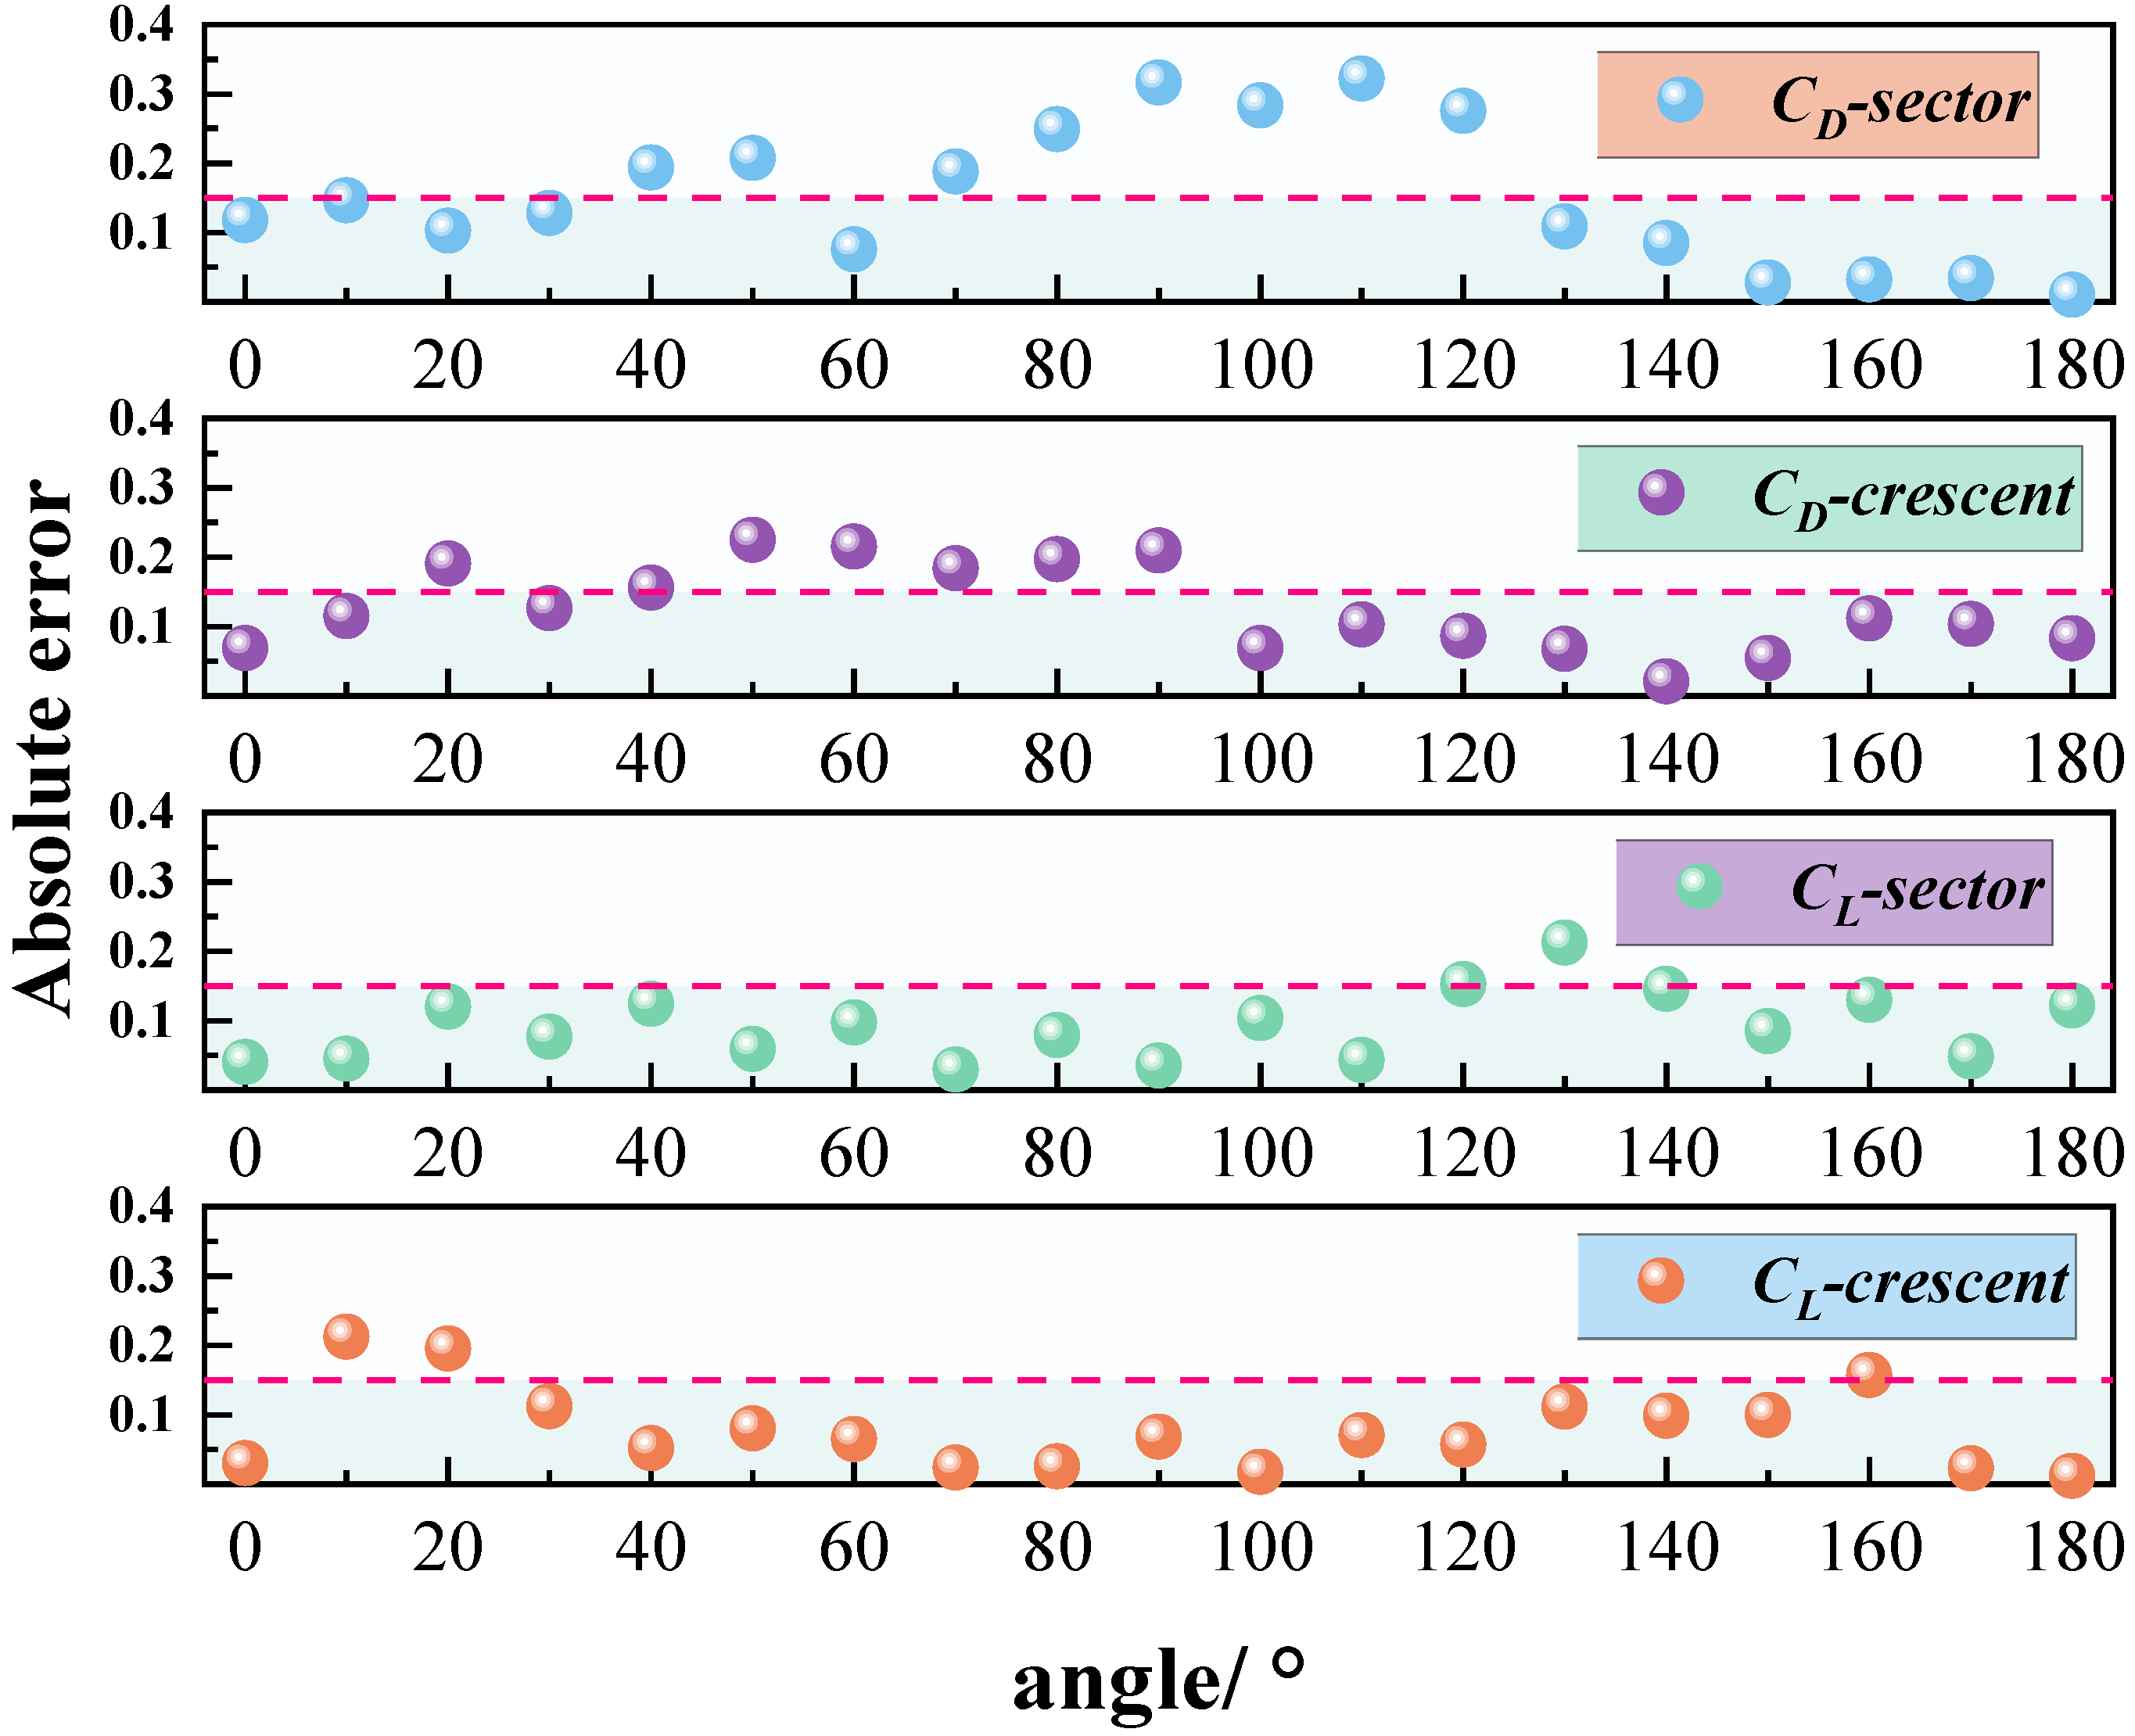
It is worth noting that the lift coefficient curves include embedded local error magnification plots, highlighting the discrepancies between experimental and numerical results at critical angles of attack. For the crescent-shaped iced conductors, the lift error at an angle of approximately 110° reaches around 0.22. For the sector-shaped conductors, the drag error at 140° is approximately 0.18. These deviations are primarily attributed to the influence of turbulence intensity and surface roughness in the wind tunnel tests. While the numerical simulations capture the overall aerodynamic trends well, certain local discrepancies remain. Analysis of
Figure 7 shows that, among the four typical conditions, the crescent-shaped conductors exhibit lower lift and drag errors compared to the sector-shaped ones. Notably, the lift coefficient errors for the crescent-shaped profile remain below 0.15 across most angles of attack, indicating strong consistency and simulation stability. In contrast, the sector-shaped conductors show larger drag coefficient errors, particularly in the 80–100° range, where the error exceeds 0.25 and exhibits significant fluctuations. This increased error is linked to the complex tail vortex structures of the sector shape, characterized by unsteady separation and asymmetric vortex interactions, which reduce simulation accuracy. Furthermore, the error curves remain relatively stable at low and high angles of attack, while the largest deviations occur in the mid-range angles. This region corresponds to the aerodynamic transition zone, where flow separation and reattachment are most dynamic. These findings suggest that future research should focus on improving the numerical accuracy and turbulence model adaptability in capturing separation behavior within this critical angle range.
Both crescent-shaped and sector-shaped iced conductors exhibit pronounced angle-of-attack sensitivity and nonlinear aerodynamic response characteristics. Among them, the sector-shaped conductors demonstrate a higher risk of aerodynamic instability and larger peak aerodynamic forces, which warrants particular attention in the design of wind-induced vibration mitigation measures. The numerical simulations successfully captured the overall experimental trends across the full range of angles of attack. Notably, the crescent-shaped profile shows better performance in reproducing peak aerodynamic forces and maintaining low error margins. This validates the reliability of the simulation approach and provides a solid data foundation for subsequent dynamic response and stability analyses.
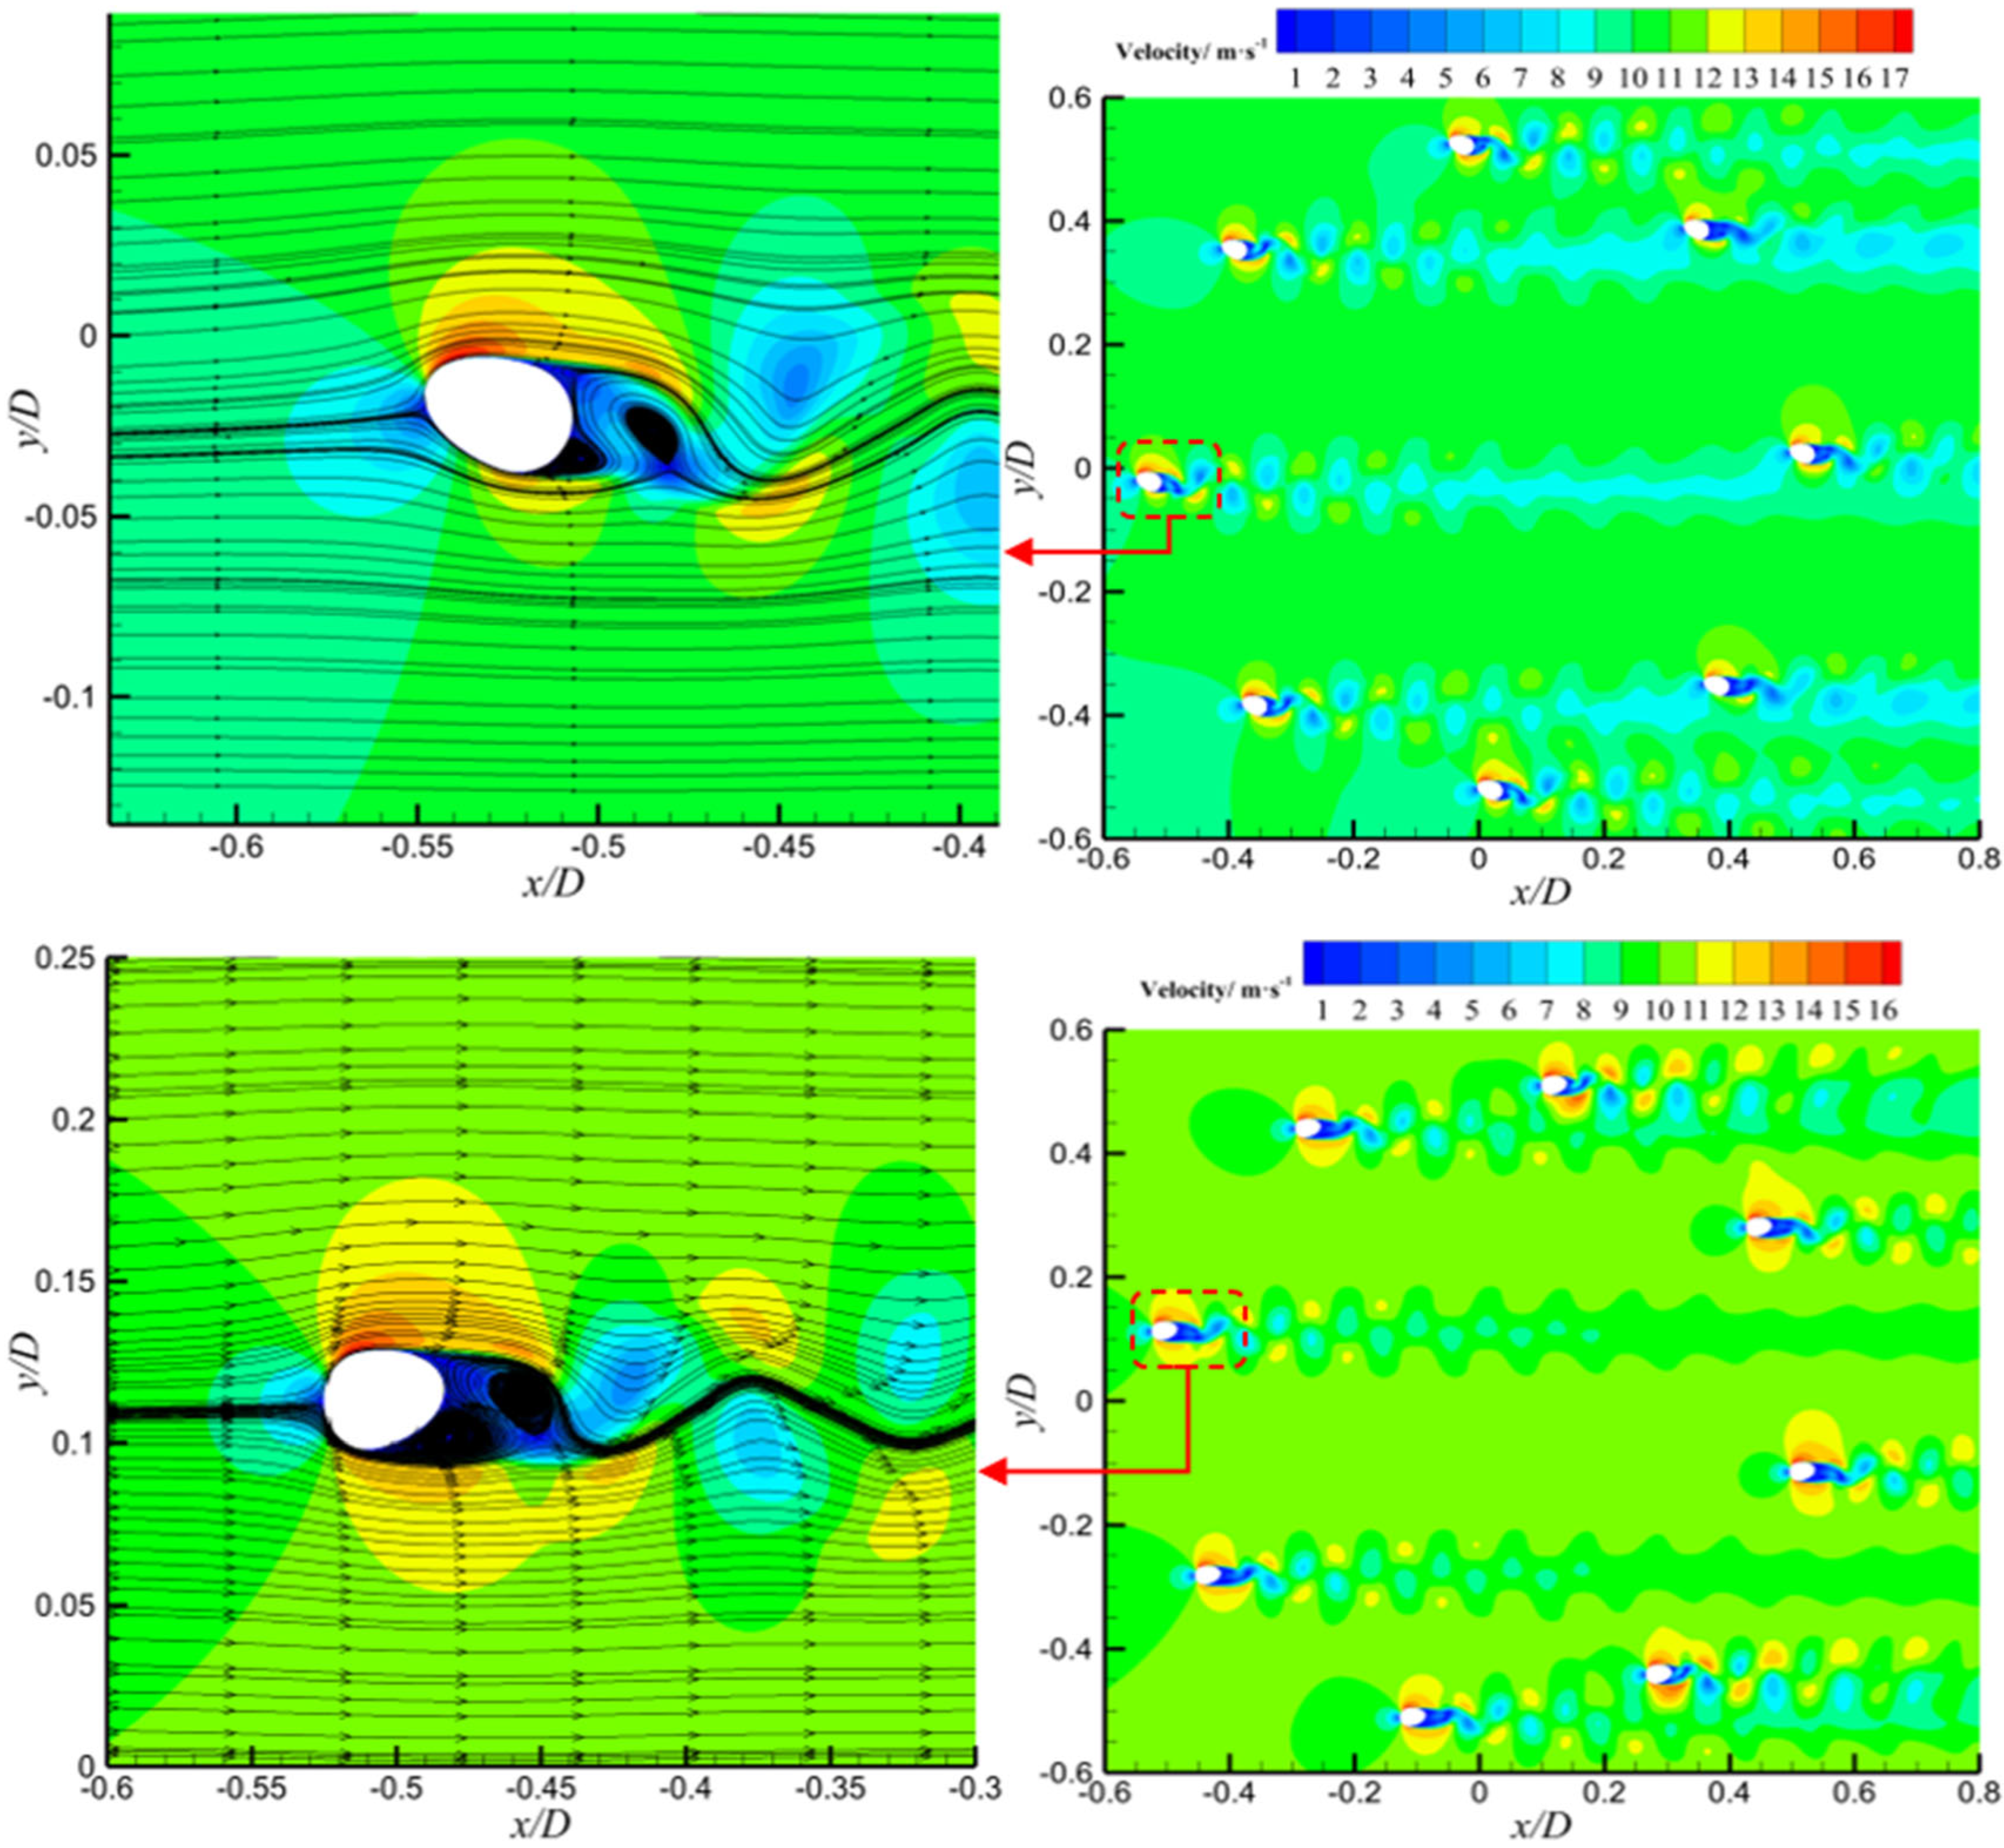
Velocity contour plots were analyzed to investigate the bimodal behavior observed in the lift coefficient curve of crescent-shaped iced conductors. As shown in
Figure 8, at an angle of attack of 20°, a prominent velocity gradient region is observed near the leading edge, indicating the onset of flow separation. The resulting shear layer extends downstream and develops into a periodic vortex structure. The wake region exhibits alternating bands of high and low velocity, characteristic of a classical Kármán vortex street. The lift spikes observed at this angle were likely caused by transient low-pressure regions forming on the leeward side during vortex shedding. As the vortex core is periodically shed from the conductor’s leeward surface, local asymmetry in the velocity field intensifies, resulting in a temporary increase in lift. At an angle of attack of 170°, the flow field exhibits strong asymmetry. The velocity distribution near the leading edge indicates reverse flow separation. In this case, the velocity gradient in the wake weakens, and the vortex structures appear more diffused. The second lift spike is believed to arise from unsteady separation induced by reverse flow conditions. When the incoming flow direction is nearly opposite to the conductor orientation, a transient high-velocity region forms near the trailing edge. This creates a strong velocity contrast with the upstream low-speed zone, thereby triggering abrupt lift fluctuations.
The single-peak behavior of the lift coefficient observed in sector-shaped iced conductors is closely associated with distinct flow separation features at an angle of attack of 90°. As shown in
Figure 9, a pronounced velocity gradient region appears near the leading edge, indicating the onset of flow separation. The separated shear layer extends downstream, and the velocity distribution in the wake exhibits significant asymmetry. A broad low-velocity zone (velocity below 5 m/s) forms on the leeward side, while the windward side retains higher flow velocities in the range of 10–15 m/s. This asymmetric velocity field leads to a substantial pressure drop on the leeward side, resulting in a transient lift enhancement. At 90° angle of attack, the sharp angular geometry of the sector-shaped ice accretion causes strong interference with the incoming flow, resulting in a sudden displacement of the separation point from the leading edge to the midsection of the ice wing. This shift initiates shear layer oscillations and the formation of a localized recirculation zone with velocities below 3 m/s. The intensified velocity difference between windward and leeward sides further amplifies the pressure differential. Velocity contour plots of the wake region revealed intermittent formation of vortex cores on the leeward side, characterized by sharp velocity gradients. The asymmetric evolution of these vortex cores contributes to increased amplitudes in instantaneous lift fluctuations. From the above analysis, it can be concluded that the lift spike at 90° for sector-shaped iced conductors is primarily driven by geometry-induced separation instability and the resulting unsteady, asymmetric vortex structure in the wake.
The primary validation of the CFD simulations, as presented in
Section 3.1, focused on comparing the computed static aerodynamic coefficients—lift, drag, and moment—with corresponding wind tunnel measurements. The results show that good agreement was achieved between the numerical and experimental results for integrated aerodynamic forces, confirming the reliability of the CFD approach for evaluating the key aerodynamic parameters relevant to galloping analysis. Direct velocity field measurements (e.g., using Particle Image Velocimetry or hot-wire anemometry) were not conducted in this study due to experimental setup constraints and the primary focus on force-based validation. Nonetheless, we acknowledge the importance of detailed flow field comparisons for comprehensively verifying simulated flow structures. The recent literature demonstrates the value of advanced flow visualization and measurement techniques in capturing local flow features with high spatial and temporal resolution [
34,
35]. Incorporating such methods into future studies will be essential for further validating the detailed dynamics of unsteady flow phenomena predicted by numerical simulations.
4.2. Dynamic Aerodynamic Response
The dynamic aerodynamic characteristics of crescent-shaped and sector-shaped iced eight-bundled conductors over the full angle-of-attack range (0–180°) were investigated through a combined analysis using fourth-order Fourier fitting and harmonic energy spectrum analysis. This approach reveals the distinct regulatory effects of ice geometry on flow separation and vortex shedding behavior. By quantifying the fitting accuracy, harmonic energy distribution, and its relationship with transient flow structures, a multiscale analytical framework is established. This framework captures the nonlinear aerodynamic responses, frequency-domain energy transfer mechanisms, and flow field evolution associated with different ice accretion profiles. The findings offer a new perspective for the theoretical modeling of galloping in iced conductors and contribute to a deeper understanding of the aerodynamic instability mechanisms involved.
As shown in
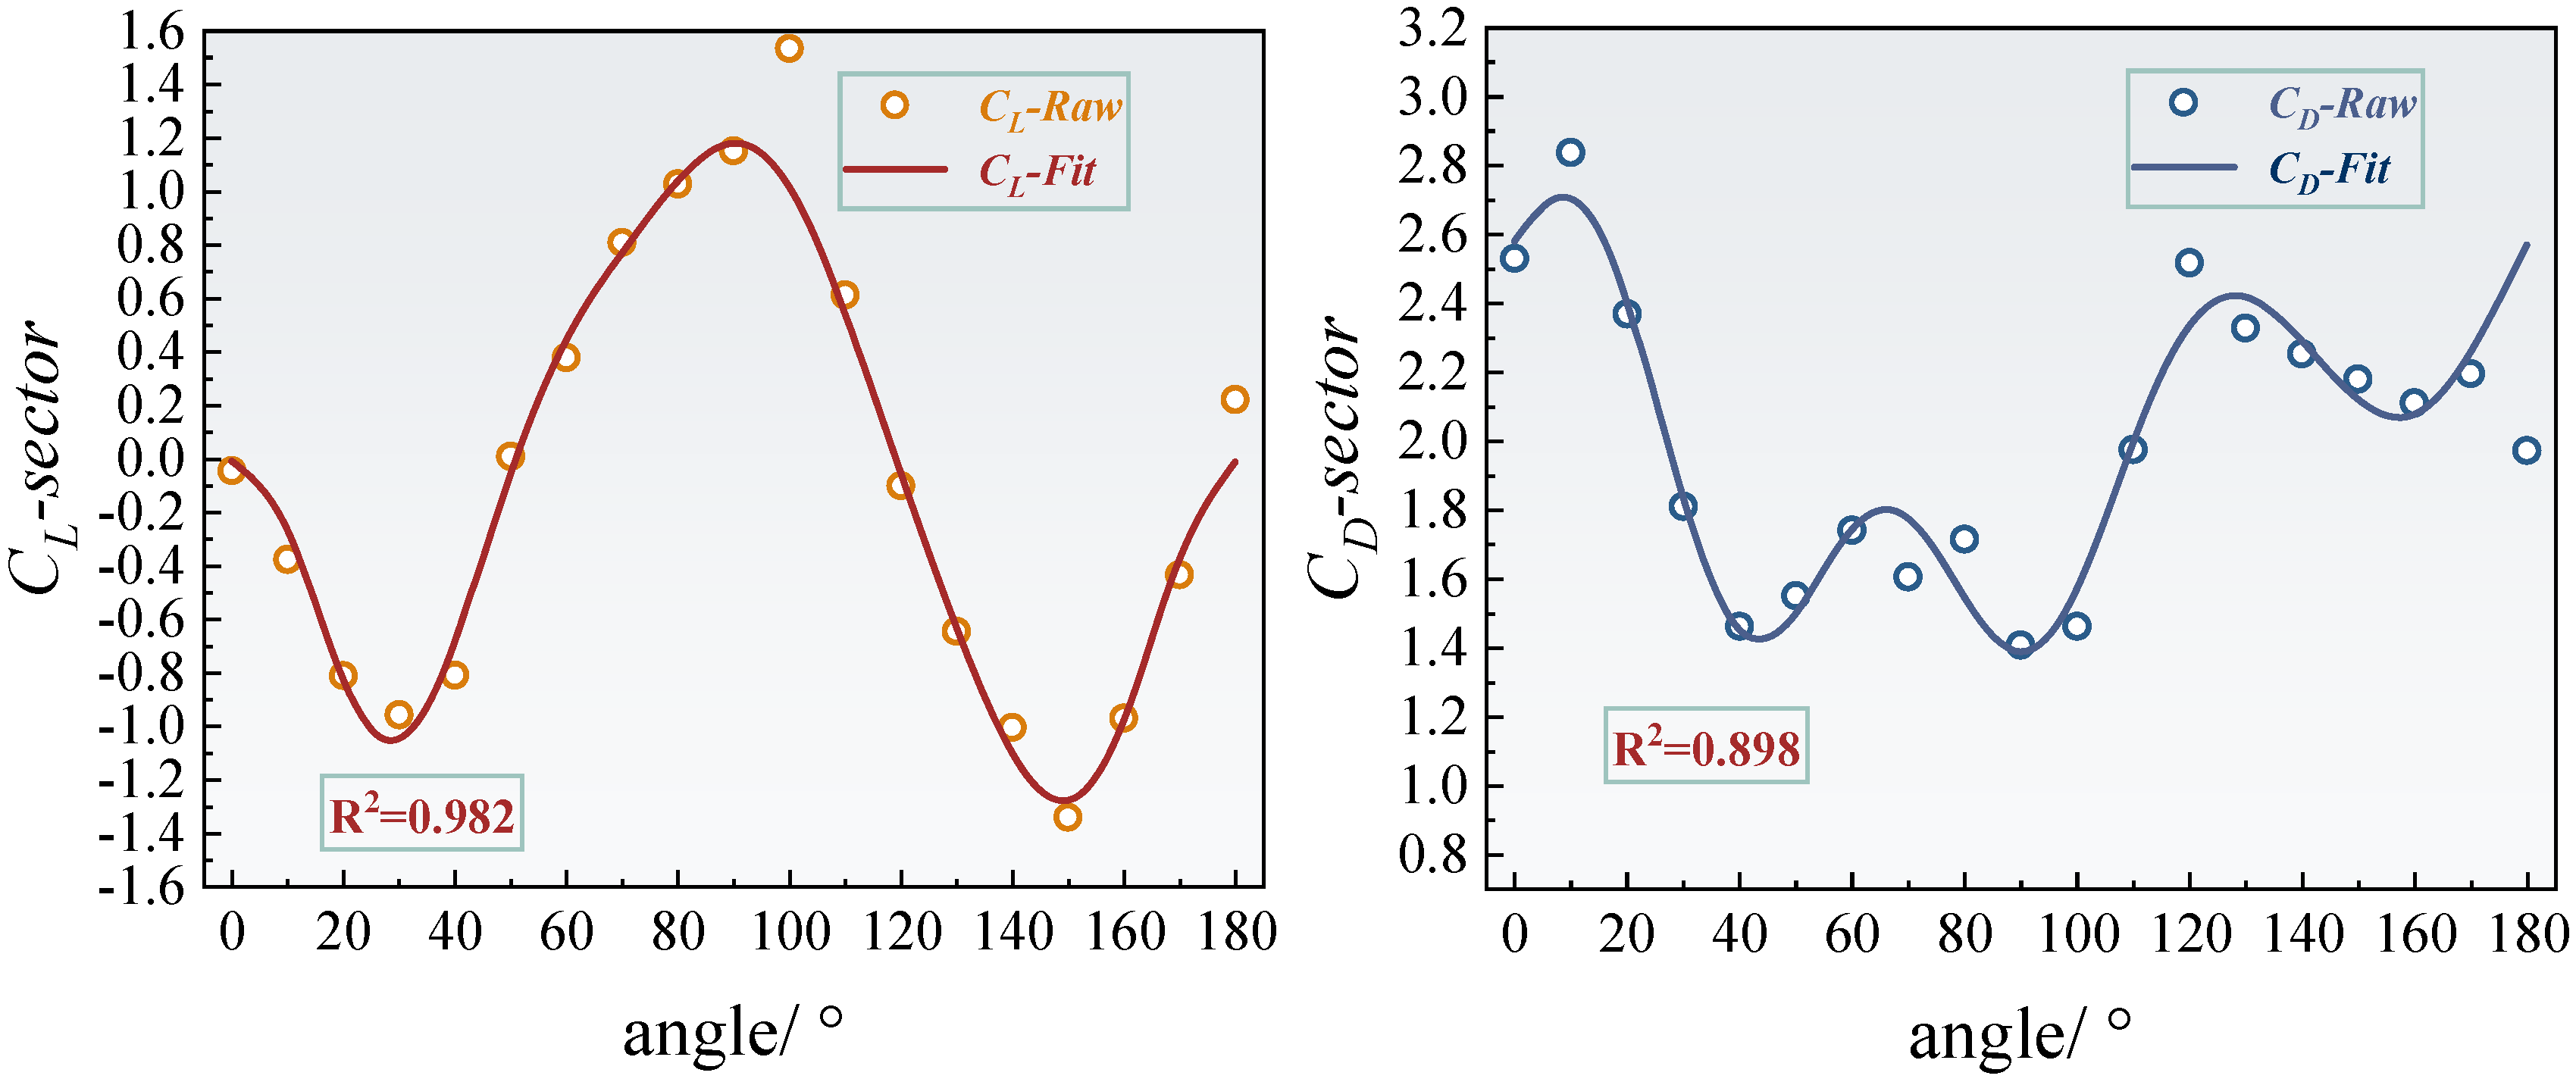
Figure 10 and
Figure 11, the fourth-order Fourier fitting results demonstrate that the lift and drag coefficients of the crescent-shaped iced conductors achieve goodness-of-fit values of 0.963 and 0.974, respectively. Their dynamic responses exhibit typical quasi-periodic characteristics. Specifically, the lift coefficient reaches a local minimum of 0.24 at an angle of attack of 60°, and a pronounced negative peak of −0.44 at 120°, reflecting nonlinear fluctuations closely related to asymmetric flow separation near the leading edge of the crescent-shaped ice.
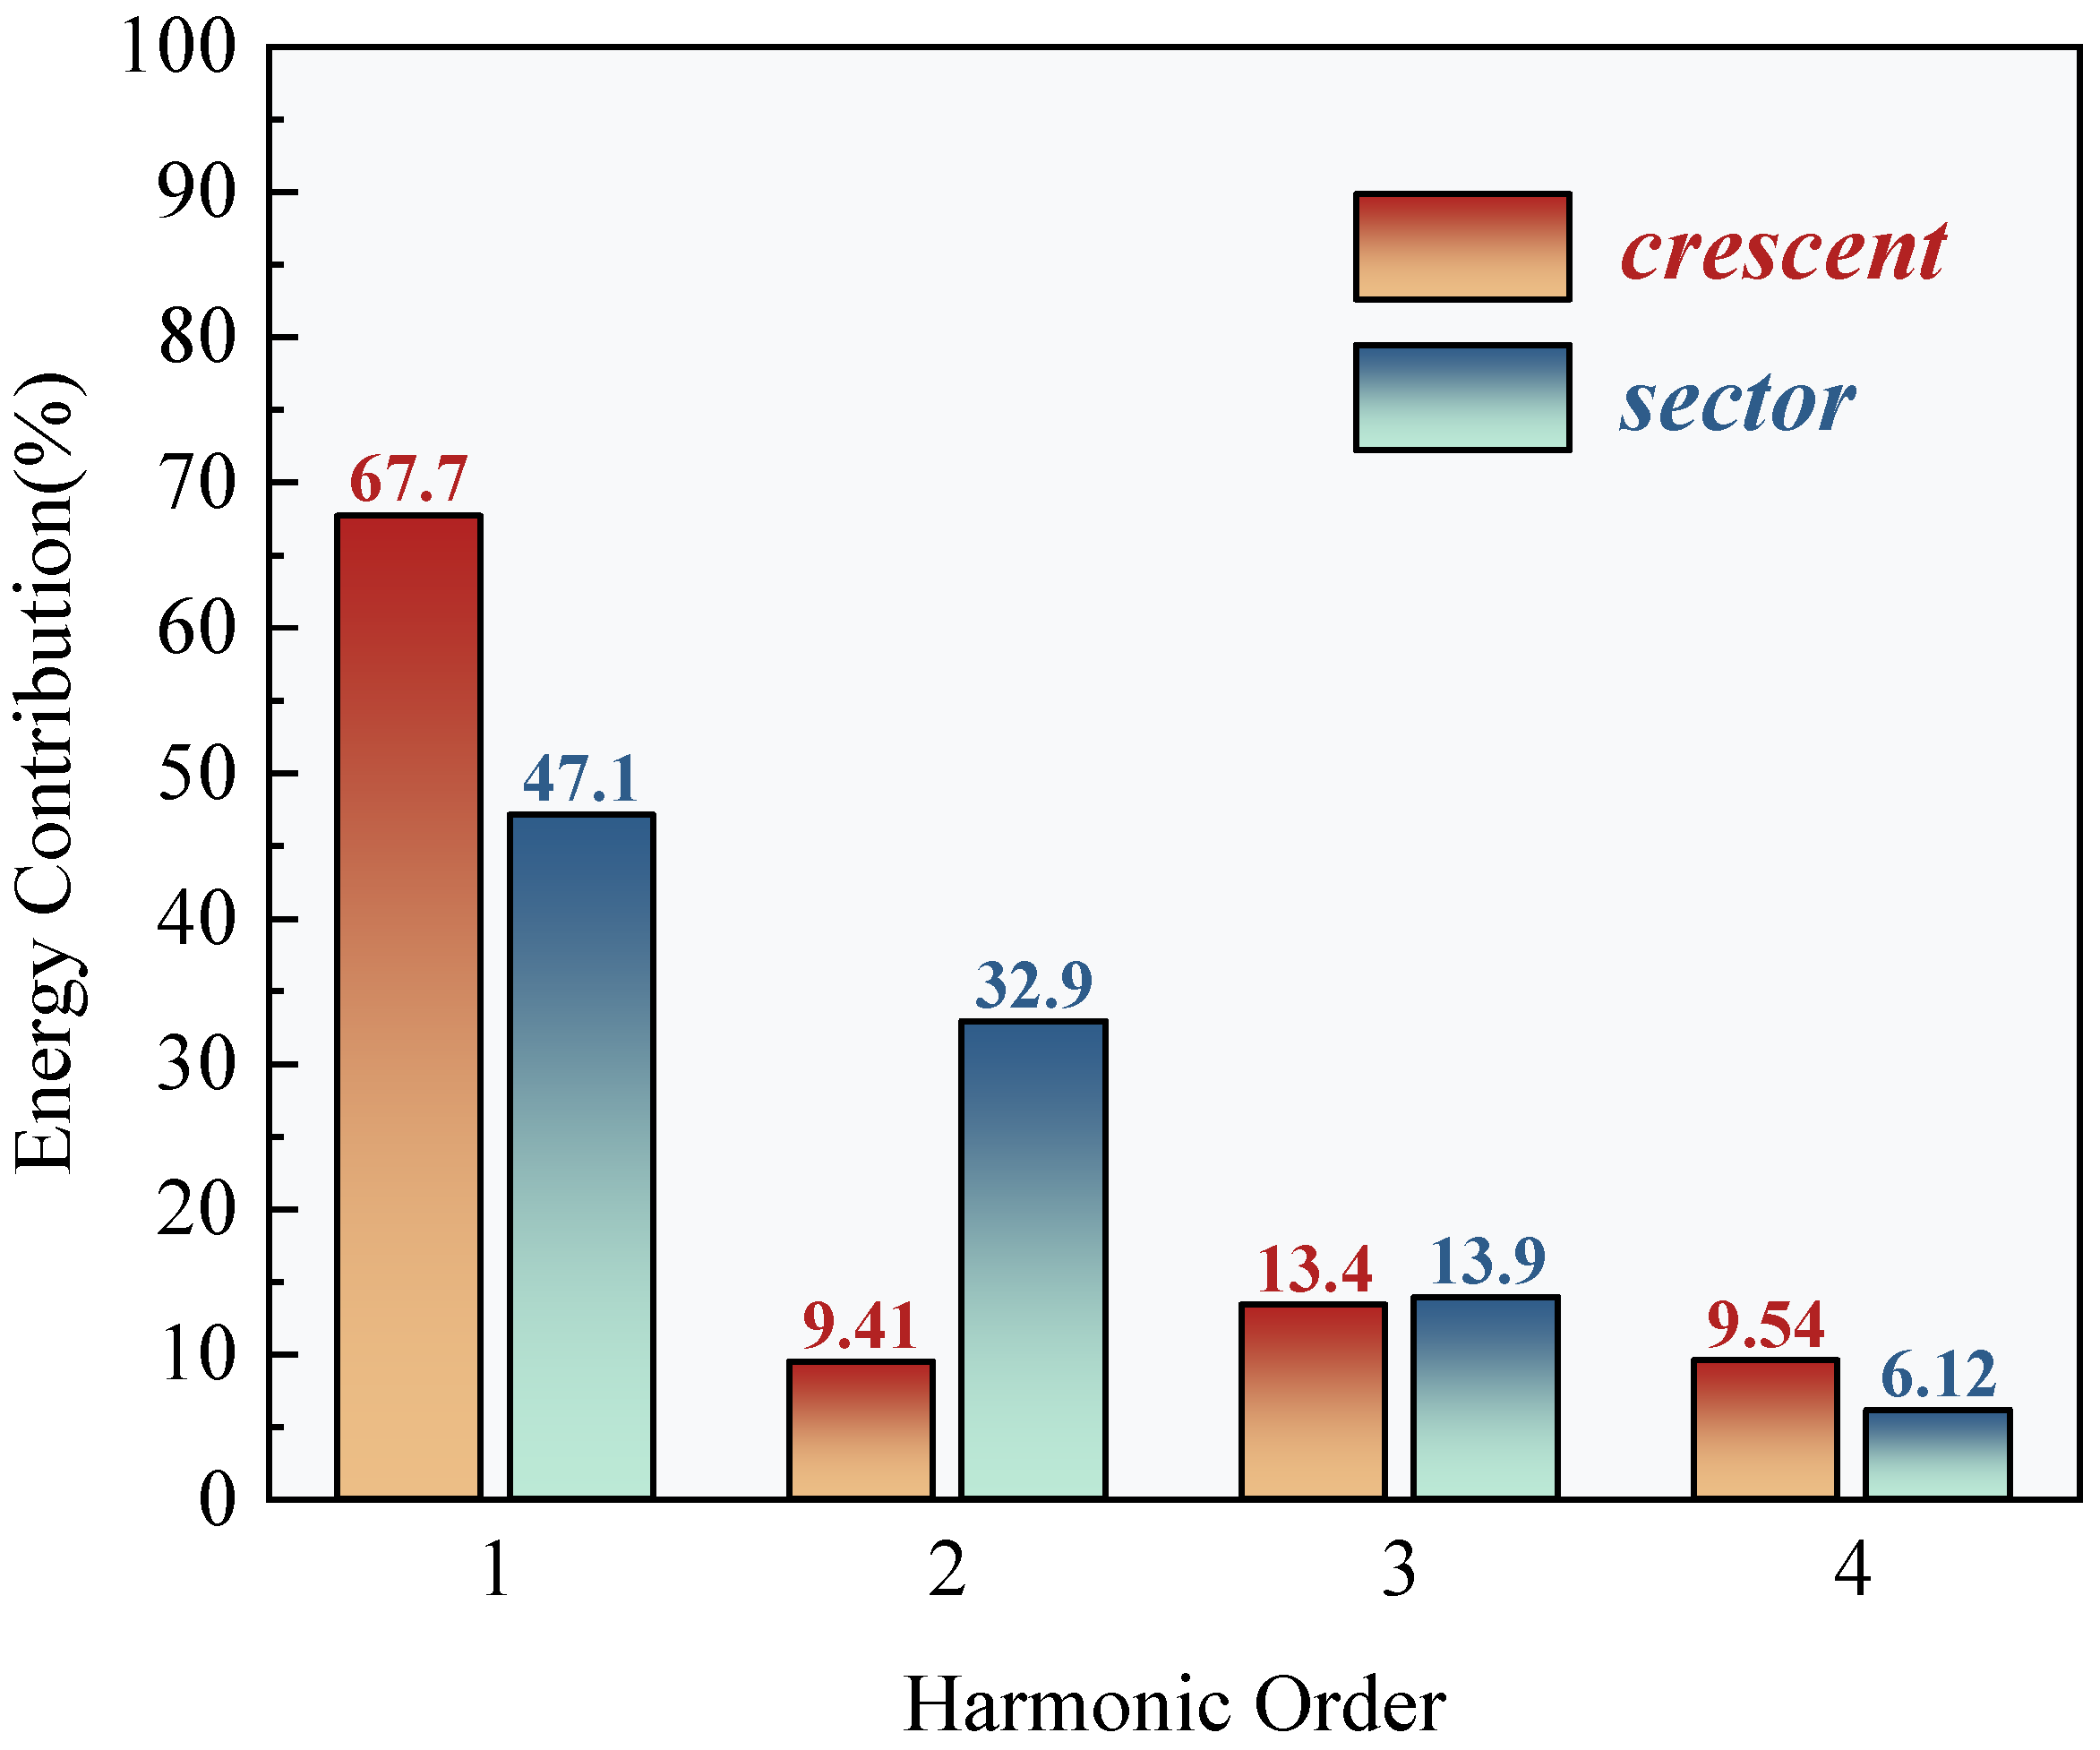
Figure 12 further reveals that the dynamic response of the crescent-shaped conductors is predominantly governed by the first-order harmonic, which accounts for 67.7% of the total spectral energy. The contributions from the second- and third-order harmonics are significantly smaller, at 9.41% and 13.4%, respectively. This strong dominance of the first harmonic suggests a relatively singular and stable vortex shedding frequency, indicative of a quasi-steady Kármán vortex street. Such concentrated spectral energy at a single dominant frequency results in more predictable and stable aerodynamic forcing. Consequently, the galloping tendency is reduced and can often be mitigated effectively using conventional damping strategies designed for narrow-band excitation. In contrast, sector-shaped iced conductors exhibited a slightly higher goodness-of-fit for the lift coefficient (0.982), but significantly lower for the drag coefficient (0.898). This discrepancy suggests increased flow instability in certain regions, likely caused by secondary separation or asymmetric vortex merging phenomena. The harmonic energy spectrum supports this interpretation: the second-order harmonic contribution rises markedly to 32.9%, and the third-order component reaches 13.9%. This broadband energy distribution is directly linked to the dynamic migration of the separation point, a behavior induced by the prismatic geometry of the sector-shaped ice. In such cases, the separation point can abruptly shift from the leading to the trailing edge, generating shear layer oscillations and secondary vortex pairs. These interactions triggered multi-frequency aerodynamic excitations. The dispersion of energy across multiple harmonics indicates a more complex and unstable aerodynamic forcing environment. This complexity poses greater challenges for galloping prediction and control, necessitating broader or multi-band mitigation strategies to effectively disrupt energy transfer pathways and suppress aerodynamic instability.
Harmonic energy spectrum analysis quantitatively assessed how ice accretion geometry modulates energy distribution in the frequency domain. The first-order harmonic energy contribution for the crescent-shaped iced conductors is significantly higher than that of the sector-shaped case. In contrast, the second-order harmonic energy in the sector-shaped configuration is approximately 3.5 times greater than that of the crescent-shaped profile. The physical origin of these differences lies in the distinct flow field evolution mechanisms associated with each ice shape. The streamlined leading edge of the crescent-shaped conductors promotes stabilization of the separation point near the trailing edge. This leads to the formation of a dominant single vortex shedding mode, where energy input is primarily concentrated at a single frequency, corresponding to the first harmonic. In contrast, the angular geometry of the sector-shaped ice induces abrupt shifts in the separation point with varying angles of attack. The resulting asymmetrical interactions between unsteady shear layer oscillations and secondary vortex pair formations stimulate a stronger second-order harmonic response. Moreover, the dynamic merging and splitting of vortex cores further excite third-order harmonic components, contributing to a broadband energy distribution. This mechanism introduces complex, multi-frequency aerodynamic excitation, characteristic of a more unstable and less predictable flow regime.
The synergistic analysis reveals a strong coupling between the frequency-domain characteristics of aerodynamic forces and underlying flow field instability mechanisms, which directly influences galloping susceptibility. For crescent-shaped icing, the dominance of a single frequency component indicates a more coherent and stable aerodynamic excitation. This concentrated energy input can typically be mitigated effectively using conventional damping strategies, which are designed to dissipate energy within a narrow frequency range, thereby improving galloping stability. In contrast, the broadband energy distribution observed in sector-shaped icing—marked by significant contributions from multiple harmonic components—indicates a more complex and potentially unstable aerodynamic response. This condition necessitates the use of multiband tuning or broadband damping strategies to effectively disrupt energy transfer across various frequencies. The presence of multiple excitation modes complicates the prediction and effective mitigation of galloping behavior. Furthermore, the substantial increase in second-order harmonic energy in sector-shaped conductors suggests a possible correlation with the occurrence of negative aerodynamic damping, as described by the Den Hartog criterion. However, a precise quantification of this relationship requires further investigation in conjunction with dynamic stability analysis.
4.3. Stability and Flow Field Mechanisms
To further assess the aerodynamic stability of iced conductors across different angles of attack, the distribution of the Den Hartog coefficient was calculated based on both wind tunnel test results and numerical simulations. A comparative analysis was then conducted using the experimental data. The Den Hartog coefficients for crescent-shaped and sector-shaped iced conductors over the 0–180° angle-of-attack range are presented in
Figure 13. In the figure, solid lines represent the wind tunnel measurements, dashed lines denote the simulation results, and five-pointed stars indicate the error between the two datasets. To facilitate interpretation, a horizontal dashed line is drawn at
H = 0 to demarcate the stability threshold. Regions where the Den Hartog coefficient is negative are labeled as the “Dangerous Zone” (indicating negative aerodynamic damping and potential galloping risk), while regions with positive coefficients are labeled as the “Safe Zone” (indicating positive damping and aerodynamic stability). This visual classification helps identify critical working conditions where galloping is more likely to occur.
For the crescent-shaped iced conductors, the Den Hartog coefficient remains negative between angles of attack of 20° and 70°, reaching a minimum near −3.2 at approximately 40°, indicating a high risk of aerodynamic self-excited galloping within this range. The coefficient becomes positive and stabilizes at higher values from 80° to 130°, suggesting a lower susceptibility to wind-induced vibration in this region. Overall, the experimental and numerical curves exhibit strong agreement, with the maximum discrepancy at critical points remaining within 0.6. Specifically, the largest error of about 0.54 occurs around 30°, highlighting the difficulty in accurately capturing the transition from negative to positive damping. The lowest error, approximately 0.07 at 110°, demonstrates that the SST k-ω turbulence model is highly accurate for simulating near-wall flow conditions at lower angles of attack. In contrast, sector-shaped iced conductors exhibit a broader “Dangerous Zone,” maintaining negative Den Hartog coefficients across 10 angle conditions, with the lowest value approaching −4.5. This indicates a notably higher and more persistent risk of aerodynamic instability. Although the maximum positive coefficient in the “Safe Zone” reaches approximately 4.0, the corresponding numerical simulation errors are significantly higher, peaking at around 1.06. Such substantial deviations suggest that turbulent separation and nonlinear wake dynamics pose significant challenges for accurate numerical prediction. This elevated error likely arises from inherent limitations in the computational methodology when applied to complex geometries and flow conditions. Firstly, the highly unsteady flow around the sharp-edged sector geometry involves dynamic shifts of the separation point and asymmetric vortex shedding, phenomena not fully captured by the steady RANS equations, even with advanced turbulence models like SST k-ω. By design, RANS models smooth out transient flow fluctuations, thus limiting their accuracy for flows with pronounced separation and reattachment. Secondly, despite careful mesh generation efforts, mesh resolution limitations—particularly in regions of dynamic separation and highly turbulent wakes—may have prevented adequate resolution of fine-scale turbulent structures. Capturing these intricate, unsteady flow phenomena with greater fidelity would necessitate employing computationally more demanding methods, such as Large Eddy Simulation (LES) or Direct Numerical Simulation (DNS). Although beyond the scope of the current study, these methods represent important avenues for future research aimed at enhancing prediction accuracy in such complex aerodynamic regimes.
Based on the above analysis, the crescent-shaped iced conductors exhibit better aerodynamic stability than their sector-shaped counterparts. They are characterized by narrower instability intervals and smaller simulation errors, making them more suitable for direct application in wind-induced vibration prediction and galloping prevention design. In contrast, sector-shaped iced conductors show a higher likelihood of galloping across a broader range of operating conditions. This indicates that traditional galloping mitigation strategies may require modification or innovation to address the more complex aerodynamic behavior associated with this geometry.


