

Binary Classification of Pneumonia in Chest X-Ray Images Using Modified Contrast-Limited Adaptive Histogram Equalization Algorithm


Abstract
1. Introduction
2. Related Works
3. Materials and Methods
3.1. Dataset Overview
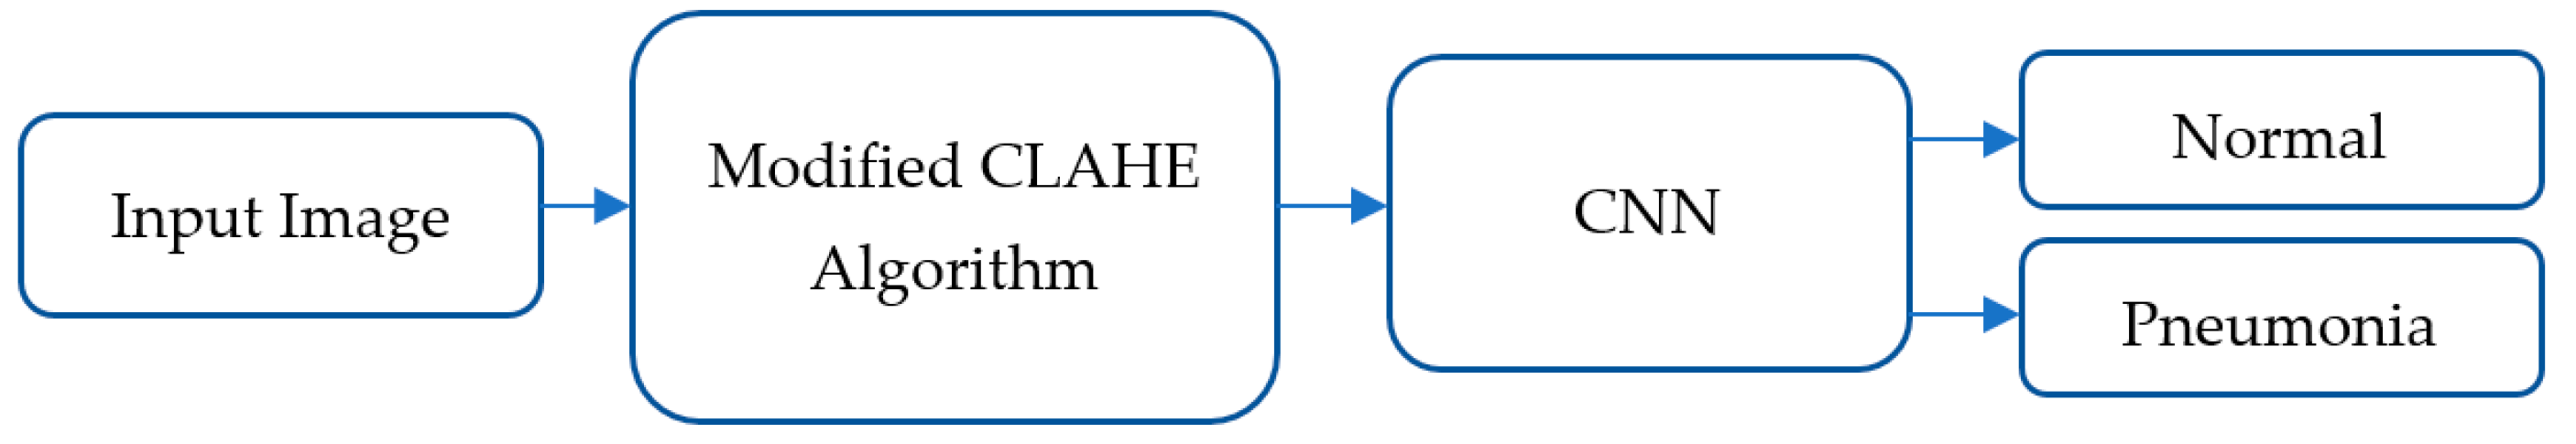
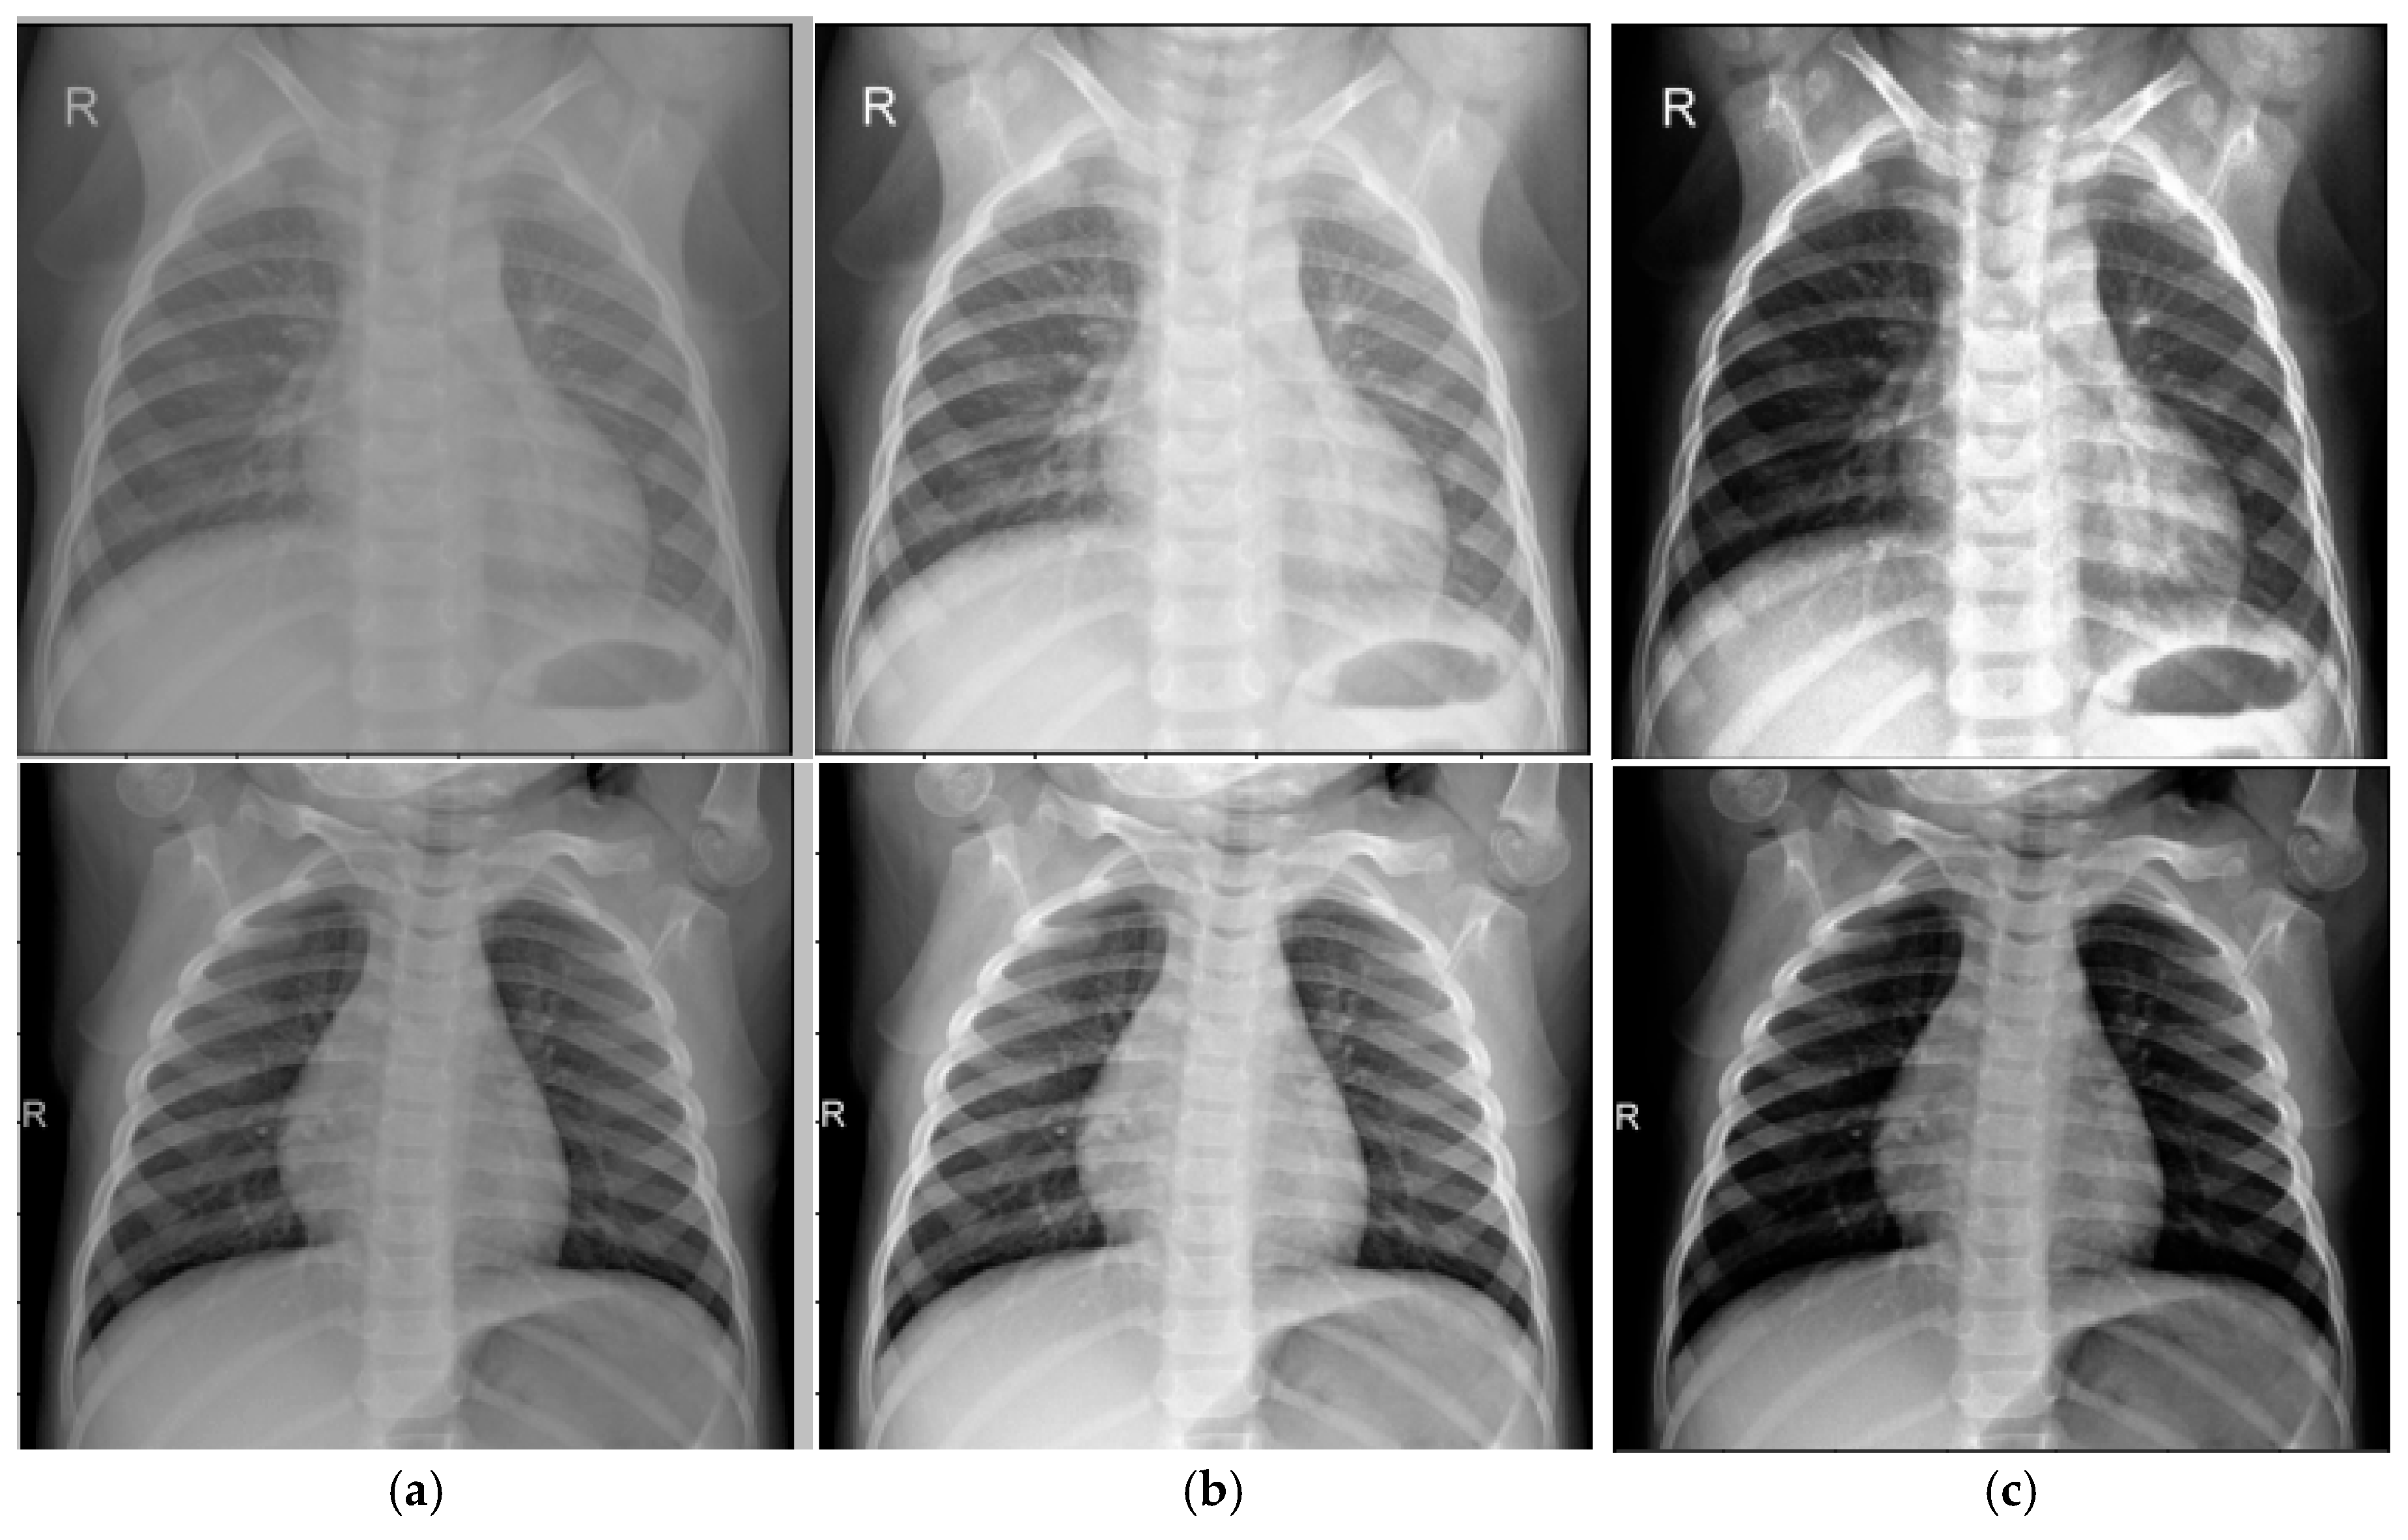
3.2. Modified Contrast-Limited Adaptive Histogram Equalization Algorithm for Image Enhancement
- Adjusting brightness;
- Adjusting contrast;
- Noise reduction.
- Number of tiles (NT): Determines the divisions of the image.
- Contrast limit (CL): Sets the threshold for histogram peak amplification.
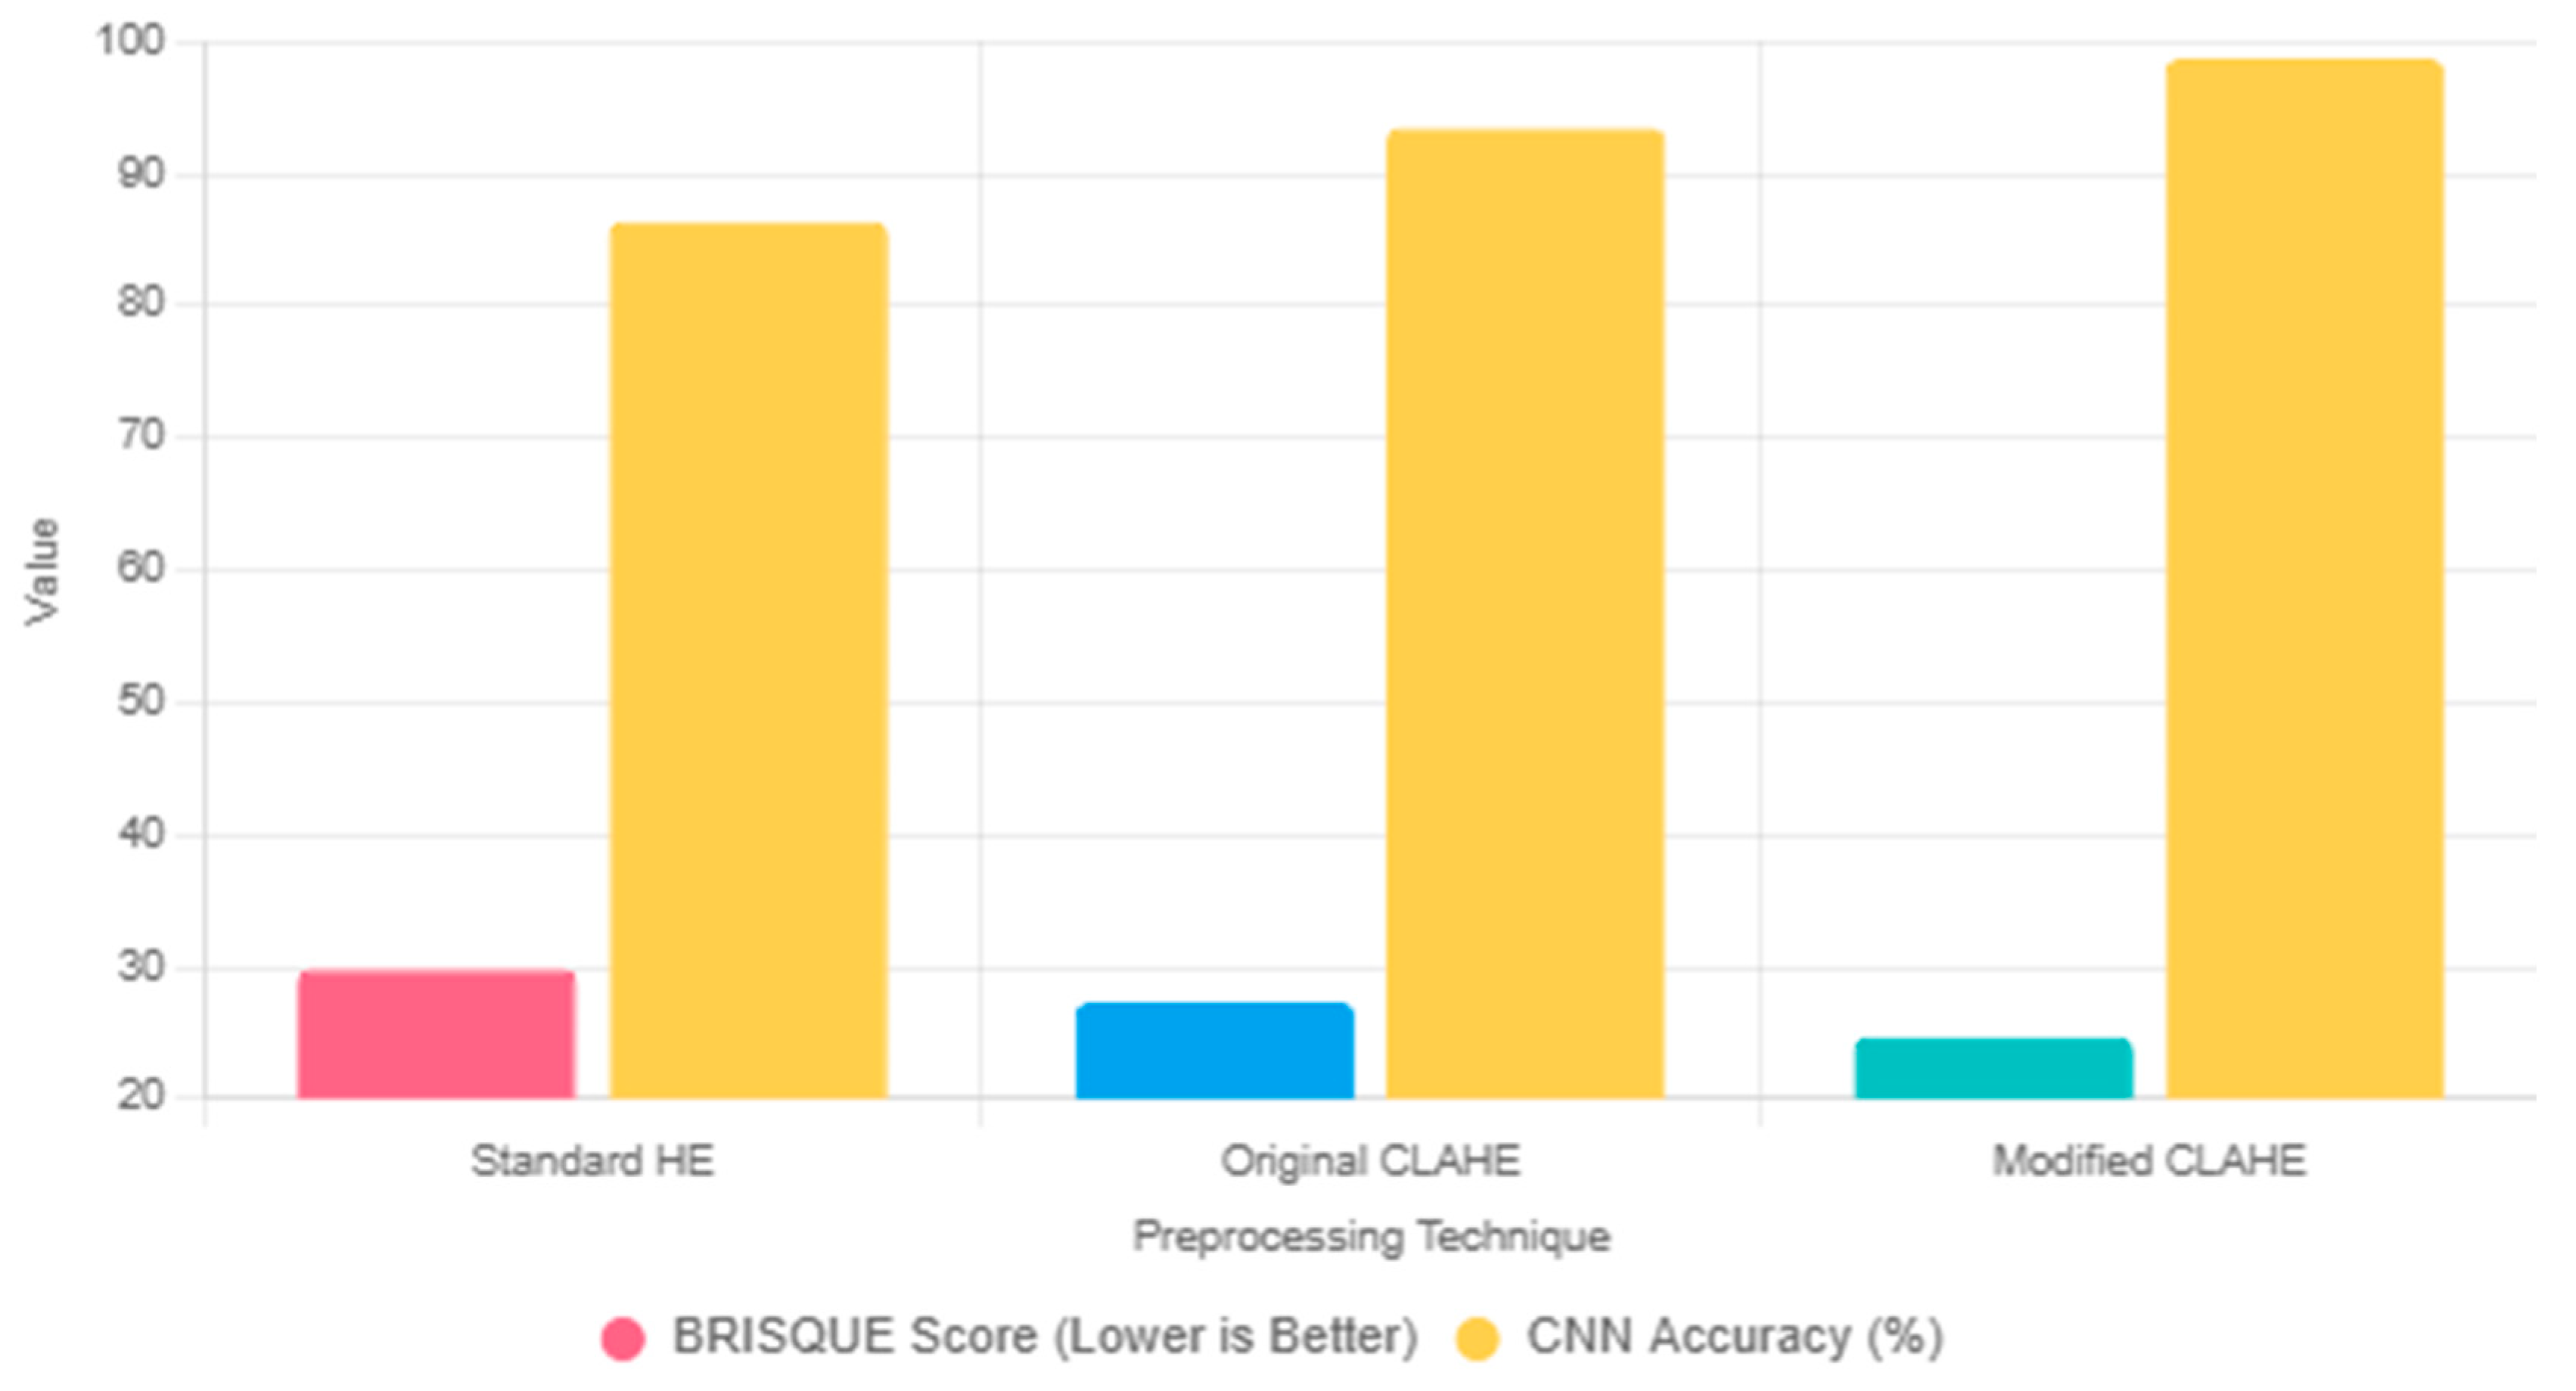
Comparison with Alternative Preprocessing Techniques
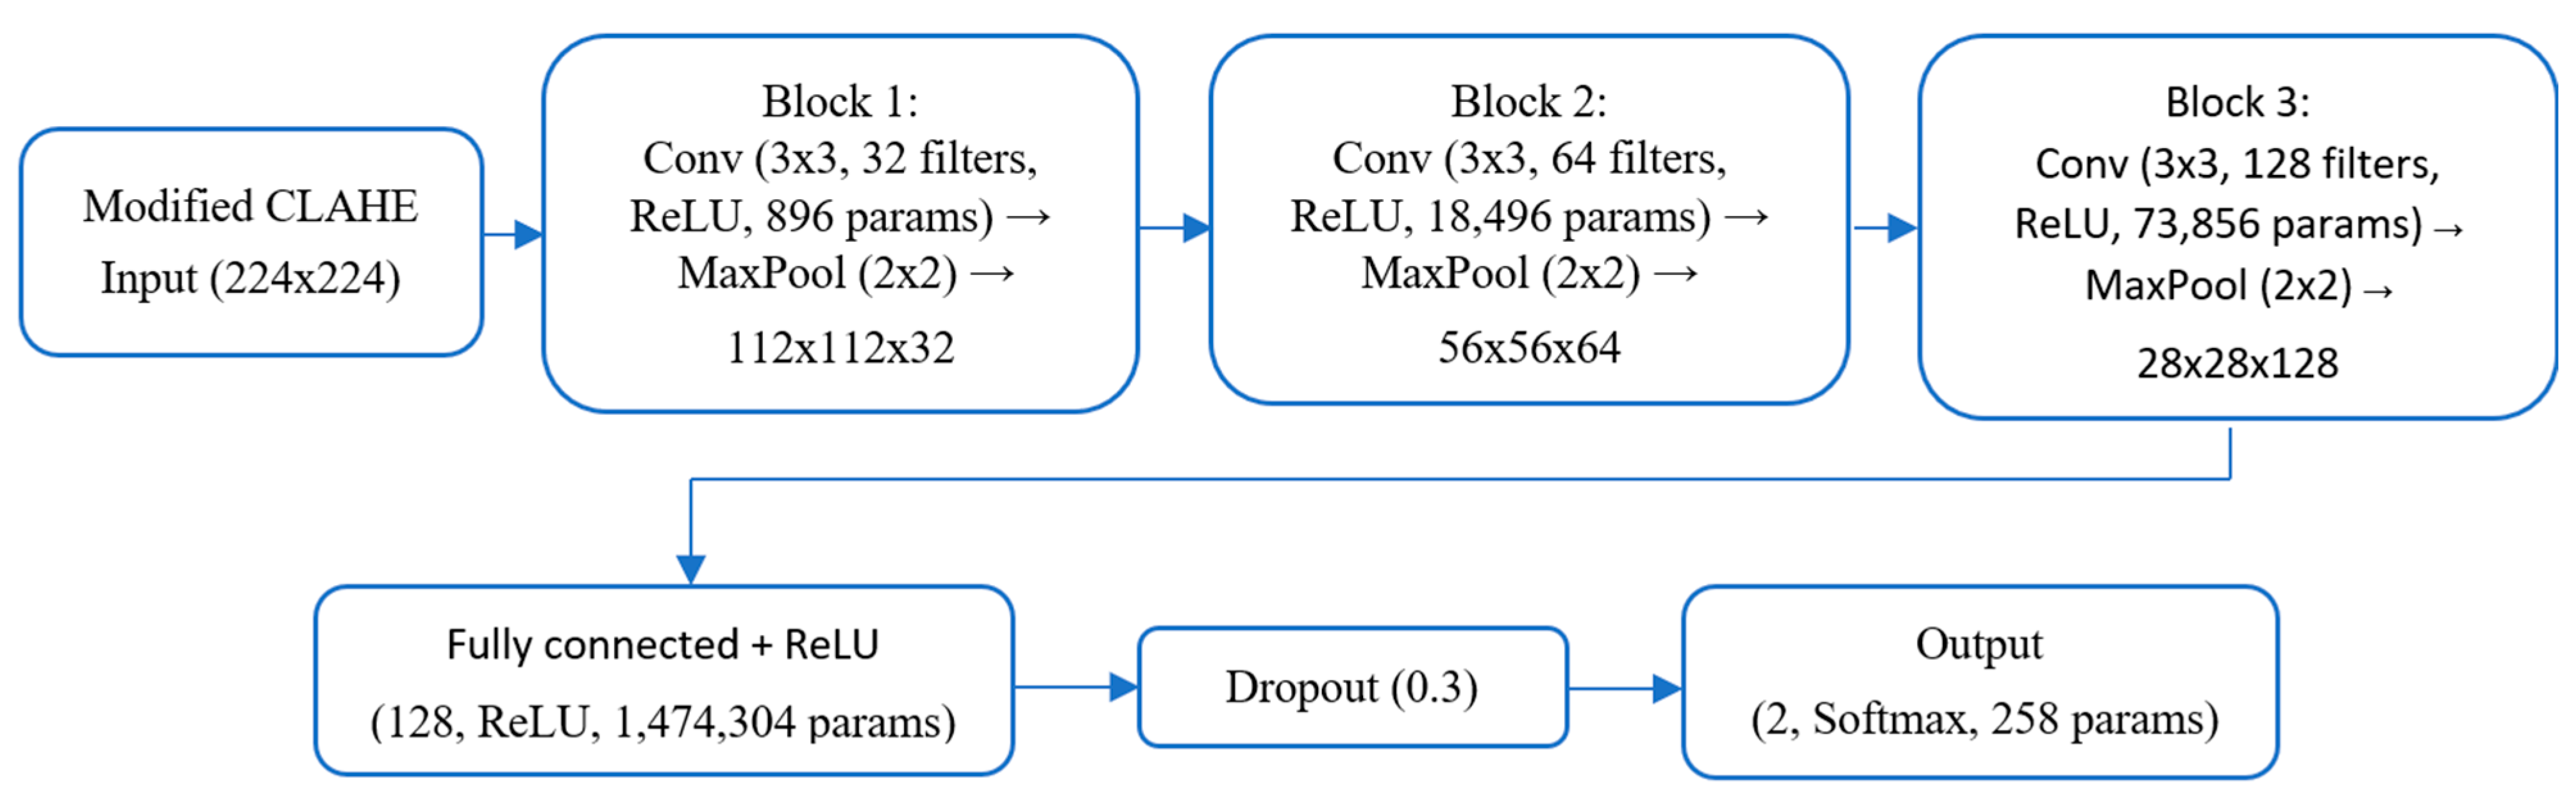
3.3. Architecture of Proposed CNN Model
4. Experimental Results and Discussion
4.1. Evaluation Metrics
- True positives (TPs): The number of correctly classified Pneumonia cases.
- True negatives (TNs): The number of correctly classified Normal cases.
- False positives (FPs): The number of Normal cases incorrectly classified as Pneumonia cases.
- False negatives (FNs): The number of Pneumonia cases incorrectly classified as Normal cases.
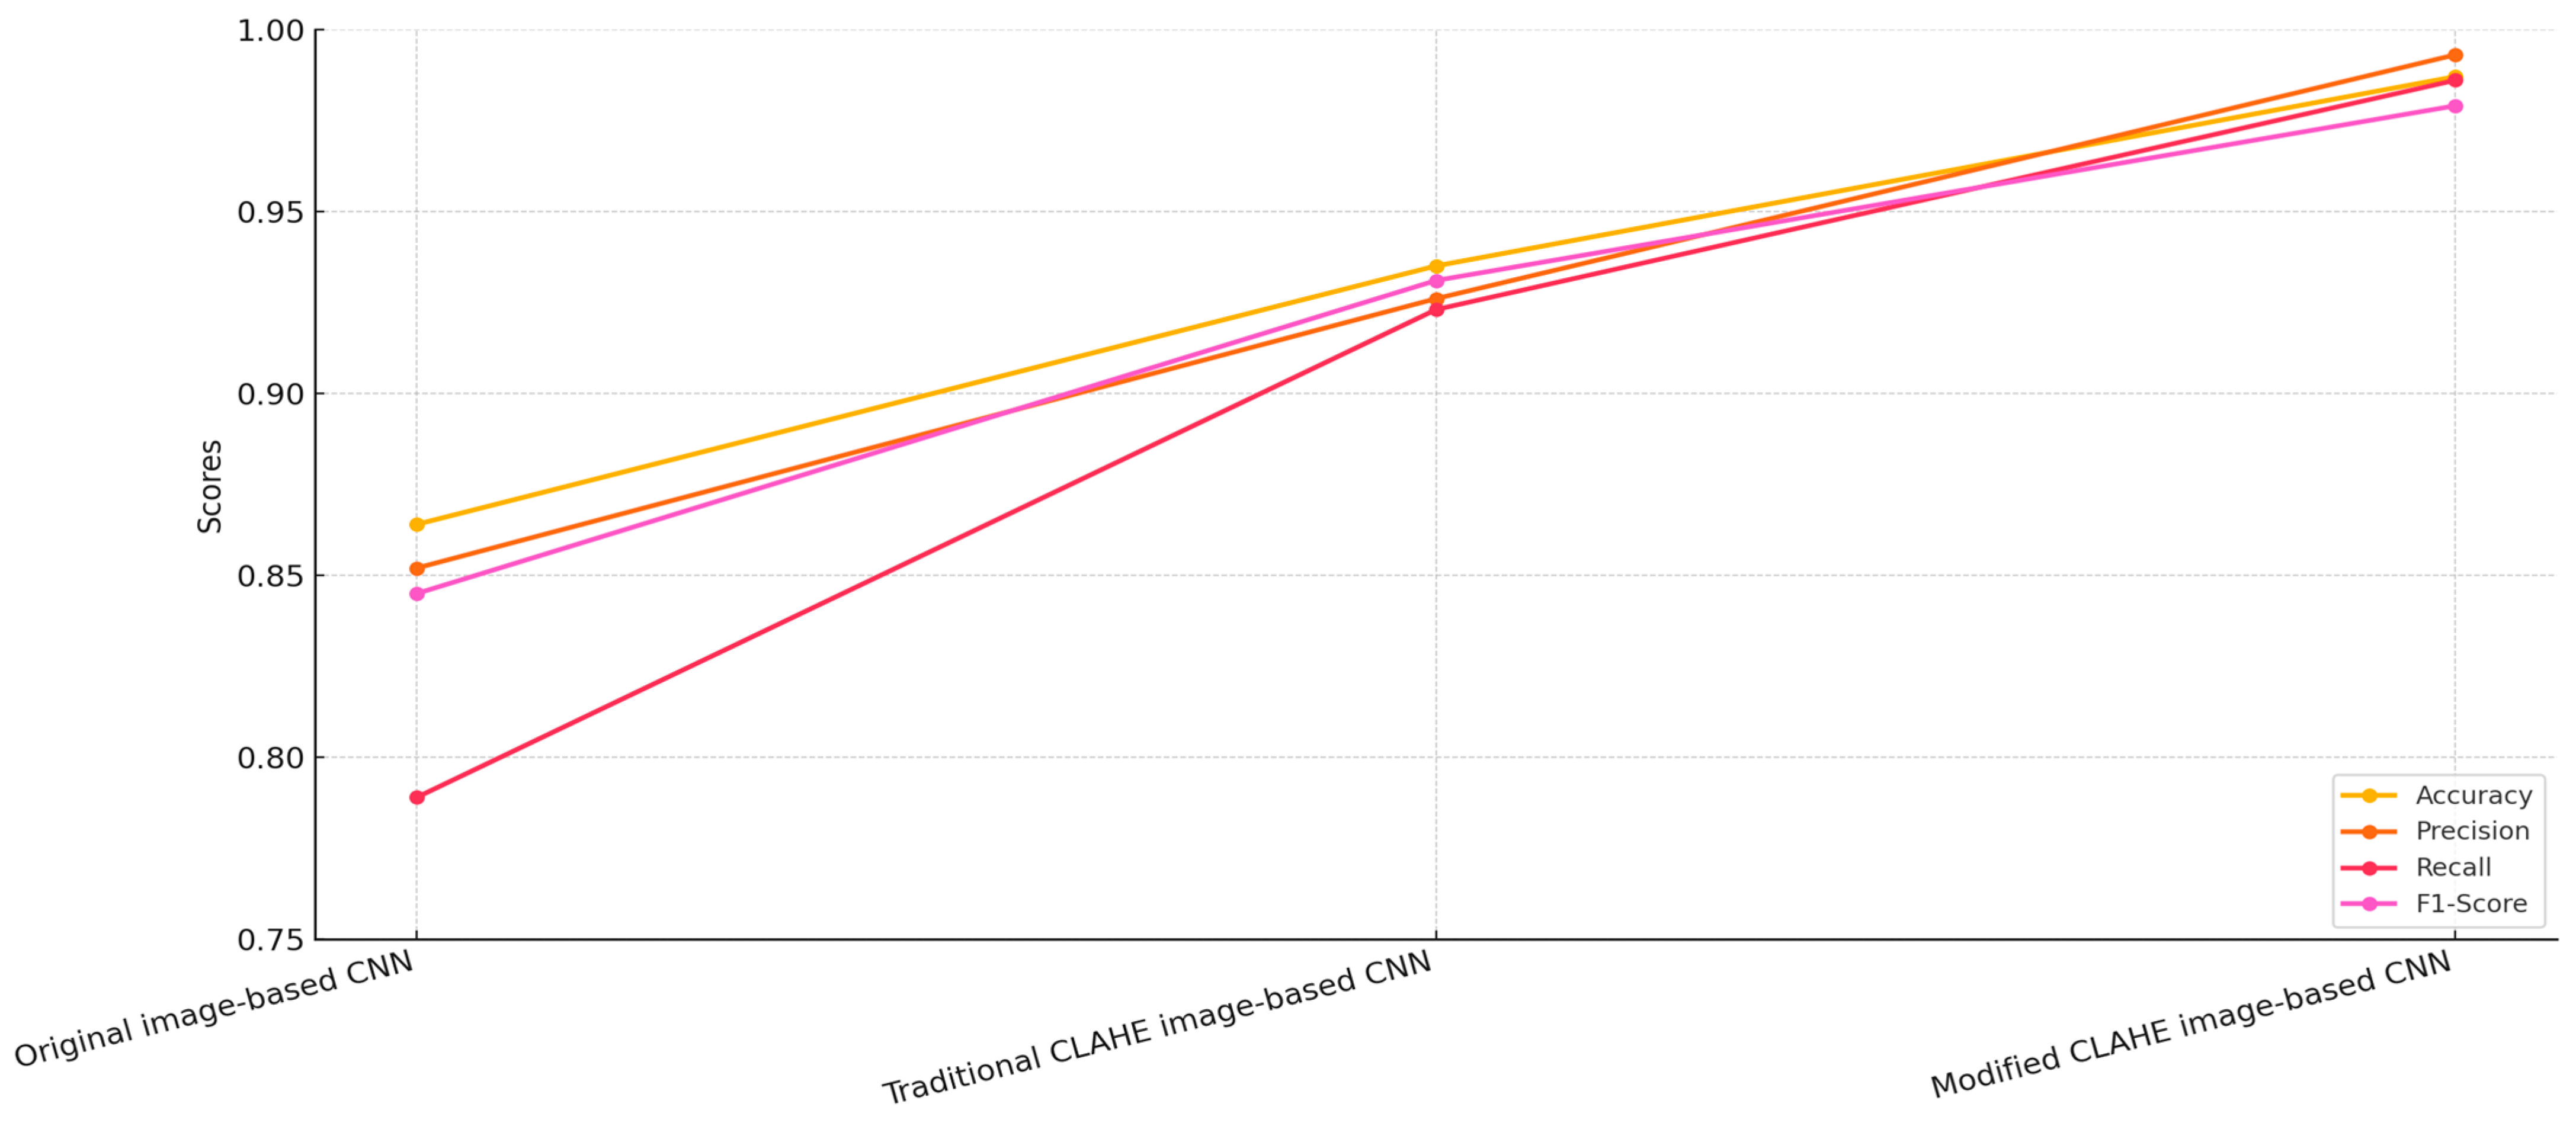
4.2. Comparative Analysis
- Original image-based CNN: This model was trained on the original, unprocessed chest X-ray dataset.
- Traditional CLAHE image-based CNN: This model utilized a dataset enhanced using the traditional CLAHE algorithm.
- Modified CLAHE image-based CNN: This model employed a dataset processed with the proposed modified CLAHE algorithm.
5. Conclusions
Author Contributions
Funding
Institutional Review Board Statement
Informed Consent Statement
Data Availability Statement
Conflicts of Interest
References
- Lee, H.M.; Kim, Y.J.; Kim, K.G. Segmentation Performance Comparison Considering Regional Characteristics in Chest X-ray Using Deep Learning. Sensors 2022, 22, 3143. [Google Scholar] [CrossRef]
- Kim, Y.J.; Lee, S.H.; Lim, K.Y.; Kim, K.G. Development and Validation of Segmentation Method for Lung Cancer Volumetry on Chest CT. J. Digit. Imaging 2018, 31, 505–512. [Google Scholar] [CrossRef]
- Zhang, Z. Fuzzy Interactive Naïve Bayesian network used in lung cancer classification with gene expression data. Int. J. Bio-Sci. Bio-Technol. 2015, 7, 213–222. [Google Scholar]
- Abdusalomov, A.; Mirzakhalilov, S.; Umirzakova, S.; Buriboev, A.S.; Meliboev, A.; Muminov, B.; Jeon, H.S. Ac-cessible AI Diagnostics and Lightweight Brain Tumor Detection on Medical Edge Devices. Bioengineering 2025, 12, 62. [Google Scholar] [CrossRef] [PubMed]
- Thakur, N.; Jaiswal, A. Comparative Analysis of Machine Learning and Deep Learning Algorithms for Skin Cancer Detection. In Machine Intelligence and Data Science Applications; Springer: Berlin/Heidelberg, Germany, 2022. [Google Scholar] [CrossRef]
- Shandilya, G.; Gupta, S.; Bharany, S.; Rehman, A.U.; Kaur, U.; Som, H.M.; Hussen, S. Autonomous detection of nail disorders using a hybrid capsule CNN: A novel deep learning approach for early diagnosis. BMC Med. Inform. Decis. Mak. 2024, 24, 414. [Google Scholar] [CrossRef]
- Rai, H.M. Cancer detection and segmentation using machine learning and deep learning techniques: A review. Multimed. Tools Appl. 2024, 83, 27001–27035. [Google Scholar] [CrossRef]
- Vandana; Marriwala, N.; Chaudhary, D. A hybrid model for depression detection using deep learning. Meas. Sens. 2023, 25, 100587. [Google Scholar] [CrossRef]
- Singh, R.; Gupta, S.; Bharany, S.; Almogren, A.; Altameem, A.; Rehman, A.U. Ensemble Deep Learning Models for En-hanced Brain Tumor Classification by Leveraging ResNet50 and EfficientNet-B7 on High-Resolution MRI Images. IEEE Access 2024, 12, 178623–178641. [Google Scholar] [CrossRef]
- Kim, R.; Kim, K.; Lee, Y. A Multiscale Deep Encoder–Decoder with Phase Congruency Algorithm Based on Deep Learning for Improving Diagnostic Ultrasound Image Quality. Appl. Sci. 2023, 13, 12928. [Google Scholar] [CrossRef]
- Zhu, H.; Cao, Z.; Lian, L.; Ye, G.; Gao, H.; Wu, J. CariesNet: A deep learning approach for segmentation of multi-stage caries lesion from oral panoramic X-ray image. Neural Comput. Appl. 2023, 35, 16051–16059. [Google Scholar] [CrossRef]
- Kim, Y.-T.; Jeong, T.S.; Kim, Y.J.; Kim, W.S.; Kim, K.G.; Yee, G.T. Automatic Spine Segmentation and Parameter Measurement for Radiological Analysis of Whole-Spine Lateral Radiographs Using Deep Learning and Computer Vision. J. Digit. Imaging 2023, 36, 1447–1459. [Google Scholar] [CrossRef]
- Khalil, M.; Naeem, A.; Naqvi, R.A.; Zahra, K.; Moqurrab, S.A.; Lee, S.-W. Deep Learning-Based Classification of Abrasion and Ischemic Diabetic Foot Sores Using Camera-Captured Images. Mathematics 2023, 11, 3793. [Google Scholar] [CrossRef]
- Arooj, S.; Khan, M.F.; Shahzad, T.; Nasir, M.U.; Zubair, M.; Ouahada, K. Data Fusion Architecture Empowered with Deep Learning for Breast Cancer Classification. Comput. Mater. Contin. 2023, 77, 2813–2831. [Google Scholar] [CrossRef]
- Abbas, S.; Issa, G.F.; Fatima, A.; Abbas, T.; Ghazal, T.M.; Ahmad, M.; Yeun, C.Y.; Khan, M.A.; Hošovský, A. Fused Weighted Federated Deep Extreme Machine Learning Based on Intelligent Lung Cancer Disease Prediction Model for Healthcare 5. Int. J. Intell. Syst. 2023, 2023, 2599161. [Google Scholar] [CrossRef]
- Mehmood, S.; Ghazal, T.M.; Khan, M.A.; Zubair, M.; Naseem, M.T.; Faiz, T.; Ahmad, M. Malignancy Detection in Lung and Colon Histopathology Images Using Transfer Learning with Class Selective Image Processing. IEEE Access 2022, 10, 25657–25668. [Google Scholar] [CrossRef]
- Lim, S.; Park, M.; Kim, H.; Kang, S.-H.; Kim, K.; Lee, Y. Optimization of Median Modified Wiener Filter for Improving Lung Segmentation Performance in Low-Dose Computed Tomography Images. Appl. Sci. 2023, 13, 10679. [Google Scholar] [CrossRef]
- Ashraf, A.; Nawi, N.M.; Shahzad, T.; Aamir, M.; Khan, M.A.; Ouahada, K. Dimension Reduction Using Dual-Featured Au-to-Encoder for the Histological Classification of Human Lungs Tissues. IEEE Access 2024, 12, 104165–104176. [Google Scholar] [CrossRef]
- Bhowal, P.; Sen, S.; Yoon, J.H.; Geem, Z.W.; Sarkar, R. Choquet Integral and Coalition Game-Based Ensemble of Deep Learning Models for COVID-19 Screening From Chest X-Ray Images. IEEE J. Biomed. Health Inform. 2021, 25, 4328–4339. [Google Scholar] [CrossRef]
- Malik, H.; Naeem, A.; Naqvi, R.A.; Loh, W.-K. DMFL_Net: A Federated Learning-Based Framework for the Classification of COVID-19 from Multiple Chest Diseases Using X-rays. Sensors 2023, 23, 743. [Google Scholar] [CrossRef]
- Kim, Y.J. Machine Learning Model Based on Radiomic Features for Differentiation between COVID-19 and Pneumonia on Chest X-ray. Sensors 2022, 22, 6709. [Google Scholar] [CrossRef]
- Sadeghi, F.; Rostami, O.; Yi, M.-K.; Hwang, S.O. A Deep Learning Approach for Detecting Covid-19 Using the Chest X-Ray Images. Comput. Mater. Contin. 2022, 74, 751–768. [Google Scholar] [CrossRef]
- Hyun, S.; Hwang, T.; Lee, K. The Prediction Model for Classification of COVID-19 Infected Patients Using Vital Sign. In Proceedings of the 2021 International Conference on Information and Communication Technology Convergence (ICTC), Jeju Island, Republic of Korea, 11–13 October 2023; pp. 678–681. [Google Scholar]
- Alabdulwahab, A.; Park, H.-C.; Jeong, H.; Lee, S.-W. An Efficient One-Dimensional Texture Representation Approach for Lung Disease Diagnosis. Appl. Sci. 2024, 14, 10661. [Google Scholar] [CrossRef]
- Ali, Z.; Khan, M.A.; Hamza, A.; Alzahrani, A.I.; Alalwan, N.; Shabaz, M.; Khan, F. A deep learning-based x-ray imaging diagnosis system for classification of tuberculosis, COVID-19, and pneumonia traits using evolutionary algorithm. Int. J. Imaging Syst. Technol. 2024, 34, e23014. [Google Scholar] [CrossRef]
- Kim, D.-H.; Oh, K.; Kang, S.-H.; Lee, Y. Development of Pneumonia Patient Classification Model Using Fair Federated Learning. In Intelligent Human Computer Interaction. IHCI 2023; Choi, B.J., Singh, D., Tiwary, U.S., Chung, W.Y., Eds.; Lecture Notes in Computer Science; Springer: Berlin/Heidelberg, Germany, 2024; Volume 14531. [Google Scholar] [CrossRef]
- Rasool, M.J.A.; Abdusalomov, A.; Kutlimuratov, A.; Ahamed, M.J.A.; Mirzakhalilov, S.; Shavkatovich Buriboev, A.; Jeon, H.S. PixMed-Enhancer: An Efficient Approach for Medical Image Augmentation. Bioengineering 2025, 12, 235. [Google Scholar] [CrossRef]
- Jamil, F.; Alsboui, T.; Babar, F.F.; Ahmad, S.; Alkanhel, R.I. Federated Active Learning with Transfer Learning: Empowering Edge Intelligence for Enhanced Lung Cancer Diagnosis. In Proceedings of the 2024 International Wireless Communications and Mobile Computing (IWCMC), Ayia Napa, Cyprus, 27–31 May 2024; pp. 1333–1338. [Google Scholar]
- Lee, J.H.; Ahn, J.S.; Chung, M.J.; Jeong, Y.J.; Kim, J.H.; Lim, J.K.; Kim, J.Y.; Kim, Y.J.; Lee, J.E.; Kim, E.Y. Development and Validation of a Multimodal-Based Prognosis and Intervention Prediction Model for COVID-19 Patients in a Multicenter Cohort. Sensors 2022, 22, 5007. [Google Scholar] [CrossRef] [PubMed]
- Al-Atawi, A.A.; Khan, F.; Kim, C.G. Application and Challenges of IoT Healthcare System in COVID-19. Sensors 2022, 22, 7304. [Google Scholar] [CrossRef]
- Majeed, A.; Lee, S. Applications of Machine Learning and High-Performance Computing in the Era of COVID-19. Appl. Syst. Innov. 2021, 4, 40. [Google Scholar] [CrossRef]
- Deebak, B.D.; Al-Turjman, F. EEI-IoT: Edge-Enabled Intelligent IoT Framework for Early Detection of COVID-19 Threats. Sensors 2023, 23, 2995. [Google Scholar] [CrossRef]
- Yun, J.; Basak, M.; Han, M.-M. Bayesian Rule Modeling for Interpretable Mortality Classification of COVID-19 Patients. Comput. Mater. Contin. 2021, 69, 2827–2843. [Google Scholar] [CrossRef]
- Rehman, A.; Xing, H.; Khan, M.A.; Hussain, M.; Hussain, A.; Gulzar, N. Emerging tech-nologies for COVID (ET-CoV) detection and diagnosis: Recent advancements, applications, challenges, and future perspec-tives. Biomed. Signal Process. Control. 2023, 83, 104642. [Google Scholar] [CrossRef]
- Tissir, Z.; Poudel, S.; Baidya, R.; Lee, S.-W. A Comprehensive Data Imbalance Analysis for Covid-19 Classification Dataset. In Proceedings of the 2021 International Conference on Information and Communication Technology Convergence (ICTC), Jeju Island, Republic of Korea, 20–22 October 2021; pp. 20–24. [Google Scholar] [CrossRef]
- Buriboev, A.S.; Khashimov, A.; Abduvaitov, A.; Jeon, H.S. CNN-Based Kidney Segmentation Using a Modified CLAHE Al-gorithm. Sensors 2024, 24, 7703. [Google Scholar] [CrossRef] [PubMed]
- Zhang, X.; Gao, L.; Wang, Z.; Yu, Y.; Zhang, Y.; Hong, J. Improved neural network with multi-task learning for Alzheimer’s disease classification. Heliyon 2024, 10, e26405. [Google Scholar] [CrossRef]
- Gonzalez, R.C.; Woods, R.E. Digital Image Processing; Prentice Hall: Hoboken, NJ, USA, 2008. [Google Scholar]
- Pizer, S.M.; Amburn, E.P.; Austin, J.D.; Cromartie, R.; Geselowitz, A.; Greer, T.; ter Haar Romeny, B.; Zimmerman, J.B.; Zuiderveld, K. Adaptive histogram equalization and its variations. Comput. Vis. Graph. Image Process. 1987, 39, 355–368. [Google Scholar] [CrossRef]
- Stephen, O.; Sain, M.; Maduh, U.J.; Jeong, D.-U. An efficient deep learning approach to pneumonia classification in healthcare. J. Heath Eng. 2019, 2019, 4180949. [Google Scholar] [CrossRef] [PubMed]
- Polesel, A.; Ramponi, G.; Mathews, V. Image enhancement via adaptive unsharp masking. IEEE Trans. Image Process. 2000, 9, 505–510. [Google Scholar] [CrossRef]
- Canny, J. A computational approach to edge detection. IEEE Trans. Pattern Anal. Mach. Intell. 1986, 8, 679–698. [Google Scholar] [CrossRef]
- Sobel, I. Camera Models and Machine Perception; Stanford University: Stanford, CA, USA, 1970. [Google Scholar]
- Elshennawy, N.M.; Ibrahim, D.M. Deep-Pneumonia Framework Using Deep Learning Models Based on Chest X-Ray Images. Diagnostics 2020, 10, 649. [Google Scholar] [CrossRef]
- Alsulami, N.; Althobaiti, H.; Alafif, T. MV-MFF: Multi-View Multi-Feature Fusion Model for Pneumonia Classification. Diagnostics 2024, 14, 1566. [Google Scholar] [CrossRef] [PubMed]
- Xue, X.; Chinnaperumal, S.; Abdulsahib, G.M.; Manyam, R.R.; Marappan, R.; Raju, S.K.; Khalaf, O.I. Design and Analysis of a Deep Learning Ensemble Framework Model for the Detection of COVID-19 and Pneumonia Using Large-Scale CT Scan and X-ray Image Datasets. Bioengineering 2023, 10, 363. [Google Scholar] [CrossRef]
- Siddiqi, R.; Javaid, S. Deep Learning for Pneumonia Detection in Chest X-ray Images: A Comprehensive Survey. J. Imaging 2024, 10, 176. [Google Scholar] [CrossRef]
- Rahman, T.; Chowdhury, M.E.H.; Khandakar, A.; Islam, K.R.; Islam, K.F.; Mahbub, Z.B.; Kadir, M.A.; Kashem, S. Transfer Learning with Deep Convolutional Neural Network (CNN) for Pneumonia Detection Using Chest X-ray. Appl. Sci. 2020, 10, 3233. [Google Scholar] [CrossRef]
- Buriboev, A.S.; Muhamediyeva, D.; Primova, H.; Sultanov, D.; Tashev, K.; Jeon, H.S. Concatenated CNN-Based Pneumonia Detection Using a Fuzzy-Enhanced Dataset. Sensors 2024, 24, 6750. [Google Scholar] [CrossRef]
- Khattab, R.; Abdelmaksoud, I.R.; Abdelrazek, S. Automated detection of COVID-19 and pneumonia diseases using data mining and transfer learning algorithms with focal loss from chest X-ray images. Appl. Soft Comput. 2024, 162, 111806. [Google Scholar] [CrossRef]
- Wang, Z.; Xiao, Y.; Li, Y.; Zhang, J.; Lu, F.; Hou, M.; Liu, X. Automatically discriminating and localizing COVID-19 from community-acquired pneumonia on chest X-rays. Pattern Recognit. 2021, 110, 107613. [Google Scholar] [CrossRef]
- Bal, U.; Bal, A.; Moral, Ö.T.; Düzgün, F.; Gürbüz, N. A deep learning feature extraction-based hybrid approach for detecting pediatric pneumonia in chest X-ray images. Phys. Eng. Sci. Med. 2024, 47, 109–117. [Google Scholar] [CrossRef] [PubMed]
- Chen, S.; Ren, S.; Wang, G.; Huang, M.; Xue, C. Interpretable CNN-Multilevel Attention Transformer for Rapid Recognition of Pneumonia From Chest X-Ray Images. IEEE J. Biomed. Health Inform. 2023, 28, 753–764. [Google Scholar] [CrossRef]
- Ukwuoma, C.C.; Qin, Z.; Bin Heyat, B.; Akhtar, F.; Bamisile, O.; Muaad, A.Y.; Addo, D.; Al-Antari, M.A. A hybrid explainable ensemble transformer encoder for pneumonia identification from chest X-ray images. J. Adv. Res. 2023, 48, 191–211. [Google Scholar] [CrossRef] [PubMed]
- Sanghvi, H.A.; Patel, R.H.; Agarwal, A.; Gupta, S.; Sawhney, V.; Pandya, A.S. A deep learning approach for classification of COVID and pneumonia using DenseNet-201. Int. J. Imaging Syst. Technol. 2023, 33, 18–38. [Google Scholar] [CrossRef]
- Yi, R.; Tang, L.; Tian, Y.; Liu, J.; Wu, Z. Identification and classification of pneumonia disease using a deep learning-based intelligent computational framework. Neural Comput. Appl. 2023, 35, 14473–14486. [Google Scholar] [CrossRef] [PubMed]
- Nahiduzzaman; Goni, O.F.; Anower, S.; Islam, R.; Ahsan, M.; Haider, J.; Gurusamy, S.; Hassan, R.; Islam, R. A Novel Method for Multivariant Pneumonia Classification Based on Hybrid CNN-PCA Based Feature Extraction Using Extreme Learning Machine with CXR Images. IEEE Access 2021, 9, 147512–147526. [Google Scholar] [CrossRef]
- Malik, H.; Anees, T.; Din, M.; Naeem, A. CDC_Net: Multi-classification convolutional neural network model for detection of COVID-19, pneumothorax, pneumonia, lung Cancer, and tuberculosis using chest X-rays. Multimed. Tools Appl. 2023, 82, 13855–13880. [Google Scholar] [CrossRef] [PubMed]
- Irvin, J.; Rajpurkar, P.; Ko, M.; Yu, Y.; Ciurea-Ilcus, S.; Chute, C.; Marklund, H.; Haghgoo, B.; Ball, R.; Shpanskaya, K.; et al. CheXpert: A large chest radiograph dataset with uncertainty labels and expert comparison. Proc. AAAI Conf. Artif. Intell. 2019, 33, 590–597. [Google Scholar] [CrossRef]
- Xu, X.; Jiang, X.; Ma, C.; Du, P.; Li, X.; Lv, S.; Yu, L.; Chen, Y.; Su, J.; Lang, G. Deep Learning System to Screen novel Coronavirus Disease 2019 Pneumonia. Engineering 2020, 6, 1122–1129. [Google Scholar] [CrossRef] [PubMed]
- Apostolopoulos, I.D.; Mpesiana, T.A. COVID-19: Automatic detection from X-ray images utilizing transfer learning with convolutional neural networks. Phys. Eng. Sci. Med. 2020, 43, 635–640. [Google Scholar] [CrossRef]
- Yoo, S.H.; Geng, H.; Chiu, T.L.; Yu, S.K.; Cho, D.C.; Heo, J.; Choi, M.S.; Choi, I.H.; Van, C.C.; Nhung, N.V.; et al. Deep learn-ing-based decision-tree classifier for COVID-19 diagnosis from chest X-ray imaging. Front. Med. 2020, 7, 427. [Google Scholar] [CrossRef]
- Hussain; Hasan, M.; Rahman, M.A.; Lee, I.; Tamanna, T.; Parvez, M.Z. Corodet: A deep learning based classification for COVID-19 detection using chest X-ray images. Chaos Solitons Fractals 2021, 142, 110495. [Google Scholar] [CrossRef]
- Alshmrani, G.M.M.; Ni, Q.; Jiang, R.; Pervaiz, H.; Elshennawy, N.M. A deep learning architecture for multi-class lung dis-eases classification using chest X-ray (CXR) images. Alex. Eng. J. 2023, 64, 923–935. [Google Scholar] [CrossRef]
- Ravi, V.; Acharya, V.; Alazab, M. A multichannel EfficientNet deep learning-based stacking ensemble approach for lung disease detection using chest X-ray images. Clust. Comput. 2023, 26, 1181–1203. [Google Scholar] [CrossRef]
- Prakash, J.A.; Ravi, V.; Sowmya, V.; Soman, K.P. Stacked ensemble learning based on deep convolutional neural networks for pedi-atric pneumonia diagnosis using chest X-ray images. Neural Comput. Appl. 2023, 35, 8259–8279. [Google Scholar] [CrossRef]
- Wang, T.; Nie, Z.; Wang, R.; Xu, Q.; Huang, H.; Xu, H.; Xie, F.; Liu, X.J. PneuNet: Deep learning for COVID-19 pneumonia diagnosis on chest X-ray image analysis using Vision Transformer. Med. Biol. Eng. Comput. 2023, 61, 1395–1408. [Google Scholar] [CrossRef]
- Wang, X.; Peng, Y.; Lu, L.; Lu, Z.; Bagheri, M.; Summers, R.M. ChestX-Ray8: Hospital-Scale Chest X-Ray Database and Benchmarks on Weakly-Supervised Classification and Localization of Common Thorax Diseases. In Proceedings of the 2017 IEEE Conference on Computer Vision and Pattern Recognition (CVPR), Honolulu, HI, USA, 21–26 July 2017; pp. 3462–3471. [Google Scholar] [CrossRef]
- An, Q.; Chen, W.; Shao, W. A Deep Convolutional Neural Network for Pneumonia Detection in X-ray Images with Attention Ensemble. Diagnostics 2024, 14, 390. [Google Scholar] [CrossRef] [PubMed]
- Sharma, S.; Guleria, K. A Deep Learning based model for the Detection of Pneumonia from Chest X-Ray Images using VGG-16 and Neural Networks. Procedia Comput. Sci. 2023, 218, 357–366. [Google Scholar] [CrossRef]
- Bhatt, H.; Shah, M. A Convolutional Neural Network ensemble model for Pneumonia Detection using chest X-ray images. Health Anal. 2023, 3, 100176. [Google Scholar] [CrossRef]
- Goyal, S.; Singh, R. Detection and classification of lung diseases for pneumonia and Covid-19 using machine and deep learning techniques. J. Ambient. Intell. Humaniz. Comput. 2023, 14, 3239–3259. [Google Scholar] [CrossRef]
- Mabrouk, A.; Redondo, R.P.D.; Dahou, A.; Elaziz, M.A.; Kayed, M. Pneumonia Detection on Chest X-ray Images Using Ensemble of Deep Convolutional Neural Networks. Appl. Sci. 2022, 12, 6448. [Google Scholar] [CrossRef]
- Wang, K.; Jiang, P.; Meng, J.; Jiang, X. Attention-Based DenseNet for Pneumonia Classification. Irbm 2022, 43, 479–485. [Google Scholar] [CrossRef]


| Parameter | Range | Step |
|---|---|---|
| NT | [2, 24] | 2 |
| CL | [0, 1] | 0.01 |
| NT | CL | BRISQUE Value |
|---|---|---|
| 2 | 0.01 | 4.375 |
| 4 | 0.01 | 5.758 |
| 6 | 0.01 | 5.463 |
| … | … | … |
| 24 | 1 | 4.214 |
| Image | NT | CL |
|---|---|---|
| X0 | 2 | 0.02 |
| X1 | 2 | 0.03 |
| X2 | 4 | 0.01 |
| … | … | … |
| Xn | 6 | 0.04 |
| Step | Description |
|---|---|
| Image input | Load raw chest X-ray image. |
| Definition of parameter ranges |
|
| Tile division | For each NT value in the defined range:
|
| Histogram computation and contrast limiting | For each tile and each combination of NT and CL:
|
| Interpolation across tiles |
|
| Quality assessment |
|
| Parameter optimization per image | For each image in the dataset:
|
| General parameter selection for dataset |
|
| Optimized CLAHE application | Reprocess each image in the dataset using the selected general NT and CL parameters:
|
| Output | Return the dataset of enhanced images, optimized for both contrast enhancement and noise reduction, along with the selected NT and CL values. |
| Network Model | Accuracy | Precision | Recall | F1-Score | Dataset Type |
|---|---|---|---|---|---|
| Original image-based CNN | 0.864 | 0.852 | 0.789 | 0.845 | Original dataset |
| Traditional CLAHE image-based CNN | 0.935 | 0.926 | 0.923 | 0.931 | Enhanced using traditional CLAHE |
| Modified CLAHE image-based CNN | 0.987 | 0.993 | 0.986 | 0.979 | Enhanced using modified CLAHE |
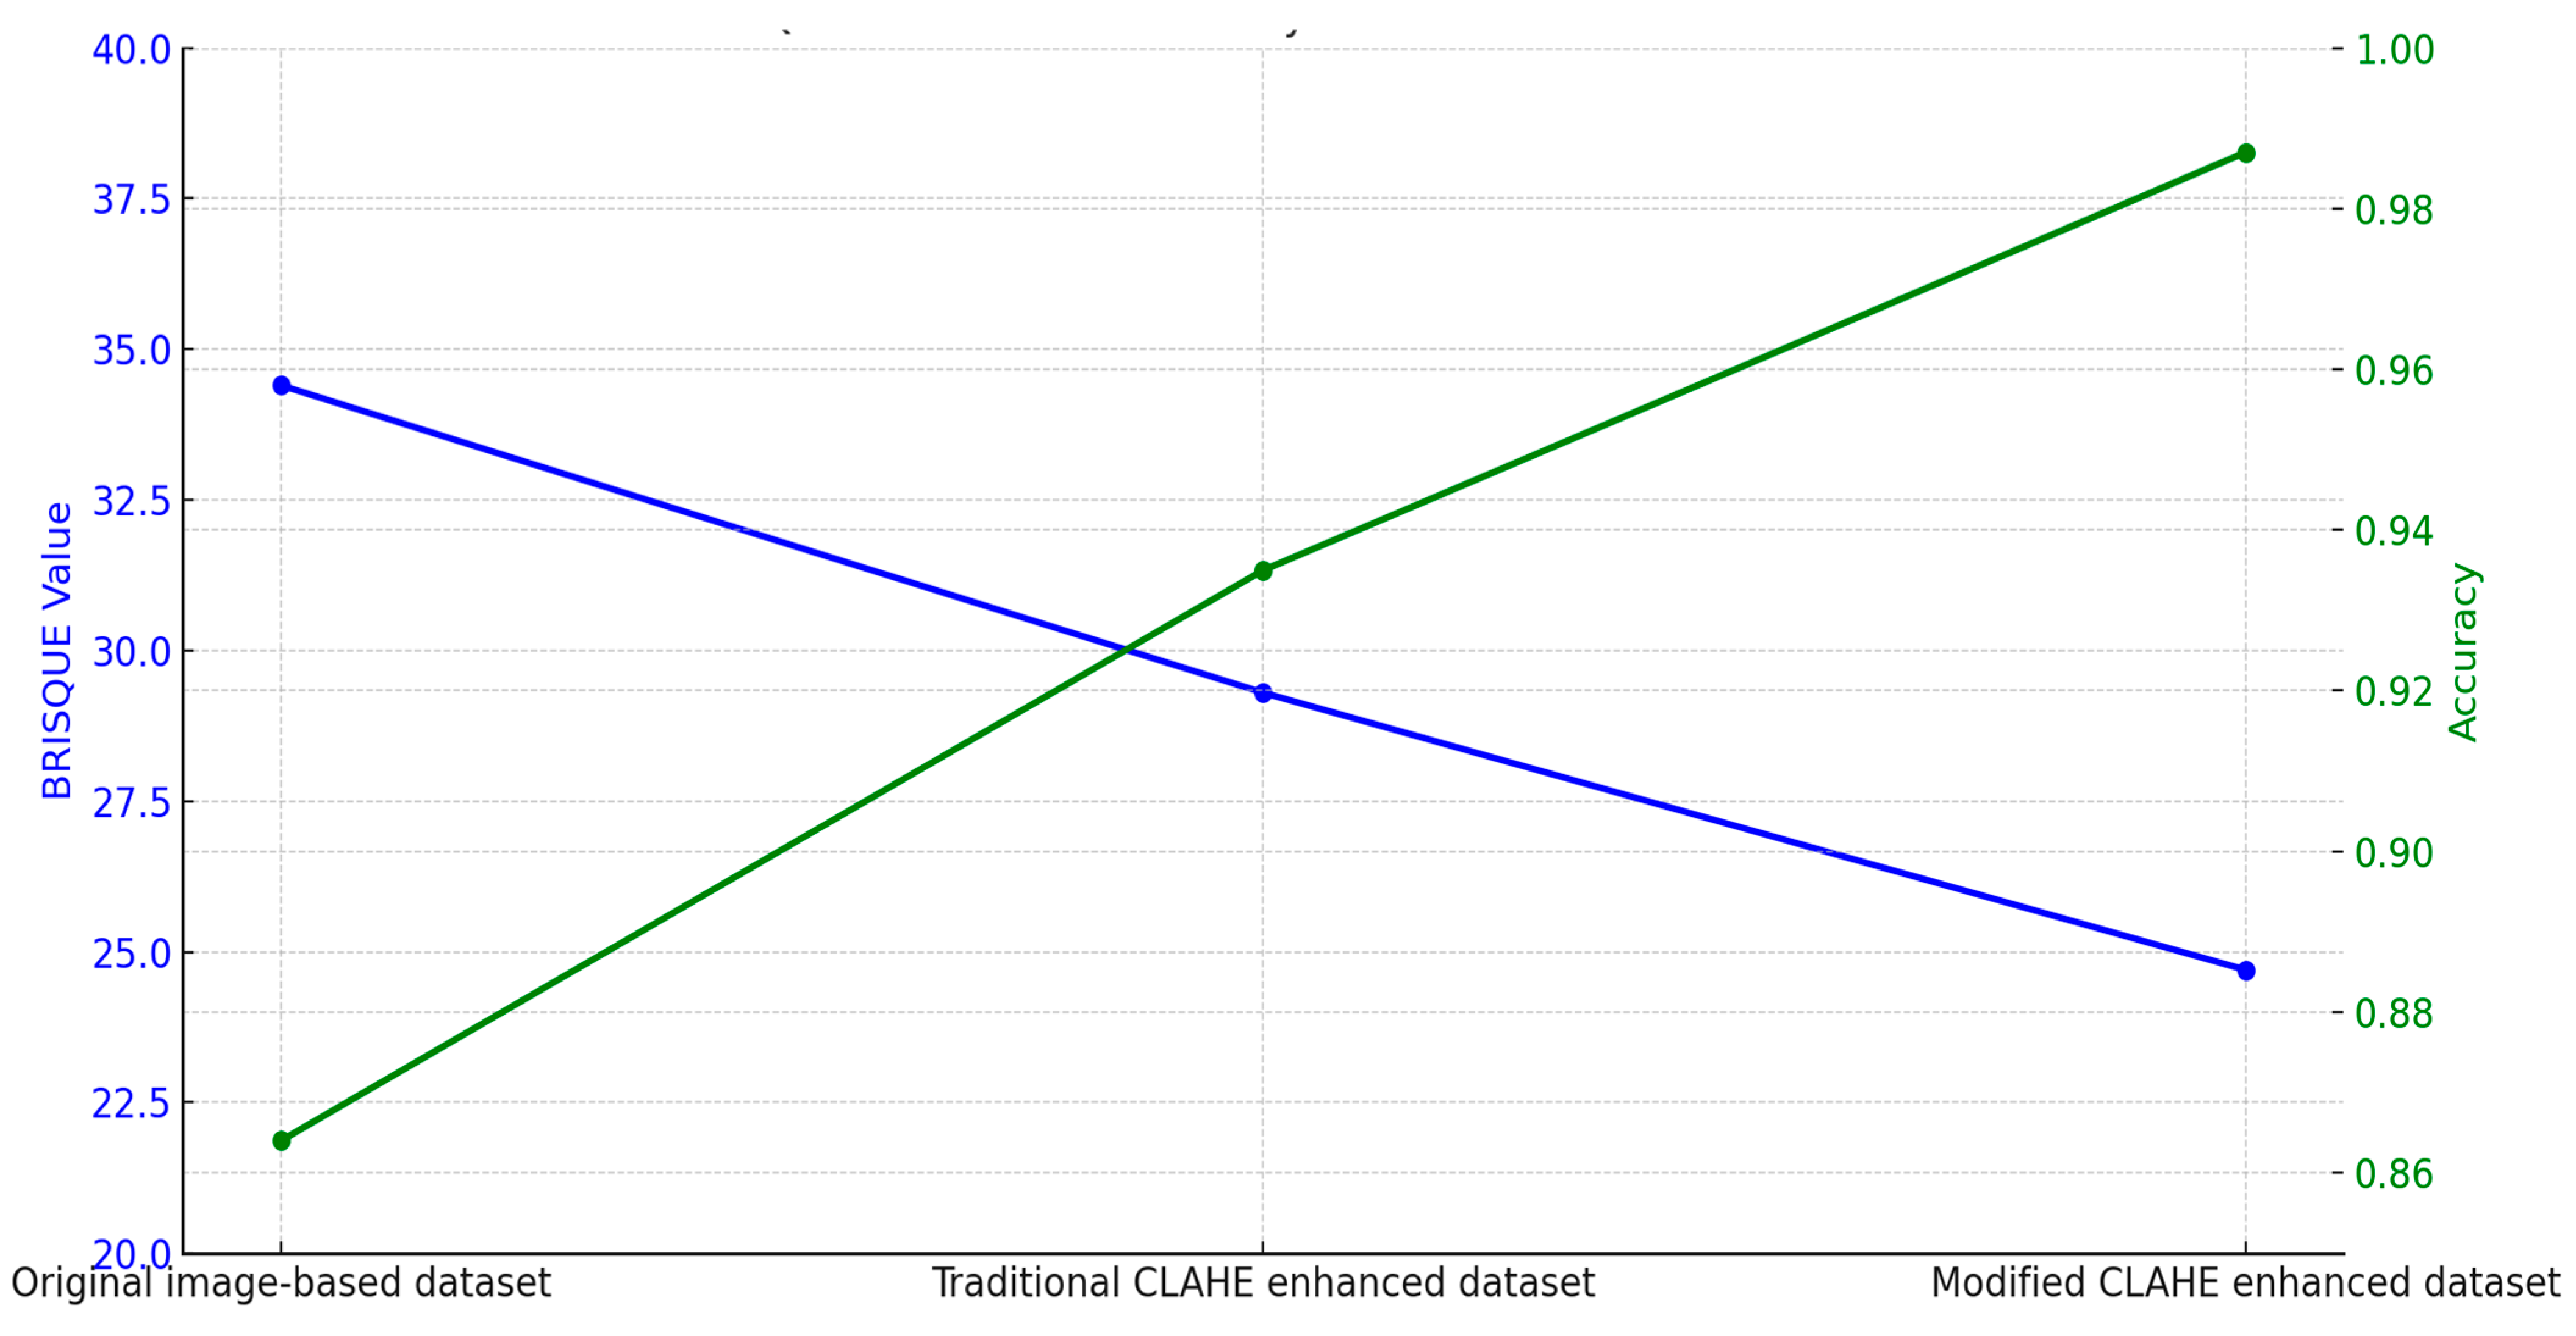
| Dataset | BRISQUE Value | Network Model | Accuracy |
|---|---|---|---|
| Original image-based dataset | 34.4 | Original image-based CNN | 0.864 |
| Traditional CLAHE enhanced dataset | 29.3 | Traditional CLAHE image-based CNN | 0.935 |
| Modified CLAHE enhanced dataset | 24.7 | Modified CLAHE image-based CNN | 0.987 |
| Condition | Modified CLAHE CNN | Traditional CLAHE CNN | Original Image CNN |
|---|---|---|---|
| Low-Dose Imaging (30% reduction) | 97.8% | 93.6% | 89.4% |
| Contrast Variation (+15%) | 98.2% | 94.5% | 90.7% |
| Contrast Variation (−15%) | 97.5% | 93.2% | 88.9% |
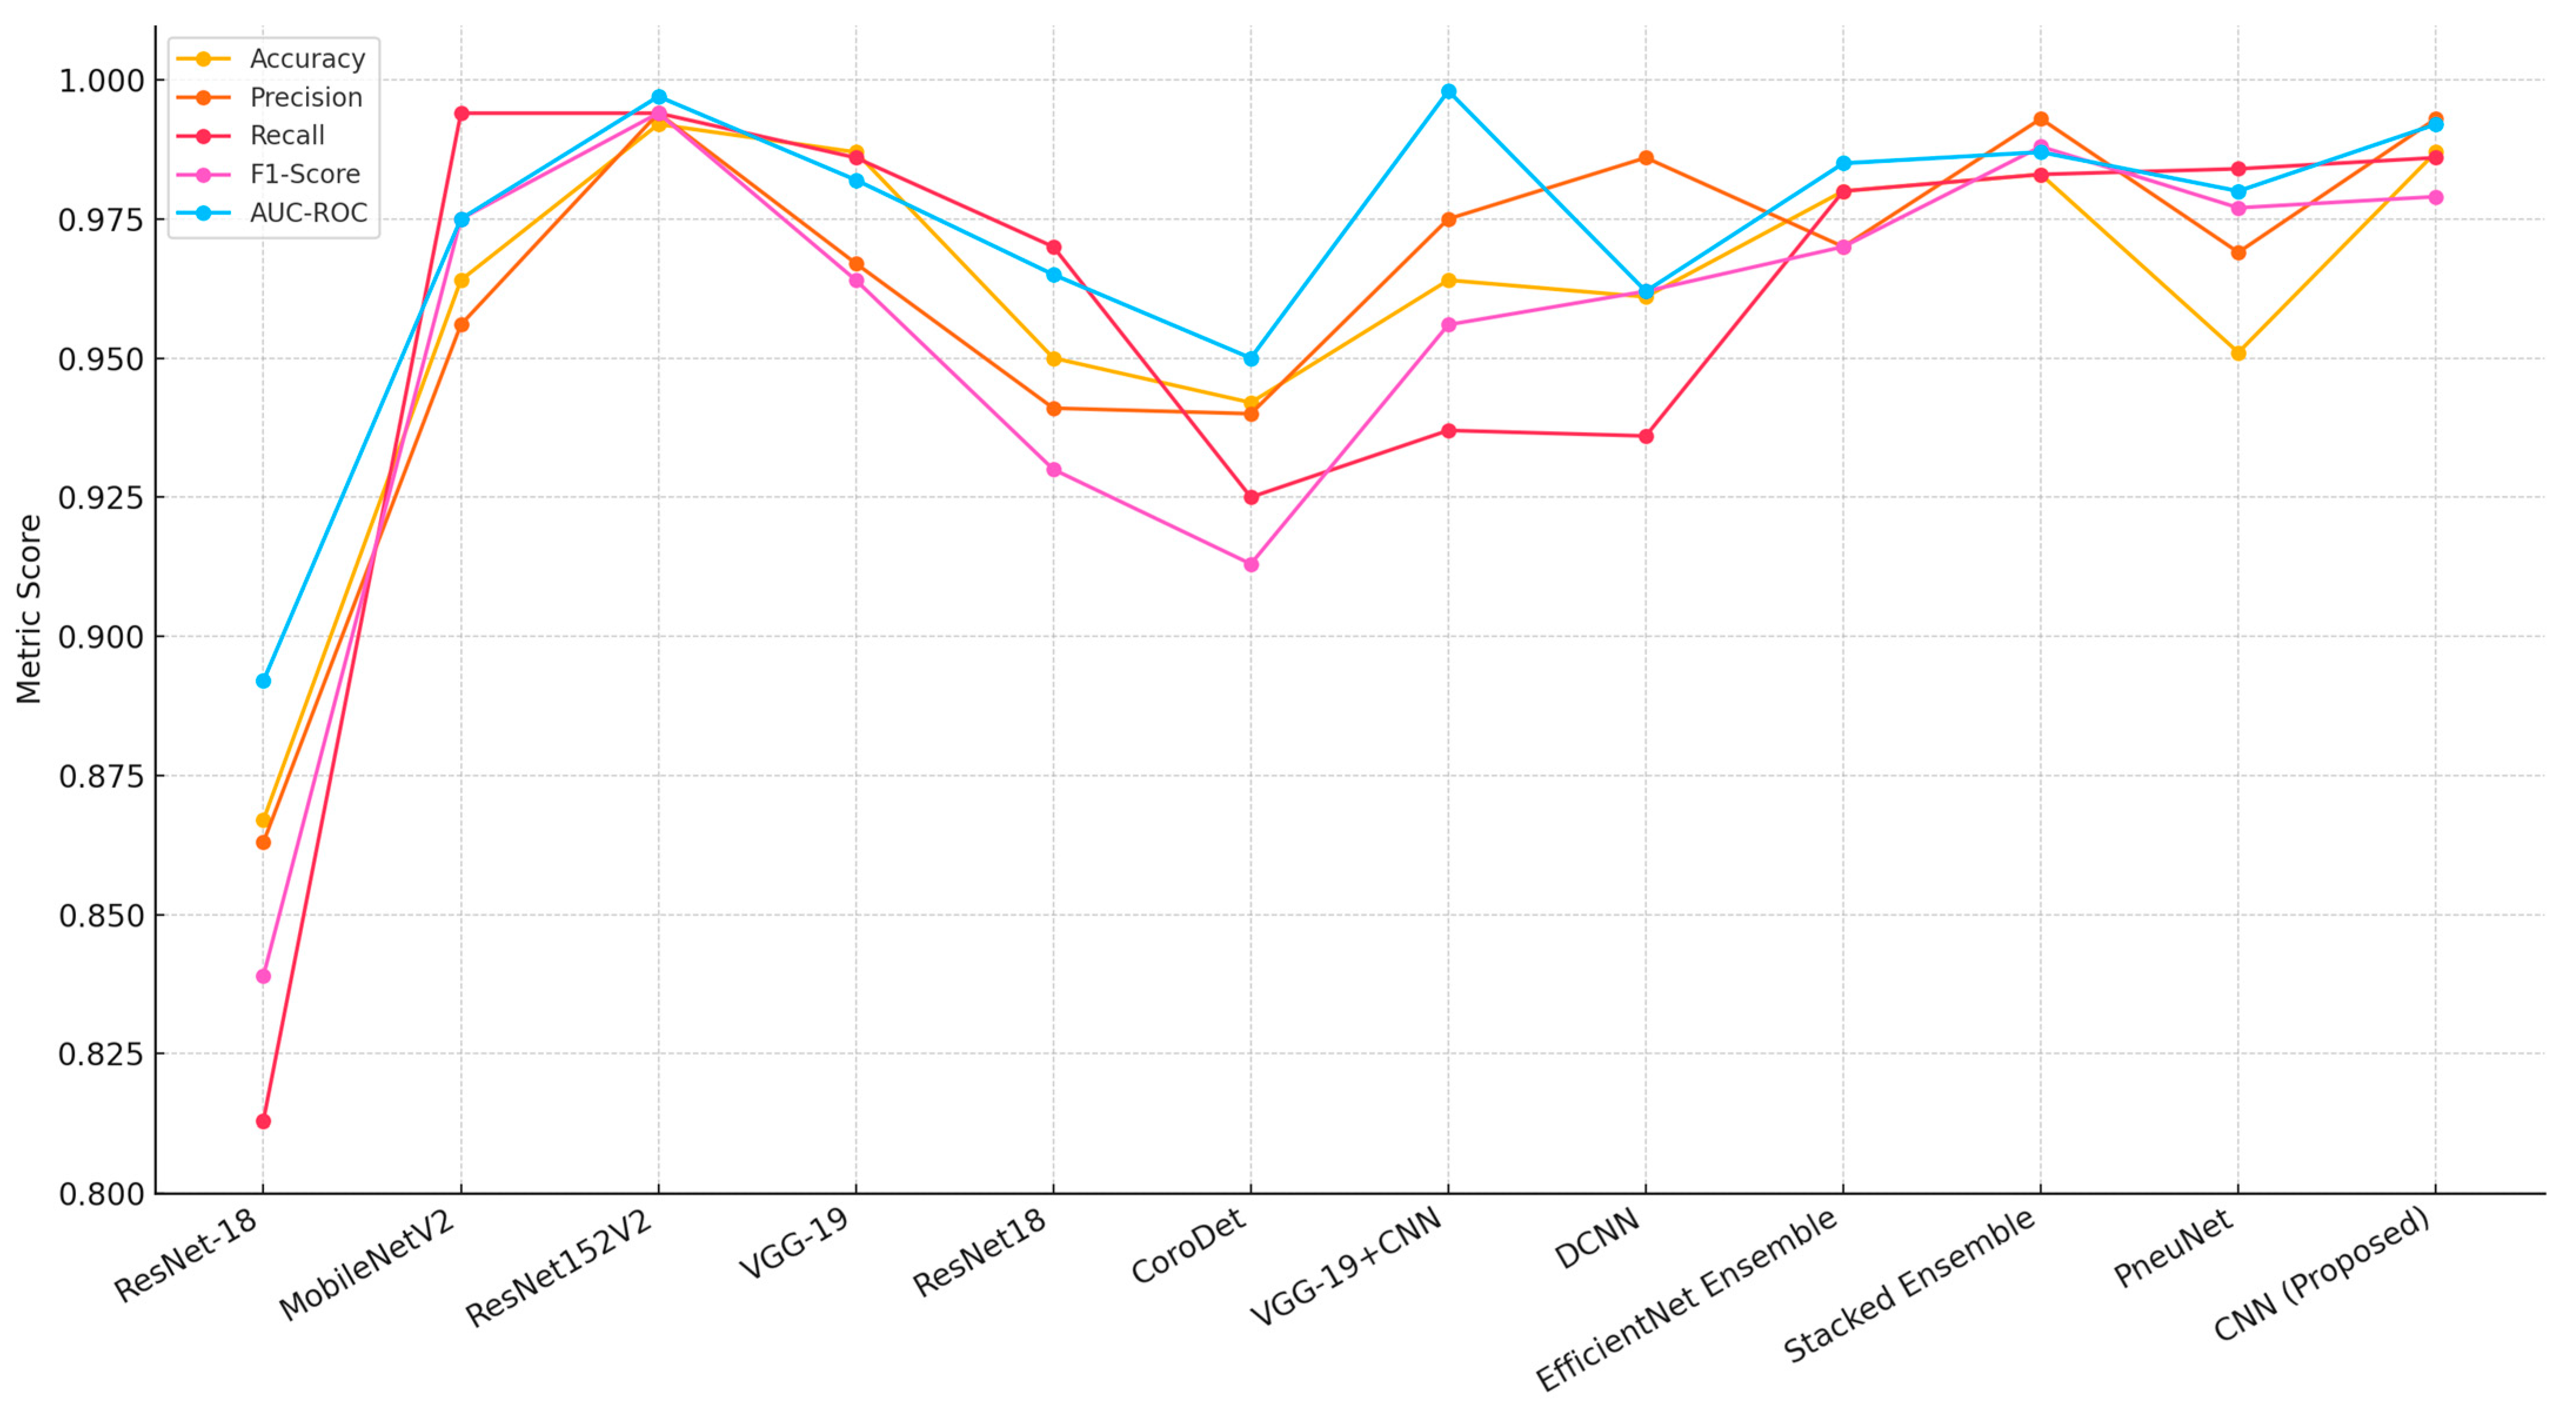
| Reference | Model | Accuracy | Precision | Recall | F1-Score | AUC-ROC | Imbalance Handling | Dataset and Task |
|---|---|---|---|---|---|---|---|---|
| Xu et al. [60] | ResNet-18 | 0.867 | 0.863 | 0.813 | 0.839 | 0.892 | Data augmentation | Chest X-Ray (Binary) |
| Elshennawy et al. [44] | MobileNetV2 | 0.964 | 0.956 | 0.994 | 0.975 | 0.975 | Data augmentation | Chest X-Ray (Binary) |
| Elshennawy et al. [44] | ResNet152V2 | 0.992 | 0.994 | 0.994 | 0.994 | 0.997 | Data augmentation | Chest X-Ray (Binary) |
| Apostolopoulos et al. [61] | VGG-19 | 0.987 | 0.967 | 0.986 | 0.964 | 0.982 | Transfer learning, augmentation | Chest X-Ray + Multi-Label (14 diseases) |
| Yoo et al. [62] | ResNet18 | 0.950 | 0.941 | 0.970 | 0.930 | 0.965 | Data augmentation | Chest X-Ray (Binary) |
| Hussain et al. [63] | CoroDet | 0.942 | 0.940 | 0.925 | 0.913 | 0.950 | Data augmentation | Chest X-Ray (Binary) |
| Alshmrani [64] | VGG-19+CNN | 0.964 | 0.975 | 0.937 | 0.956 | 0.998 | Weighted loss, augmentation | Chest X-Ray (Binary) |
| Yi et al. [56] | DCNN | 0.961 | 0.986 | 0.936 | 0.962 | 0.962 | Data augmentation | Chest X-Ray (Binary) |
| Ravi et al. [65] | Ensemble Learning (EfficientNet) | 0.980 | 0.970 | 0.980 | 0.970 | 0.985 | Ensemble, augmentation | Chest X-Ray + Multi-Label (5 diseases) |
| Prakash et al. [66] | Stacked Ensemble Learning | 0.983 | 0.993 | 0.983 | 0.988 | 0.987 | Ensemble, weighted loss | Chest X-Ray (Binary) |
| Wang et al. [67] | Vision Transformer (PneuNet) | 0.951 | 0.969 | 0.984 | 0.977 | 0.980 | Attention mechanism, augmentation | Chest X-Ray + Multi-Label (8 diseases) |
| Proposed model | CNN | 0.987 | 0.993 | 0.986 | 0.979 | 0.992 | Modified CLAHE | Chest X-Ray (Binary) |
| Dataset | Method | Evaluation | Accuracy | Precision | Recall | F1-Score |
|---|---|---|---|---|---|---|
| Chest X-Ray (Pneumonia) | Standard CLAHE CNN | Holdout | 93.5% | 92.6% | 92.3% | 93.1% |
| Original Image CNN | Holdout | 86.4% | 85.7% | 85.2% | 86.0% | |
| VGG-19 [61] | Holdout | 98.7% | 96.7% | 98.6% | 96.4% | |
| EfficientNet Ensemble [65] | Holdout | 98.0% | 97.0% | 98.0% | 97.0% | |
| Modified CLAHE CNN | Holdout | 98.7% | 99.3% | 98.6% | 97.9% | |
| Modified CLAHE CNN | Five-fold CV | 98.5 ± 0.4% | 99.1 ± 0.3% | 98.4 ± 0.5% | 97.7 ± 0.4% |
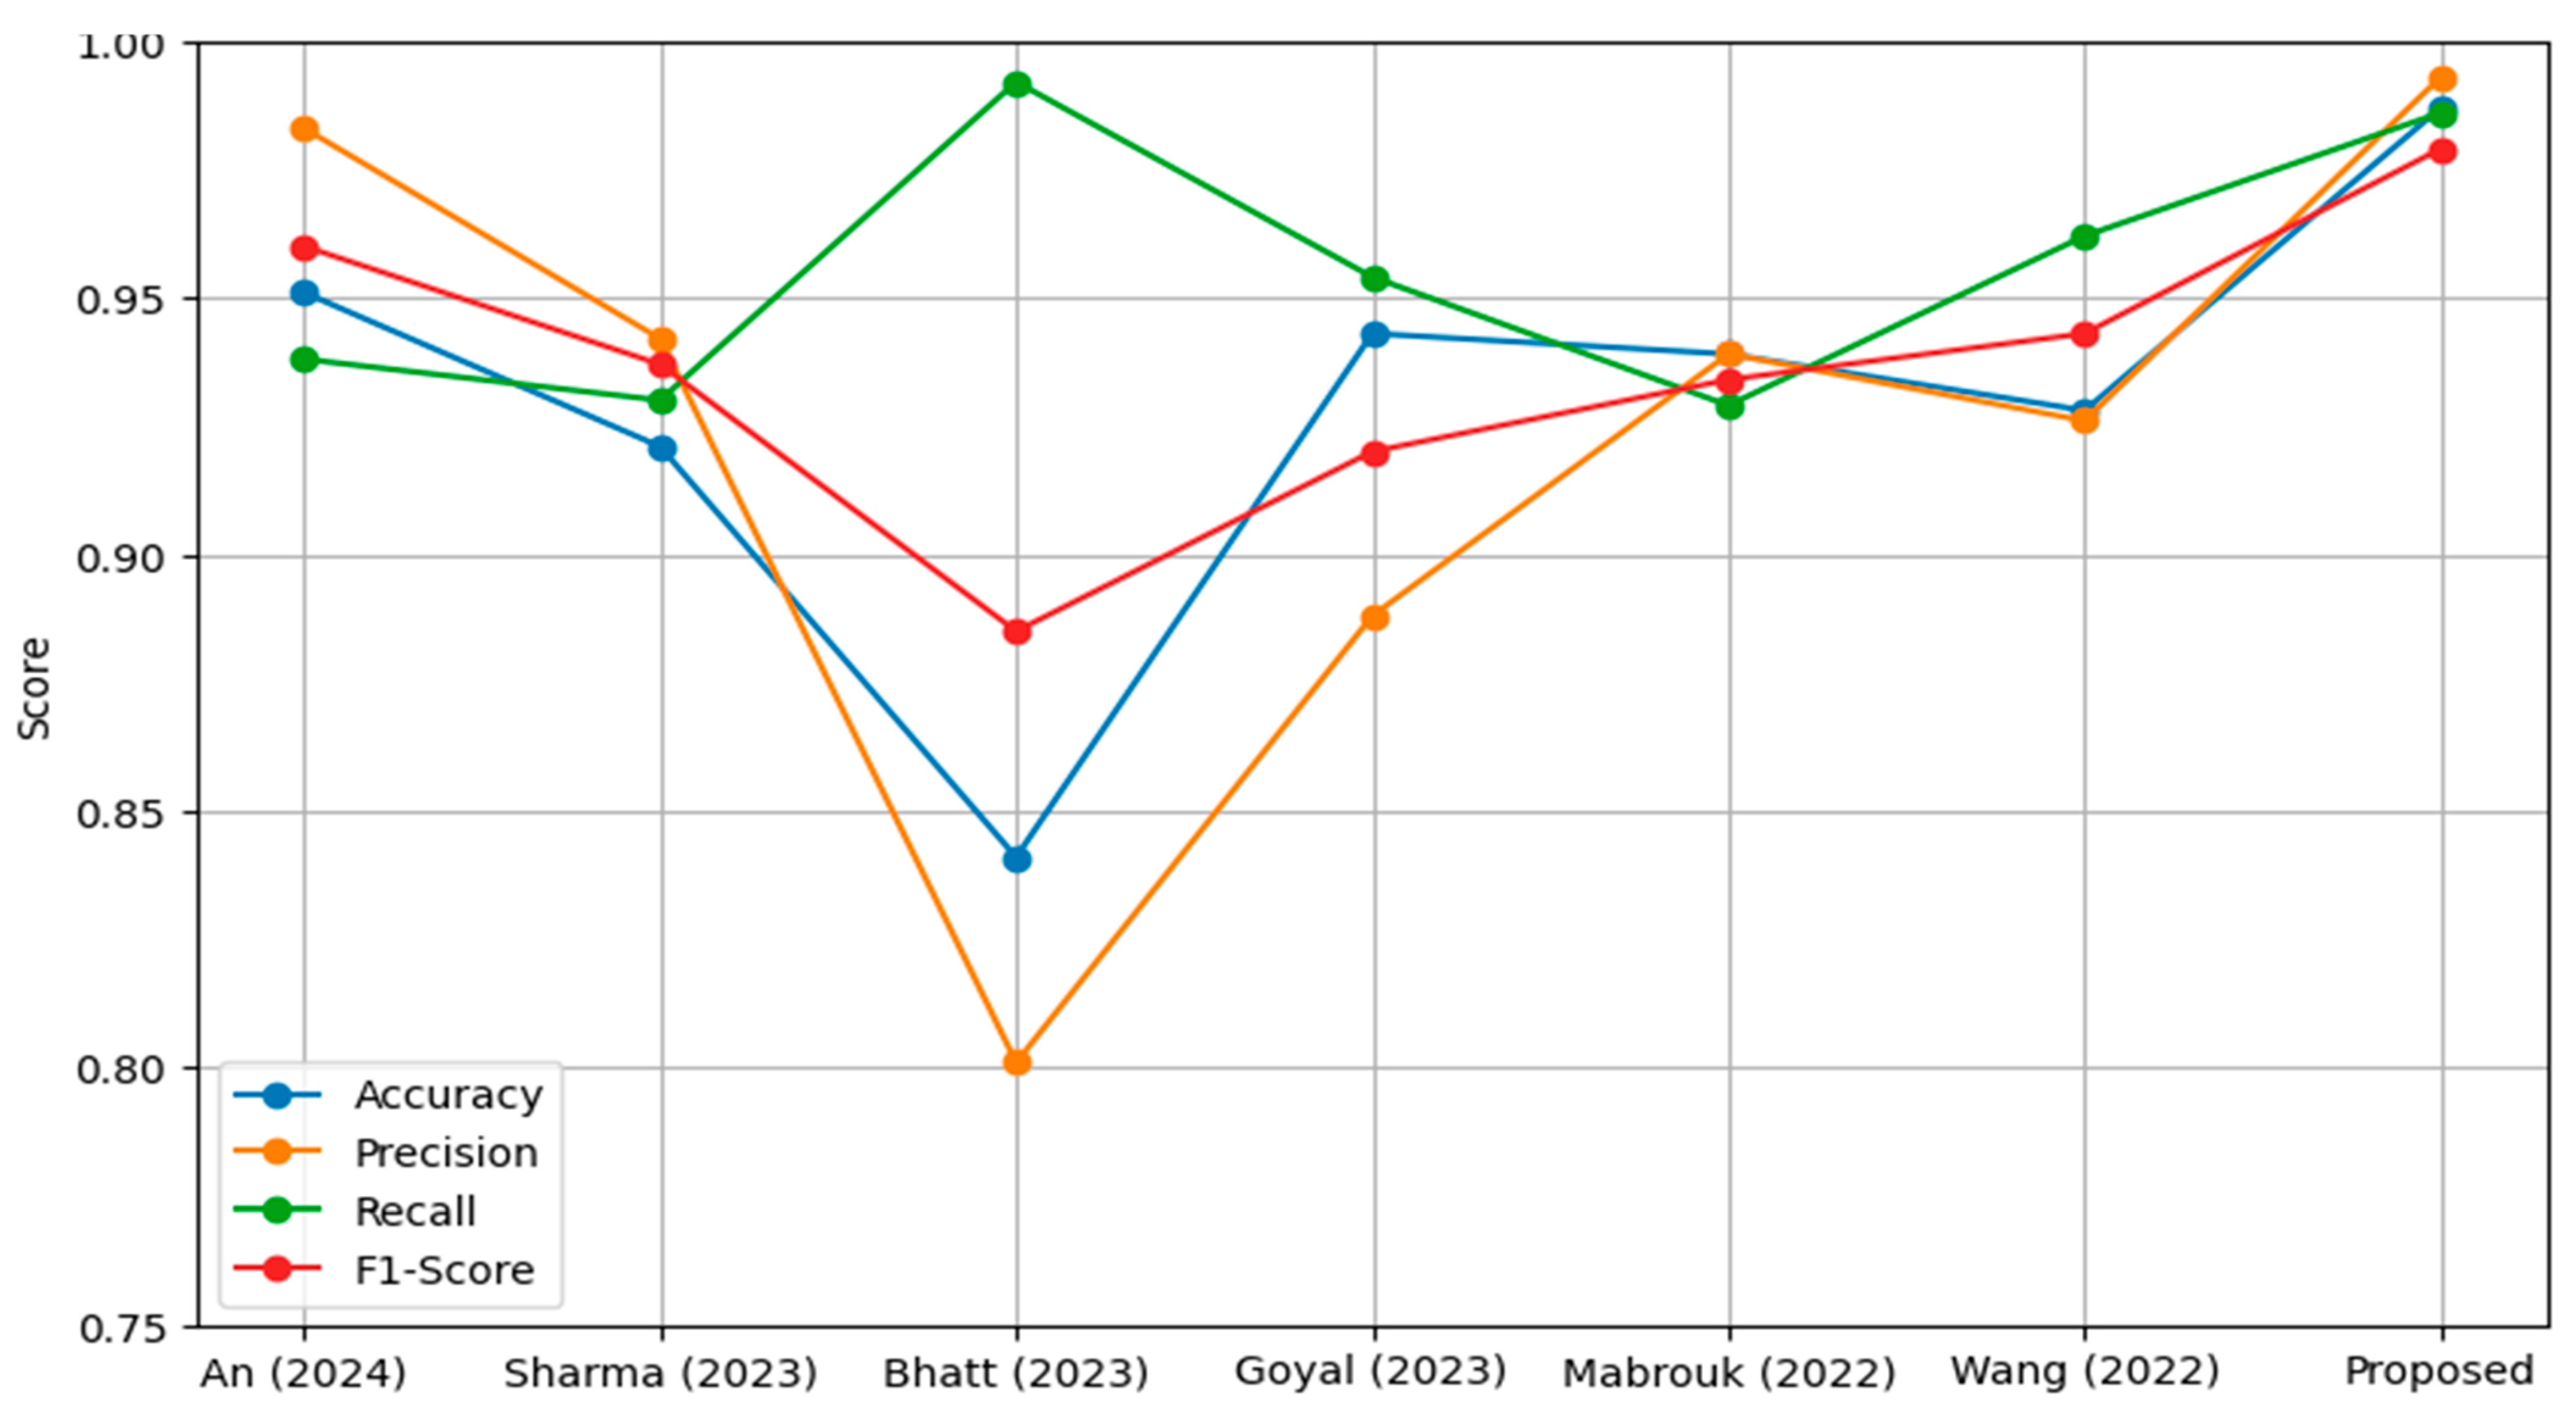
| Reference | Accuracy | Precision | Recall | F1-Score |
|---|---|---|---|---|
| An et al. [69] | 0.951 | 0.983 | 0.938 | 0.960 |
| Sharma et al. [70] | 0.921 | 0.942 | 0.930 | 0.937 |
| Bhatt et al. [71] | 0.841 | 0.801 | 0.992 | 0.885 |
| Goyal et al. [72] | 0.943 | 0.888 | 0.954 | 0.920 |
| Mabrouk et al. [73] | 0.939 | 0.939 | 0.929 | 0.934 |
| Wang et al. [74] | 0.928 | 0.926 | 0.962 | 0.943 |
| Proposed model | 0.987 | 0.993 | 0.986 | 0.979 |
Disclaimer/Publisher’s Note: The statements, opinions and data contained in all publications are solely those of the individual author(s) and contributor(s) and not of MDPI and/or the editor(s). MDPI and/or the editor(s) disclaim responsibility for any injury to people or property resulting from any ideas, methods, instructions or products referred to in the content. |
© 2025 by the authors. Licensee MDPI, Basel, Switzerland. This article is an open access article distributed under the terms and conditions of the Creative Commons Attribution (CC BY) license (https://creativecommons.org/licenses/by/4.0/).
Share and Cite
Shavkatovich Buriboev, A.; Abduvaitov, A.; Jeon, H.S. Binary Classification of Pneumonia in Chest X-Ray Images Using Modified Contrast-Limited Adaptive Histogram Equalization Algorithm. Sensors 2025, 25, 3976. https://doi.org/10.3390/s25133976
Shavkatovich Buriboev A, Abduvaitov A, Jeon HS. Binary Classification of Pneumonia in Chest X-Ray Images Using Modified Contrast-Limited Adaptive Histogram Equalization Algorithm. Sensors. 2025; 25(13):3976. https://doi.org/10.3390/s25133976
Chicago/Turabian StyleShavkatovich Buriboev, Abror, Akmal Abduvaitov, and Heung Seok Jeon. 2025. "Binary Classification of Pneumonia in Chest X-Ray Images Using Modified Contrast-Limited Adaptive Histogram Equalization Algorithm" Sensors 25, no. 13: 3976. https://doi.org/10.3390/s25133976
APA StyleShavkatovich Buriboev, A., Abduvaitov, A., & Jeon, H. S. (2025). Binary Classification of Pneumonia in Chest X-Ray Images Using Modified Contrast-Limited Adaptive Histogram Equalization Algorithm. Sensors, 25(13), 3976. https://doi.org/10.3390/s25133976