1. Introduction
The objective of simulated (sim) racing is to mimic the experiences produced by real-world racing in a virtual environment. The similarities between real-world and sim are evidenced by the participation of F1 drivers, such as Max Verstappen and Lando Norris, in sim racing events, and their use of simulated racing equipment to hone their skills when unable to race on a physical racing track [
1] (pp. 156–157). Moreover, professional sim racing teams now have engineers working alongside them to optimise every facet of performance [
2].
Sim racing has surged in popularity in recent years, which can be seen by its expanding user base and increase in competition event viewership [
3]. By way of example, the all-time peak player count for the F1 series of games has increased from 8085 in 2017 to 23,763 in 2022 [
4]. iRacing also boasts an estimated 133,000 monthly players on their online service as of December 2023 [
5]. This popularity and worldwide attention has led to an increased appetite to better understand the elements of sim racing performance, specifically those related to the racer and equipment (both hardware and software).
Although a plethora of research exists in simulated driving [
6,
7,
8], simulated racing differs in that it is competitive [
9] and racers must operate the virtual vehicle to navigate tracks at the highest attainable speeds [
10]. Research in sim racing performance is in its infancy, with few studies published to date (e.g., [
11,
12,
13,
14]). Among the early research is the seminal work by Hojaji and colleagues [
15], which leveraged data analytics and machine learning techniques to uncover the most influential in-game telemetric parameters for sim racing performance across different levels of racer expertise. This identification of key performance metrics in sim racing is among early work using artificial intelligence to understand how to optimise performance in gaming and esports [
16]. As the steering wheel and pedal set represent the two inputs through which racers interact with the game, it is logical that key performance indicators relating to steering and braking behaviour were found to be among the most influential to performance. For braking, Remonda and colleagues [
17] concluded that braking is the most impactful skill to improve the quality of lap times in their study of sim racing using machine learning, given that both their AI model and human participants took many more laps to learn how to brake efficiently. In the study by Hojaji and colleagues, faster drivers were specifically found to apply greater brake amplitudes across braking events over a lap and exhibited longer trail braking durations (a technique used to better rotate the vehicle in slower speed corners [
18]) in corner sections [
15]. Additional important braking indicators include the time taken to reach peak brake amplitude and total braking duration [
19]. Given the importance of braking related behaviours in simulated racing, it is also important to better understand how brake pedal sensor design in simulated racing setups might influence performance.
There are many brakes available on the sim racing market today, each differing according to the type of sensors they use to convert the mechanical input from the foot to an analogue or digital signal [
20] in the game to decelerate the virtual car. Many entry level pedal systems use potentiometers, but, recently, Hall-effect sensors (referred to as “Hall sensor” hereafter) have become more widely explored as they are a non-contact sensor with increased durability (
Supplementary Figure S1a,b). Hall sensors work by applying a magnetic field perpendicularly to a conductive material that carries a current from one of its ends to another (see
Supplementary Figure S2). The current produces a force called the Lorentz force [
21], which can be converted to, and is measured as, a voltage. In a sim racing Hall sensor brake pedal, a magnet is placed on the pedal shaft (
Supplementary Figure S1a), and when the brake pedal is pressed, the magnet moves relative to the fixed Hall sensor at the bottom of the shaft (
Supplementary Figure S1b). The magnet’s movement creates variations in the strength of the magnetic field that the Hall sensor detects. The stronger the magnetic field (i.e., the more the pedal has travelled and closer the magnet is to the Hall sensor), the greater the amplitude of braking applied. This technology is being used in electronic accelerator pedals in road cars [
22].
One proposed limitation of Hall sensors is that they solely measure the angular distance that the brake travels [
21], whereas, in real-world vehicles, electro-hydraulic brake systems detect the amount of force applied to the brake [
23]. The need for more “realistic” braking mechanisms in sim racing has led to the implementation of force-based sensors. The sensor that is currently used in most mid-range braking systems is the load cell sensor (
Supplementary Figure S3). The load cell consists of a strain gauge that is connected to an elastic spring element comprising aluminium or steel [
24]. As force or strain is applied, the spring element deforms (Poisson effect), which alters the resistance of the strain gauge. In the context of the sim racing brake pedal, as force is applied to the brake, the spring element that is placed at the bottom of the brake shaft deforms (
Supplementary Figure S3), registering a change in voltage that can be measured and calibrated in-game to decelerate the virtual car. The behaviour of the load cell brake more closely mimics real-world braking and is thought to create a more realistic and immersive experience for the sim racer [
25], although this is yet to be proven. Moreover, load cell brakes are more costly to manufacture (e.g., 100 kg load cells range from GBP 153 to GBP 1040 [
26] compared with prices ranging from GBP 0.42 to GBP 18.64 for Hall sensors [
27]) and less durable compared with Hall sensors. To date, no research has examined whether sim racing performance is superior when using either of these brake sensors.
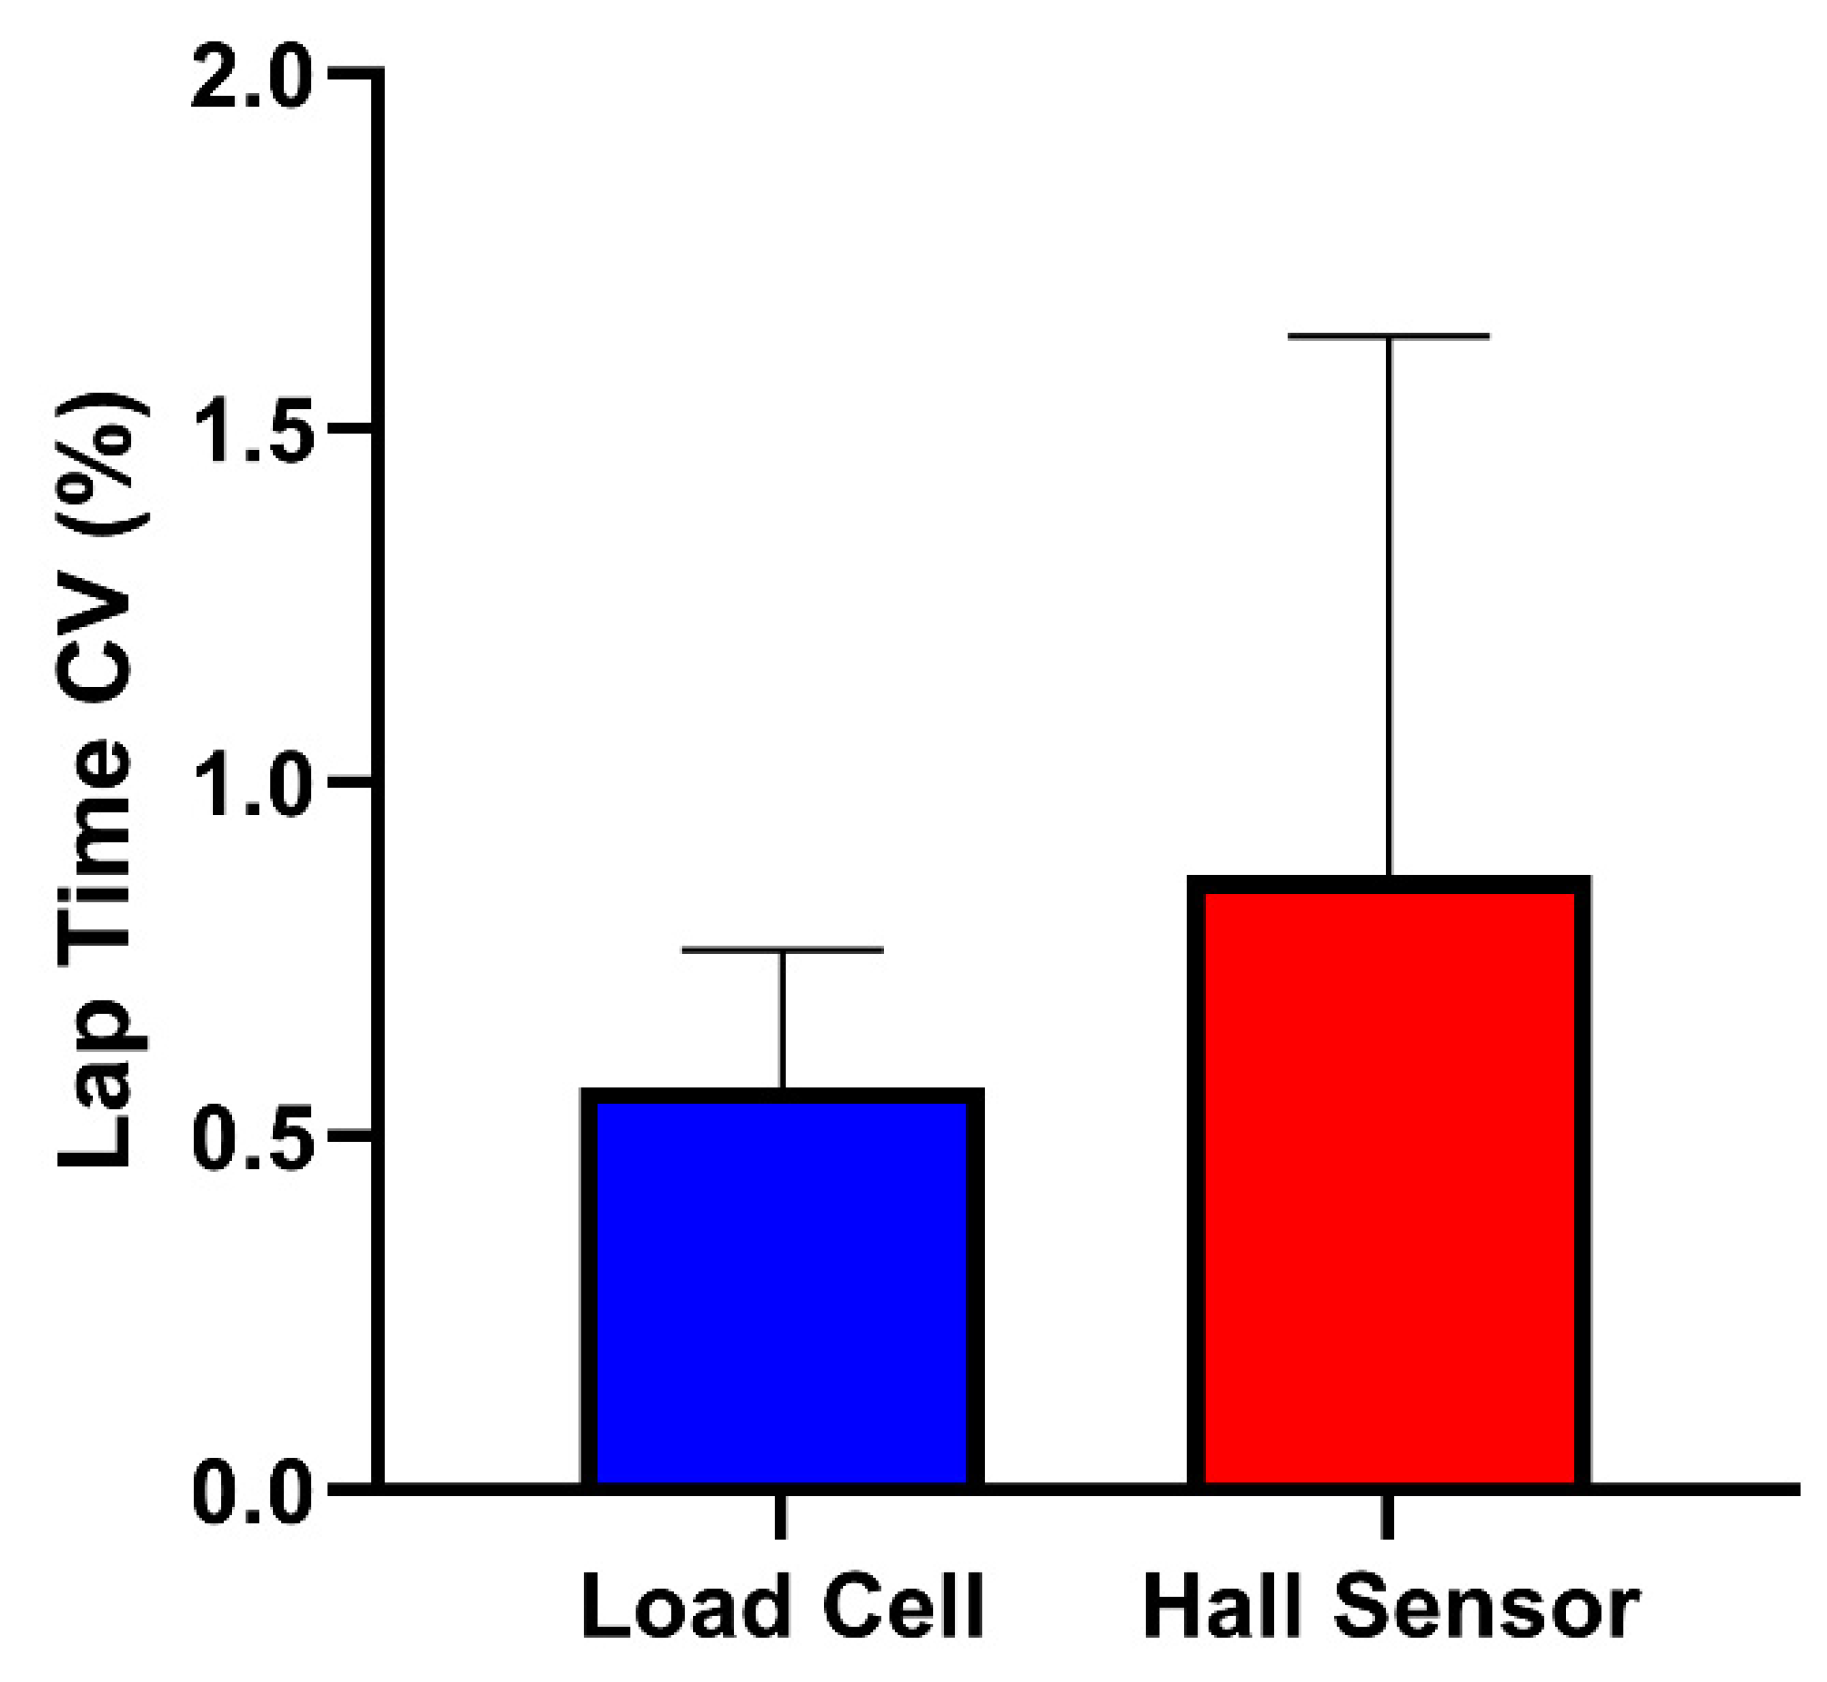
The purpose of this study is to compare the sim racing performance and braking behaviour characteristics of participants when using load cell and Hall sensor brakes, under conditions where the Hall sensor is calibrated to mimic load cell behaviour. Firstly, we hypothesise that overall performance will differ when racing using the two brake sensors. This will be evidenced by a difference in average and fastest lap times between brake sensors. Secondly, we hypothesise that the consistency of lap time performance will differ between the two brake sensors. This will be evidenced by a difference in the lap time coefficient of variation (CV) between brake mechanisms. CV is a widely used metric to quantify within-subject variation in behavioural and sports science studies [
28,
29]. Thirdly, we hypothesise that braking behaviour will differ between the two sensors. This will be evidenced by observing a difference in average brake amplitudes (BAs), trail braking durations (TBDs), time to peak brake (TPB), and overall braking durations (BDs) between brake sensors. Fourthly, we hypothesise that the consistency of these measures will differ between the two brake sensors. This will be evidenced by a difference in CVs between brake sensors for BA, TBD, TPB, and BD. Lastly, we hypothesise that participants will be unable to distinguish between the brake sensors based on how they feel under foot and respond in-game, and be unable to correctly distinguish between the load cell and Hall sensor brakes following the conclusion of testing.
2. Materials and Methods
2.1. Participants
Twenty (N = 20) participants (age 21.45 ± 3.61; mean ± SD) with prior sim racing experience were recruited from a university population and the surrounding region. Participants had 3.89 ± 1.82 years of sim racing experience and played sim racing games for 6.20 ± 5.89 h per week. Participants reported having no neuropsychological and neuromuscular disorders and provided informed written consent prior to participation. Approval for this study was authorised by the research ethics board (2024_12_13_EHS) at the University of Limerick in accordance with the Declaration of Helsinki.
2.2. Materials
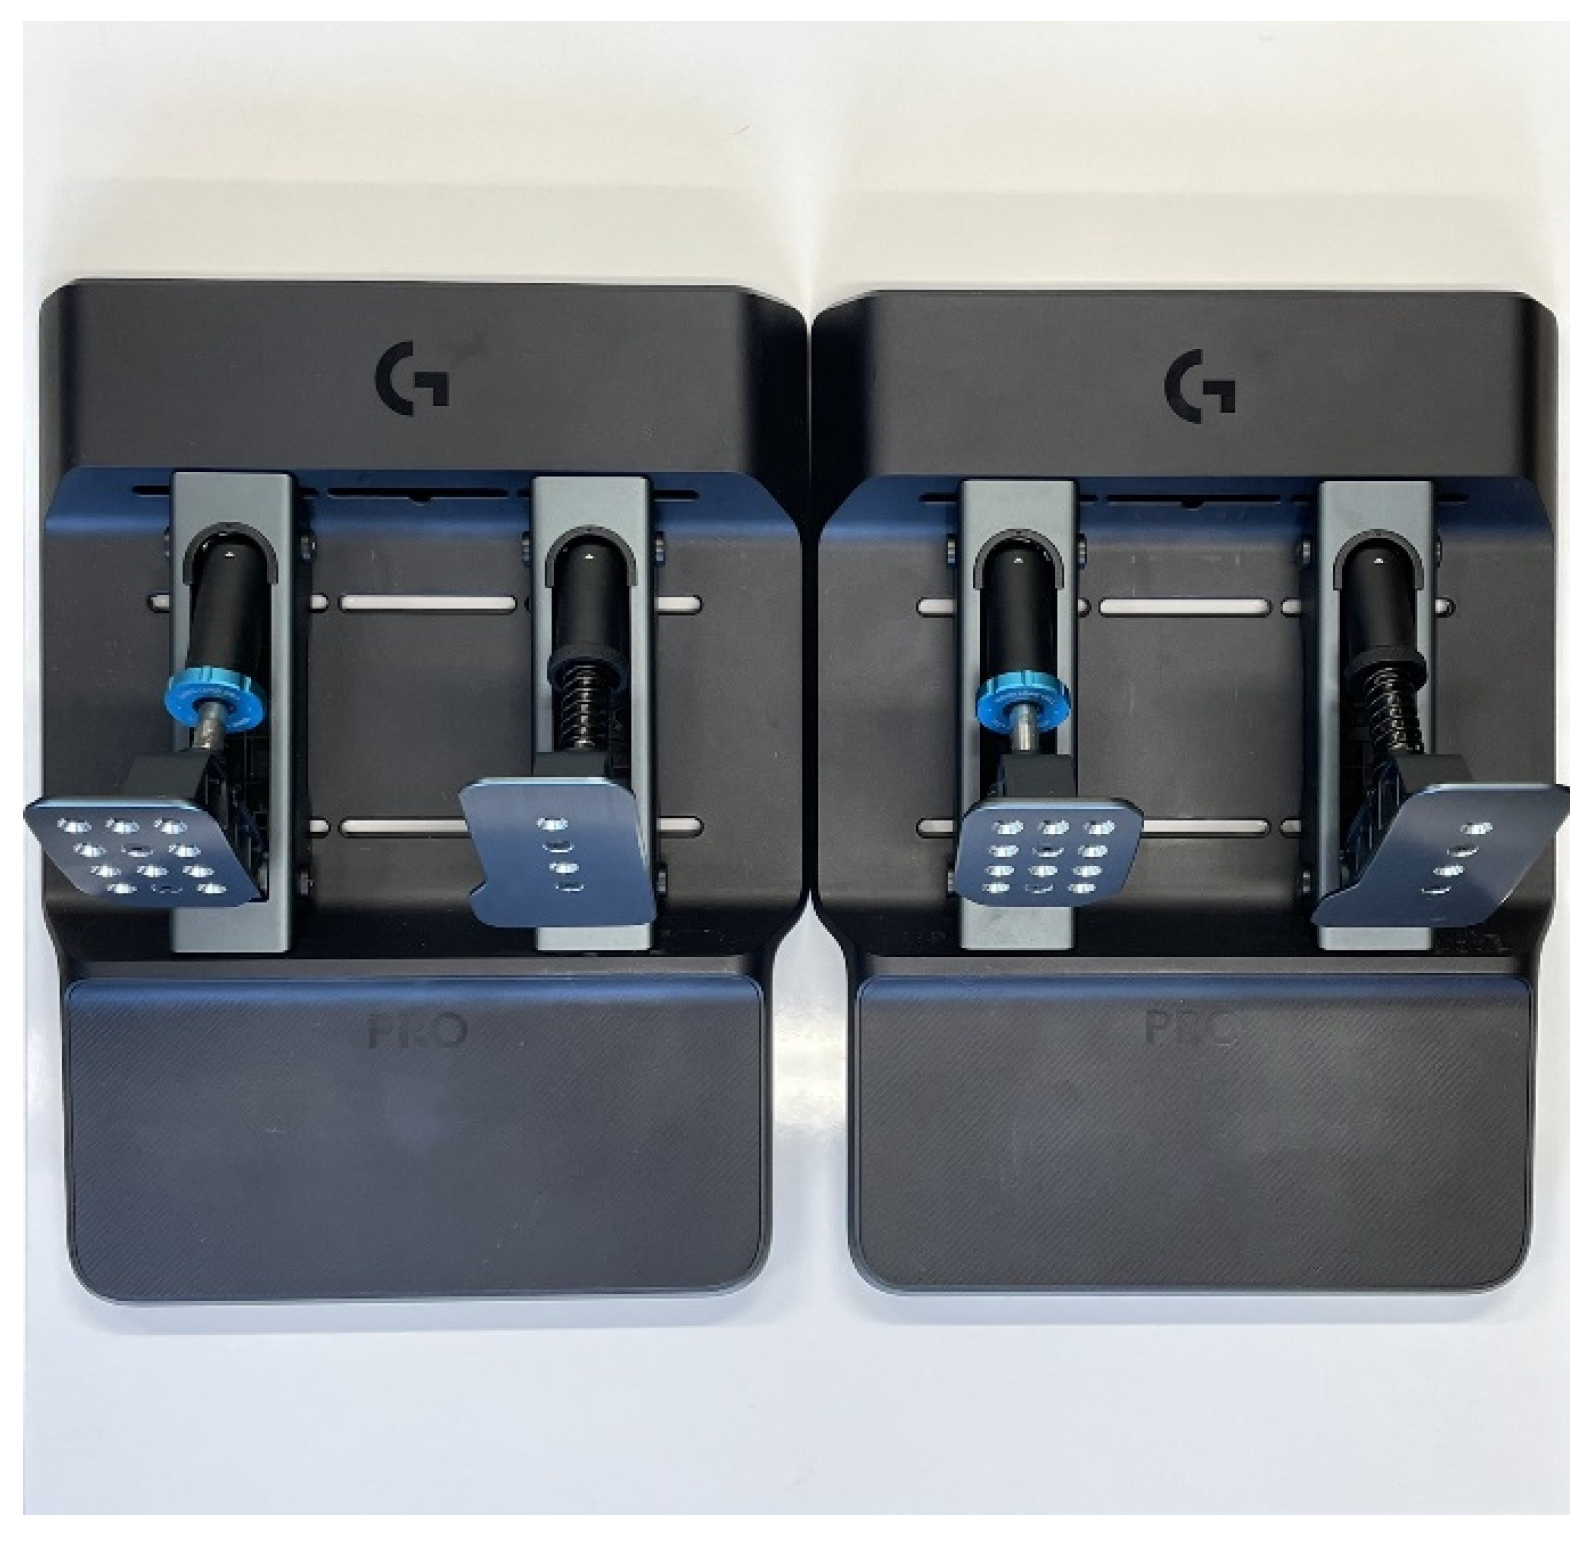
Participants raced on the Brands Hatch circuit with the McLaren 720 s GT3 car using the racing game Assetto Corsa Competizione (Kunos Simulazioni; Rome, Italy) (v1.9.6). The game was run at 120 Hz on a 32-inch monitor (MSI; New Taipei City, Taiwan). Participants sat in a sim racing rig (Sim Race Components; Milan, Italy) with a Logitech G Pro wheelbase (Logitech; Lausanne, Switzerland). Two Logitech G Pro pedal bases, identical in appearance (
Figure 1), were used in this study. Each had a throttle and brake, with the default load cell brake on one and the clutch pedal (which relies on a Hall sensor) on the other. Due to the sensors used in the Logitech pedals being proprietary in nature, no sensor specifications were readily available, therefore we used the DXTweak2 program [
30] to calculate the resolutions of each sensor. The load cell sensor utilises a strain gauge and uses a 12-bit rate (4096 values) for gaming. The maximum load the sensor can withstand is 100 kg, which equates to 24 g per bit. The Hall sensor is also 12-bit (4096 values), with 25 degrees of rotation equating to 0.006 degrees per bit.
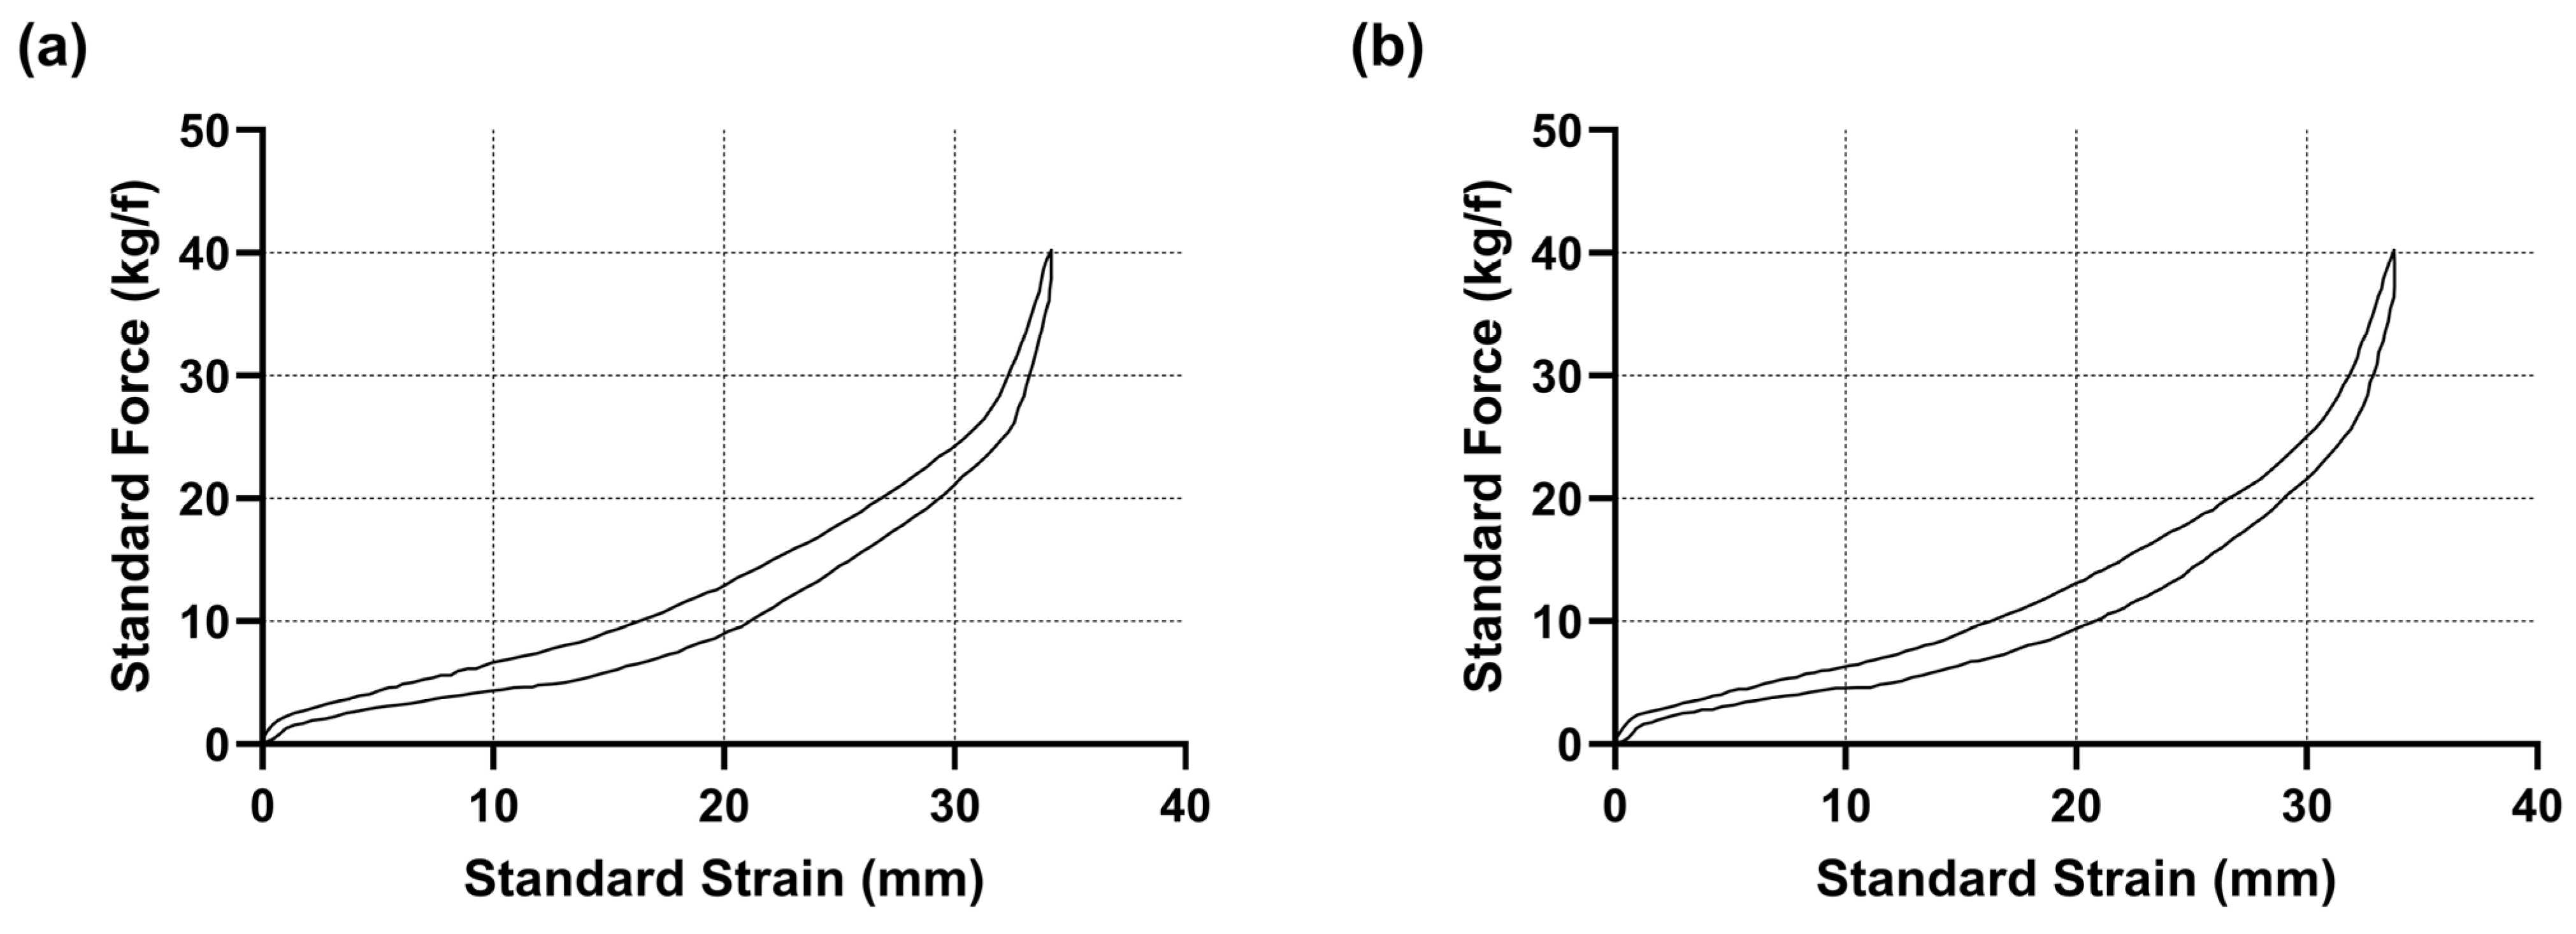
To ensure that both the load cell and Hall sensor brakes were mechanically identical, we adapted the clutch pedal on the second pedal base. The spring mechanism from the clutch pedal was removed and replaced with a load cell piston (see
Supplementary Figure S4). This also ensured that the pedal sets were visually identical. Within the load cell piston, elastomers were placed to alter the amount of travel the pedal experiences when subjected to a given force. The same combination of elastomers (allowing 24 mm travel as marketed by Logitech) was placed in both the load cell and Hall sensor pistons, and a uniaxial force–displacement machine (ZwickRoell Ltd.; Worcester, UK) was used to depress the brake pedals at a constant velocity until the brakes were fully depressed. The resultant loads were measured with Grade1/0.5 ISO 7500-1 [
31] accuracy load cells. The load cells were set to zero prior to contact with the pedals, regardless of approach displacement, and force was measured from the initial pedal face contact. During this process, the force–travel curve for each brake sensor was recorded to verify their similarity (
Figure 2).
To mimic load cell brake behaviour on the Hall sensor, we altered the way in which the Hall sensor brake converted the physical input from the racer to in-game brake amplitudes using a custom Python program. This Python script converted force values for the load cell brake to travel values for the Hall sensor brake based on the corresponding brake force and elastomer combination (corresponding to 38 kg of braking force and 24 mm travel elastomers). For example, to achieve 20 kg of brake force with this elastomer combination, 19.3 mm of travel in the brake is required. Therefore, 19.3 mm of travel on the Hall sensor brake would correspond to 20 kg of brake force.
Both the load cell and Hall sensor brakes were calibrated using Logitech’s “G-HUB” software (v.2024.3.553733) [
32]. This allowed us to set the load cell sensor to 38 kg of force (i.e., 38 kg of pressure is needed to reach maximum braking. Following the conversion of force values to travel values on the Hall sensor, we used this software to check whether the Hall sensor was responding in-line with the load cell brake. The brakes were also calibrated in-game to ensure that they were reaching maximum braking response prior to each participants’ data collection.
Telemetry data were captured using MoTeC i2 Pro software at a sample rate of 50 Hz (MoTeC; Croydon South, Australia) (v.1.1.5.0085), from which performance and braking metrics could be calculated. A shared-memory program was run in parallel with MoTeC i2 Pro software, which facilitated the detection and exclusion of invalid laps (where all four wheels of the car have exceeded track limits).
2.3. Protocol
After providing their informed consent, participants filled out a demographics questionnaire that gathered information about participants’ sim racing experience and sim racing setups. Participants were then randomly assigned a brake sensor order and completed 14 laps around the Brands Hatch circuit in a McLaren 720 s GT3, where they were instructed to produce fast but clean (keeping the car on track) lap times with the first brake sensor condition. Participants used the first 7 laps to familiarise themselves with the track and car, while telemetry data from the last 7 laps were recorded for analysis. After completing 14 laps using the first brake sensor, each participant was asked to briefly leave the lab. During this time, the experimenter switched out the pedal bases on the sim racing rig. For the second brake condition, participants drove 7 laps around the track. Ten participants raced using the load cell brake first and the Hall sensor second, while another ten were exposed to the opposite order. Participants were asked questions related to their perception of the two conditions both during and after the completion of the conditions (see
Table 1). Question 1 was asked following the completion of each condition, while questions 2–5 were asked at the end of the session following the completion of both conditions. Questionnaire responses can be found in
Supplementary File S1. A graphical representation of the protocol can be seen in
Supplementary Figure S5.
2.4. Data Processing
Invalid laps and lap times that exceeded two standard deviations of the average lap time for a condition were excluded from further analyses. One participant’s data were completely excluded due to the fact they did not complete a valid lap in either condition. Data from 19 participants were carried forward for performance and braking behaviour analysis. Data from 14 participants were brought forward for consistency analyses as they achieved 3 or more valid laps in each condition. The average and fastest lap times were obtained from telemetry data for the load cell and Hall sensor brake conditions. Concerning the average lap time variable, each valid lap time for a participants was summed and averaged within a condition to obtain an accurate representation of a participant’s performance within that condition. Numerous braking behaviour metrics were calculated for each participant from the telemetry braking data. These calculations can be found in
Table 2.
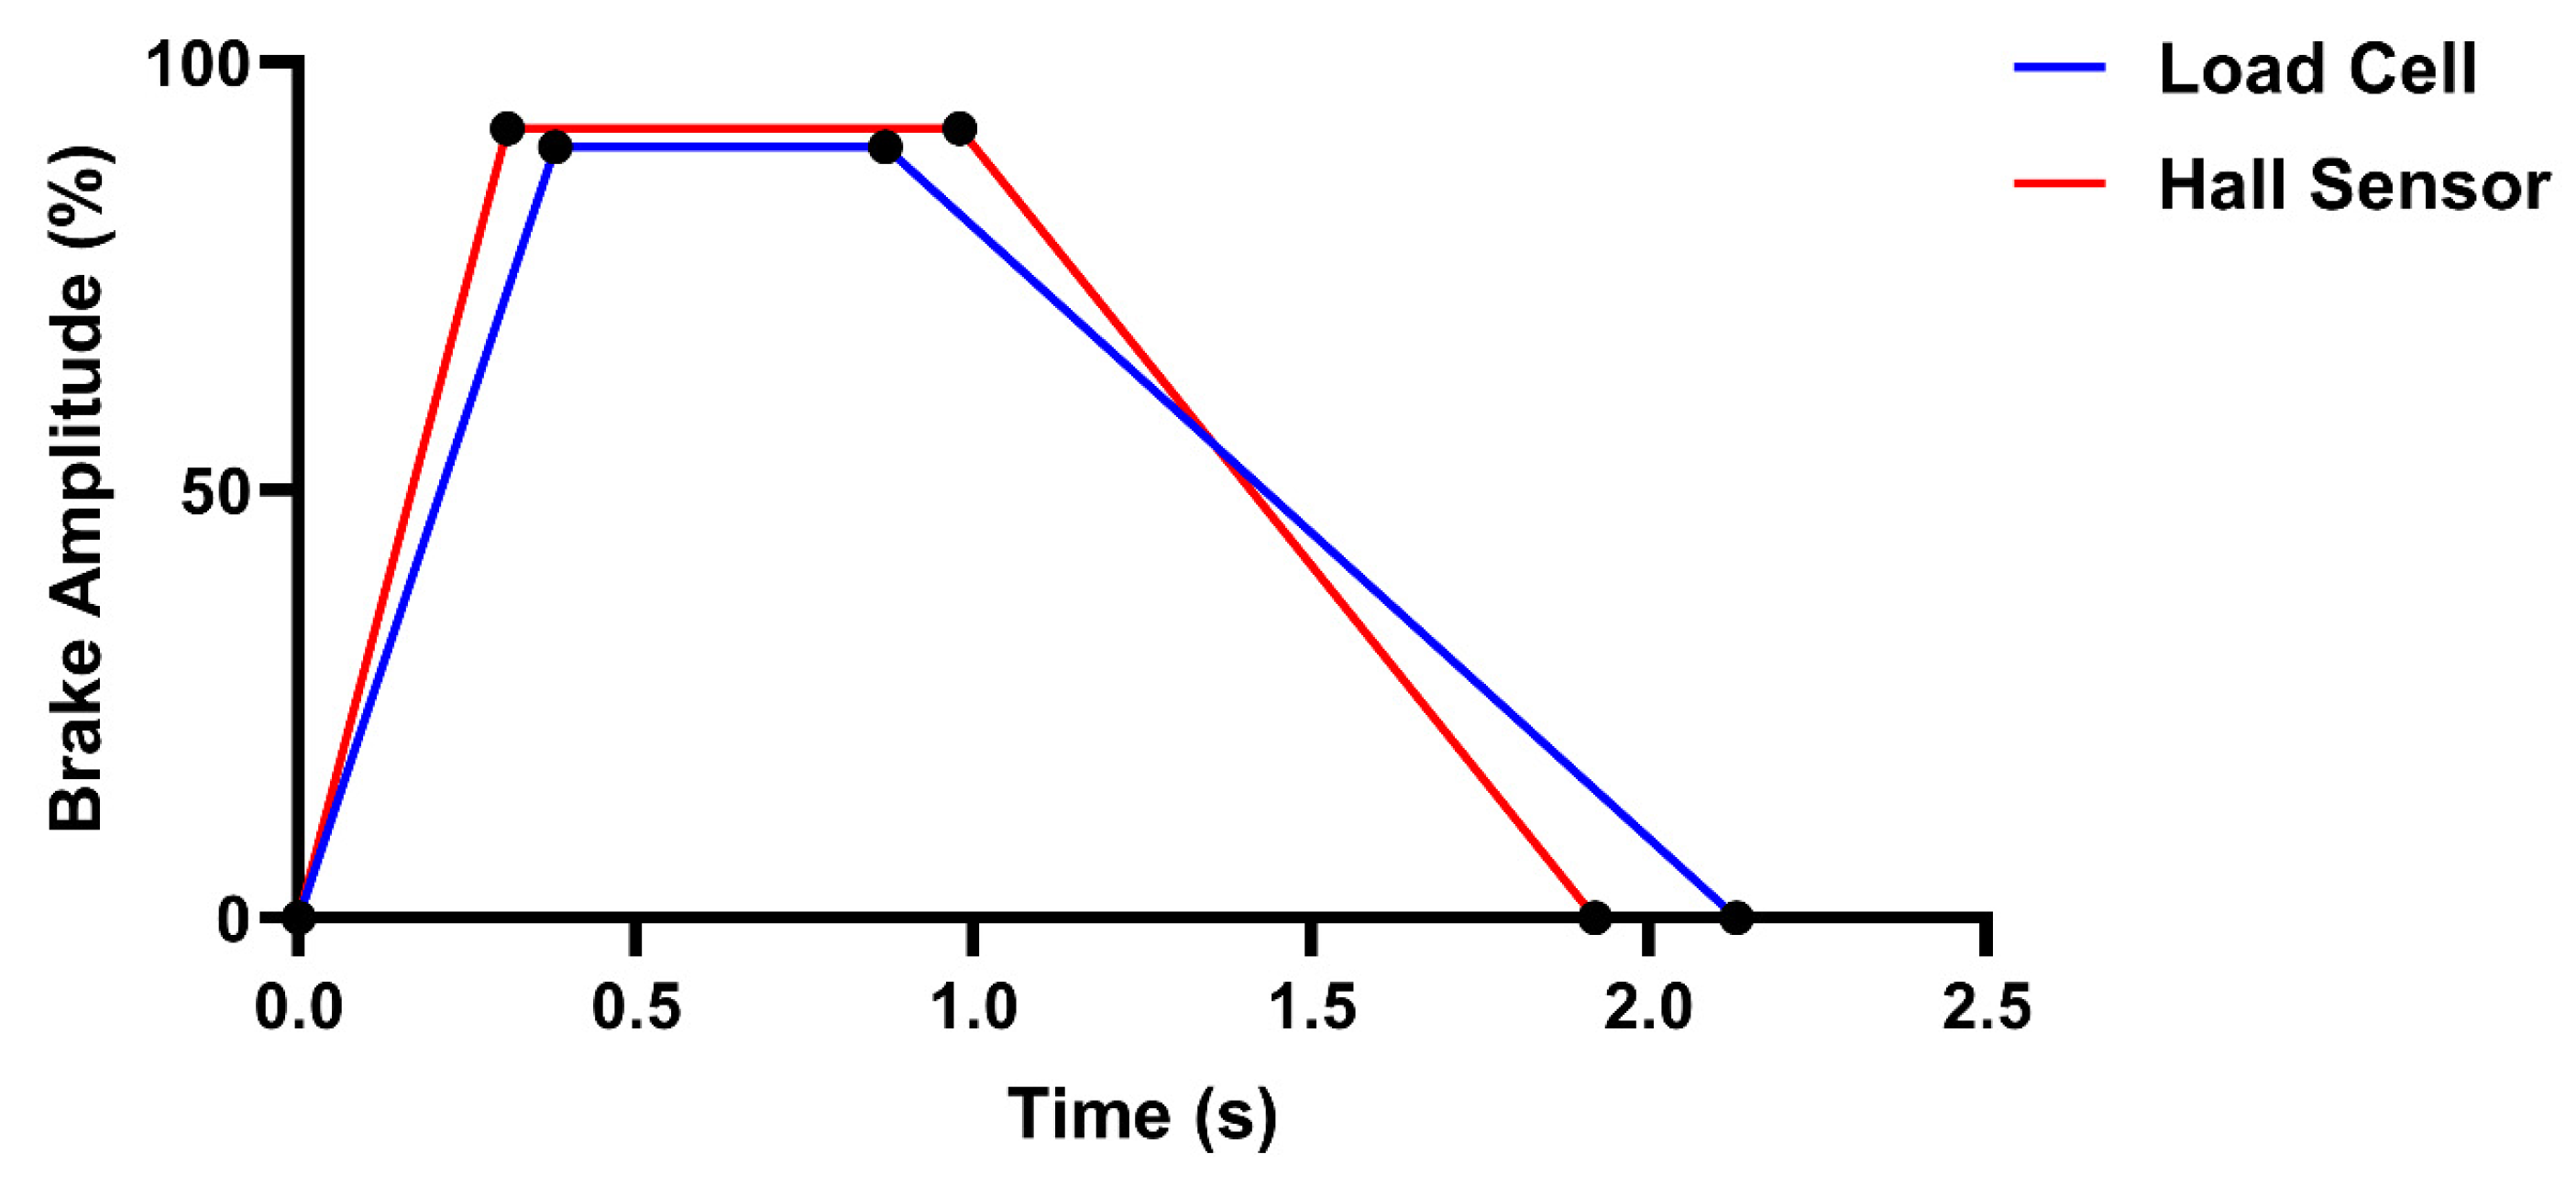
First, a braking event was defined as a window of non-zero braking amplitudes (%) that exceeded a peak amplitude of 10% with at least 100 frames of no braking amplitude either side. For each brake event, we defined the average brake amplitude (BA: average of all non-zero braking amplitudes), trail braking duration (TBD: the time taken to return to 0% braking amplitude from the last frame of the peak brake amplitude), time to peak brake (TPB: the time taken to reach maximum braking amplitude), and total brake duration (BD: total duration that the brake is applied). A visualisation of some of these metrics can be found in
Figure 3. Each of these metrics was averaged over all brake events within a lap before being subjected to analysis.
2.5. Data Analysis
SPSS v.28.0 (SPSS, Chicago, IL, USA, 2021) was used to perform statistical analyses. A Shapiro–Wilk test was carried out alongside the investigation of Q-Q and stem-and-leaf plots to check the normality of the data.
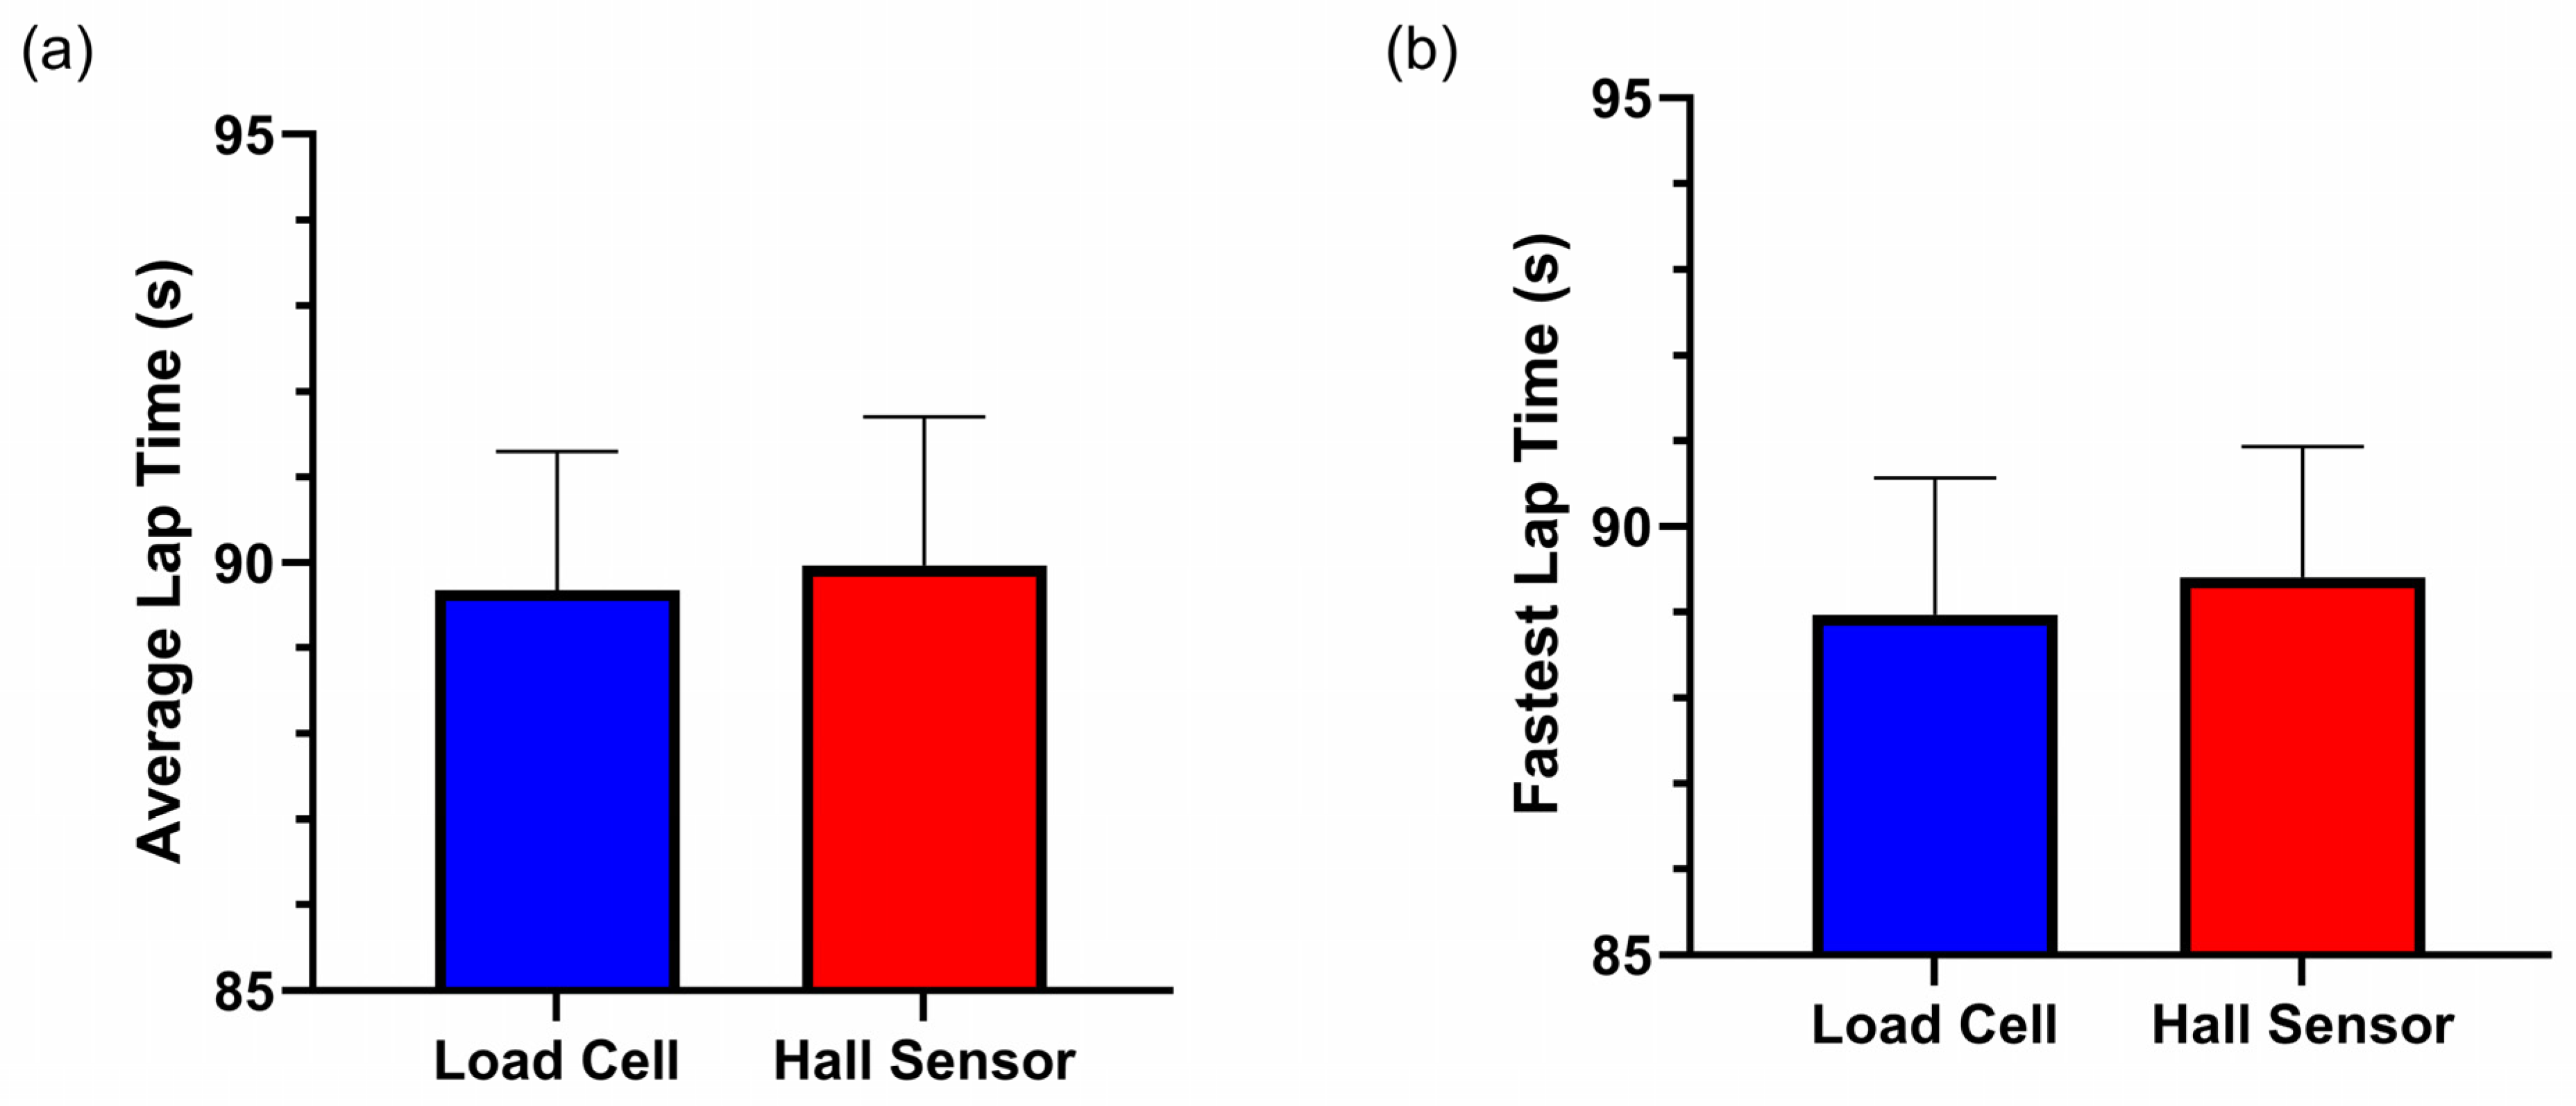
To investigate whether there was an effect of brake sensor condition on the overall performance of participants, we compared the fastest and average lap times by participants for each brake using paired samples t-tests.
To investigate whether the brake sensor condition influenced the performance consistency, a Wilcoxon signed-rank test was conducted on within-participants lap time CVs (coefficient of variations).
To investigate whether the brake sensor condition affected braking behaviour, paired samples t-tests were used to compare BA, TBD, TPB, and BD across brake sensor conditions.
To test whether there was an effect of brake sensor condition on the consistency of braking behaviour, we compared BA, TBD, TPB, and BD within-participant CVs across brake conditions using a Wilcoxon signed-rank test (lap time CV; BA CV) and paired samples t-tests (TBD CV; TPB CV; BD CV).
Finally, to investigate whether participant responses to perceptual questions differed between brake conditions, three chi-square goodness-of-fit tests were carried out on responses to questions 2, 3, and 5, where observed and expected responses were compared (
Table 1).
Statistical significance was determined using an alpha level of p ≤ 0.05 with Sidak alpha level corrections for multiple comparisons. Cohen’s d effect sizes were reported, and results were expressed as means ± SD in the case of paired samples t-tests and as medians ± interquartile range in the case of Wilcoxon signed-rank tests.
4. Discussion
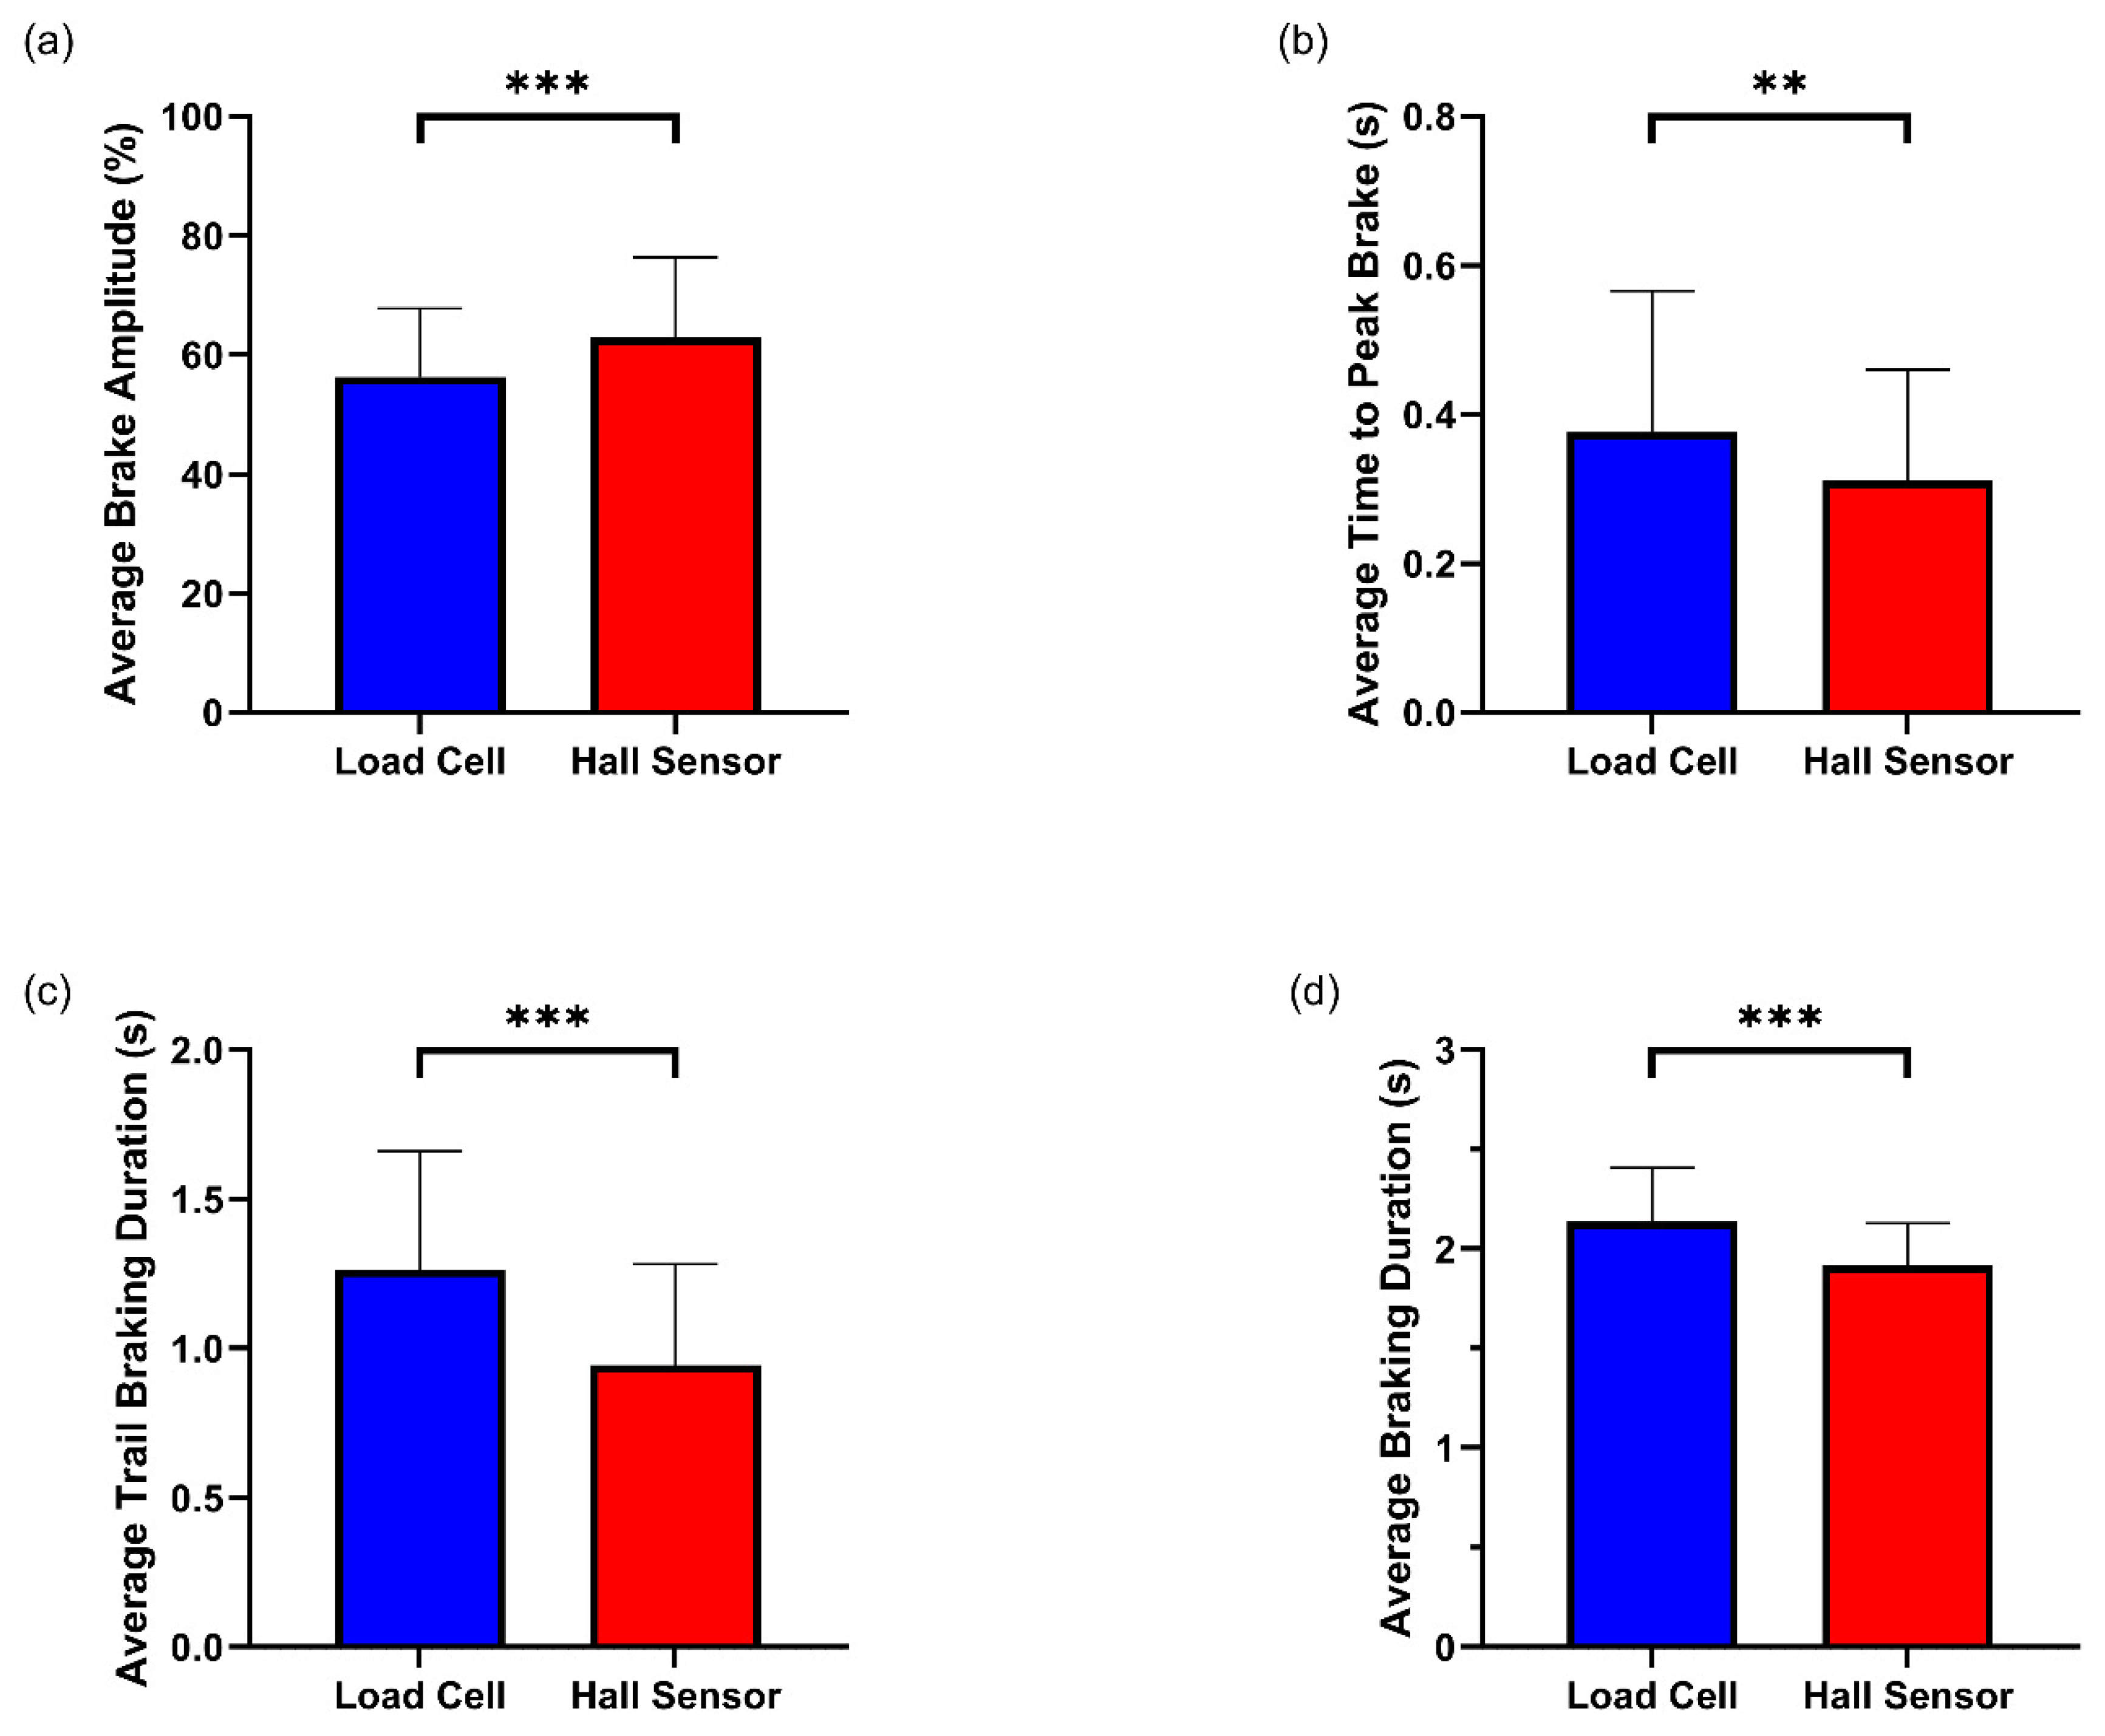
In this study we sought to investigate whether sim racing performance and sim racer braking behaviour differed when using a load cell or Hall sensor brake. Our study’s findings provide partial support that the load cell brake may confer a performance advantage for racing, a view held by many in the sim racing community. When utilising the load cell brake, participants achieved faster lap times (
Figure 4). When participants utilised the load cell brake, they achieved significantly lower average brake amplitudes (
Figure 6a), reached peak braking significantly slower (
Figure 6b), maintained significantly longer trail braking durations (
Figure 6c) and, in turn, significantly longer total braking durations (
Figure 6d) when compared with their utilisation of the Hall sensor brake.
Figure 8 summarises these findings visually as two brake events with the different brake sensors. Taken together, the braking behaviours displayed when using the load cell brake align with the braking behaviour of a “faster driver”. Finally, although participants’ performance and braking behaviours significantly differed between the brake sensors, participants could not subjectively perceive a difference between the brake sensors. These findings are discussed in more detail in the sections below.
As highlighted above, the braking behaviours participants displayed when racing using the load cell brake arguably explain the faster lap times that participants were able to achieve with the load cell brake compared with the Hall sensor brake, as previous research has found that braking-related metrics contribute greatly to overall performance [
12,
15,
17]. Although the Hall sensor matches “faster” braking performance in terms of the time to reach peak brake amplitude, it lagged behind in all other key braking metrics identified in Hojaji and colleagues [
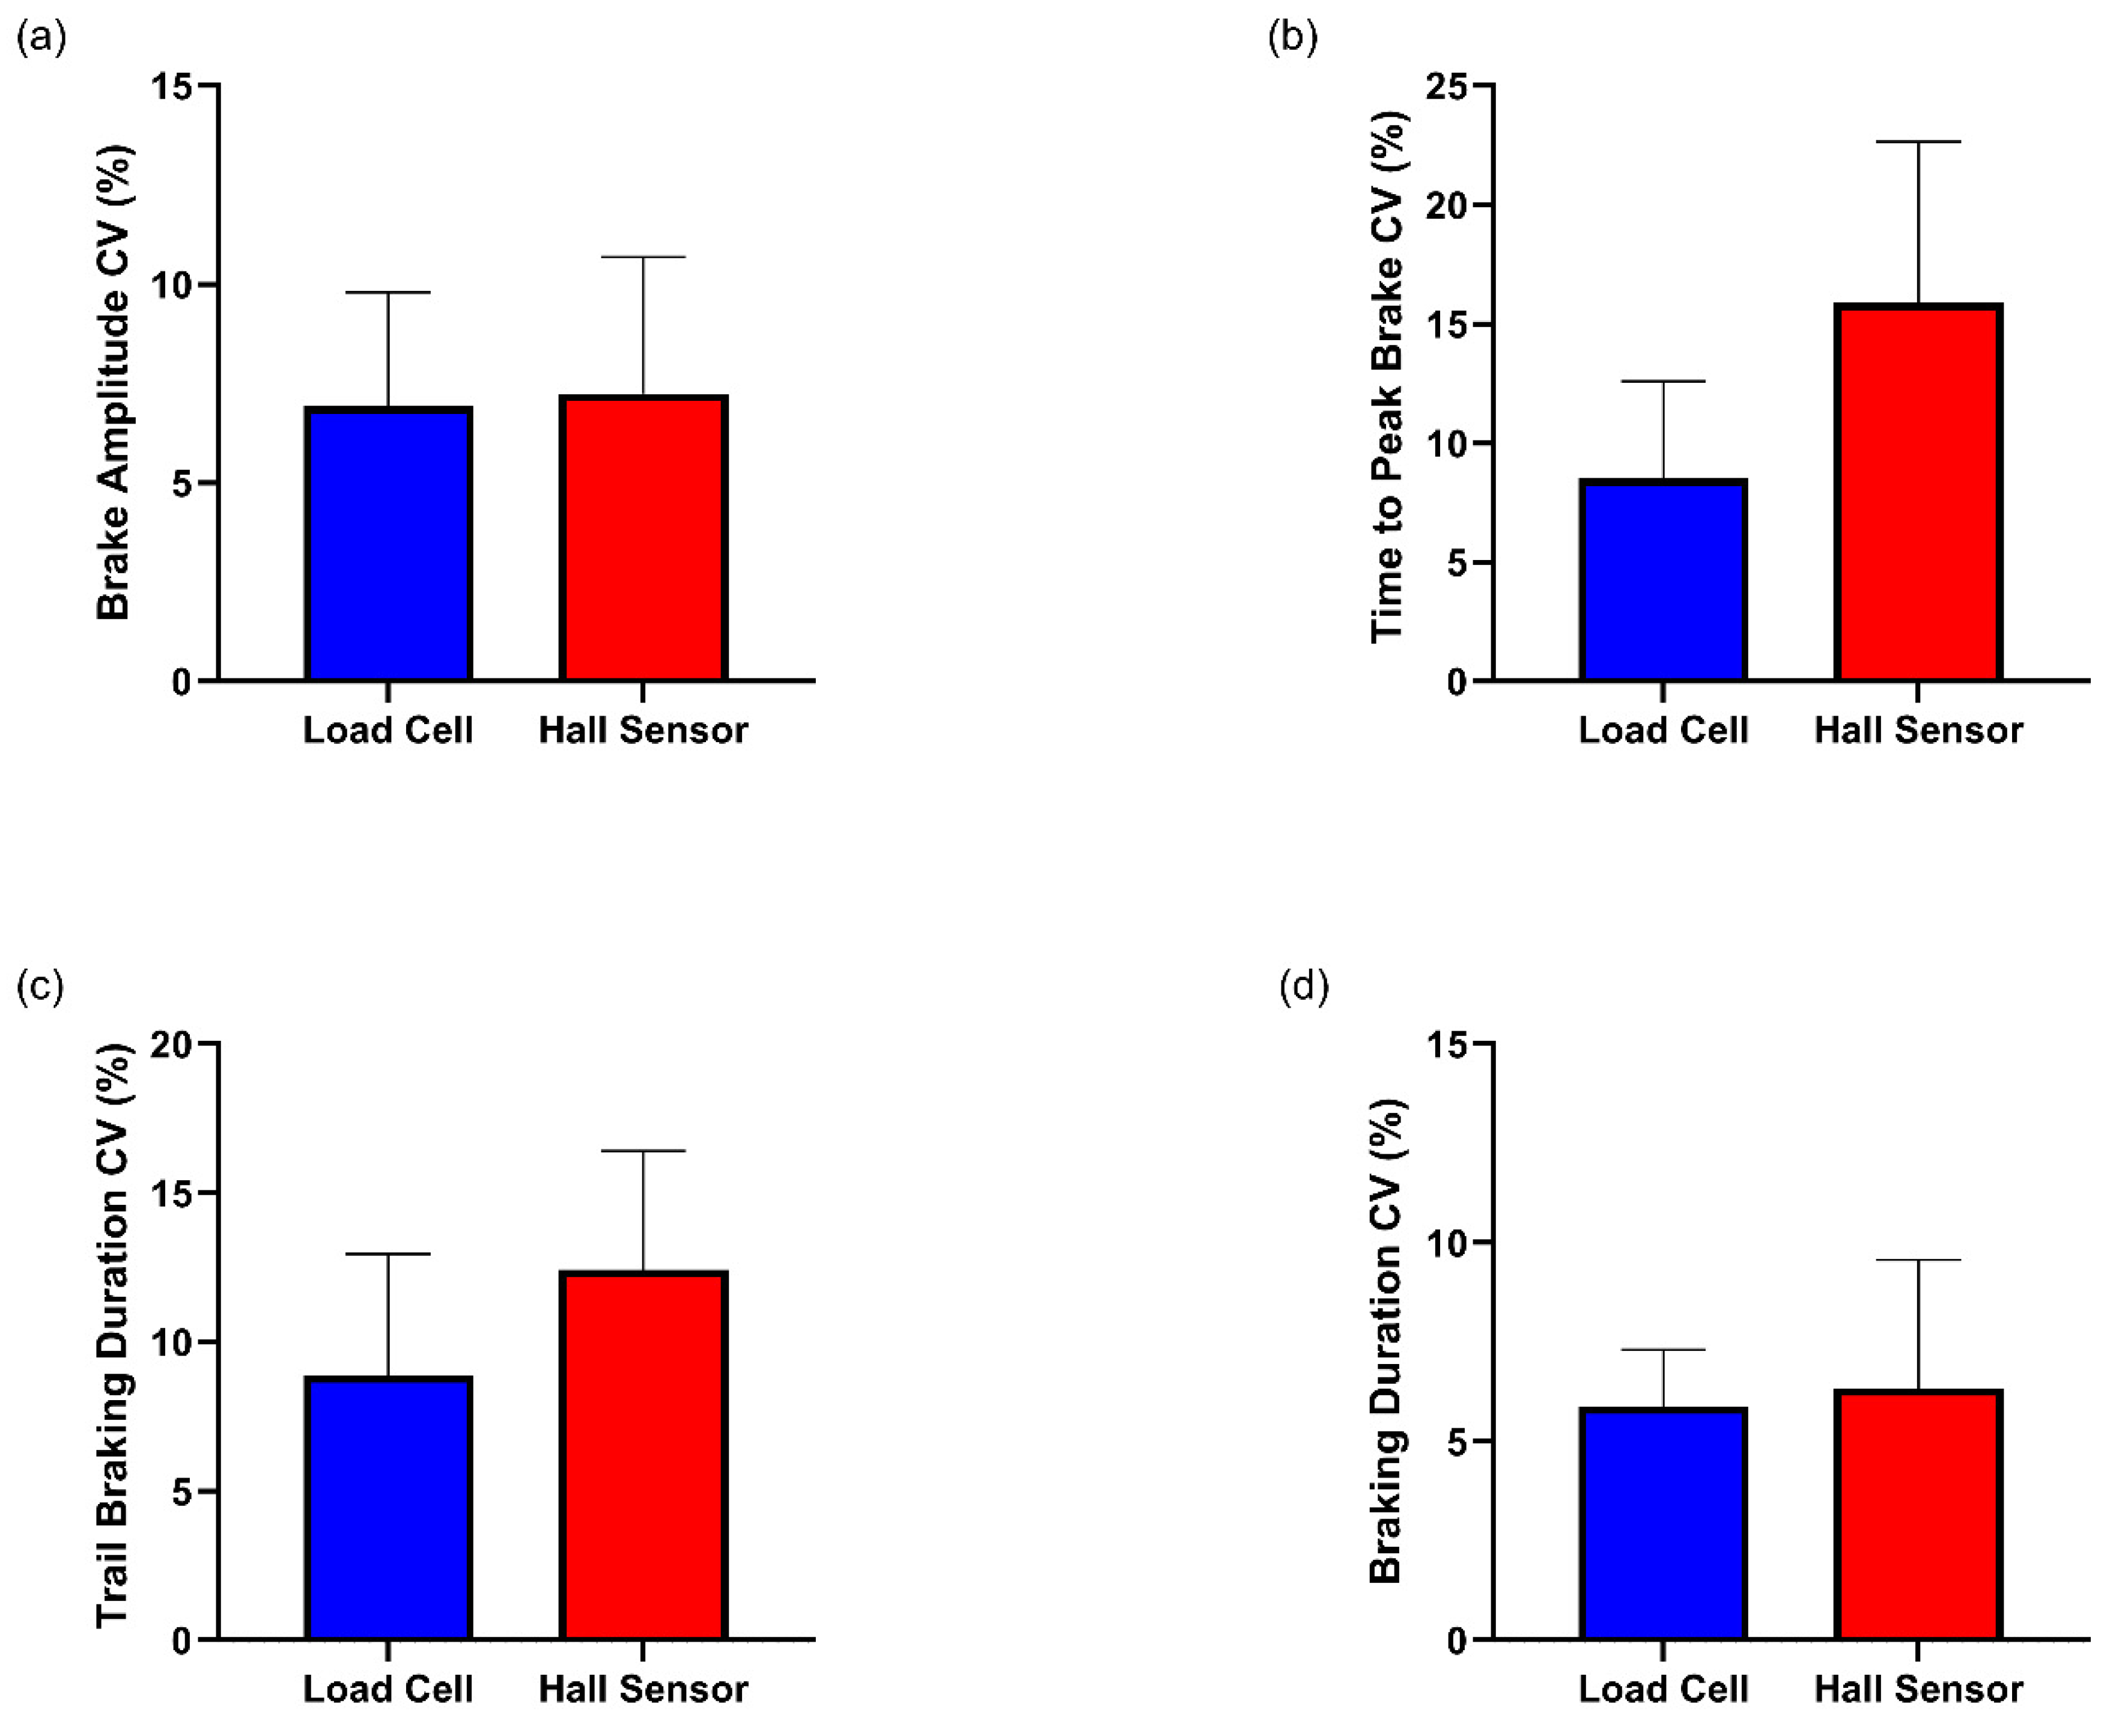
15]. Moreover, we found racers were no less consistent when racing with either brake sensor. Performance and braking metric CVs were low for both brake sensors, indicative of consistent performance [
33].
Based on our results, the increased trail braking duration may be particularly important. Longer trail braking durations would result in more frames of low brake amplitude data contributing to average brake amplitudes within brake events, which would lower overall lap BAs for the load cell brake. Longer TBDs would also arguably lengthen BDs, where we also see a significant difference between the load cell and the Hall sensor. The trail braking technique is highly important for vehicle stability control [
34]. When using the trail braking technique effectively, braking force is slowly reduced and modulated from maximal force to control the balance of the car as drivers increase the steering angle as they near the apex of a corner [
35]. Reducing trail braking (i.e., applying the brakes rapidly and releasing them too quickly) will result in the car becoming unbalanced and difficult to control [
18]. When decelerating, the weight of the vehicle transfers to the front axle, increasing the friction between the front tires and the road surface [
36], maximising grip at the front of the car for better turn in. If reducing trail braking and producing a quicker onset and release of the brakes (in the case of the Hall sensor), the weight of the car may shift to the rear of the vehicle earlier, hindering the vehicle’s and driver’s ability to utilise all the available grip, inducing understeer [
37]. Overall, the longer TBDs that are achievable with the load cell brake sensor may contribute to a slight performance advantage when using the load cell brake.
As we strived to mimic load cell behaviour on the Hall sensor brake and created mechanically identical brake conditions, we were also interested in whether racers would be able to subjectively detect differences between the brake sensors. Interestingly, over half of participants (9/17) responded that they detected no difference in how the brakes responded in-game, while 7 out of 17 failed to correctly identify which brake was the load cell, although a slight trend towards participants reporting that the two brakes felt different when pressed was present. Given that the brakes were mechanically identical, and brake condition order was randomised across participants, we looked to determine whether differences in in-game responses may explain the performance and braking behaviour differences we were observing in our data.
Subsequent analysis demonstrated that the performance difference we observed between the brake sensors may be due to the way in which they responded differently in-game and not the functioning of the sensors themselves. While we were able to demonstrate identical force–travel curves for the two sensors using the Zwick machine (as can be seen in
Figure 2), we hypothesised that the conversion of the force–travel values by the game to the output of brake amplitudes values may differ. To test this, we again used a uniaxial force–displacement machine (ZwickRoell Ltd.; Worcester, UK) to press the brake pedals at a constant velocity until the brakes were fully depressed, producing consistent force–travel curves. However, this time in-game telemetry data were concurrently recorded to gather brake amplitude values to produce in-game response curves (
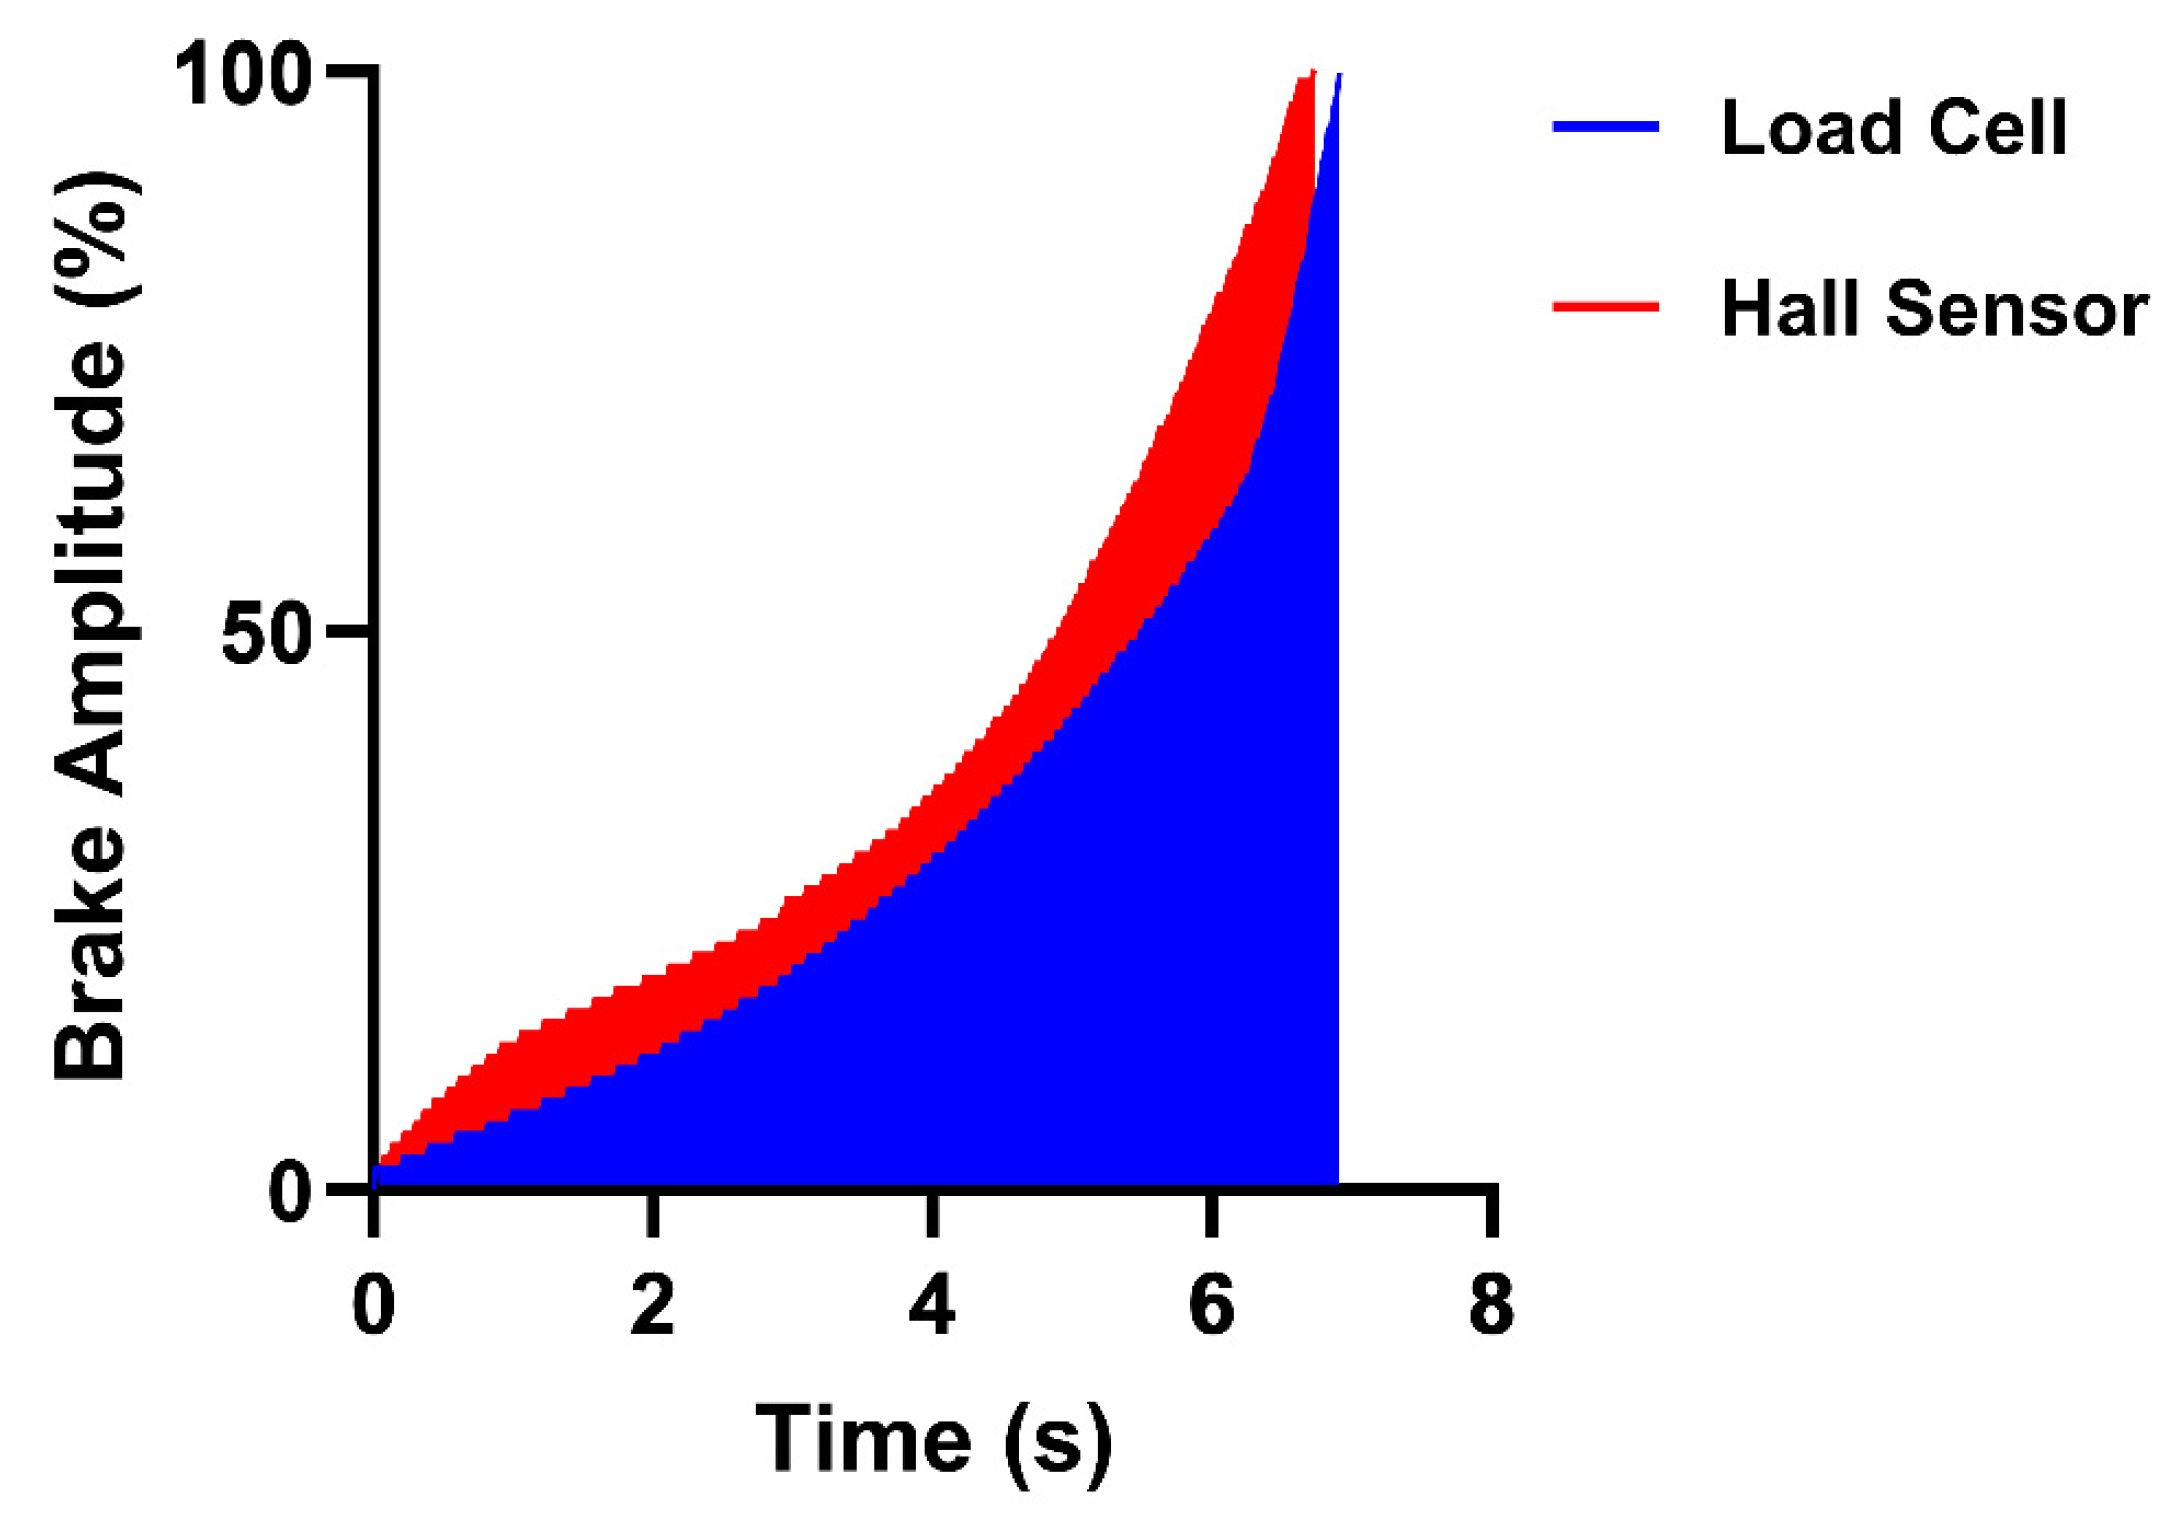
Figure 9).
As observed in
Figure 9, the in-game response curves of the braking mechanisms do differ slightly. We carried out area underneath the curve (AUC) calculations to compare the response curves of both brakes, with the Hall sensor response curve displaying a larger area (247.8% × s) than the load cell response curve (206.8% × s). The Hall sensor’s in-game response curve matches its force–travel curve, confirming we successfully mapped the load cell force–travel curve to the sensor. However, our assumption that the load cell brake’s force–travel curve would be reproduced in-game was found not to be the case.
As can be seen on the Hall sensor brake curve, peak brake amplitude is reached slightly earlier in the game compared with the load cell sensor brake (despite the actual velocity and travel of the two brake sensors being identically controlled via the Zwick machine). This may explain the difference we see in TPB values where participants were able to reach peak braking quicker with the Hall sensor brake. Furthermore, these response curves may have an impact in the slower trail braking phase (see initial phase of the response curves in
Figure 9) as the Hall sensor brake amplitudes rapidly change in-game at lower amplitudes, which would make controlling trail braking using the Hall sensor difficult. As a result, it is possible that the observed performance and braking behaviour differences between the two brake sensors may be primarily influenced by the way brake force increases over time within the game (i.e., how they respond in-game).
Although we are the first to robustly assess the differences in sim racing performance between the load cell and Hall sensor brakes, there is a notable limitation within this study. As outlined extensively, although both brakes were mechanically identical (as seen in
Figure 2), the in-game response of the brakes differed. Therefore, it may be the case that the difference seen in lap time and braking behaviour are due to these differences in in-game response rather than the sensors themselves. A future study may look to remap the in-game response curve associated with the load cell brake sensor to match the Hall sensor in-game response curve to better understand how braking behaviour and racing performance are impacted between the two sensors.
Our research may also have implications for broader driving simulation contexts, as the automotive industry is now transitioning to the use of brake-by-wire systems [
38] and are already using Hall sensors in electronic accelerator pedals [
22]. These systems may be able to utilise sensors such as the load cell and Hall sensors, with driving simulators providing the perfect testbed to evaluate their performance.


