In this section, we will evaluate the performance of the novel hybrid deep learning model developed by integrating two well-known CNN architectures, EfficientNetB0 and ResNet50. The primary motivation behind this approach was to harness the distinct features and strengths of both architectures to improve the model’s ability to generalize and accurately classify images in a binary classification setting. The combination of these models aimed to capture a broad spectrum of features, ranging from basic to complex patterns, thereby enhancing the model’s predictive performance on complex datasets.
4.1. Performance Evaluation of EFFRES-DrowsyNet Across Various Training Epochs on the SUST-DDD Dataset
This section presents a detailed analysis of the experimental results obtained from a model configuration across different training epochs using the SUST-DDD dataset [
44]. The objective of these experiments was to investigate the model’s performance over varying numbers of epochs while incorporating early stopping in some cases. Performance was evaluated using four primary metrics: test accuracy, test precision, test recall, and test loss. The goal of this analysis is to compare the effects of different training durations on model effectiveness and identify the most robust experimental setup for optimal performance.
Table 3 illustrates the model’s performance under different experimental setups, varying the number of training epochs. The results presented correspond to distinct executions of the model, each configured with a unique stopping criterion or total number of epochs. The table provides insights into how training duration influences key performance metrics: test accuracy, test precision, test recall, and test loss.
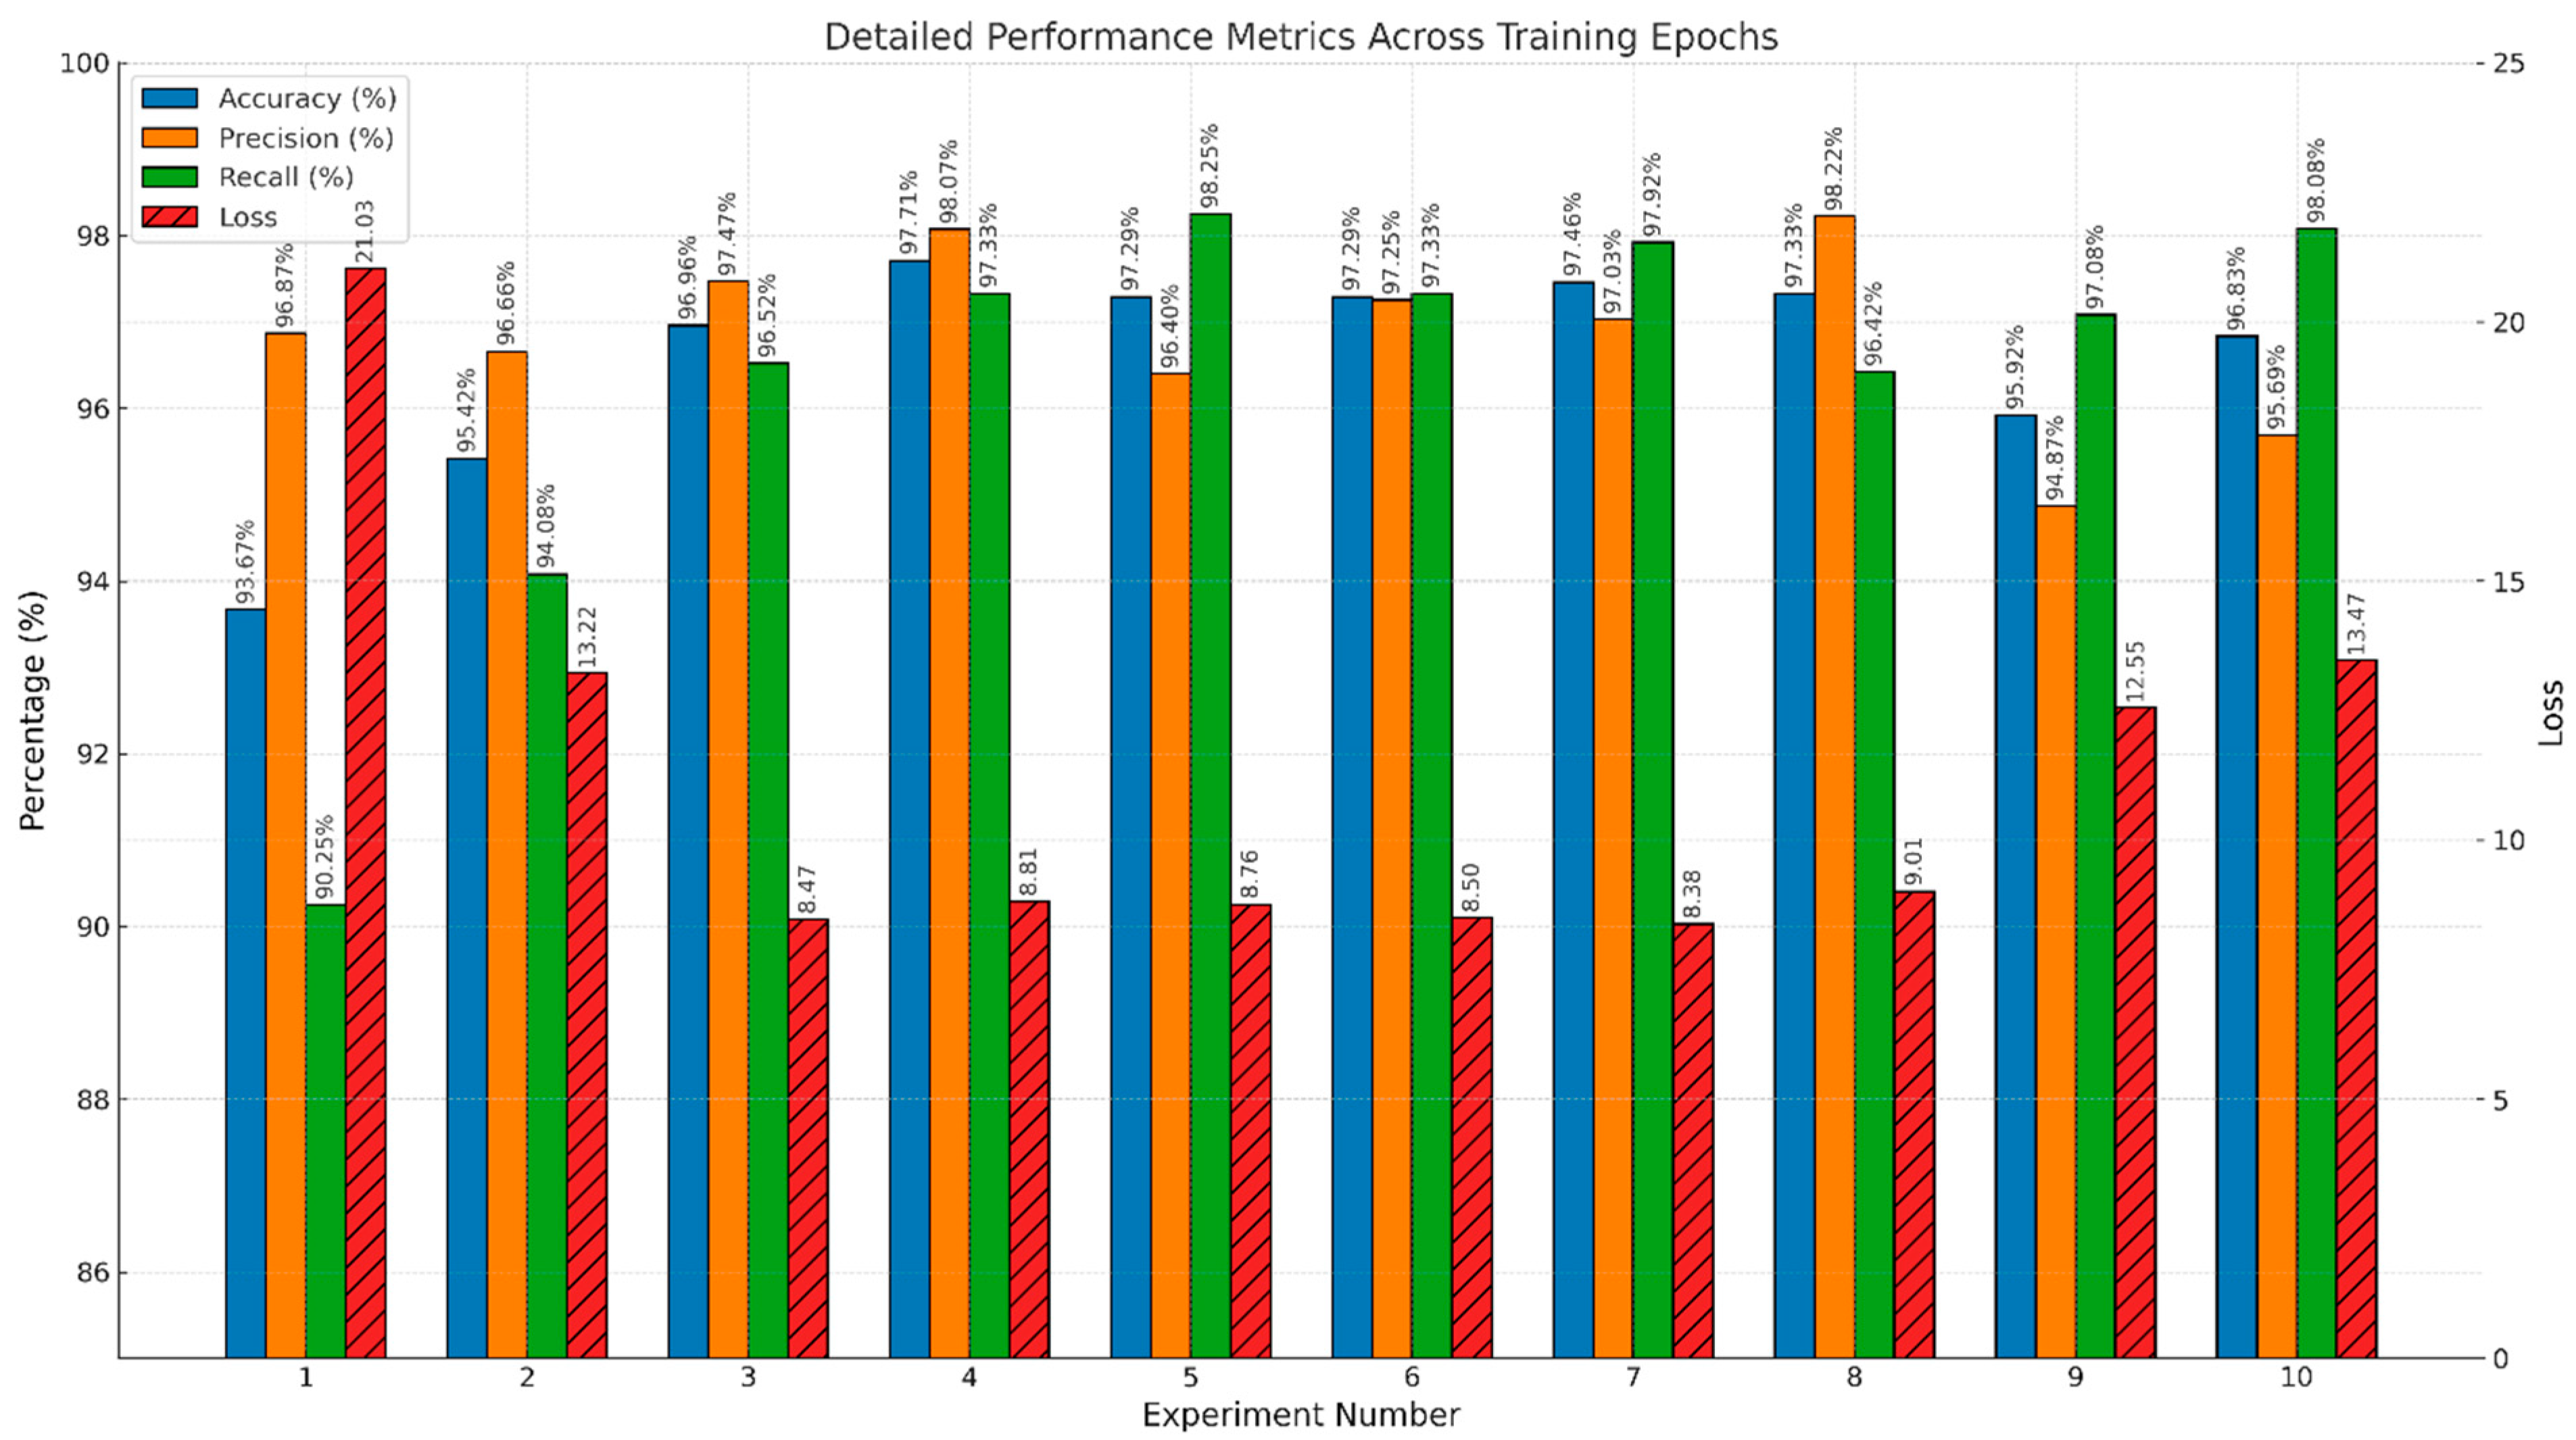
Figure 9 delineates the impact of varying training epochs on key performance metrics—accuracy, precision, recall, and loss—across ten distinct experimental setups.
This bar chart precisely quantifies the impact of different training periods on the model’s performance, represented by the metrics of test accuracy, precision, recall, and loss. The dataset encompasses results from ten experiments, each employing a specific number of training epochs, ranging from 10 to 100. A variety of these experiments incorporate early stopping criteria to optimize the training process and mitigate the risk of overfitting. Metrics such as accuracy, precision, and recall are plotted against the primary y-axis in percentage terms, while loss is measured on a secondary y-axis to maintain scale integrity and improve interpretability. Each metric is marked with vertical labels directly above the bars, ensuring that precise values are readily accessible for detailed analysis. This graphical representation is important in highlighting the relationship between training duration and model efficacy, providing insights into optimal training strategies that balance model accuracy and computational efficiency. The chart supports discussions on effective training methodologies for enhancing model performance in practical deployment scenarios.
4.1.1. Optimal Epochs and Generalization
While deep learning models typically improve in accuracy with increased training epochs, our focus was on identifying the optimal stopping point to balance performance with computational efficiency. As shown in
Table 3, Experiment 4, which applied early stopping at 25 epochs, achieved the highest metrics—97.71% accuracy, 98.07% precision, and 97.33% recall—with minimal test loss (0.0881). This indicates that the model had effectively learned the relevant features for drowsiness detection within a relatively short training window, avoiding unnecessary computational costs.
This result is particularly significant for real-time applications like in-vehicle driver monitoring systems, where fast convergence and minimal overfitting are essential. Experiments beyond 30 epochs showed only marginal improvements or even slight degradation in generalization (as reflected by increased loss), reinforcing the effectiveness of early stopping as a practical training strategy.
4.1.2. Impact of Early Stopping
The use of early stopping proved critical in identifying the point at which the model generalizes best without overfitting. Among all experiments, Experiment 4 not only yielded the highest accuracy and precision but also achieved this with fewer training epochs compared to other configurations. Other early stopping cases (Experiments 7, 8, and 10) also showed strong results, though not exceeding the balanced performance of Experiment 4.
This suggests that beyond a certain point, additional training offers diminishing returns and may negatively affect model performance. The ability to achieve optimal accuracy with fewer epochs demonstrates the practical efficiency of the proposed EffRes-DrowsyNet model, making it well-suited for deployment in real-time drowsiness detection systems where both speed and accuracy are critical.
4.1.3. Effect of Longer Training
Extended training durations (Experiments 5 through 9) were explored to understand their impact on the model’s ability to generalize and maintain precision and recall. Notably, while experiments with up to 60 epochs maintained low loss rates, Experiments 9 and 10 experienced increases in test loss alongside fluctuations in precision and accuracy.
Experiment 9 (90 epochs) resulted in a higher loss (0.1255), with decreased precision (94.87%), suggesting that too many epochs can lead to model overfitting the training data, which adversely affects its performance on new, unseen data.
4.1.4. Precision-Recall Trade-Off
A critical aspect of the predictive performance for real-time applications is the balance between precision and recall, especially in safety-critical systems like driver drowsiness detection, where both false negatives and false positives have serious implications.
Experiment 4 optimally generalizes the training data, as indicated by its balanced metrics across accuracy, precision, recall, and loss. This suggests that the model is neither overfitting nor underfitting. Experiment 4 also demonstrates a superior balance between precision and recall, crucial for minimizing false positives and negatives in real-time detection.
The same experiment achieves the highest accuracy, crucial for reliable real-time applications where decisions must be both accurate and timely. Unlike experiments with higher epochs, Experiment 4 avoids the pitfalls of overfitting, as indicated by its moderate test loss, which does not sacrifice precision or recall.
Based on the comprehensive analysis, Experiment 4 is recommended as the most suitable configuration for real-time driver drowsiness detection systems. This experiment not only provides the highest measures of accuracy, precision, and recall but also demonstrates an effective use of early stopping at 25 epochs to maximize performance without overfitting. The early stopping strategy ensures the model is robust enough to generalize well on unseen data, a critical requirement for the reliability of real-time systems. This experiment effectively balances the need for quick, accurate detection and computational efficiency, making it the optimal choice for deployment in safety-critical applications.
4.1.5. Performance Analysis of Model Training (With 40 Epochs and Early Stopping at Epoch 25) on the SUST-DDD Dataset
In this section, we provide a detailed analysis of the model’s performance during the initial training phase (Epochs 1–25). This phase is essential, as it encapsulates the model’s early learning dynamics, including its ability to adjust weights and refine its predictive capabilities. The analysis is divided into key sub-phases to provide a nuanced understanding of how the model evolves and optimizes over time.
The training commenced with a notable initial loss of 4.5076, which rapidly decreased as the epochs progressed. By the end of the first epoch, the model achieved a training accuracy of 75.66%, with a precision of 74.68% and a recall of 77.63%. The validation accuracy saw a substantial increase to 89.25%, suggesting that the model was learning generalizable features effectively.
By the sixth epoch, there was a noticeable improvement in all performance metrics, with the validation accuracy peaking at 93.12%. This phase marked the model’s highest generalization performance across the training sessions. Despite fluctuations in validation metrics in subsequent epochs, this peak showcased the potential of the trained model under optimal conditions.
Post the 20th epoch, the learning rate was reduced from 0.0001 to 0.00001 as part of a strategy to refine the model’s ability to converge to a more precise minimum in the loss landscape. This adjustment aimed at enhancing the precision and recall by allowing finer updates to the model weights.
The training process was automatically halted at the 25th epoch due to a lack of improvement in the validation accuracy, which invoked the early stopping mechanism. This decision was guided by the model’s inability to exceed the validation accuracy threshold set previously at 93.54%, thereby preventing unnecessary computations and potential overfitting.
The final test results demonstrated the model’s robustness, achieving an accuracy of 97.71%, a precision of 98.07%, and a recall of 97.33%. These metrics confirm that the model not only captured the essential features during training but also generalized effectively to unseen data.
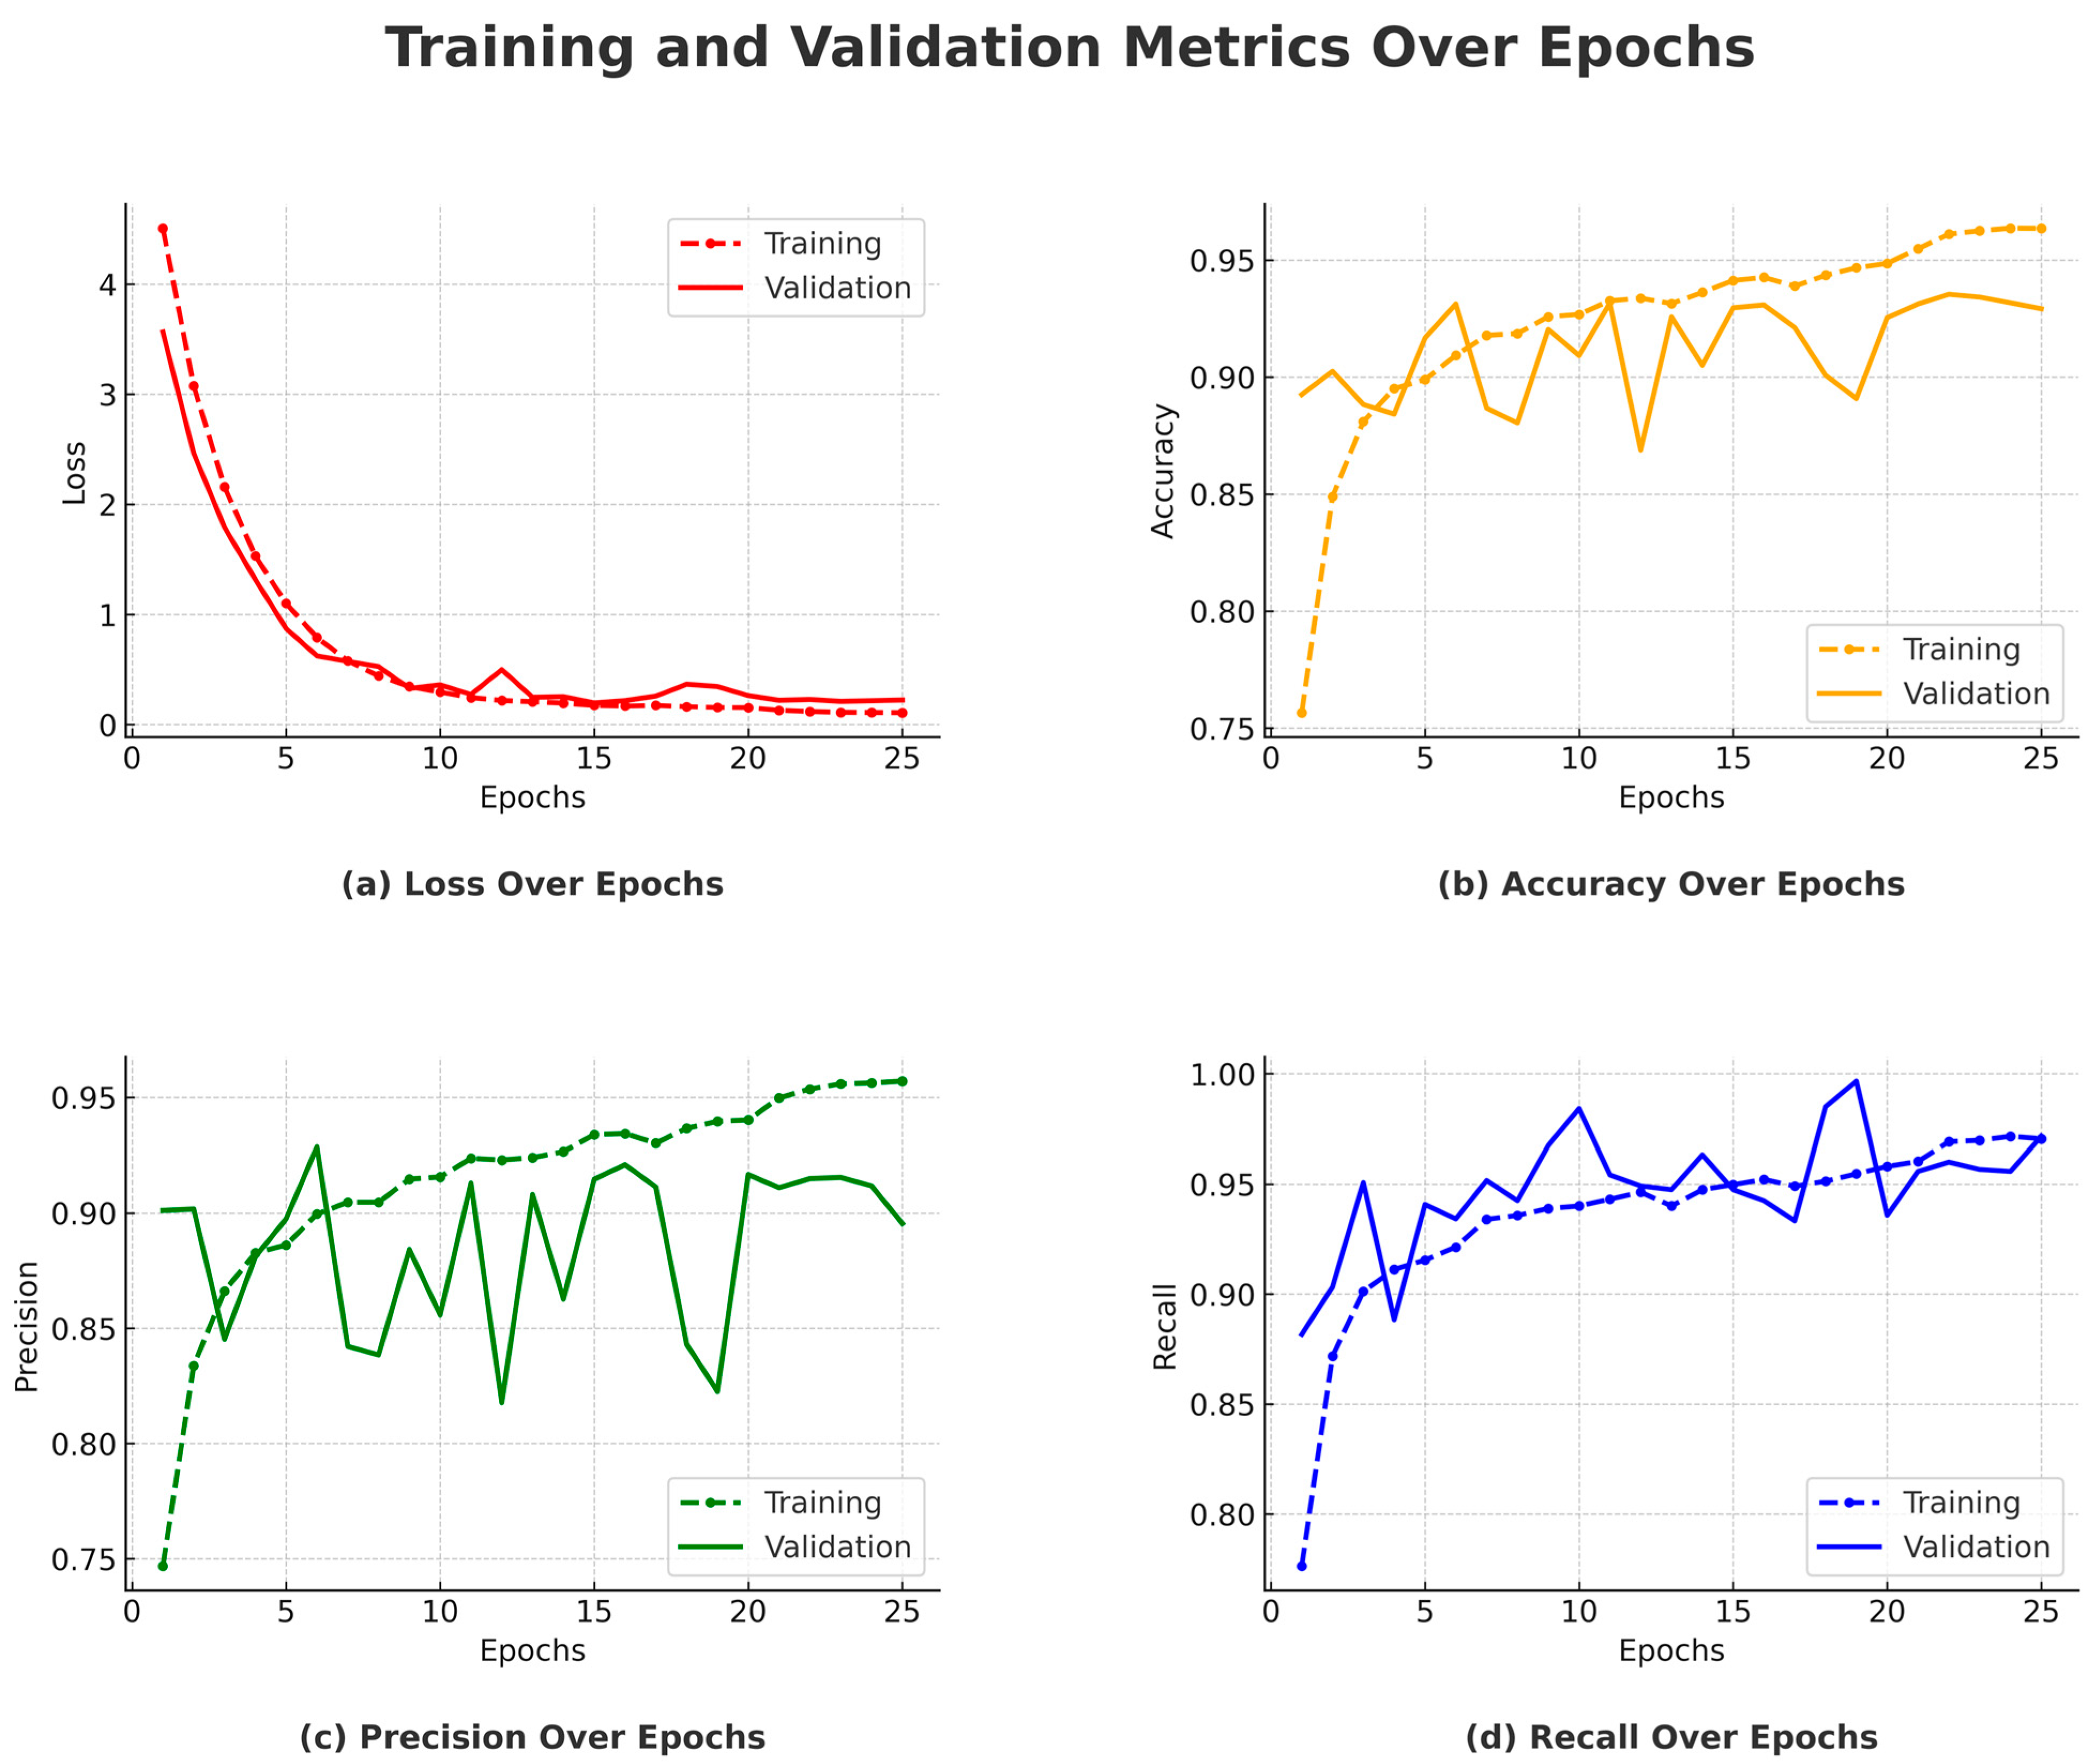
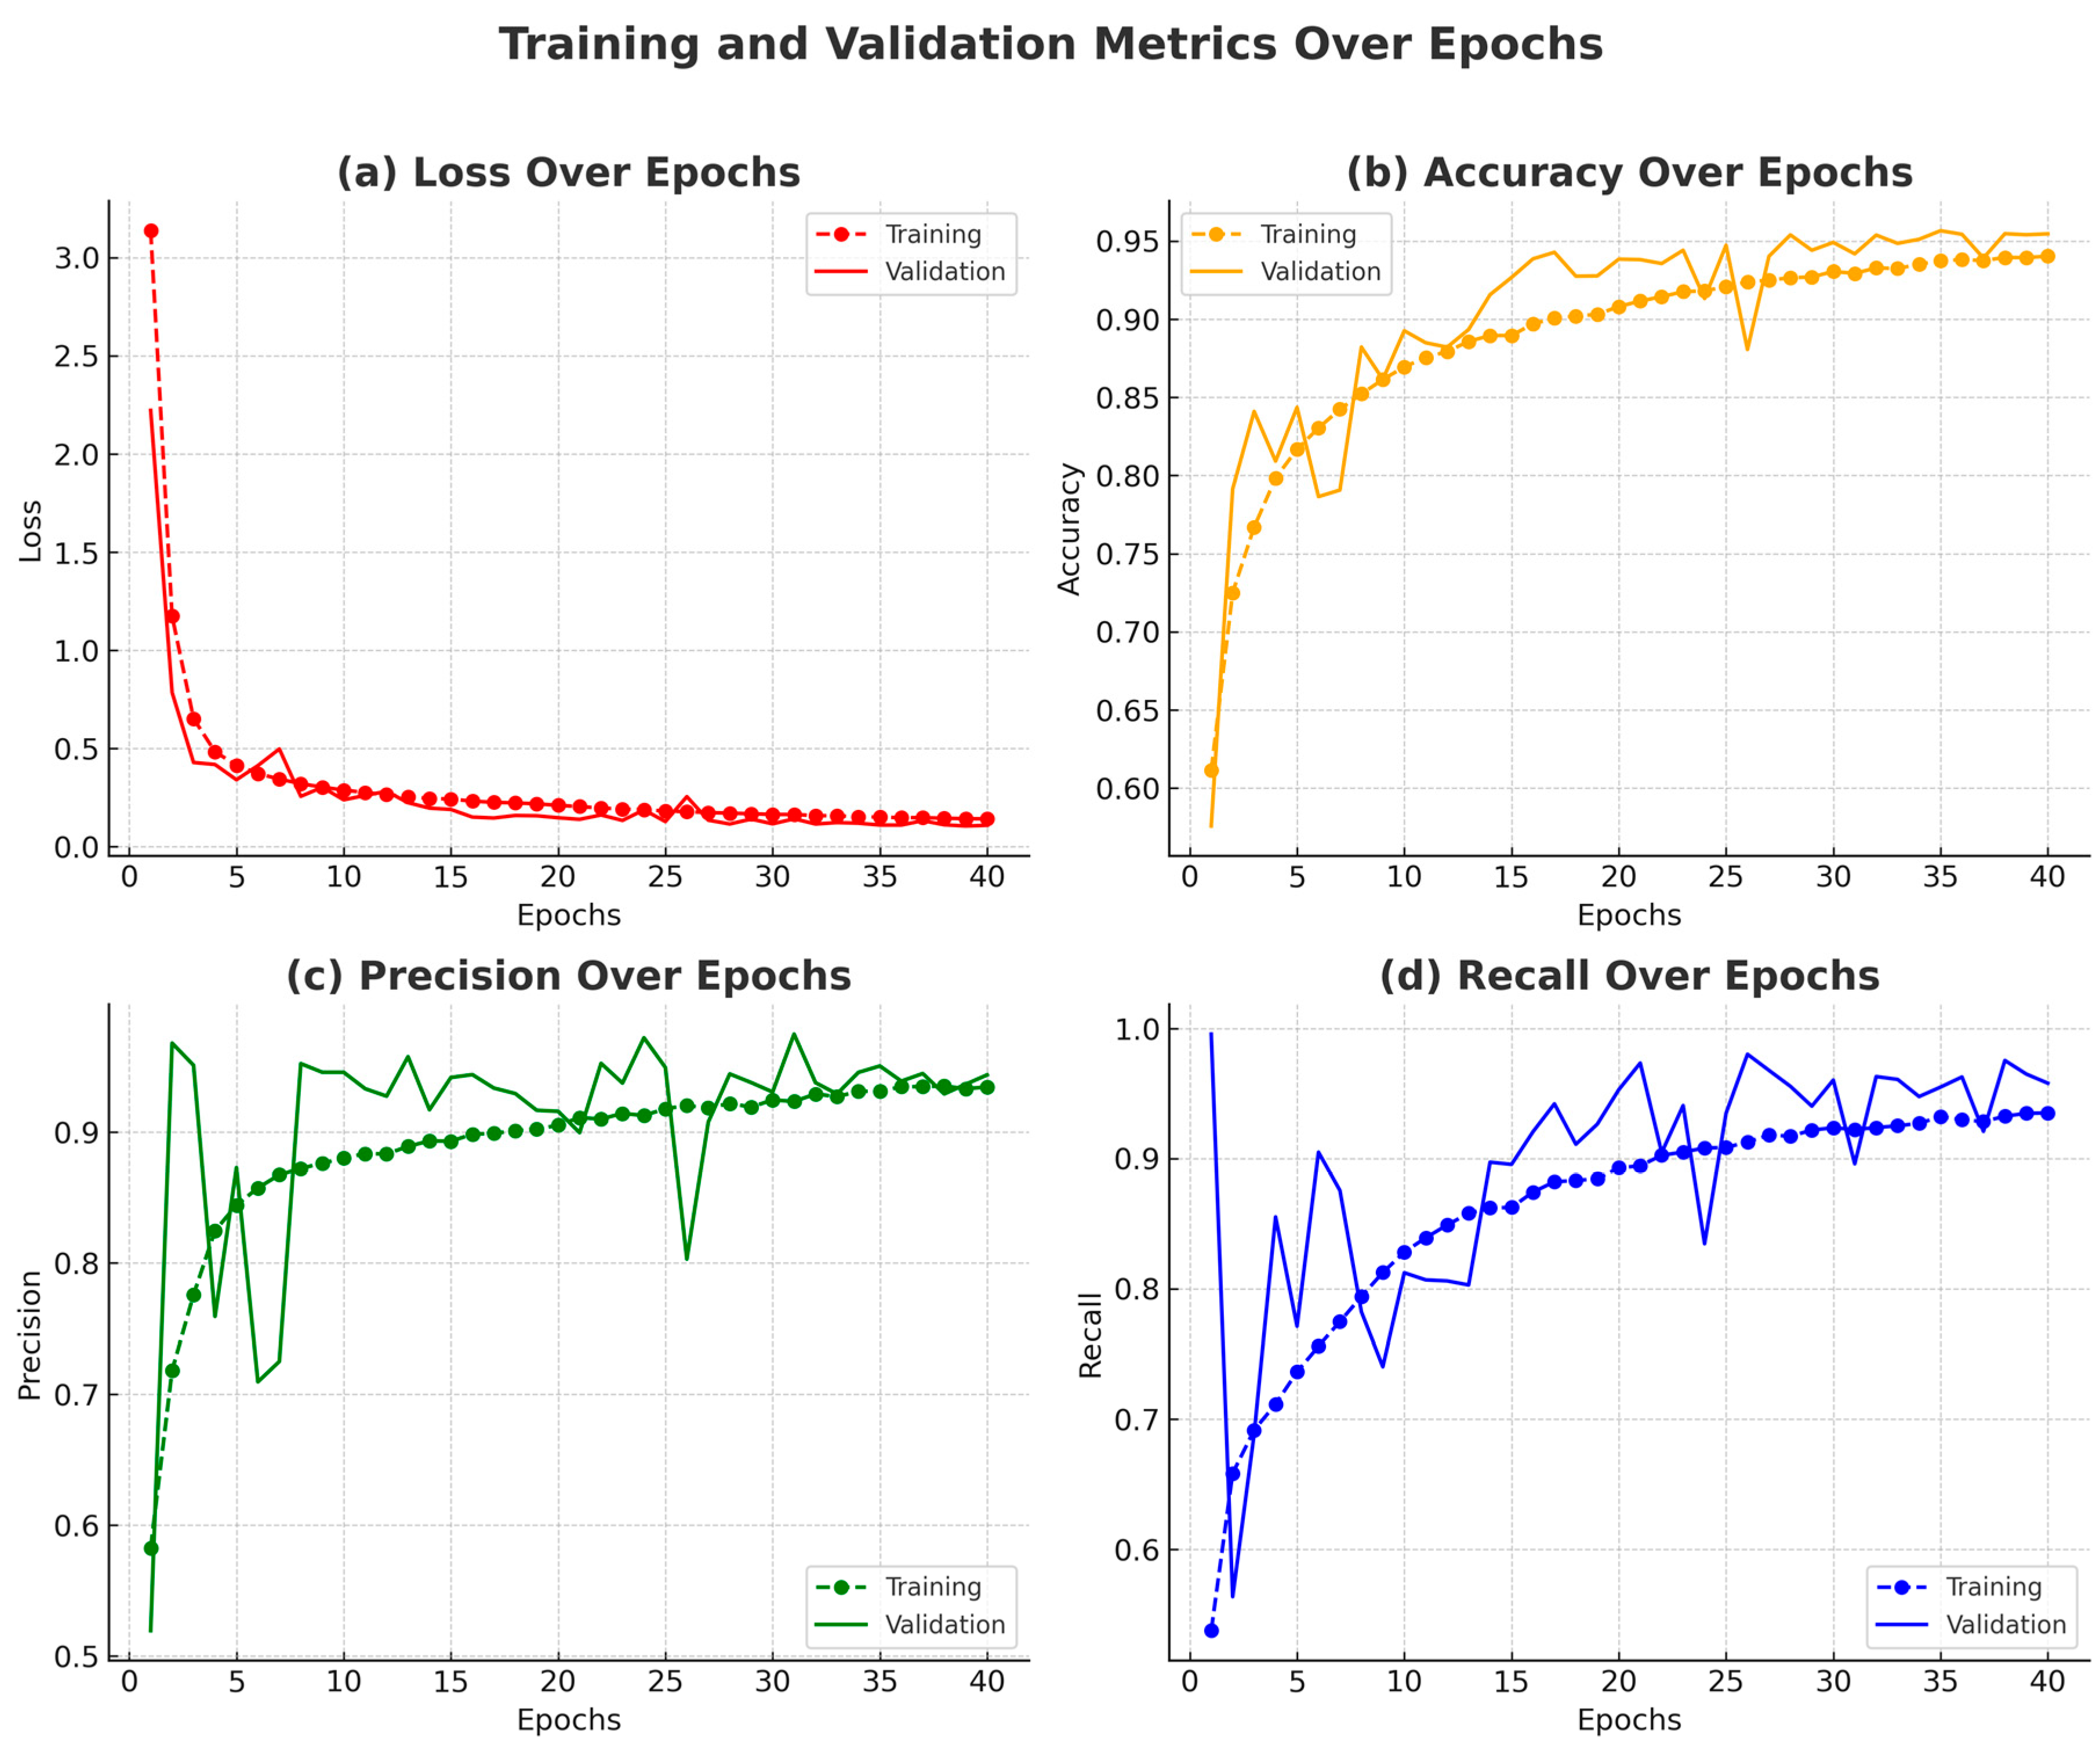
Figure 10 presents a comprehensive visualization of the model’s training process, showcasing the evolution of loss, accuracy, precision, and recall over the training epochs. Subplot (a) shows a consistent decrease in training loss and a generally declining trend in validation loss, with only minor fluctuations, indicating stable learning and good generalization. Subplot (b) illustrates a rising trend in accuracy for both training and validation sets, highlighting the model’s growing ability to correctly classify samples over time.
Subplots (c) and (d) show the training and validation precision and recall, respectively. These two metrics complement each other: precision reflects the model’s ability to reduce false positives, while recall indicates its success in identifying true positives. Their concurrent improvement and eventual stabilization signify a well-balanced model with minimal overfitting and strong generalization.
4.1.6. Final Model Evaluation
The conclusive test evaluations provided strong evidence of the model’s effectiveness. To this goal, a test accuracy of 97.71% demonstrates the model’s high reliability in classifying images correctly. A precision value of 98.07% indicates a very low rate of false positives, essential for applications where precision is critical. The recall is 97.33%, which shows the model’s strength in identifying nearly all positive instances, crucial for sensitive applications. The loss is 8.81%, reflecting the low error rate in the model’s predictions, confirming its overall predictive quality.
These metrics highlight the model’s precision and reliability in classifying unseen data, with a very high true positive rate and a low false positive rate.
4.1.7. Key Takeaways
Learning efficiency. Rapid initial decreases in loss and quick gains in accuracy demonstrate the model’s efficient learning capability, likely due to the effective integration of EfficientNetB0 and ResNet50 architectures.
Generalization ability. Consistently high validation and test metrics suggest that the model has good generalization abilities across similar tasks, making it suitable for real-world applications where accuracy and reliability are crucial.
Optimization and overfitting. The use of callbacks like ReduceLROnPlateau and early stopping helped in finely tuning the learning process and preventing overfitting, as evidenced by the stabilization of validation metrics in later epochs.
In summary, the model showcased excellent performance in binary classification tasks, underpinned by detailed and methodical training phases that optimized its abilities to generalize well to new data. The robustness of the model, validated through high precision and recall rates, positions it as a potent tool for practical deployment in fields requiring precise image classification.
4.2. Performance Evaluation of EFFRES-DrowsyNet Across Various Training Epochs on the YawDD Dataset
This section critically evaluates the performance of the EFFRES-DrowsyNet model, employing a structured approach through a series of ten discrete experiments using the YawDD dataset [
45]. Each experiment, labeled EX1 through EX10, was meticulously conducted with an incremental set of training epochs, ranging from 10 to 100. The purpose of this analytical effort is to analyze the effects of varying training durations on the model’s overall efficacy, specifically examining key metrics such as test accuracy, test precision, test recall, and test loss.
4.2.1. Experimental Overview and Methodology
EFFRES-DrowsyNet underwent rigorous testing across ten independent experiments, each tailored with a specific number of training epochs to ascertain the optimal duration for model training. This systematic approach allowed for the comprehensive recording of performance metrics, providing a granular view of the model’s predictive accuracy and operational efficiency. To counter potential overfitting, early stopping was implemented in several experiments, effectively halting training when no significant improvement in validation loss was detected, thereby safeguarding the model against diminished generalization capability.
4.2.2. Detailed Results and Analysis
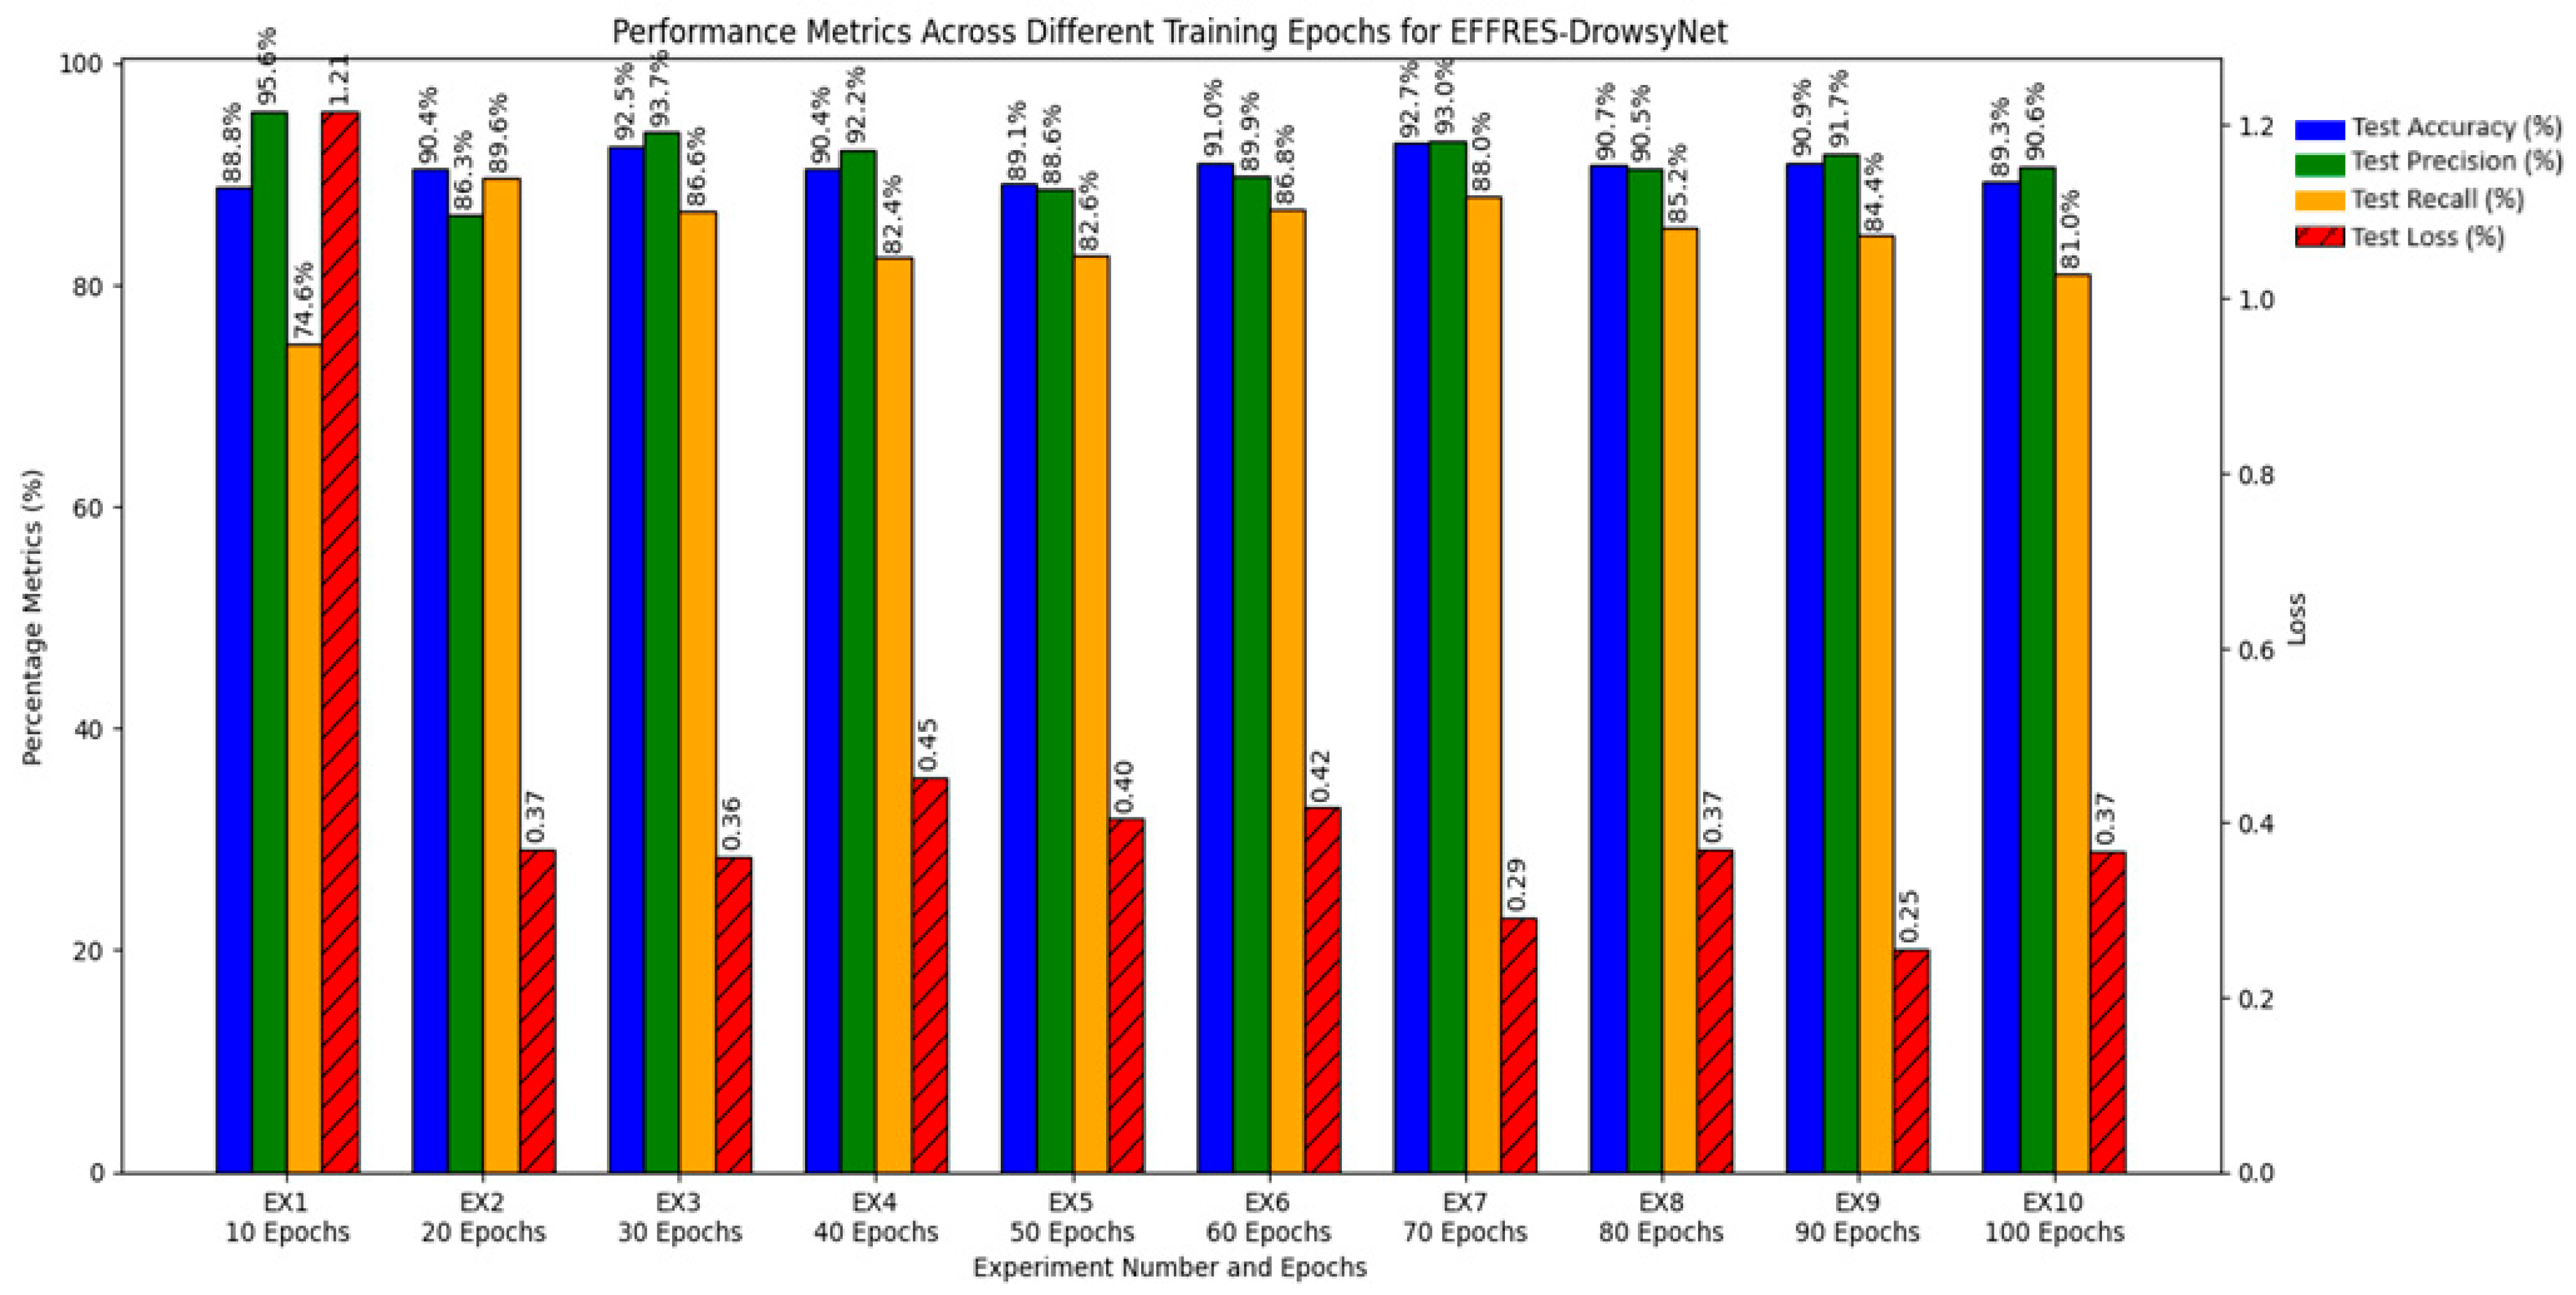
The performance of each experiment is captured in
Table 4 and
Figure 11, which highlights the relationship between training duration and the various performance metrics. The results delineate a clear trajectory of model behavior as training epochs increase, offering valuable insights into the dynamics of model training and performance optimization.
Experiment 1 through Experiment 4 showed progressive improvements in accuracy and precision, indicating that initial increments in training duration substantially enhance the model’s ability to correctly identify drowsiness.
Experiment 5 through Experiment 7 benefited from the application of early stopping, which preserved high performance metrics while preventing overfitting. Notably, EX7, which halted training at 38 epochs, demonstrated exemplary performance, striking an optimal balance among all evaluated metrics.
Experiment 8 through Experiment 10 exhibited signs of plateauing or slight regression in performance metrics beyond the early stopping point established in EX7, suggesting that extending training beyond this threshold yields diminishing returns and may lead to model overtraining.
4.2.3. Optimal Training Configuration
The analytical results unequivocally suggest that training EFFRES-DrowsyNet for about 70 to 80 epochs, particularly with early stopping, optimizes performance across all metrics without leading to overfitting. Experiment 7 emerges as the most effective configuration, achieving the highest scores in accuracy, precision, and recall, coupled with a low loss rate. This experiment presents a compelling case for setting an upper limit on the number of training epochs to maximize efficiency and efficacy in real-world applications of driver drowsiness detection.
This comprehensive evaluation not only confirms the robust capabilities of EFFRES-DrowsyNet but also underscores the importance of judicious training management to achieve the best operational performance. The findings from this series of experiments will guide future implementations and optimizations of the model, ensuring that EFFRES-DrowsyNet remains a cutting-edge solution in the field of driver safety technology.
4.2.4. Performance Analysis of Model Training (With 70 Epochs and Early Stopping at Epoch 38) on the YawDD Dataset
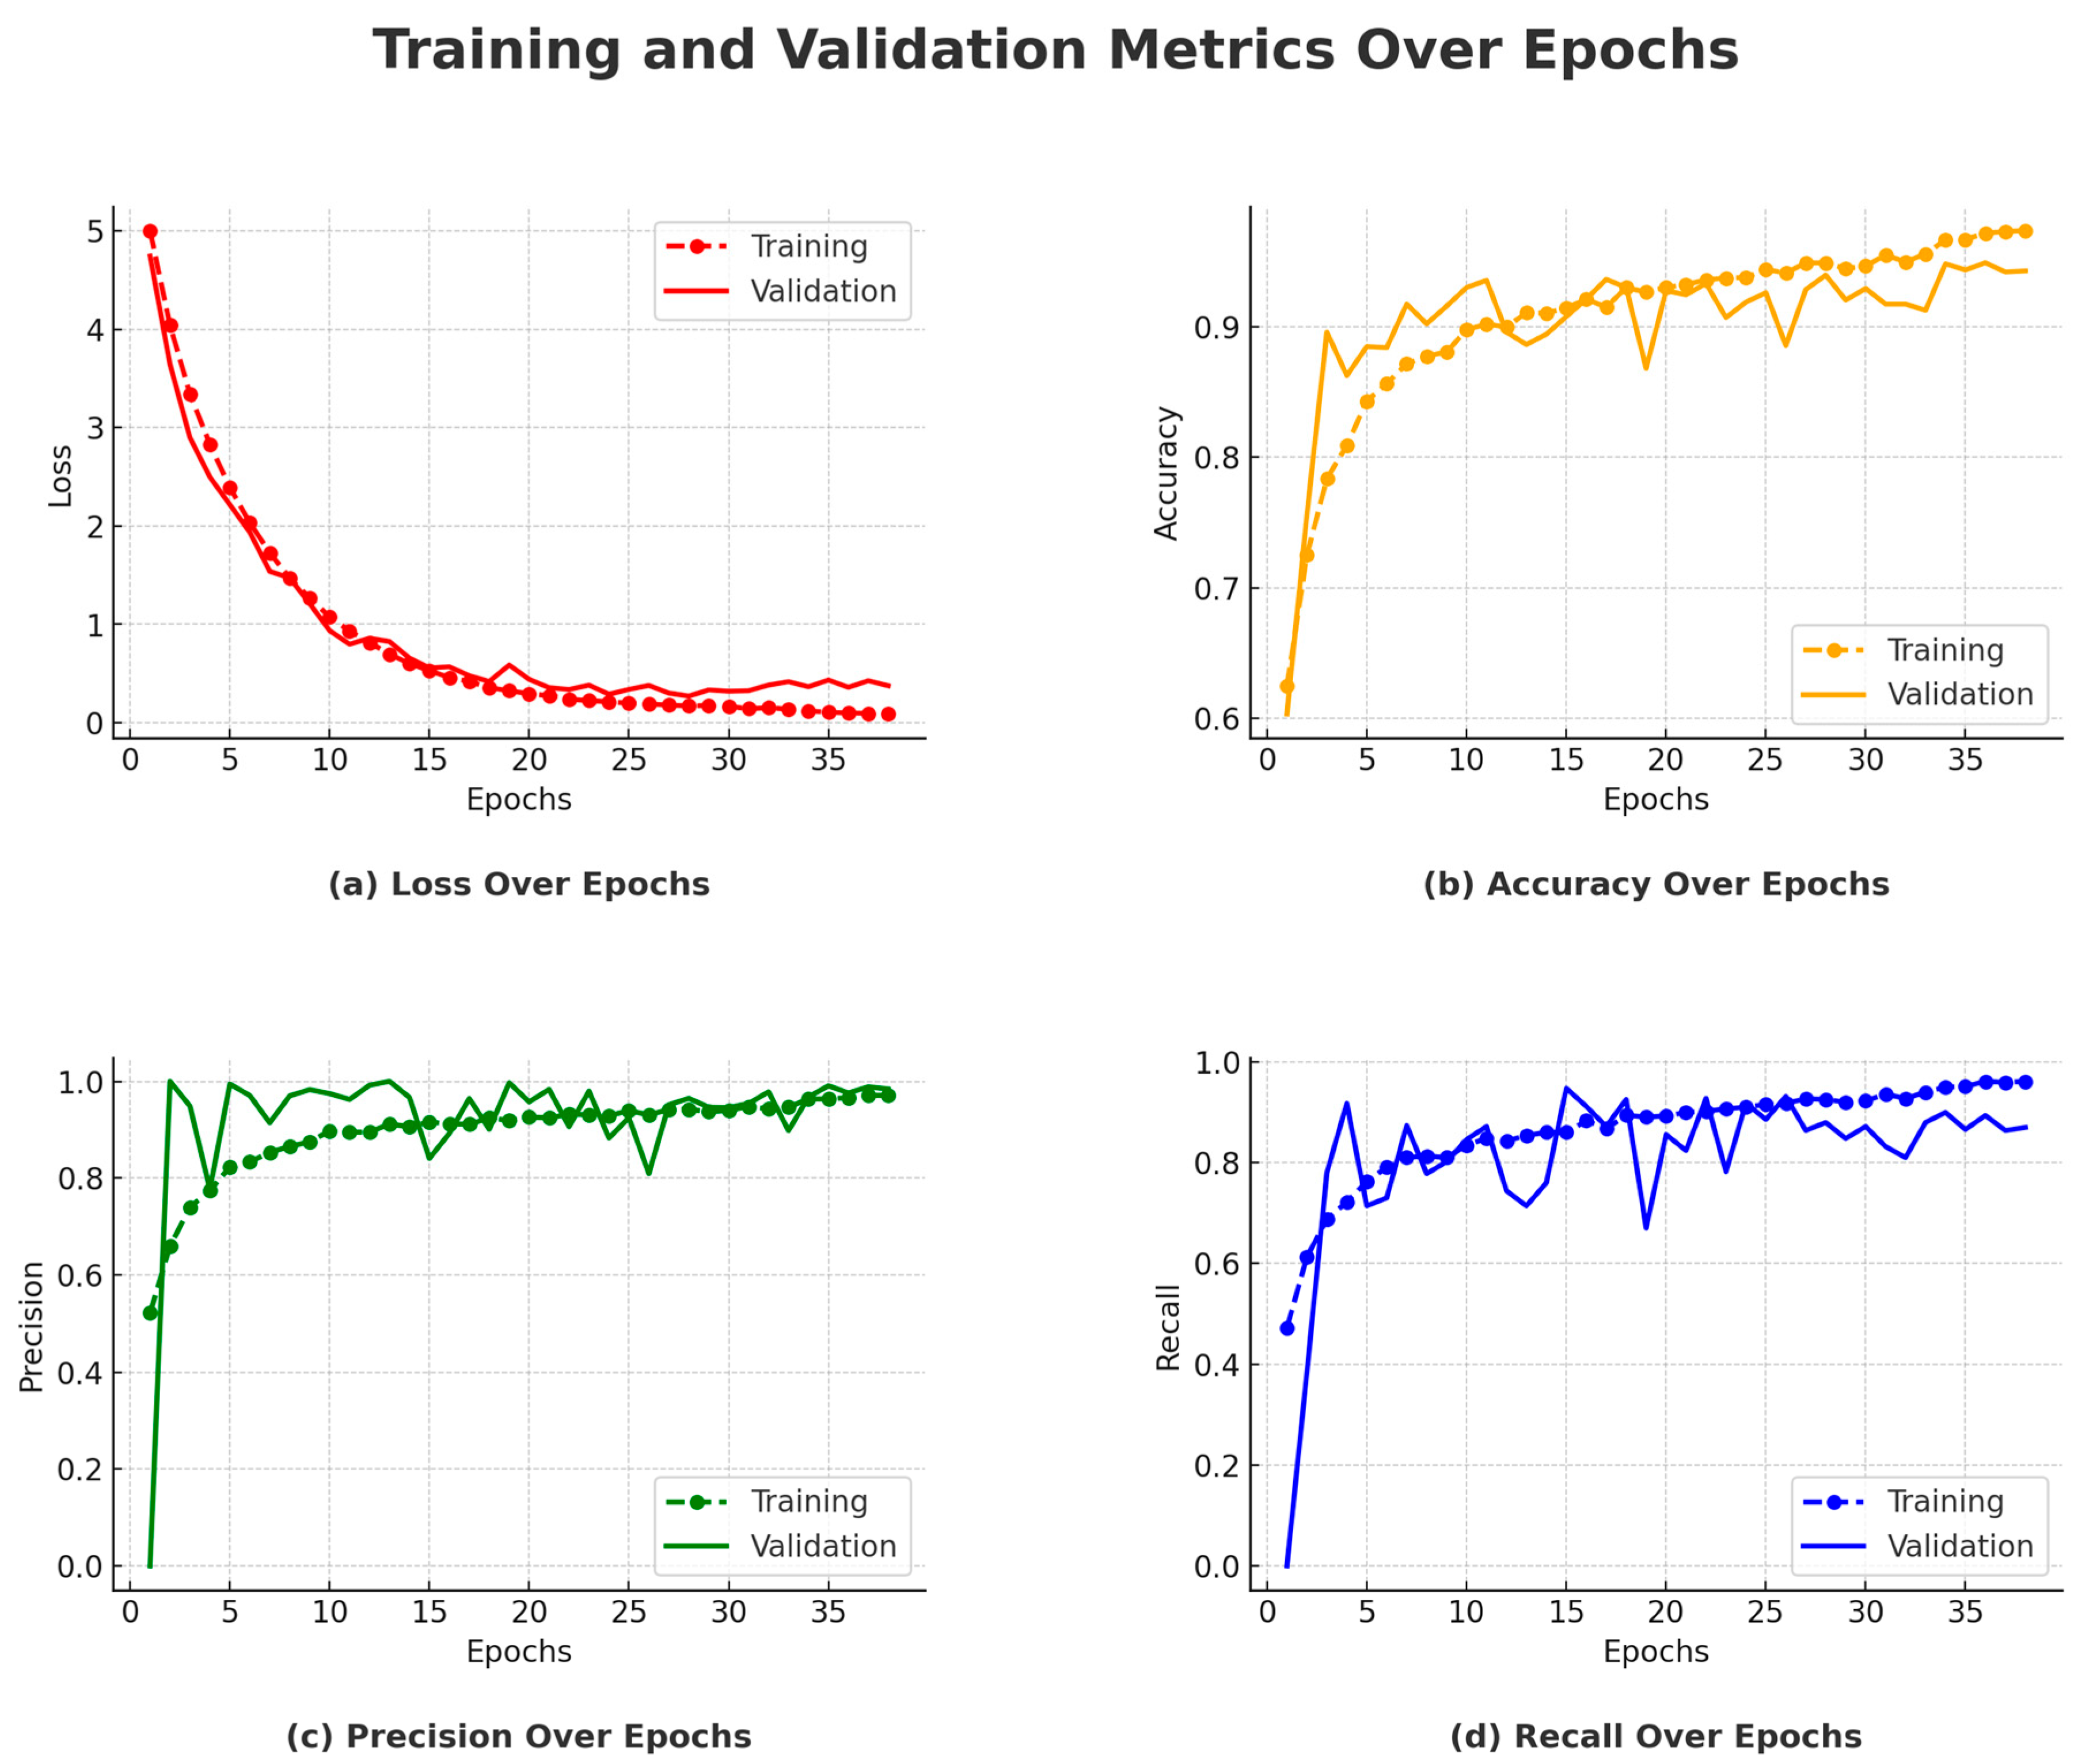
The model was configured to train for a total of 70 epochs, but early stopping was applied at epoch 38 due to a plateau in validation performance. Below is a detailed analysis of the model’s performance during the training process, referencing the accuracy, precision, recall, and loss plots.
Between Epochs 1 and 3, the model showed a significant improvement, with training accuracy increasing from 62.47% to 78.36%. This rapid initial learning phase is evident in
Figure 12b, where the accuracy curve rises steeply. Correspondingly, precision and recall also improved during these early epochs, as shown in
Figure 12c,d, suggesting that the model quickly learned the fundamental patterns needed for classification. On the validation side, accuracy increased markedly from 60.32% to 89.60%, indicating early generalization capability. During Epochs 4 to 10, training accuracy continued to increase, reaching 90.79% by Epoch 10. However, validation accuracy plateaued at around 89.60%, as seen in
Figure 12b, where the validation curve flattens after its initial ascent. Precision remained high, and recall improved to 83.42%, indicating stability in the model’s classification performance. These trends are clearly observed in
Figure 12c,d.
From Epochs 11 to 17, the validation accuracy stabilized around 93.65%, despite a continued increase in training accuracy. This plateau in validation performance, highlighted in
Figure 12b, indicates that the model had reached its generalization capacity on the validation set. Both precision and recall also stabilized, as shown in
Figure 12c,d, reinforcing the notion that additional training was yielding diminishing returns on unseen data. The model’s peak performance occurred between Epochs 18 and 28, with validation accuracy reaching a maximum of 94.92% at Epoch 28. This is evident in
Figure 12b, where the validation curve hits its highest point before leveling off. Precision and recall also remained consistently high during this period, as seen in
Figure 12c,d, demonstrating the model’s robustness and balanced detection of both classes.
In the final epochs (29 to 38), training accuracy further increased to 97.38%, but validation accuracy did not surpass the peak achieved in Epoch 28. The stability of the validation curve in
Figure 12b and the steady precision and recall values in
Figure 12c,d indicate saturation in performance. Although the learning rate was reduced at Epoch 33, no further improvements were observed, validating the early stopping decision made at Epoch 38. The loss curves in
Figure 12a also show convergence, supporting the conclusion that the model had reached optimal training.
4.2.5. Performance Metrics
Training Accuracy: The model exhibited a steady increase in training accuracy, ultimately reaching 97.38% by Epoch 37. However, the increasing gap between training and validation accuracy—clearly illustrated in
Figure 12b—suggests the onset of overfitting. While the model continued to learn from the training data, its performance on unseen data did not show corresponding improvements.
Validation Accuracy: As shown in
Figure 12b, the model achieved its highest validation accuracy of 94.92% at Epoch 28. Beyond this point, no further improvement was observed, indicating that the model had effectively captured the essential patterns in the data. The stabilization of the validation curve underscores the model’s limited generalization gains with continued training.
Precision and Recall: Throughout training, both precision and recall remained consistently high. Precision remained above 93%, while recall stabilized around 88%, indicating the model’s effectiveness in minimizing both false positives and false negatives. These trends are reflected in
Figure 12c,d, where both metrics demonstrate stability after the initial learning phase, with only minor fluctuations.
Training and Validation Loss Trends: As shown in
Figure 12a, training loss steadily decreased from 5.0042 to 0.0884, confirming effective model learning. The validation loss reached its minimum of 0.2704 at Epoch 28, aligning with peak validation accuracy. Subsequent fluctuations in validation loss suggest early signs of overfitting, supporting the rationale for early stopping at Epoch 38.
Test Performance: The final model evaluation yielded a test loss of 0.2905, with a test accuracy of 92.73%, precision of 93.02%, and recall of 88.00%. These results affirm the model’s robustness and strong generalization to previously unseen data.
4.2.6. Impact of Early Stopping
Early stopping was applied after epoch 38 due to the plateau in validation accuracy. The decision to halt training was supported by the fact that validation performance had saturated, and further training would likely not result in substantial improvements. This is reflected in
Figure 12b,d, where the validation curves level off in later epochs, ensuring that the model did not overfit and maintained strong generalization.
4.2.7. Learning Rate Scheduling
The learning rate was reduced from 10
−4 to 10
−5 at epoch 33. This adjustment helped fine-tune the model’s parameters as it approached its optimal performance. While the reduction in learning rate allowed for more refined updates,
Figure 12b shows that no significant improvements in validation accuracy were achieved afterward. Nevertheless, this fine-tuning allowed the model to stabilize and avoid large fluctuations.
4.2.8. Test Set Performance
Upon final evaluation, the model achieved a test accuracy of 92.73%, with precision at 93.02% and recall at 88.00%. These test set results align closely with the validation performance, indicating that the model’s learning and generalization capabilities were consistent across both seen and unseen data. The test set performance reflects the robustness of the model, confirming its ability to generalize well.
4.3. Performance Evaluation of EFFRES-DrowsyNet Across 40 Epochs on the NTHU-DDD Dataset
This section presents a comprehensive analysis of the EFFRES-DrowsyNet model’s performance during a 40-epoch training procedure on the NTHU-DDD dataset. The evaluation includes a detailed epoch-wise discussion of classification metrics of accuracy, precision, recall, and loss, as illustrated in
Figure 13. The model exhibited consistent improvements across most metrics, with signs of convergence and stabilization toward the later epochs.
During the initial epochs (1 to 3), the model demonstrated a rapid learning phase, with training accuracy rising from 61.14% to 76.70% and validation accuracy improving from 57.58% to 84.10%. This steep ascent is visible in
Figure 13b, indicating that the model quickly internalized fundamental feature representations. Precision and recall also showed marked gains in this phase. Training precision increased from 58.25% to 77.57%, and recall rose from 53.75% to 69.17%, as seen in
Figure 13c,d. Meanwhile, the validation precision surged to 95.11%, accompanied by a recalibration in recall from 99.58% to 68.85%, suggesting an early correction from over-sensitivity to a more balanced classification behavior.
Between epochs 4 and 10, training accuracy continued to rise, reaching 86.95%, while validation accuracy climbed steadily to 89.26%. Precision and recall also improved, with training recall surpassing 82.80%, indicating improved consistency in detecting true positives. This phase was characterized by stable validation performance, despite fluctuations in validation loss (
Figure 13a), reflecting the model’s increasing robustness.
From epochs 11 to 17, validation accuracy stabilized around 94.28%, while training accuracy improved to 90.06%. These trends suggest that the model reached a saturation point in terms of generalization capacity. Training precision and recall remained high (above 88%), while validation precision and recall stabilized around 93–94% and 94%, respectively. This balance reflects the model’s solid classification performance across both classes.
Epochs 18 to 28 marked the optimal performance window. Validation accuracy peaked at 95.39% (epoch 28), with precision and recall maintaining high and stable values. Training metrics continued to improve during this period—training accuracy rose to 92.65%, and recall reached 91.72%—but the validation curves (
Figure 13b–d) plateaued, indicating limited additional benefit from continued training. Validation loss reached its lowest value of 0.1157 at epoch 28 (
Figure 13a), further reinforcing the model’s convergence.
In the final phase (epochs 29 to 40), training accuracy increased incrementally to 94.03%, with precision and recall exceeding 93%. Validation accuracy remained stable, ranging from 94.91% to 95.66%, while precision and recall continued to hover around 94–95%. The consistency of these metrics, as illustrated in
Figure 13, confirms that the model had reached its learning capacity by the final epoch. Despite minor fluctuations in validation loss, no significant performance gains were observed after epoch 28, supporting the model’s convergence.
4.4. Comparison Between the Proposed Hybrid Deep Learning Model and Existing Models on SUST-DDD and NTHU-DDD Datasets
To evaluate the effectiveness of the proposed hybrid model, EffRes-DrowsyNet, in detecting driver drowsiness, a comprehensive comparative analysis was conducted against several established models, including VGG19 + LSTM, VGG16 + LSTM, AlexNet + LSTM, VGG-FaceNet + LSTM, MobileNetV2 + 3D CNN, PMLDB, and a CNN ensemble approach. These models were originally applied to the SUST-DDD and NTHU-DDD datasets. Performance was evaluated using three key metrics—accuracy, precision, and recall—which are critical for assessing reliability in safety-critical applications. As shown in
Table 5, the proposed hybrid model consistently outperforms all prior models across these metrics. It achieves a peak accuracy of 97.71% on the SUST-DDD dataset and 95.14% on the NTHU-DDD dataset, with balanced precision and recall, demonstrating superior detection capability. These results affirm the model’s suitability for real-time driver monitoring systems where both detection accuracy and robustness are essential.
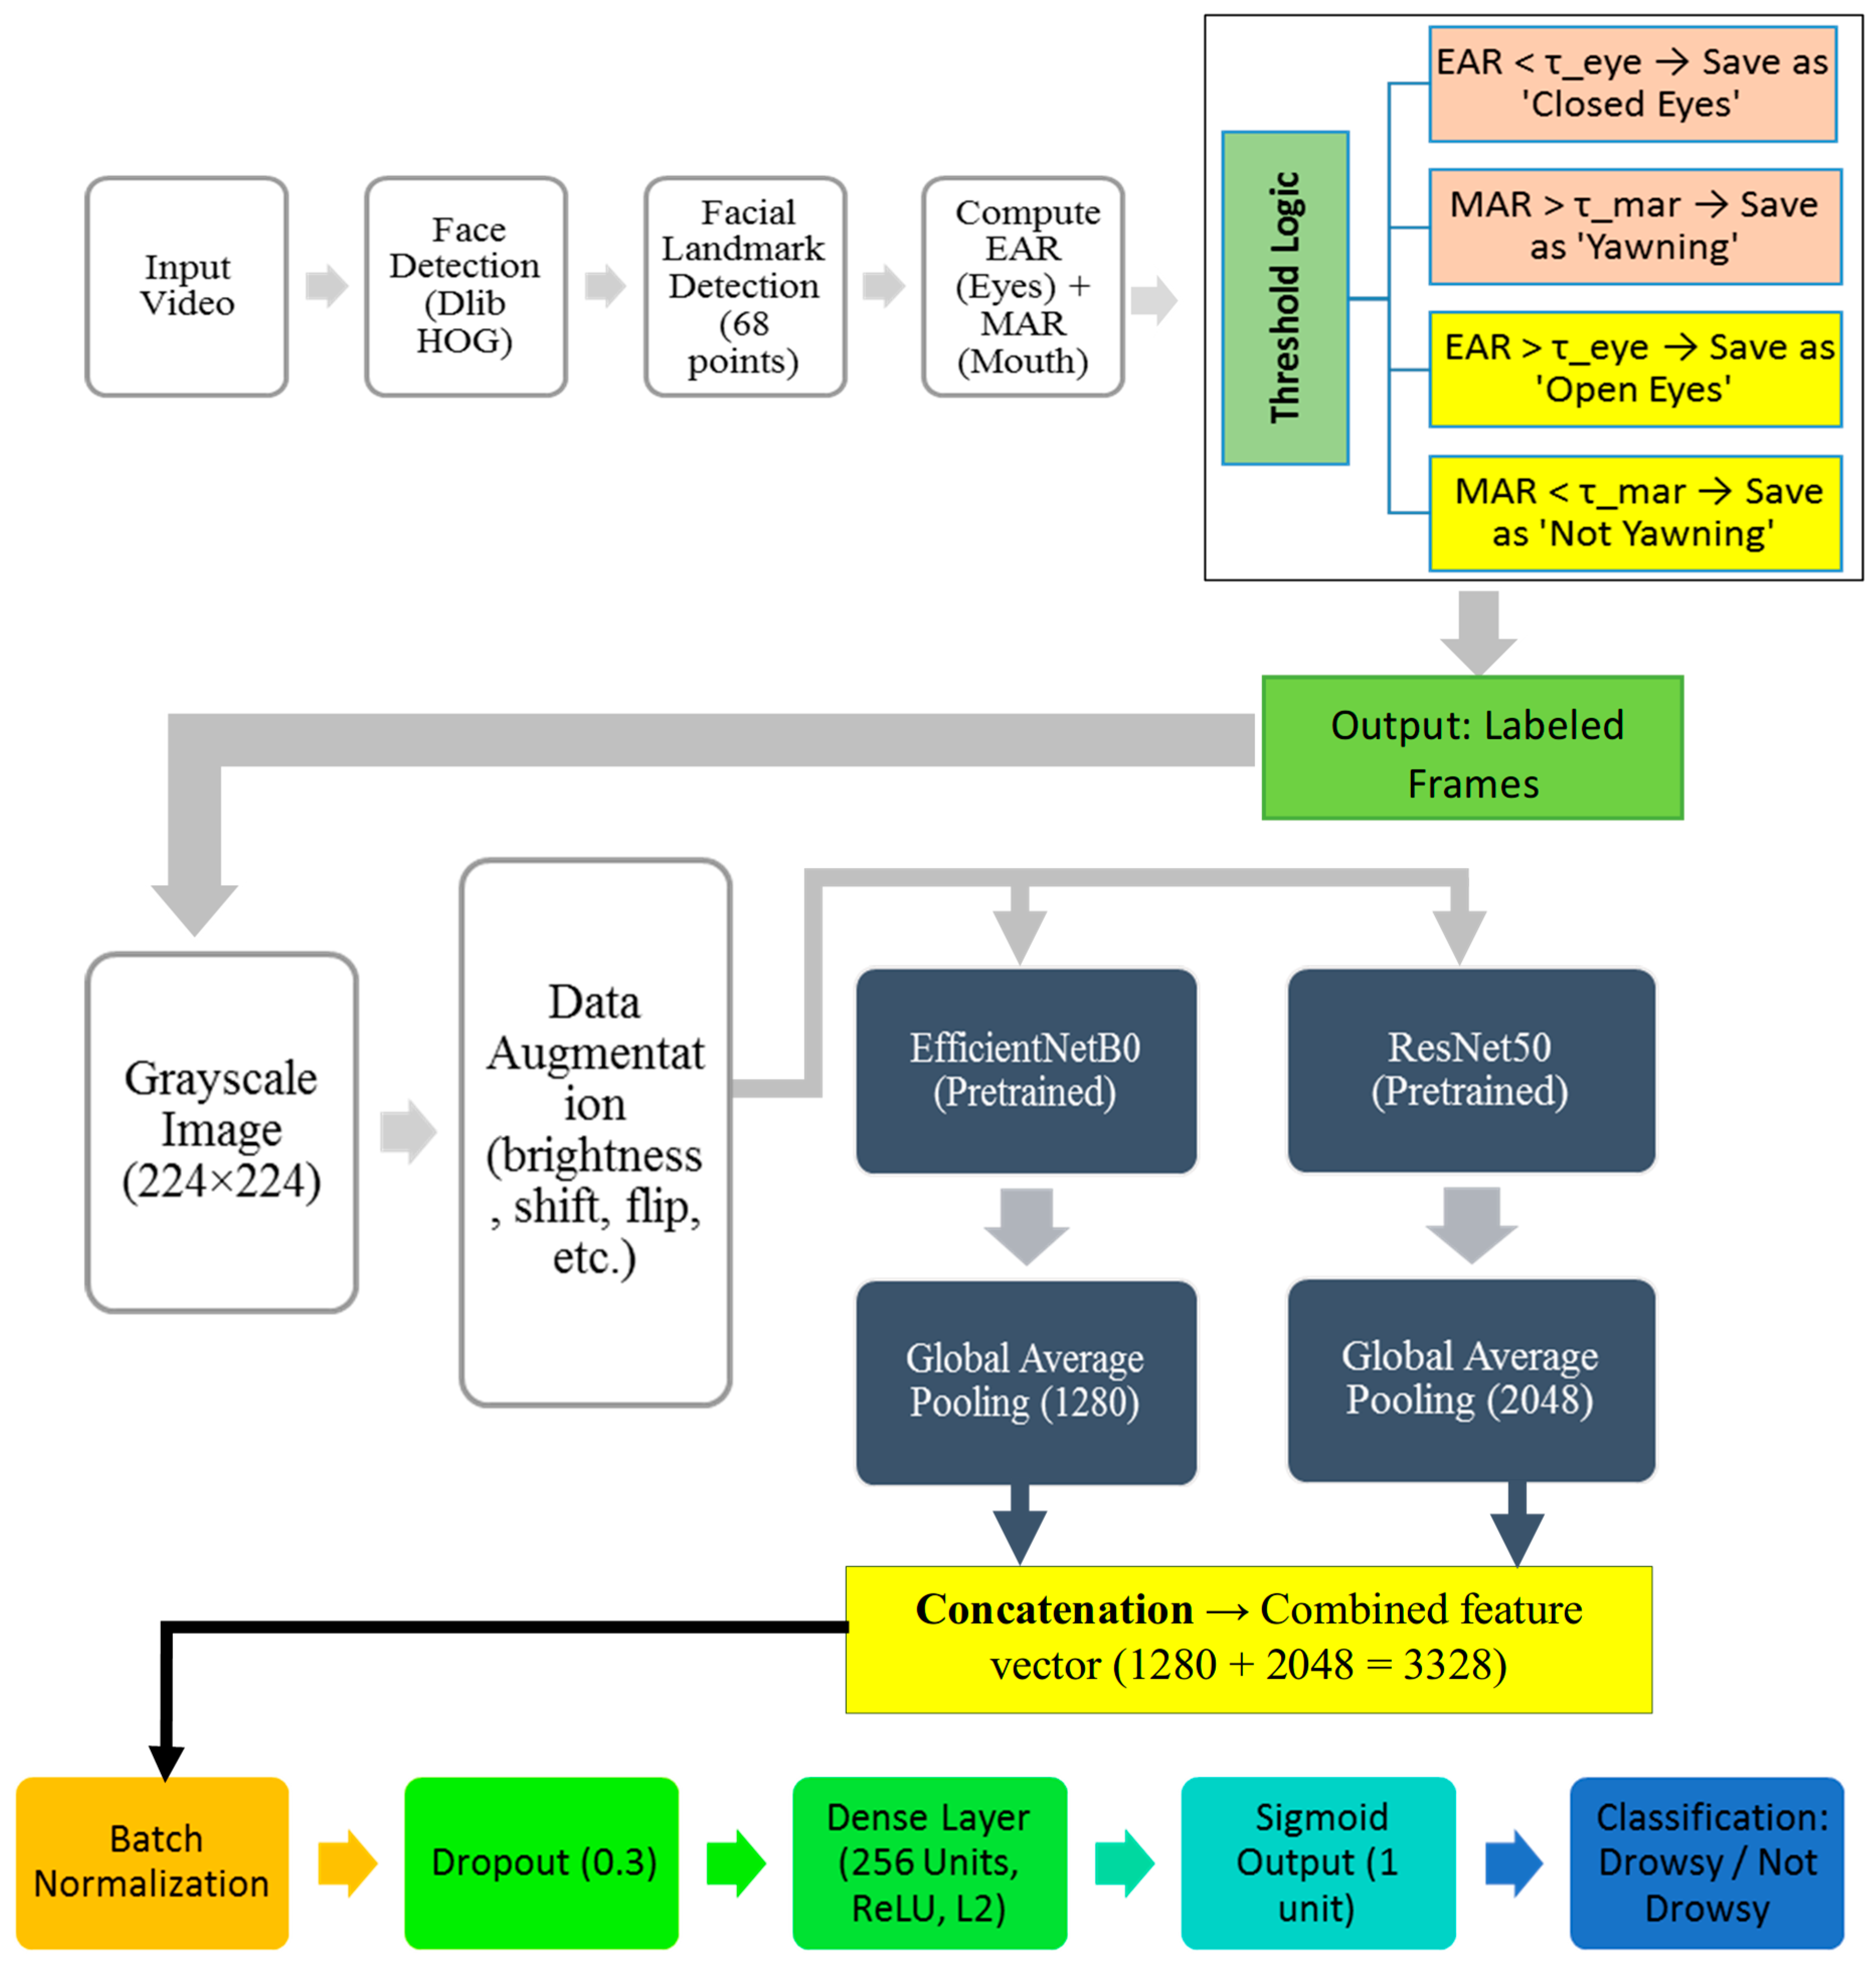
The increase in EffRes-DrowsyNet performance is mainly due to how its components work together. By combining two powerful networks, EfficientNetB0 and ResNet50, the model can learn detailed facial patterns and overall facial patterns, which helps to process changes in facial position, lighting, and expression. Another important factor is the use of EAR and MAR calculations during data labeling. This step helps to select only frames that make sense, such as when the eyes are closed or when a person yawns, making the training data more accurate and relevant. We also applied several data augmentation techniques to make the model more robust and prevent it from overfitting. Most importantly, the uses of dropout, batch normalization, and learning rate schedulers enable models to be trained more efficiently. When we put all of this together, EffRes-DrowsyNet consistently shows better accuracy, precision, and recall compared to other models.
4.5. Computational Complexity and Inference Efficiency
The proposed EffRes-DrowsyNet model was trained and evaluated using a dedicated compute node equipped with an Intel Xeon® CPU E5-1680 (16 cores; Intel Corporation, Santa Clara, CA, USA), 256 GB RAM, and an NVIDIA Quadro M4000 GPU (NVIDIA Corporation, Santa Clara, CA, USA). For model development, we used Python 2.7.18 and the latest compatible versions available: TensorFlow 1.15.0 (Google LLC, Mountain View, CA, USA) and Keras 2.2.4 (François Chollet et al., community-maintained, USA). The model’s dual-stream architecture leveraged EfficientNetB0 and ResNet50 backbones.
During inference, the model achieved an average processing time of approximately 28 ms per frame, enabling real-time performance at ~35–40 FPS. The EfficientNetB0 component provides a lightweight feature extraction path, while ResNet50 contributes deeper hierarchical features. Their combination offers a strong accuracy–efficiency trade-off without introducing excessive computational overhead.
Moreover, the use of ROI extraction (eye and mouth regions) helps limit the input data processed per frame, which further reduces latency. Although the current setup ensures real-time feasibility in research environments, future deployment on embedded automotive hardware may benefit from model optimization techniques such as pruning, quantization, or conversion to TensorRT or ONNX formats.


 ,
, 