
Substation Equipment Defect Detection Based on Improved YOLOv8


Abstract
1. Introduction
2. Related Works
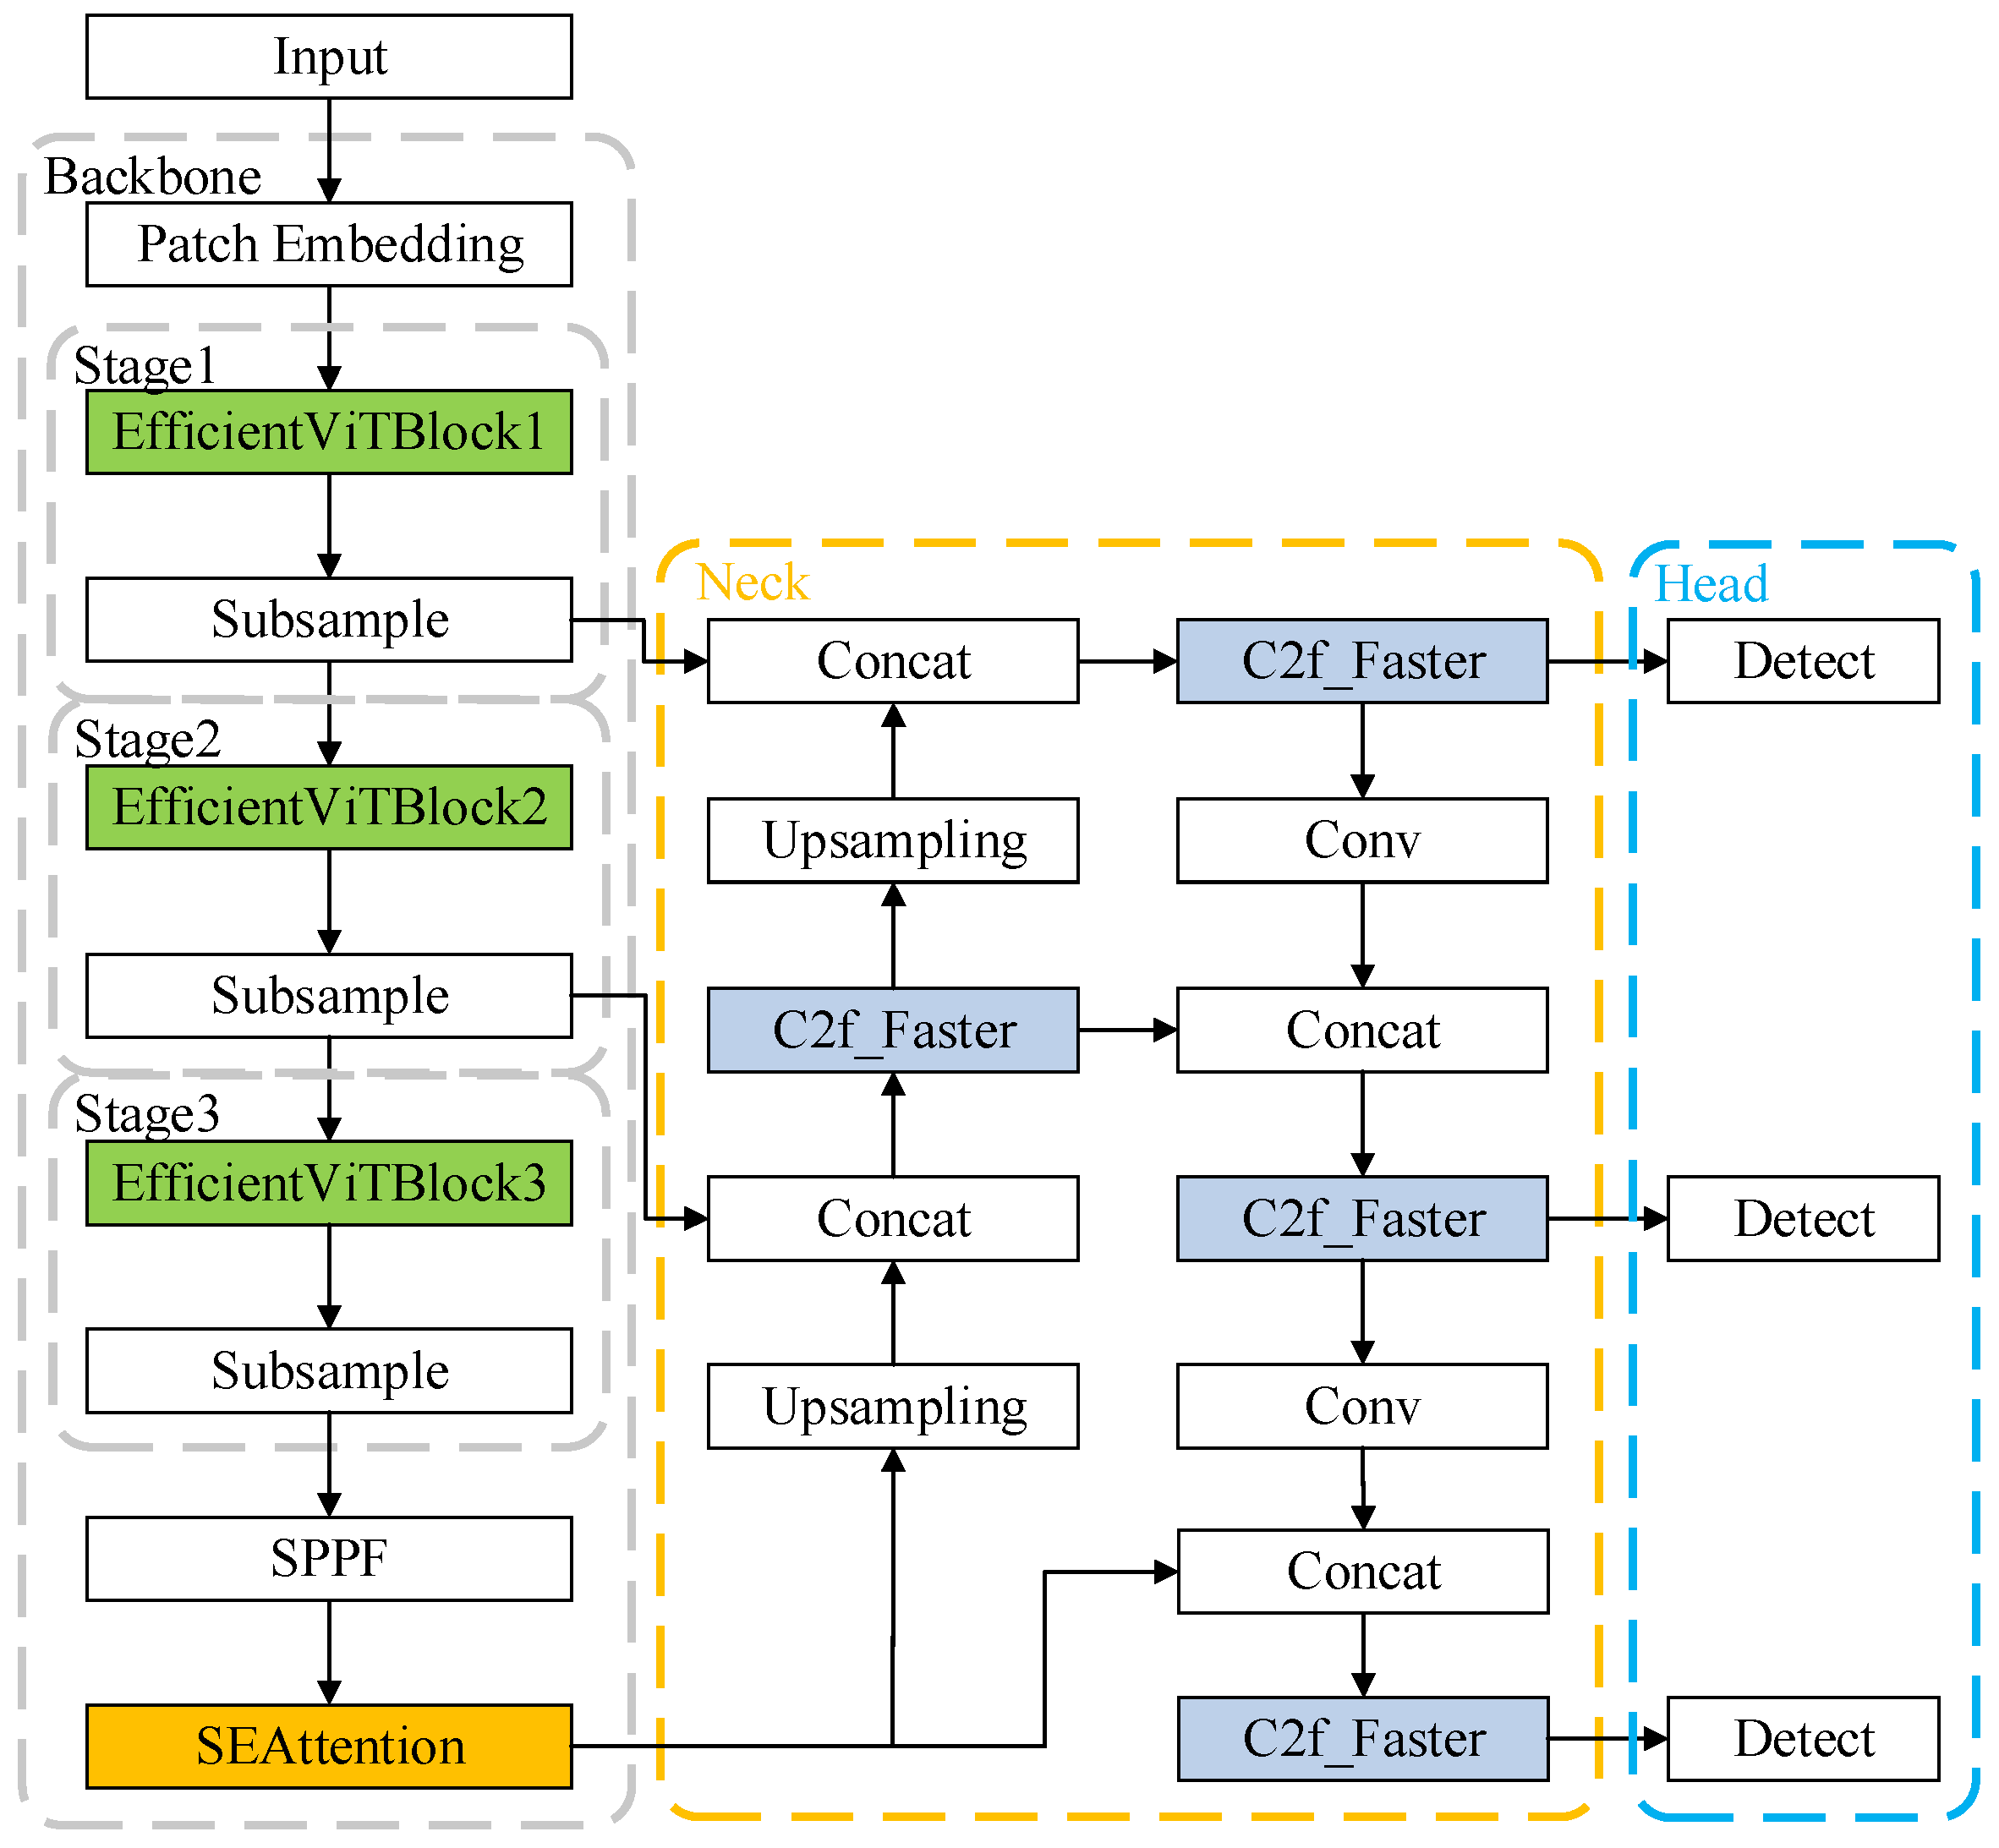
3. Proposed Methods
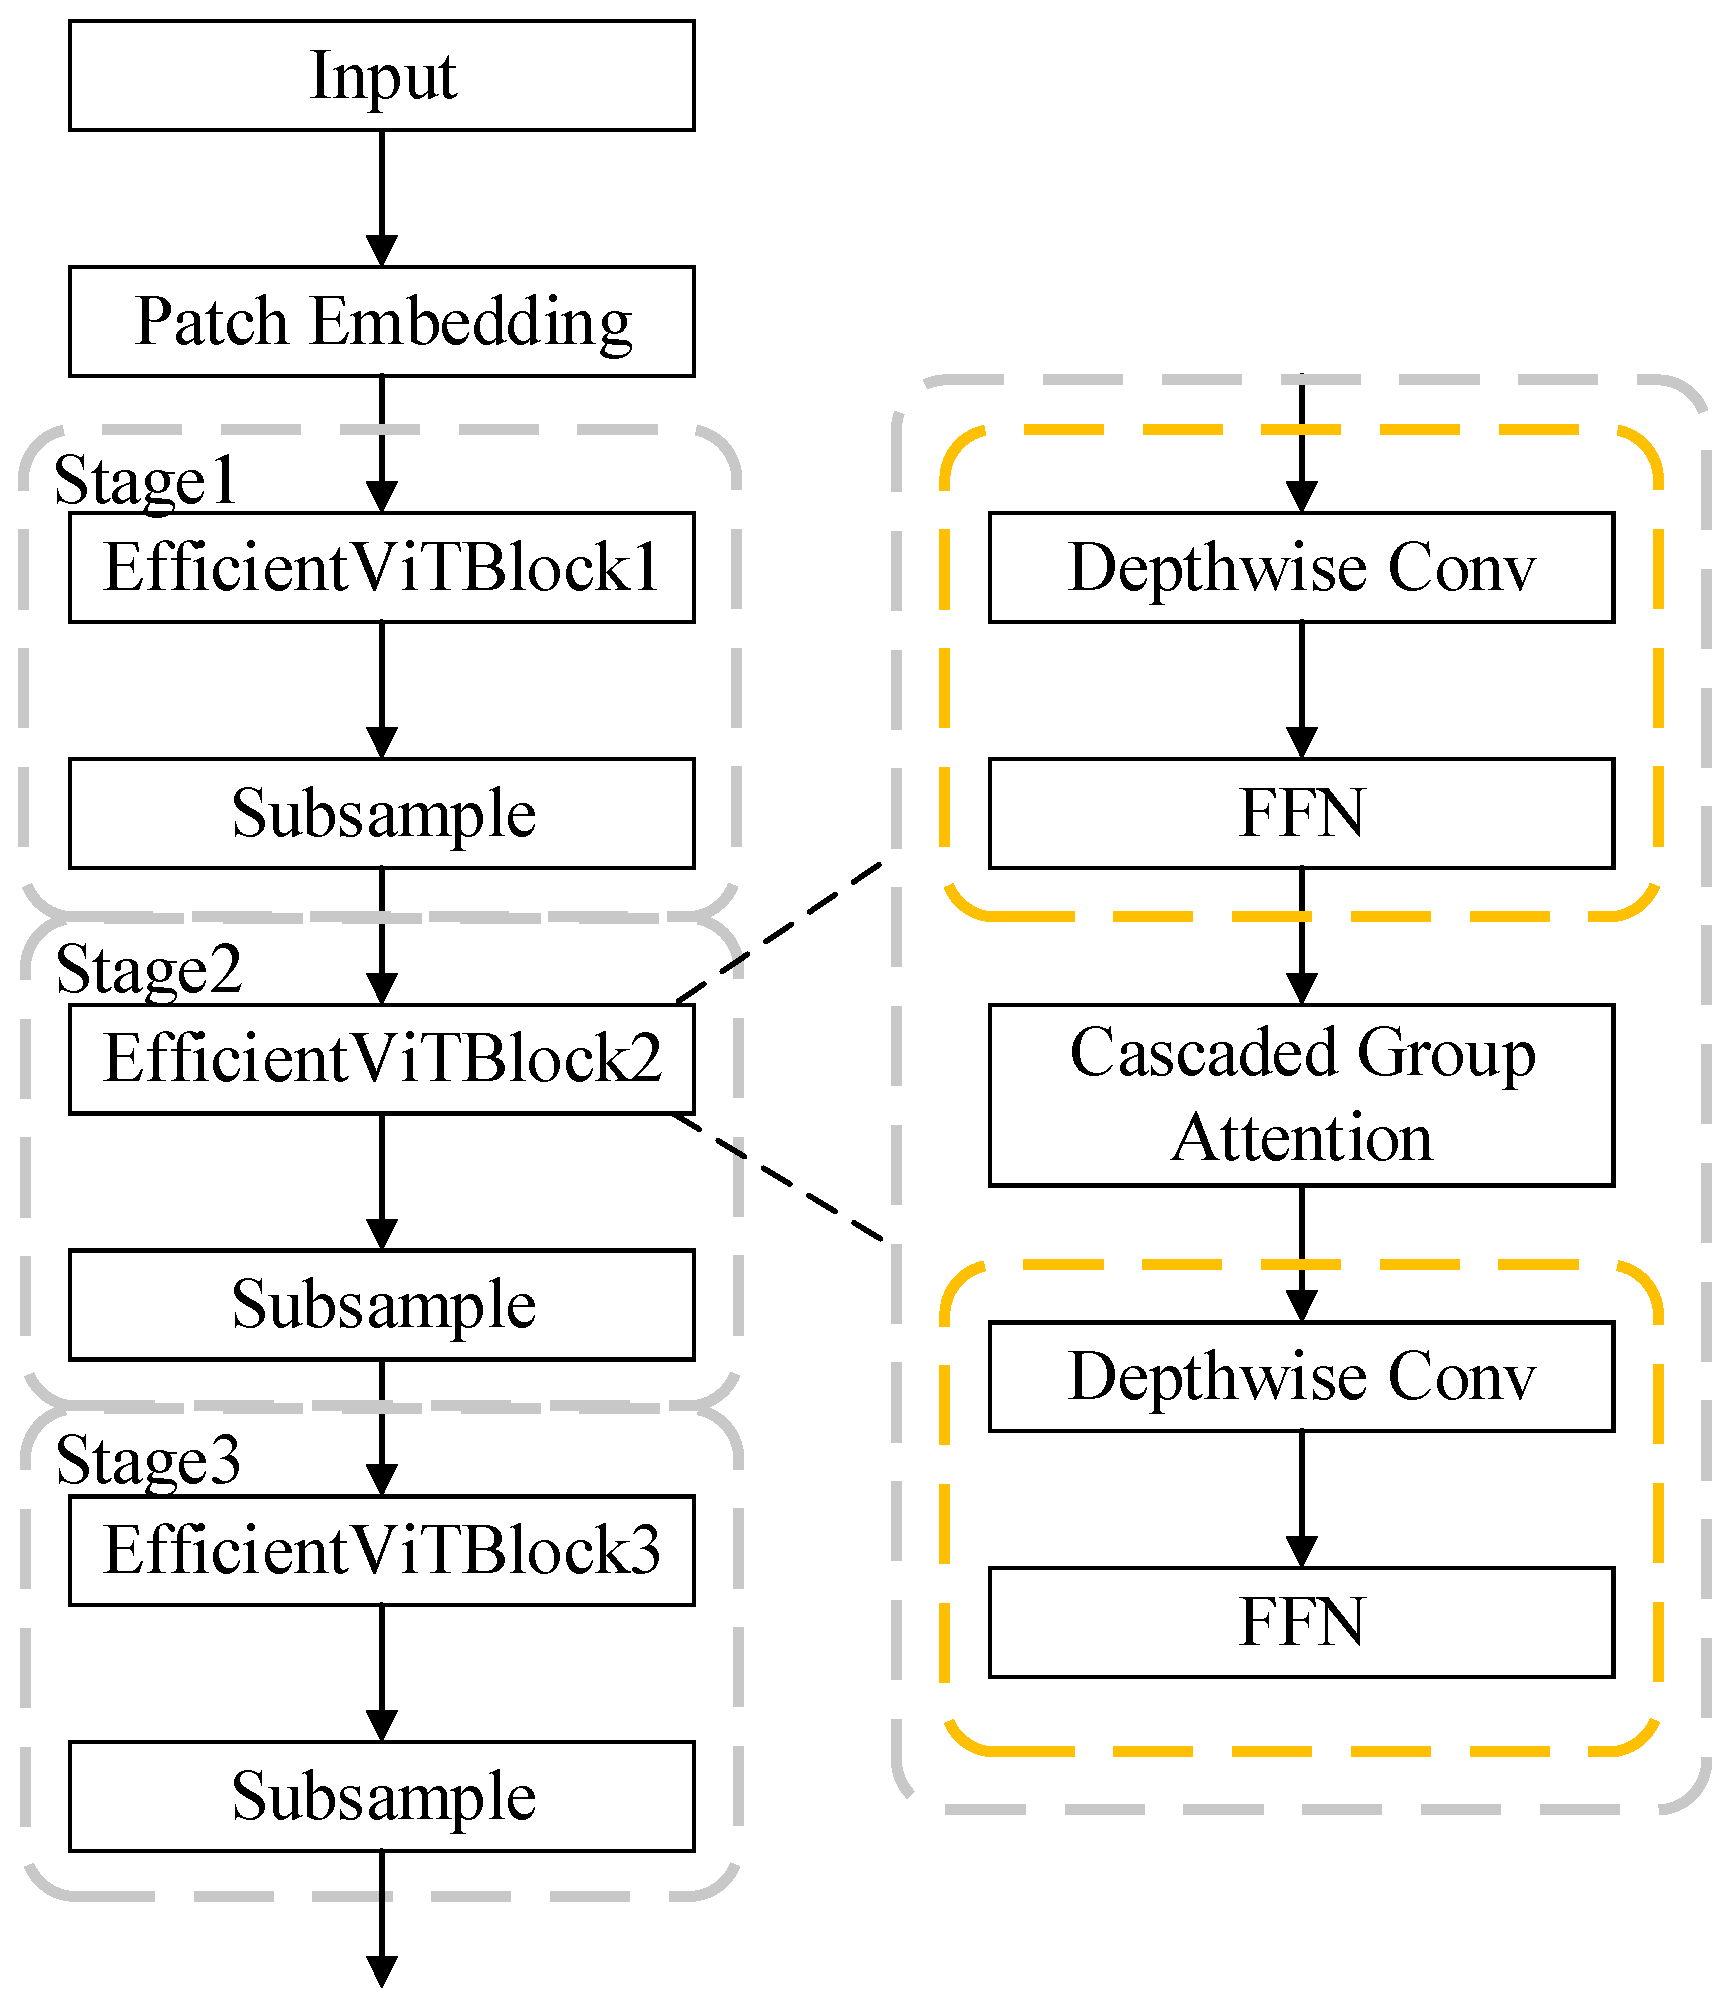
3.1. EfficientViT
3.2. SE Attention Mechanism Module
3.3. FasterBlock Module
4. Experiments
4.1. Experimental Setup
4.2. Dataset
4.3. Evaluation Indicators
4.4. Experimental Results and Analysis
4.4.1. Defect Type Detection Experiment
4.4.2. Ablation Experiment
4.4.3. Comparative Experiment of Different Algorithms
4.4.4. Robustness Experiment
5. Discussion and Conclusions
Author Contributions
Funding
Institutional Review Board Statement
Informed Consent Statement
Data Availability Statement
Conflicts of Interest
References
- Wang, W.; Lin, W.; He, G.; Shi, W.; Feng, S. Enlightenment of 2021 Texas blackout to the renewable energy development in China. Proc. CSEE 2021, 41, 4033–4043. [Google Scholar]
- Li, R.; Gong, D. Research on defect detection method of intelligent substation electrical equipment. China High New Technol. 2023, 23, 103–105. [Google Scholar]
- Zhang, M.; Xing, F.; Liu, D. External defect detection of transformer substation equipment based on improved Faster R-CNN. CAAI Trans. Intell. Syst. 2024, 19, 290–298. [Google Scholar]
- Huang, T.; Li, Y.; Wang, L.; Liu, A. Defect detection method for substations with multi-class classification based on improved YOLOv7-tiny. Control Eng. China 2024, 1–9. [Google Scholar] [CrossRef]
- Varghese, R.; Sambath, M. YOLOv8: A Novel Object Detection Algorithm with Enhanced Performance and Robustness. In Proceedings of the International Conference on Advances in Data Engineering and Intelligent Computing Systems, Chennai, India, 18–19 April 2024; pp. 1–6. [Google Scholar]
- Liu, X.; Peng, H.; Zheng, N.; Yang, Y.; Hu, H.; Yuan, Y. EfficientViT: Memory Efficient Vision Transformer with Cascaded Group Attention. In Proceedings of the IEEE/CVF Conference on Computer Vision and Pattern Recognition (CVPR), Vancouver, BC, Canada, 17–24 June 2023; pp. 14420–14430. [Google Scholar]
- Hu, J.; Shen, L.; Sun, G. Squeeze-and-Excitation Networks. In Proceedings of the IEEE/CVF Conference on Computer Vision and Pattern Recognition (CVPR), Salt Lake City, UT, USA, 18–23 June 2018; pp. 7132–7141. [Google Scholar]
- Ren, S.; He, K.; Girshick, R.; Sun, J. Faster R-CNN: Towards real-time object detection with region proposal networks. IEEE Trans. Pattern Anal. Mach. Intell. 2017, 39, 1137–1149. [Google Scholar] [CrossRef]
- He, K.; Gkioxari, G.; Dollar, P.; Girshick, R. Mask R-CNN. IEEE Trans. Pattern Anal. Mach. Intell. 2020, 42, 386–397. [Google Scholar] [CrossRef] [PubMed]
- Kang, X.; Deng, C.; Wu, Y.; Ge, L.; Zhu, D.; Wang, J. Defect detection of substation equipment based on improved Faster R-CNN. Inf. Technol. Informatiz. 2024, 11, 85–88. [Google Scholar]
- Yu, H.; Gong, Z.; Zhang, H.; Zhou, S.; Yu, Z. Research on substation equipment identification and defect detection technology based on Faster R-CNN algorithm. Electr. Meas. Instrum. 2024, 61, 153–159. [Google Scholar]
- Yang, Y. Research on substation equipment fault diagnosis based on Faster R-CNN algorithm. Lamps Light. 2024, 08, 165–167. [Google Scholar]
- Luo, X.; Zhang, Z. Defect detection for substation based on improved YOLOX. J. Jilin Univ. (Inf. Sci. Ed.) 2023, 41, 848–857. [Google Scholar]
- Dong, H.; Yuan, M.; Wang, S.; Zhang, L.; Bao, W.; Liu, Y.; Hu, Q. PHAM-YOLO: A Parallel Hybrid Attention Mechanism Network for Defect Detection of Meter in Substation. Sensors 2023, 23, 6052. [Google Scholar] [CrossRef]
- Wang, Q.; Yang, L.; Zhou, B.; Luan, Z.; Zhang, J. YOLO-SS-Large: A Lightweight and High-Performance Model for Defect Detection in Substations. Sensors 2023, 23, 8080. [Google Scholar] [CrossRef] [PubMed]
- Zhang, N.; Yang, G.; Wang, D.; Hu, F.; Yu, H.; Fan, J. A Defect Detection Method for Substation Equipment Based on Image Data Generation and Deep Learning. IEEE Access 2024, 12, 105042–105054. [Google Scholar] [CrossRef]
- Wang, J.; Sun, Y.; Lin, Y.; Zhang, K. Lightweight Substation Equipment Defect Detection Algorithm for Small Targets. Sensors 2024, 24, 5914. [Google Scholar] [CrossRef] [PubMed]
- Song, X.; Sun, Q.; Liu, J.; Liu, R. ES-YOLOv8: A real-time defect detection algorithm in transmission line insulators. J. Real-Time Image Proc. 2025, 22, 69. [Google Scholar] [CrossRef]
- Wu, E.; Ma, R.; Dong, D.; Zhao, X. D-YOLO: A Lightweight Model for Strawberry Health Detection. Agriculture 2025, 15, 570. [Google Scholar] [CrossRef]
- Hu, Z.; Mei, H.; Yu, L. An intelligent prediction method for rock core integrity based on deep learning. Sci. Rep. 2025, 15, 6456. [Google Scholar] [CrossRef]
- Liu, T.; Gu, M.; Sun, S. RIEC-YOLO: An improved road defect detection model based on YOLOv8. SIViP 2025, 19, 285. [Google Scholar] [CrossRef]
- Ren, J.; Zhang, H.; Yue, M. YOLOv8-WD: Deep Learning-Based Detection of Defects in Automotive Brake Joint Laser Welds. Appl. Sci. 2025, 15, 1184. [Google Scholar] [CrossRef]
- Redmon, J.; Divvala, S.; Girshick, R.; Farhadi, A. You Only Look Once: Unified, Real-Time Object Detection. In Proceedings of the IEEE Conference on Computer Vision and Pattern Recognition (CVPR), Las Vegas, NV, USA, 27–30 June 2016; pp. 779–788. [Google Scholar]
- Wang, C.-Y.; Bochkovskiy, A.; Liao, H.-Y.M. YOLOv7: Trainable Bag-of-Freebies Sets New State-of-the-Art for Real-Time Object Detectors. In Proceedings of the IEEE/CVF Conference on Computer Vision and Pattern Recognition (CVPR), Vancouver, BC, Canada, 17–24 June 2023; pp. 7464–7475. [Google Scholar]
- Wang, C.-Y.; Mark Liao, H.-Y.; Wu, Y.-H.; Chen, P.-Y.; Hsieh, J.-W.; Yeh, I.-H. CSPNet: A New Backbone that can Enhance Learning Capability of CNN. In Proceedings of the IEEE/CVF Conference on Computer Vision and Pattern Recognition Workshops (CVPRW), Seattle, WA, USA, 14–19 June 2020; pp. 1571–1580. [Google Scholar]
- Liu, S.; Qi, L.; Qin, H.; Shi, J.; Jia, J. Path Aggregation Network for Instance Segmentation. In Proceedings of the IEEE/CVF Conference on Computer Vision and Pattern Recognition, Salt Lake City, UT, USA, 18–23 June 2018; pp. 8759–8768. [Google Scholar]
- Tan, M.; Pang, R.; Le, Q. EfficientDet: Scalable and Efficient Object Detection. In Proceedings of the IEEE/CVF Conference on Computer Vision and Pattern Recognition (CVPR), Seattle, WA, USA, 13–19 June 2020; pp. 10778–10787. [Google Scholar]
- Dosovitskiy, A.; Beyer, L.; Kolesnikov, A.; Weissenborn, D.; Zhai, X.; Unterthiner, T.; Dehghani, M.; Minderer, M.; Heigold, G.; Gelly, S.; et al. An image is worth 16×16 words: Transformers for image recognition at scale. arXiv 2020, arXiv:2010.11929. [Google Scholar]
- Vaswani, A.; Shazeer, N.; Parmar, N.; Uszkoreit, J.; Jones, L.; Gomez, A.N.; Kaiser, L.; Polosukhin, L. Attention is all you need. arXiv 2017, arXiv:1706.03762. [Google Scholar]
- Howard, A.; Zhu, M.; Chen, B.; Kalenichenko, D.; Wang, W.; Weyand, T.; Andreetto, M.; Adam, H. Mobilenets: Efficient convolutional neural networks for mobile vision applications. arXiv 2017, arXiv:1704.04861. [Google Scholar]
- Shen, L.; Sun, G.; Huang, Q.; Wang, S.; Lin, Z.; Wu, E. Multi-Level Discriminative Dictionary Learning With Application to Large Scale Image Classification. IEEE Trans. Image Process. 2015, 24, 3109–3123. [Google Scholar] [CrossRef]
- Elfwing, S.; Uchibe, E.; Doya, K. Sigmoid-weighted linear units for neural network function approximation in reinforcement learning. Neural Netw. 2018, 107, 3–11. [Google Scholar] [CrossRef]
- Chen, J.; Kao, S.-H.; He, H.; Zhuo, W.; Wen, S.; Lee, C.-H.; Gary Chan, S.-H. Run, Don’t Walk: Chasing Higher FLOPS for Faster Neural Networks. In Proceedings of the IEEE/CVF Conference on Computer Vision and Pattern Recognition (CVPR), Vancouver, BC, Canada, 17–24 June 2023; pp. 12021–12031. [Google Scholar]
- Tolstikhin, I.; Houlsby, N.; Kolesnikov, A.; Beyer, L.; Zhai, X.; Unterthiner, T.; Yung, J.; Steiner, A.; Keysers, D.; Uszkoreit, J.; et al. Mlp-mixer: An all-mlp architecture for vision. Adv. Neural Inf. Process. Syst. 2024, 34, 24261–24272. [Google Scholar]
- Redmon, J.; Farhadi, A. YOLOv3: An incremental improvement. arXiv 2018, arXiv:1804.02767. [Google Scholar]
- Li, C.; Li, L.; Jiang, H.; Weng, K.; Geng, Y.; Li, L.; Ke, Z.; Li, Q.; Cheng, M.; Nie, W.; et al. YOLOv6: A single-stage object detection framework for industrial applications. arXiv 2022, arXiv:2209.02976. [Google Scholar]
- Wang, C.; Yeh, I.; Liao, H. YOLOv9: Learning What You Want to Learn Using Programmable Gradient Information. arXiv 2024, arXiv:2402.13616. [Google Scholar]
- Khanam, R.; Hussain, M. YOLOv11: An Overview of the Key Architectural Enhancements. arXiv 2024, arXiv:2410.17725. [Google Scholar]


| Defect Type | Label Name | Sample Number |
|---|---|---|
| Abnormal oil level gauge reading | bjdsyc_ywj | 336 |
| Abnormal pointer reading | bjdsyc_zz | 1234 |
| Pressure plate is in abnormal state | kgg_ybf | 324 |
| Panel screen | mbhp | 342 |
| Damaged dial | bj_bpps | 357 |
| Abnormal oil level observation window | bjdsyc_ywc | 216 |
| Defect Type | Label Name | YOLOv8n (AP50) | Ours (AP50) |
|---|---|---|---|
| Abnormal oil level gauge reading | bjdsyc_ywj | 88.8% | 89.8% |
| Abnormal pointer reading | bjdsyc_zz | 91.3% | 92.4% |
| Pressure plate is in abnormal state | kgg_ybf | 89.8% | 90.6% |
| Panel screen | mbhp | 93.4% | 95.0% |
| Damaged dial | bj_bpps | 92.0% | 93.7% |
| Abnormal oil level observation window | bjdsyc_ywc | 90.6% | 95.0% |
| Model | EfficientViT | SE | C2f_Faster | mAP50 | Params/M | FLOPs/G |
|---|---|---|---|---|---|---|
| YOLOv8n | -- | -- | -- | 91.0% | 3.1 | 8.5 |
| Improved model 1 | √ | -- | -- | 92.1% | 4.1 | 9.8 |
| Improved model 2 | -- | √ | -- | 92.2% | 3.1 | 8.5 |
| Improved model 3 | -- | -- | √ | 91.4% | 2.4 | 6.7 |
| Improved model 4 | √ | √ | -- | 92.6% | 4.1 | 9.8 |
| Improved model 5 | √ | -- | √ | 92.3% | 3.8 | 9.1 |
| Improved model 6 | -- | √ | √ | 92.5% | 2.8 | 7.8 |
| Ours | √ | √ | √ | 92.8% | 3.8 | 9.1 |
| Model | mAP50 | mAP50-95 | Params/M | FLOPs/G | FPS |
|---|---|---|---|---|---|
| Faster R-CNN | 87.5% | 67.3% | 41.4 | 208.3 | 14 |
| YOLOv3n | 89.1% | 67.6% | 8.8 | 13.1 | 119 |
| YOLOv5n | 90.2% | 70.7% | 1.9 | 4.4 | 526 |
| YOLOv6n | 89.7% | 69.8% | 4.5 | 12.8 | 217 |
| YOLOv8n | 91.0% | 78.6% | 3.1 | 8.5 | 322 |
| YOLOv9t | 90.5% | 73.8% | 2.1 | 7.8 | 434 |
| YOLOv11n | 90.8% | 75.7% | 2.6 | 6.5 | 487 |
| Ours | 92.8% | 80.7% | 3.8 | 9.1 | 238 |
| Defect Type | Label Name | Original Images (mAP50) | Poor Lighting (mAP50) | Partial Occlusion (mAP50) |
|---|---|---|---|---|
| Abnormal oil level gauge reading | bjdsyc_ywj | 89.8% | 88.5% | 87.6% |
| Abnormal pointer reading | bjdsyc_zz | 92.4% | 92.1% | 90.2% |
| Pressure plate is in abnormal state | kgg_ybf | 90.6% | 91.5% | 91.0% |
| Panel screen | mbhp | 95.0% | 94.7% | 96.3% |
| Damaged dial | bj_bpps | 93.7% | 91.8% | 90.6% |
| Abnormal oil level observation window | bjdsyc_ywc | 95.0% | 95.1% | 94.6% |
| All classes | -- | 92.8% | 92.3% | 91.7% |
| Image Type | YOLOv8n (mAP50) | Ours (mAP50) |
|---|---|---|
| Original images | 91.0% | 92.8% |
| Poor lighting | 90.3% (↓0.7%) | 92.3% (↓0.5%) |
| Partial occlusion | 89.6% (↓1.4%) | 91.7% (↓1.1%) |
Disclaimer/Publisher’s Note: The statements, opinions and data contained in all publications are solely those of the individual author(s) and contributor(s) and not of MDPI and/or the editor(s). MDPI and/or the editor(s) disclaim responsibility for any injury to people or property resulting from any ideas, methods, instructions or products referred to in the content. |
© 2025 by the authors. Licensee MDPI, Basel, Switzerland. This article is an open access article distributed under the terms and conditions of the Creative Commons Attribution (CC BY) license (https://creativecommons.org/licenses/by/4.0/).
Share and Cite
Sun, Y.; Sun, X.; Lin, Y.; Yang, Y.; Li, Z.; Du, L.; Shi, C. Substation Equipment Defect Detection Based on Improved YOLOv8. Sensors 2025, 25, 3410. https://doi.org/10.3390/s25113410
Sun Y, Sun X, Lin Y, Yang Y, Li Z, Du L, Shi C. Substation Equipment Defect Detection Based on Improved YOLOv8. Sensors. 2025; 25(11):3410. https://doi.org/10.3390/s25113410
Chicago/Turabian StyleSun, Yiwei, Xiangran Sun, Ying Lin, Yi Yang, Zhuangzhuang Li, Lun Du, and Chaojun Shi. 2025. "Substation Equipment Defect Detection Based on Improved YOLOv8" Sensors 25, no. 11: 3410. https://doi.org/10.3390/s25113410
APA StyleSun, Y., Sun, X., Lin, Y., Yang, Y., Li, Z., Du, L., & Shi, C. (2025). Substation Equipment Defect Detection Based on Improved YOLOv8. Sensors, 25(11), 3410. https://doi.org/10.3390/s25113410