
Study on Lightweight Bridge Crack Detection Algorithm Based on YOLO11


Abstract
1. Introduction
- (1)
- The algorithm uses the efficient multiscale conv all (EMSCA) module to process each feature channel separately, thereby replacing the most information-rich channels and the most relevant spatial regions in the original network structure’s backbone and neck with a C3k2 module. As a result, the bridge crack features are extracted well, and the detection accuracy is improved.
- (2)
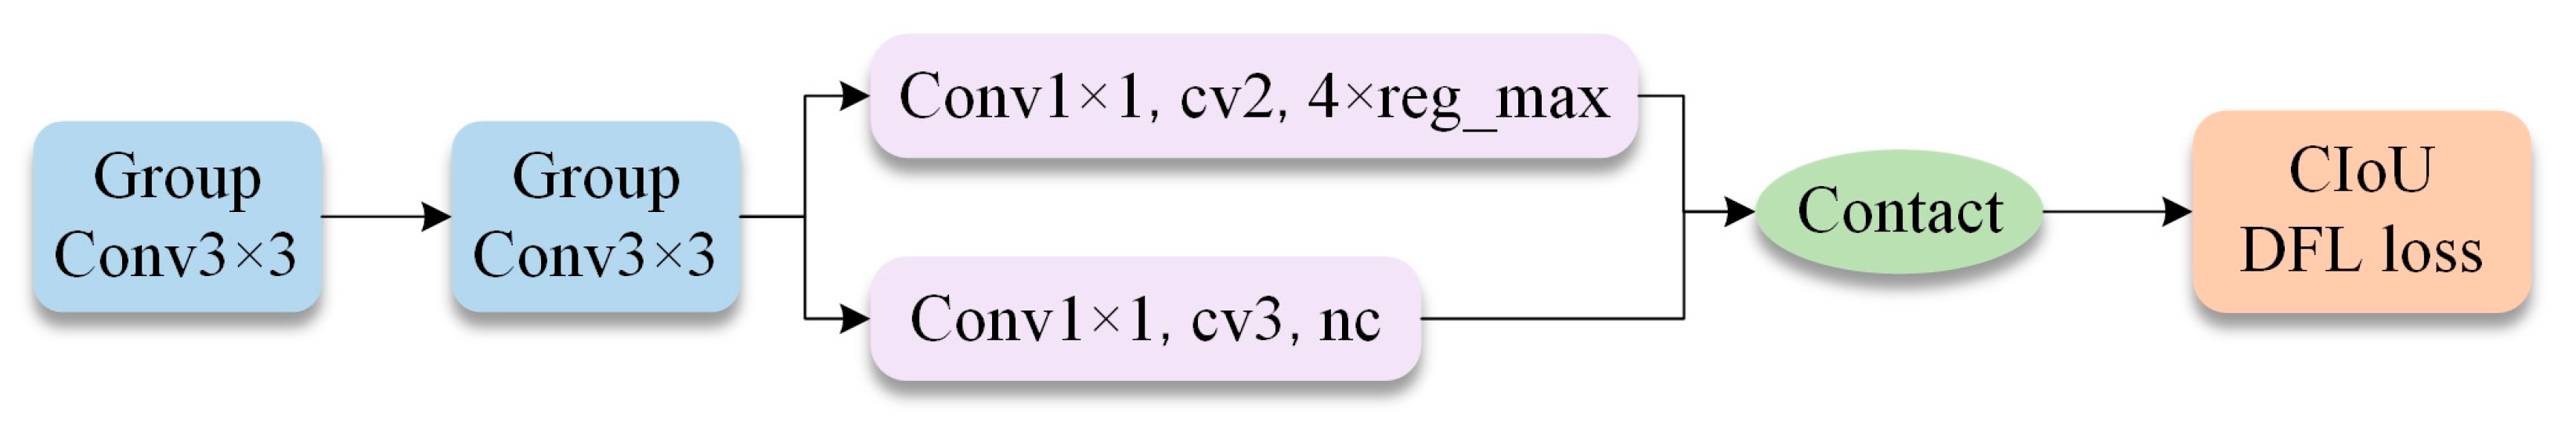
- The lightweight detection head (LDH) is used to replace the detection head in the original network, further reducing parameters and floating-point operations (FLOPs) whilst maintaining detection accuracy to achieve model lightweighting.
- (3)
- The improved algorithm has great practical value for the real-time monitoring and maintenance of bridge cracks. It improves detection accuracy and efficiency. Moreover, its lightweight design enables it to be adapted and deployed on various remote sensing devices such as drone and underwater robot, thereby reducing the difficulty of bridge crack detection in complex environments.
2. Theory of Algorithm
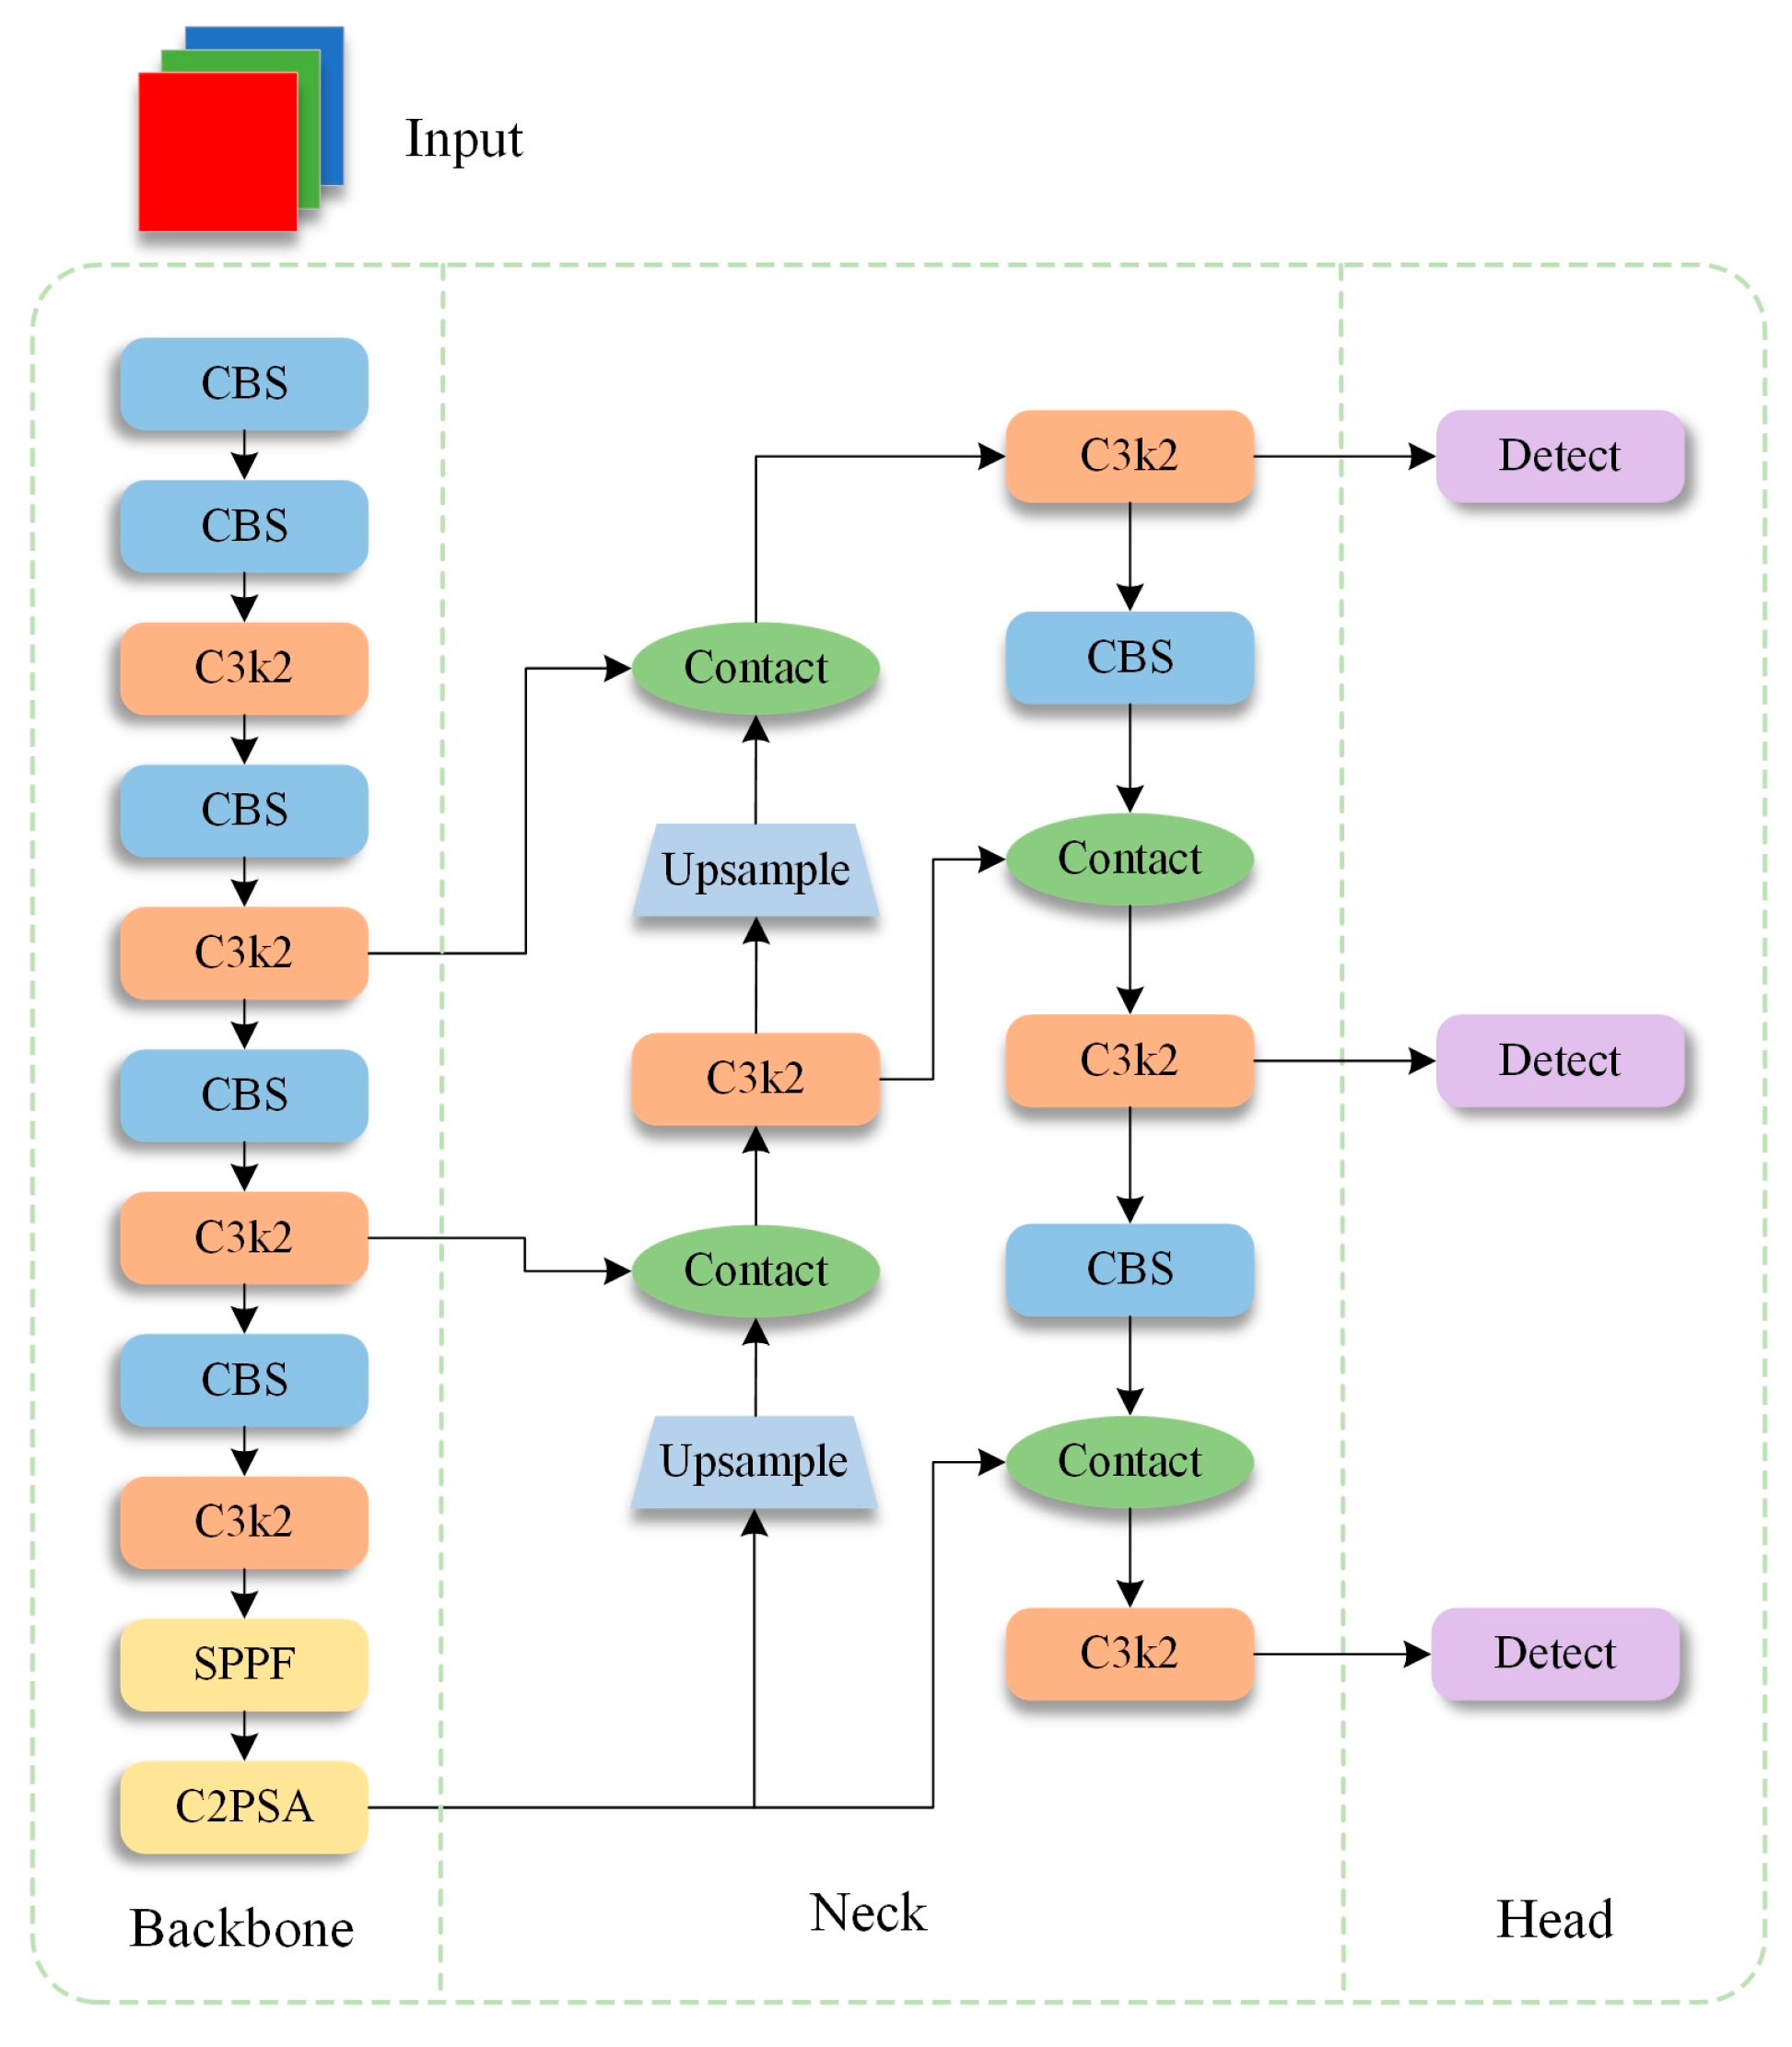
2.1. YOLO11
2.2. YOLO11-BD
2.2.1. EMSCA
2.2.2. LDH
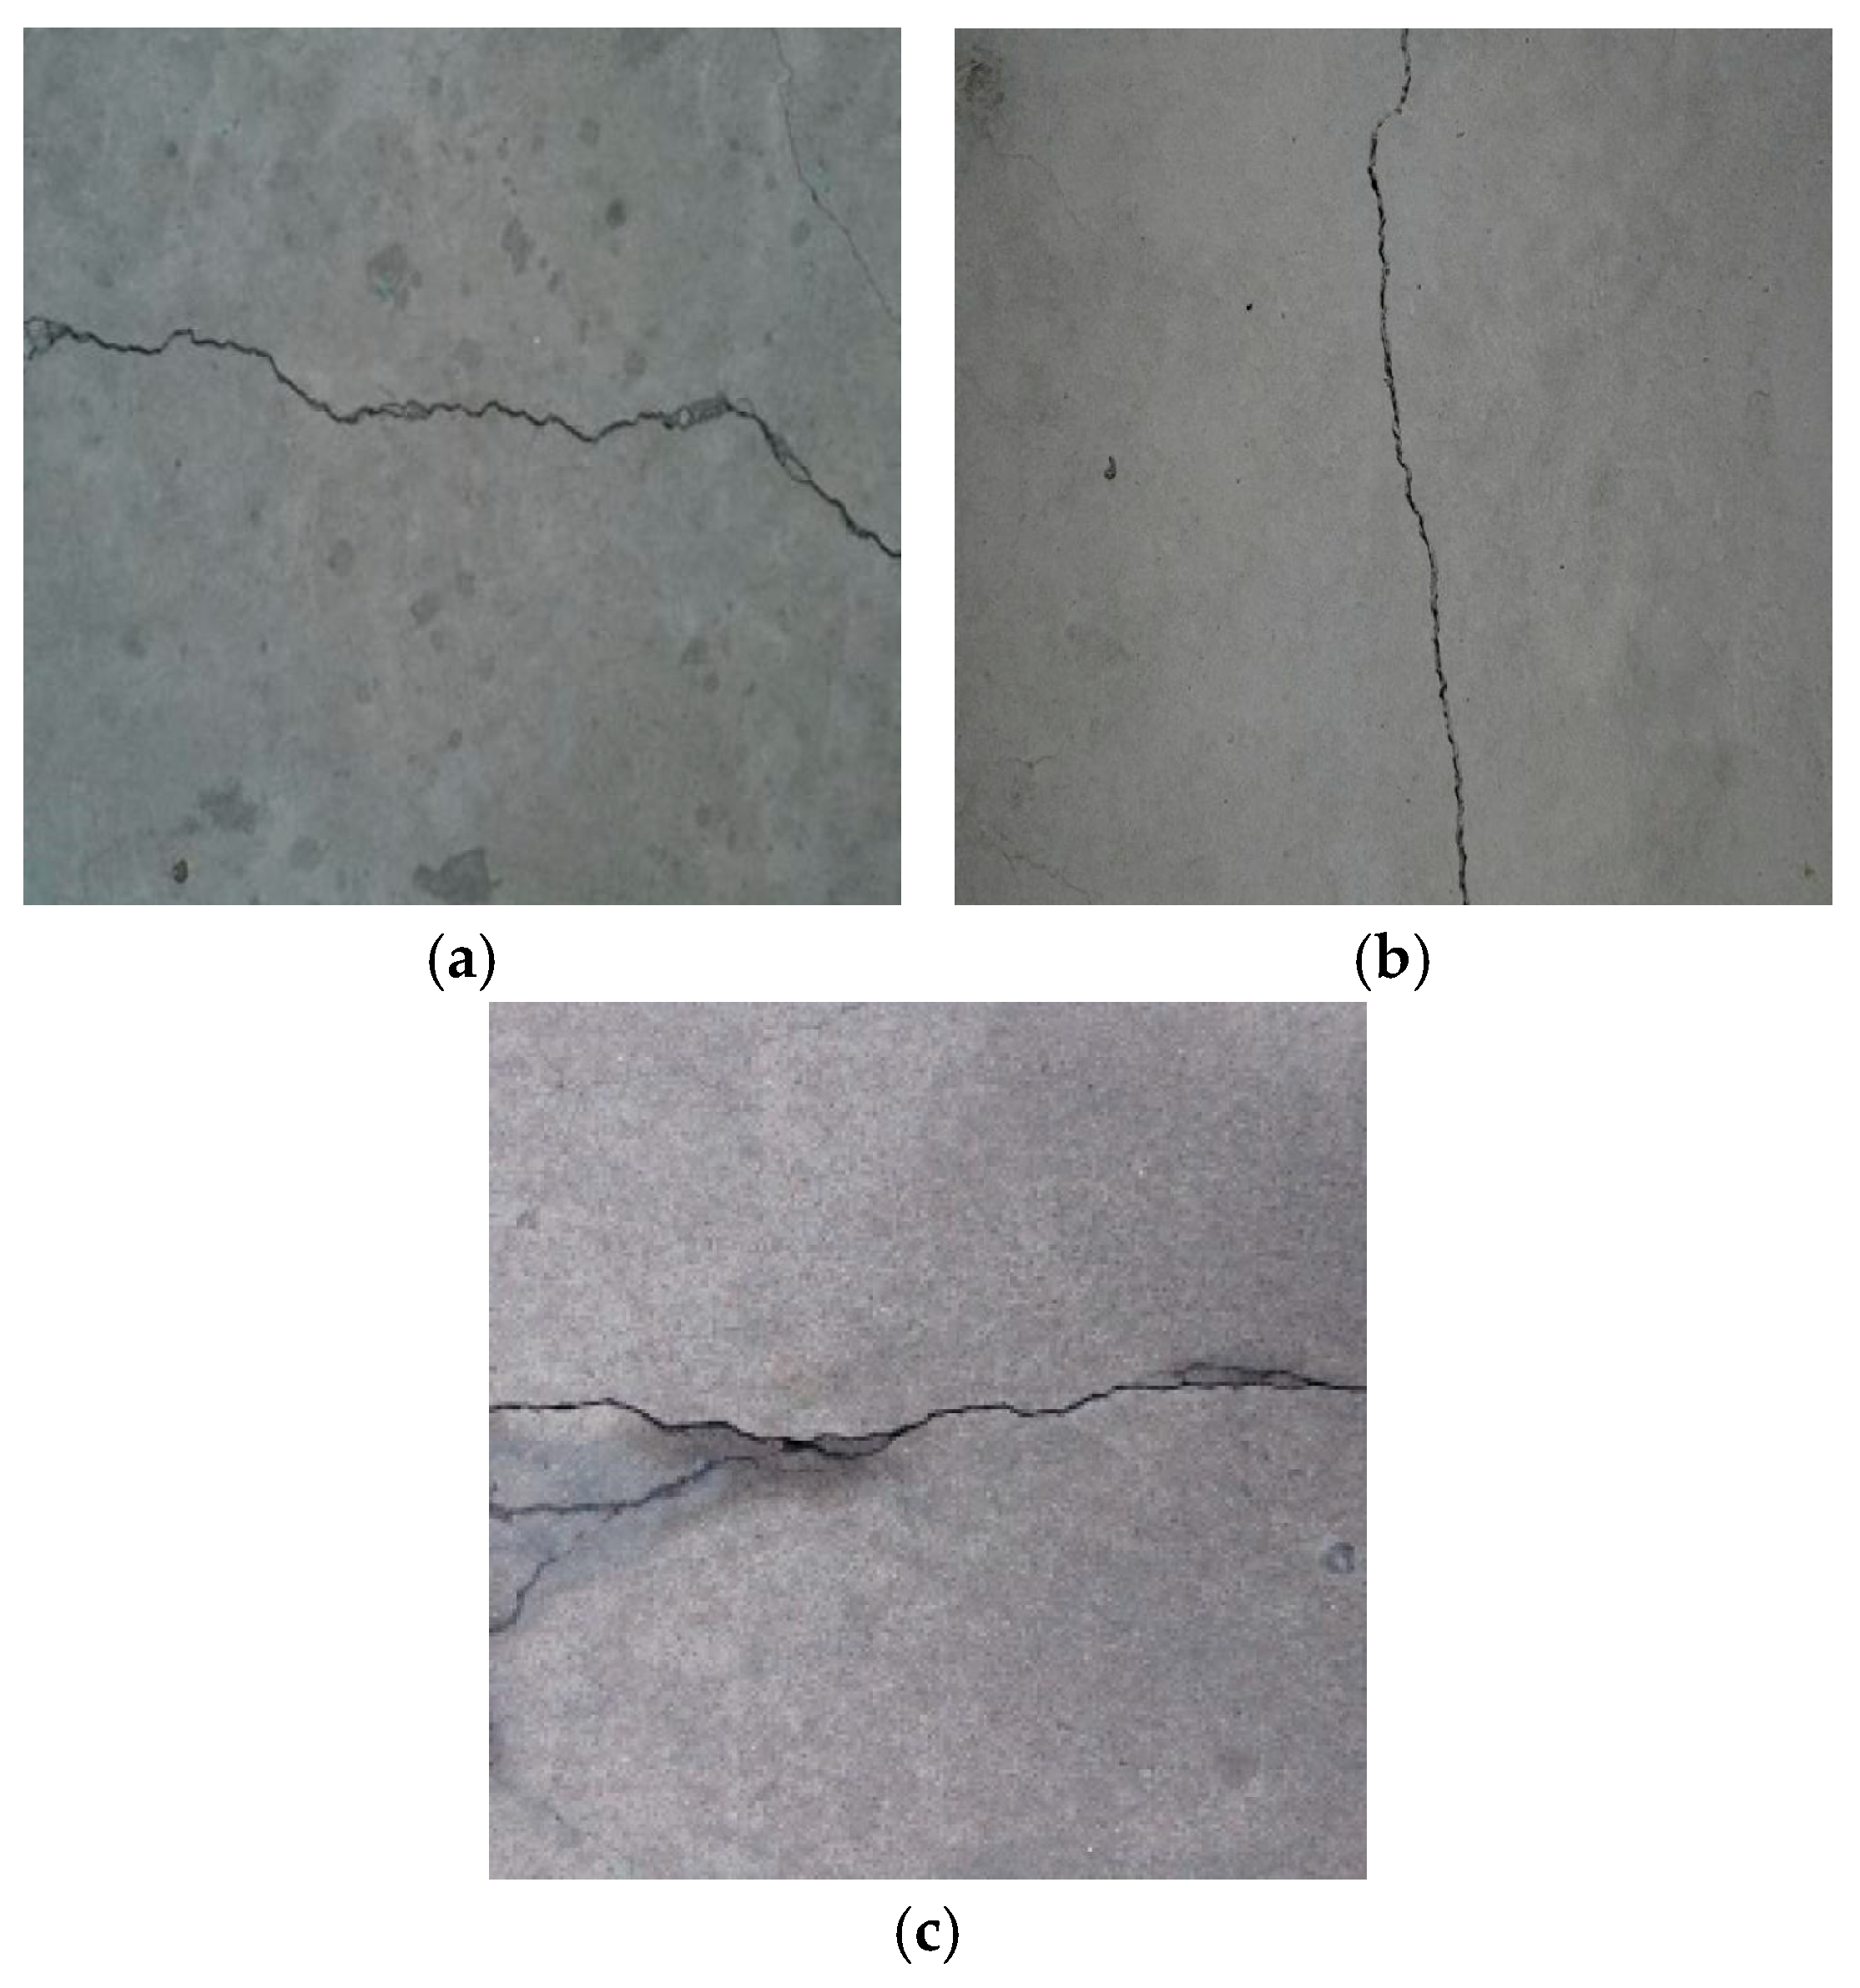
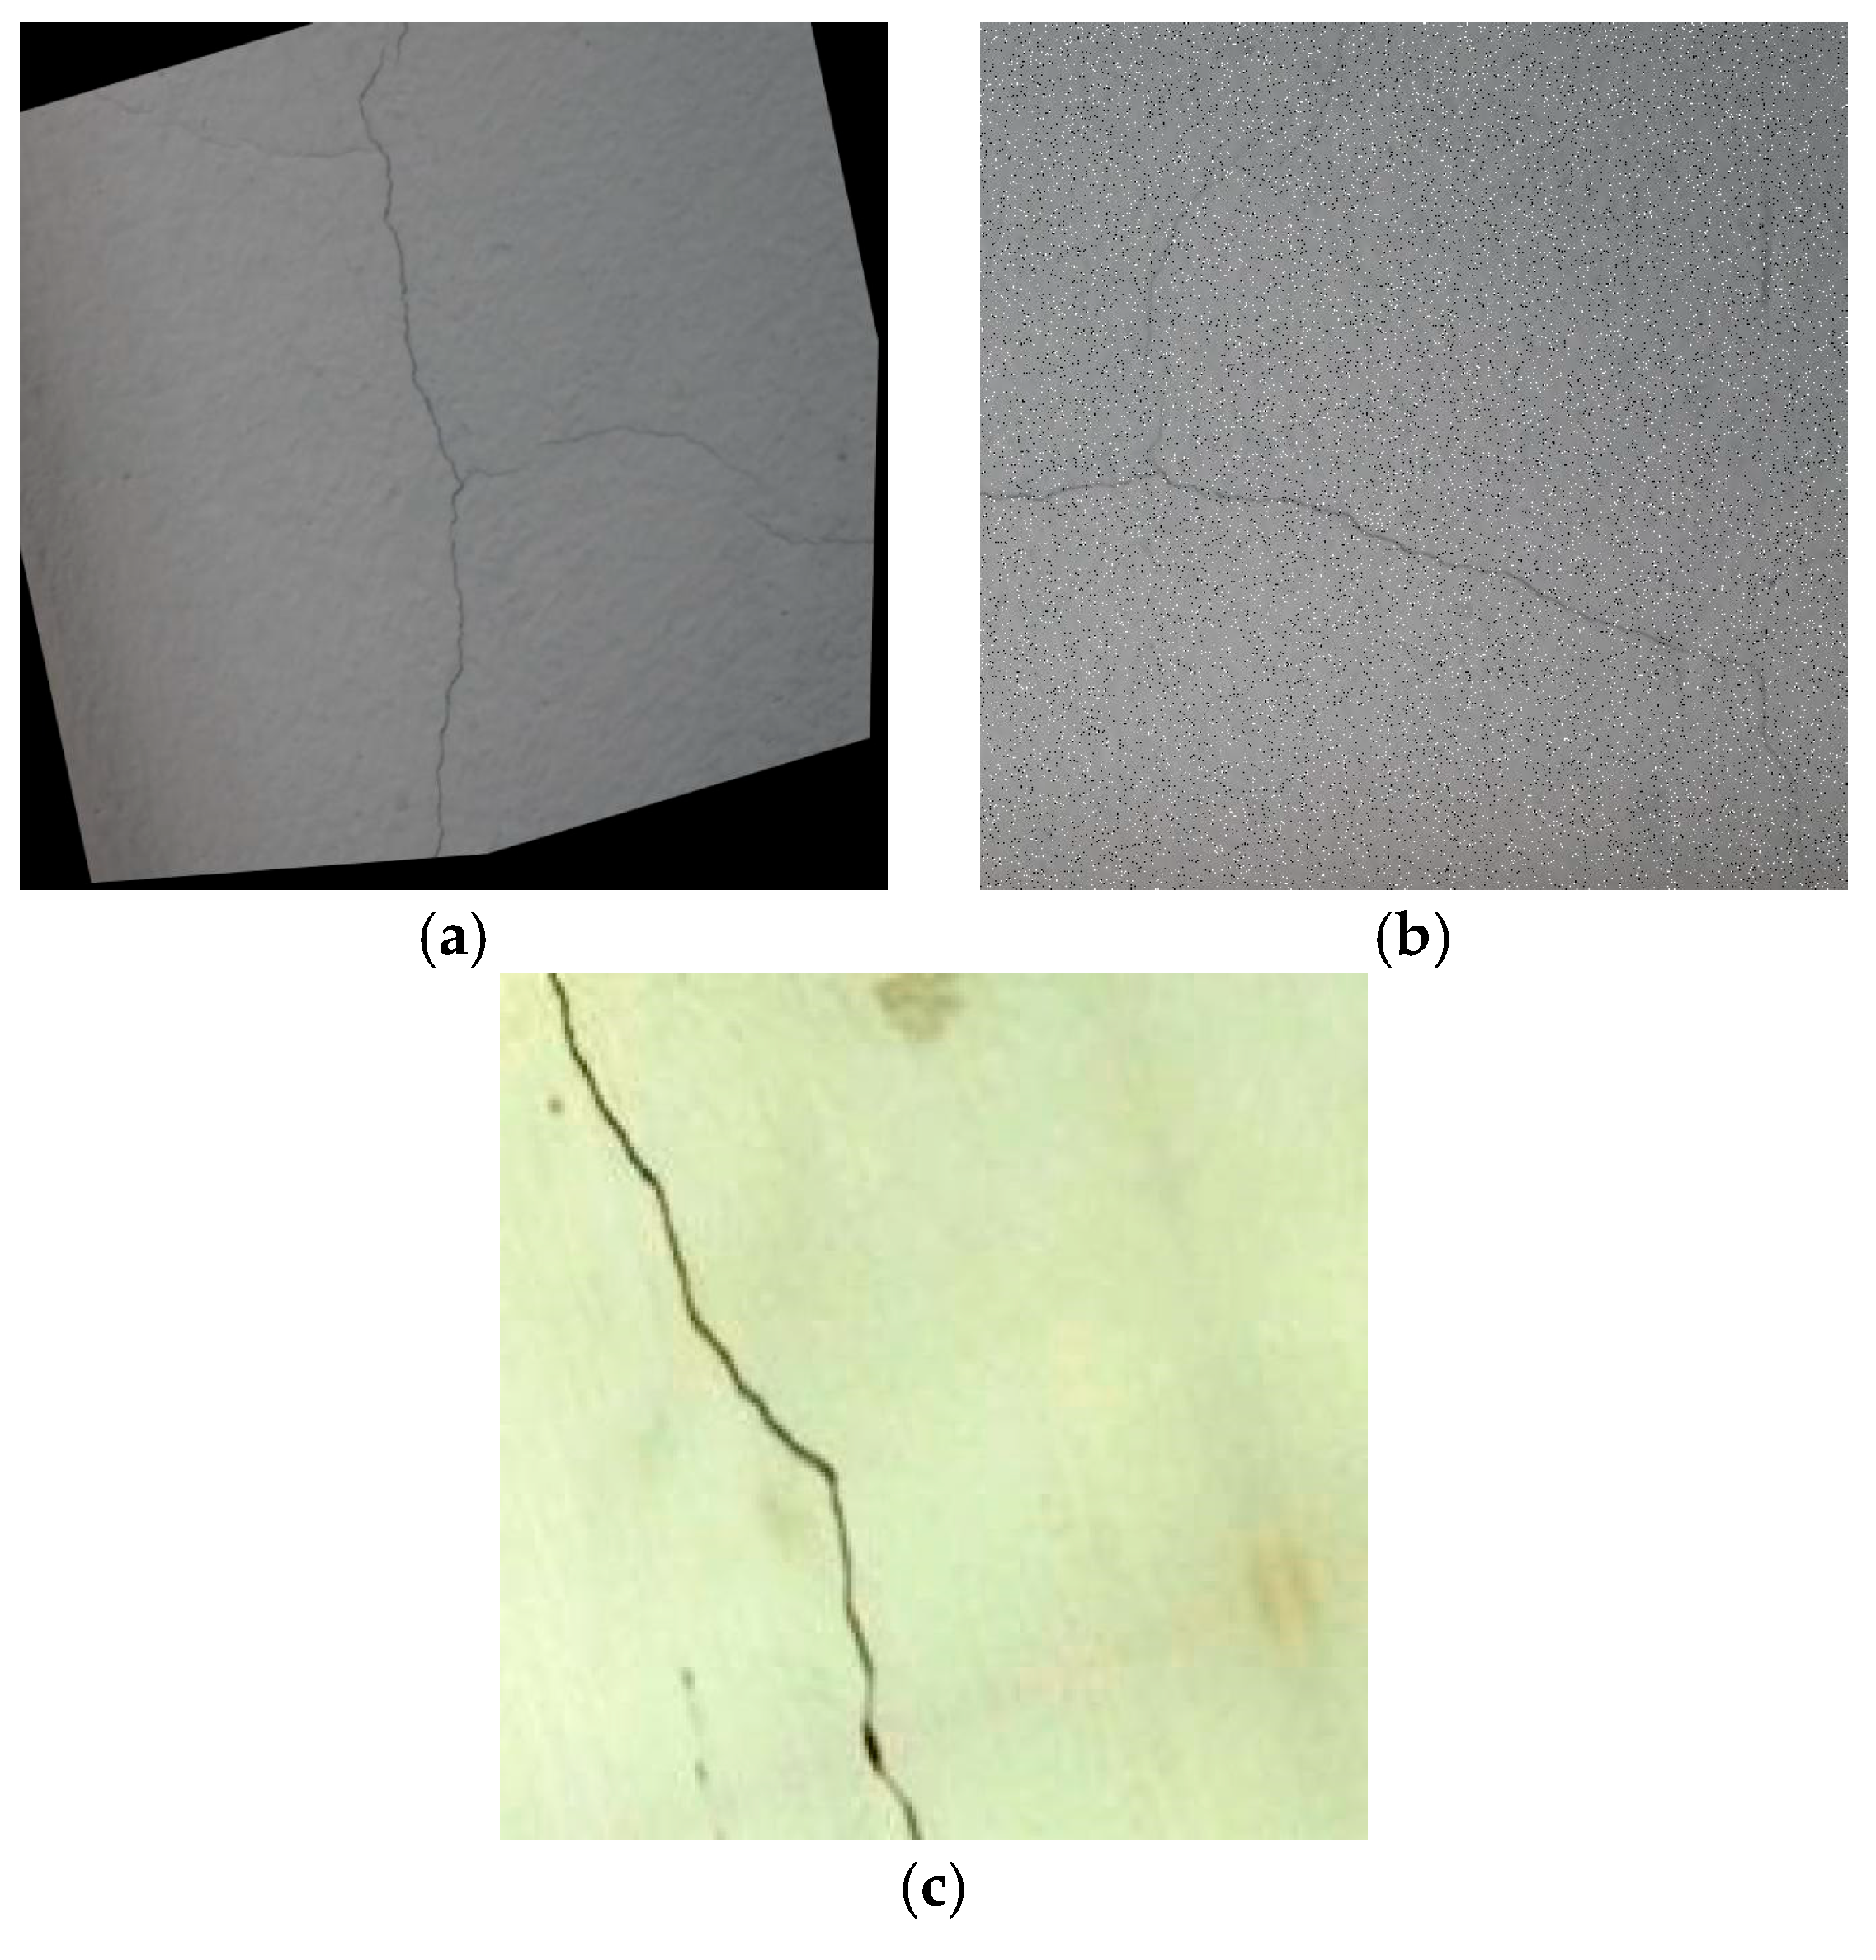
3. Dataset
4. Experimental Environment
5. Evaluation Index
6. Experimental Results
6.1. Ablation Experiment Comparison
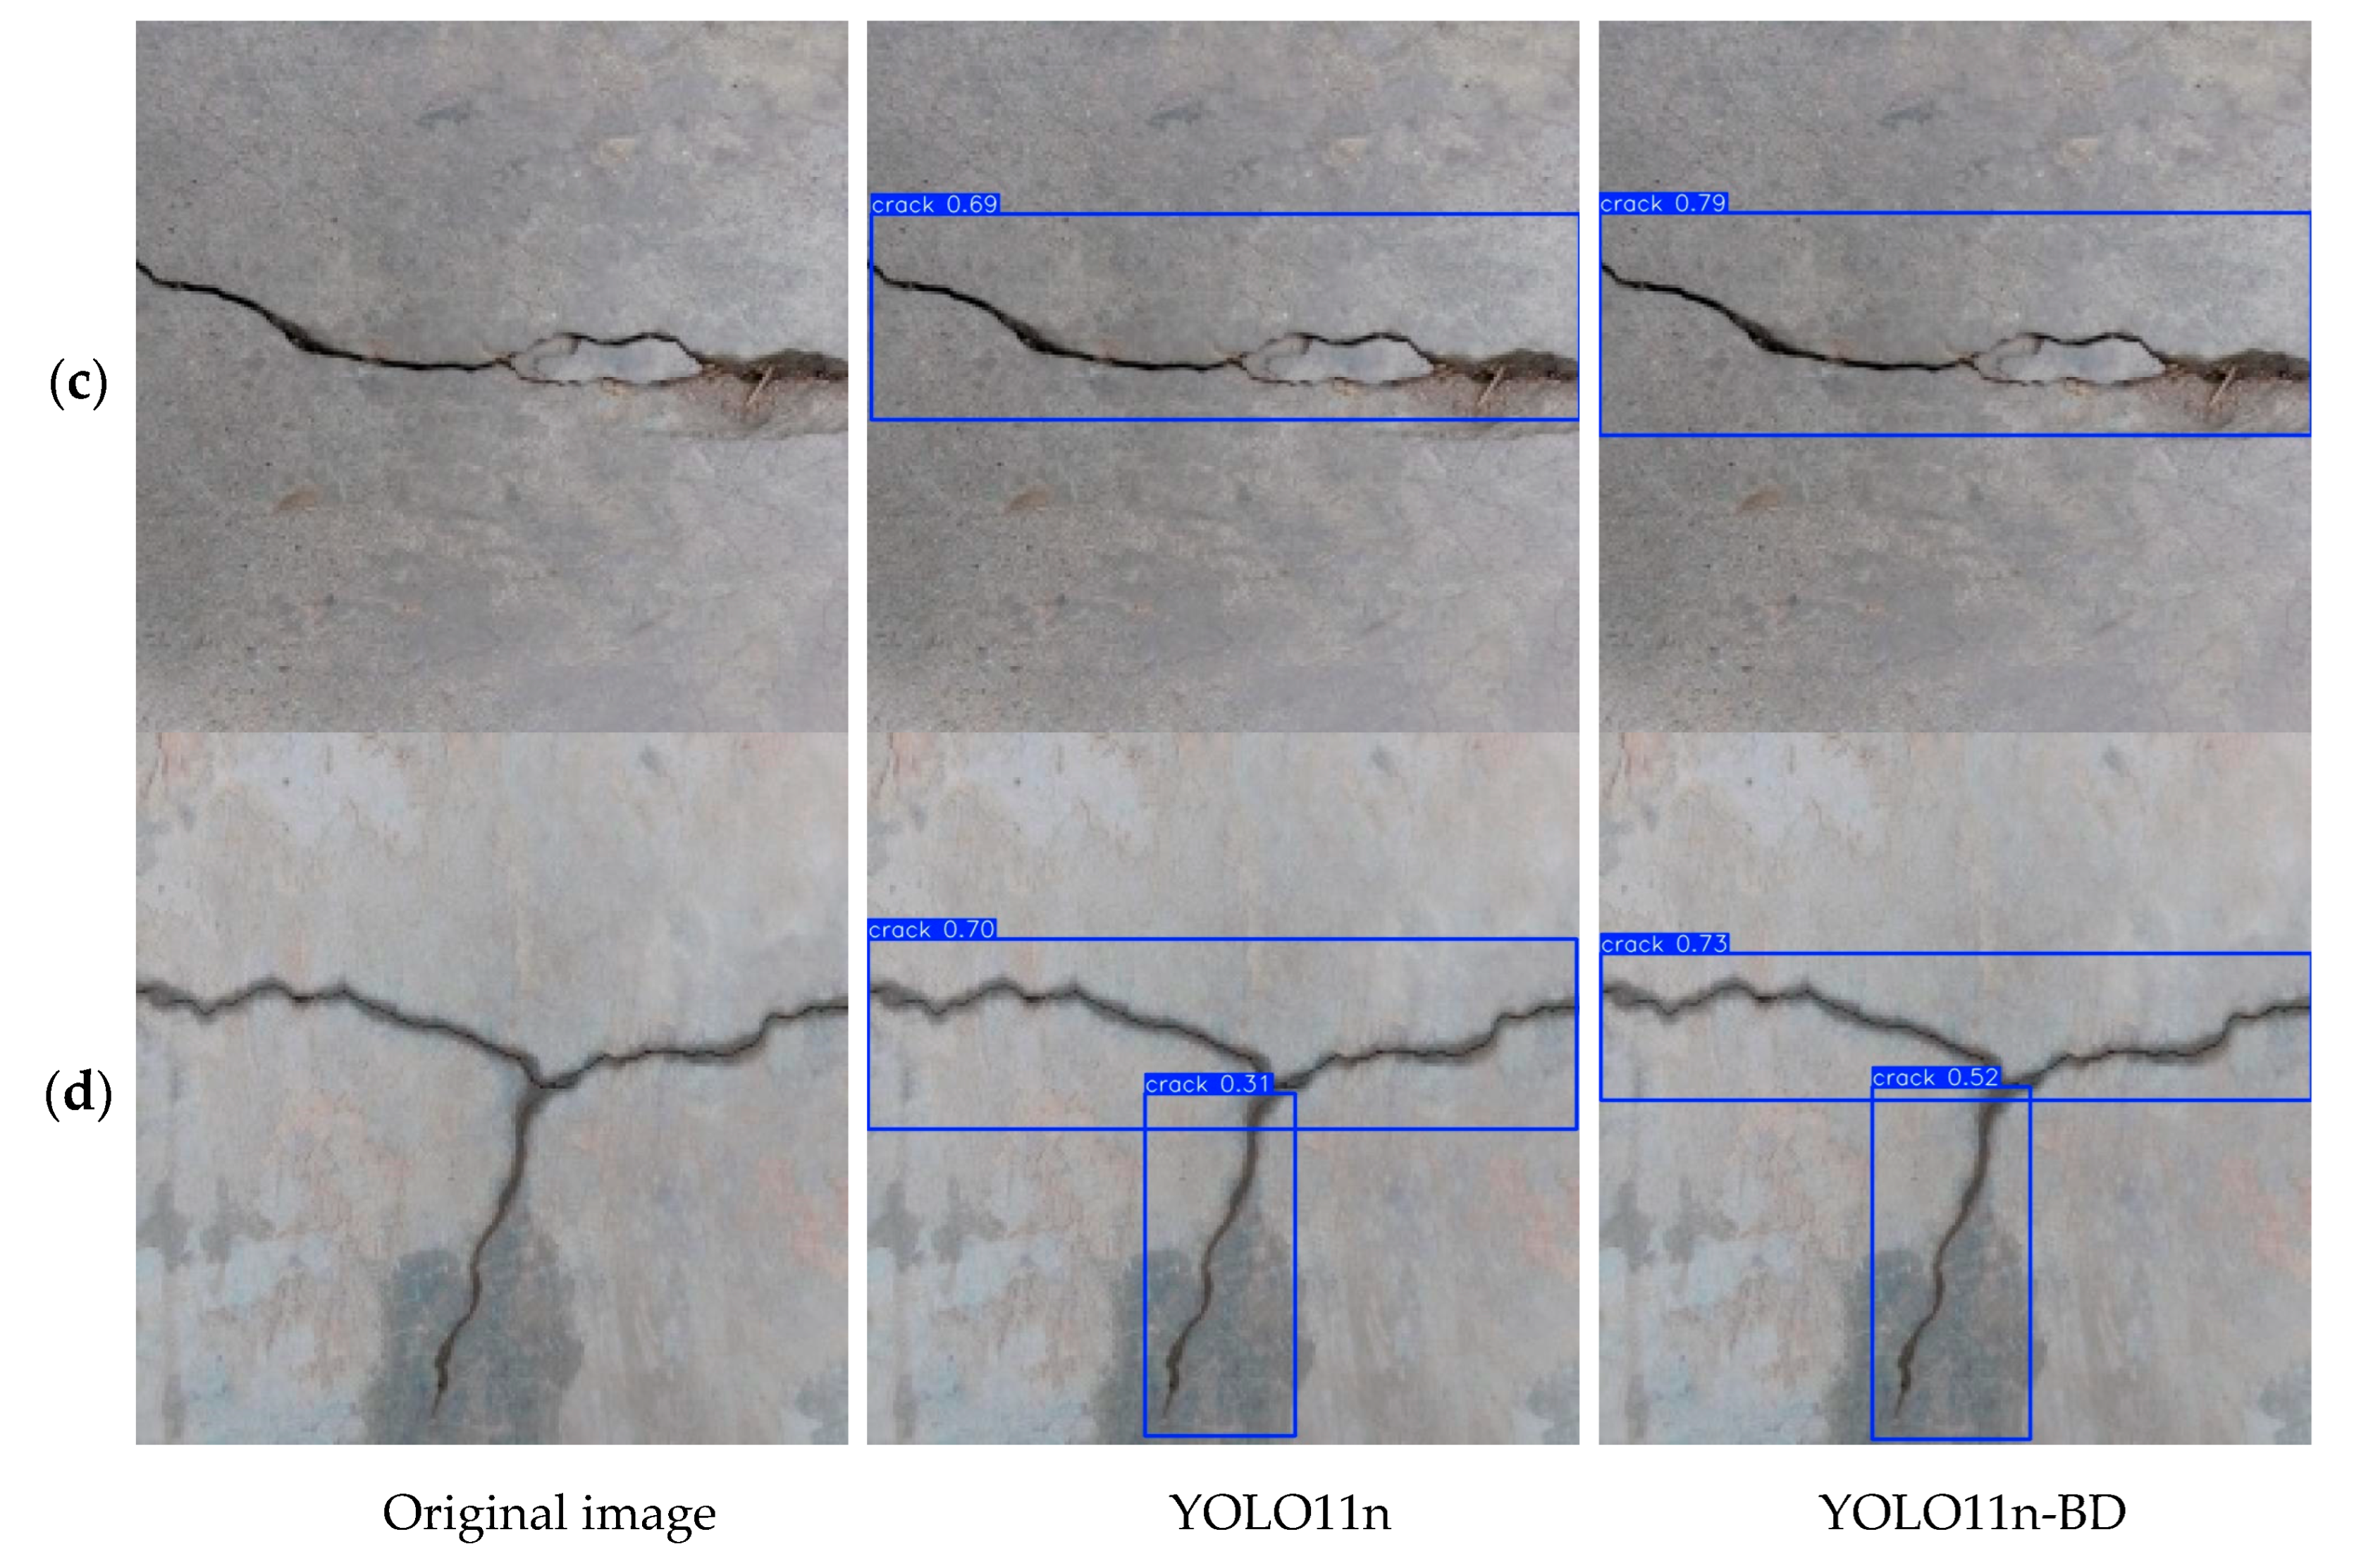
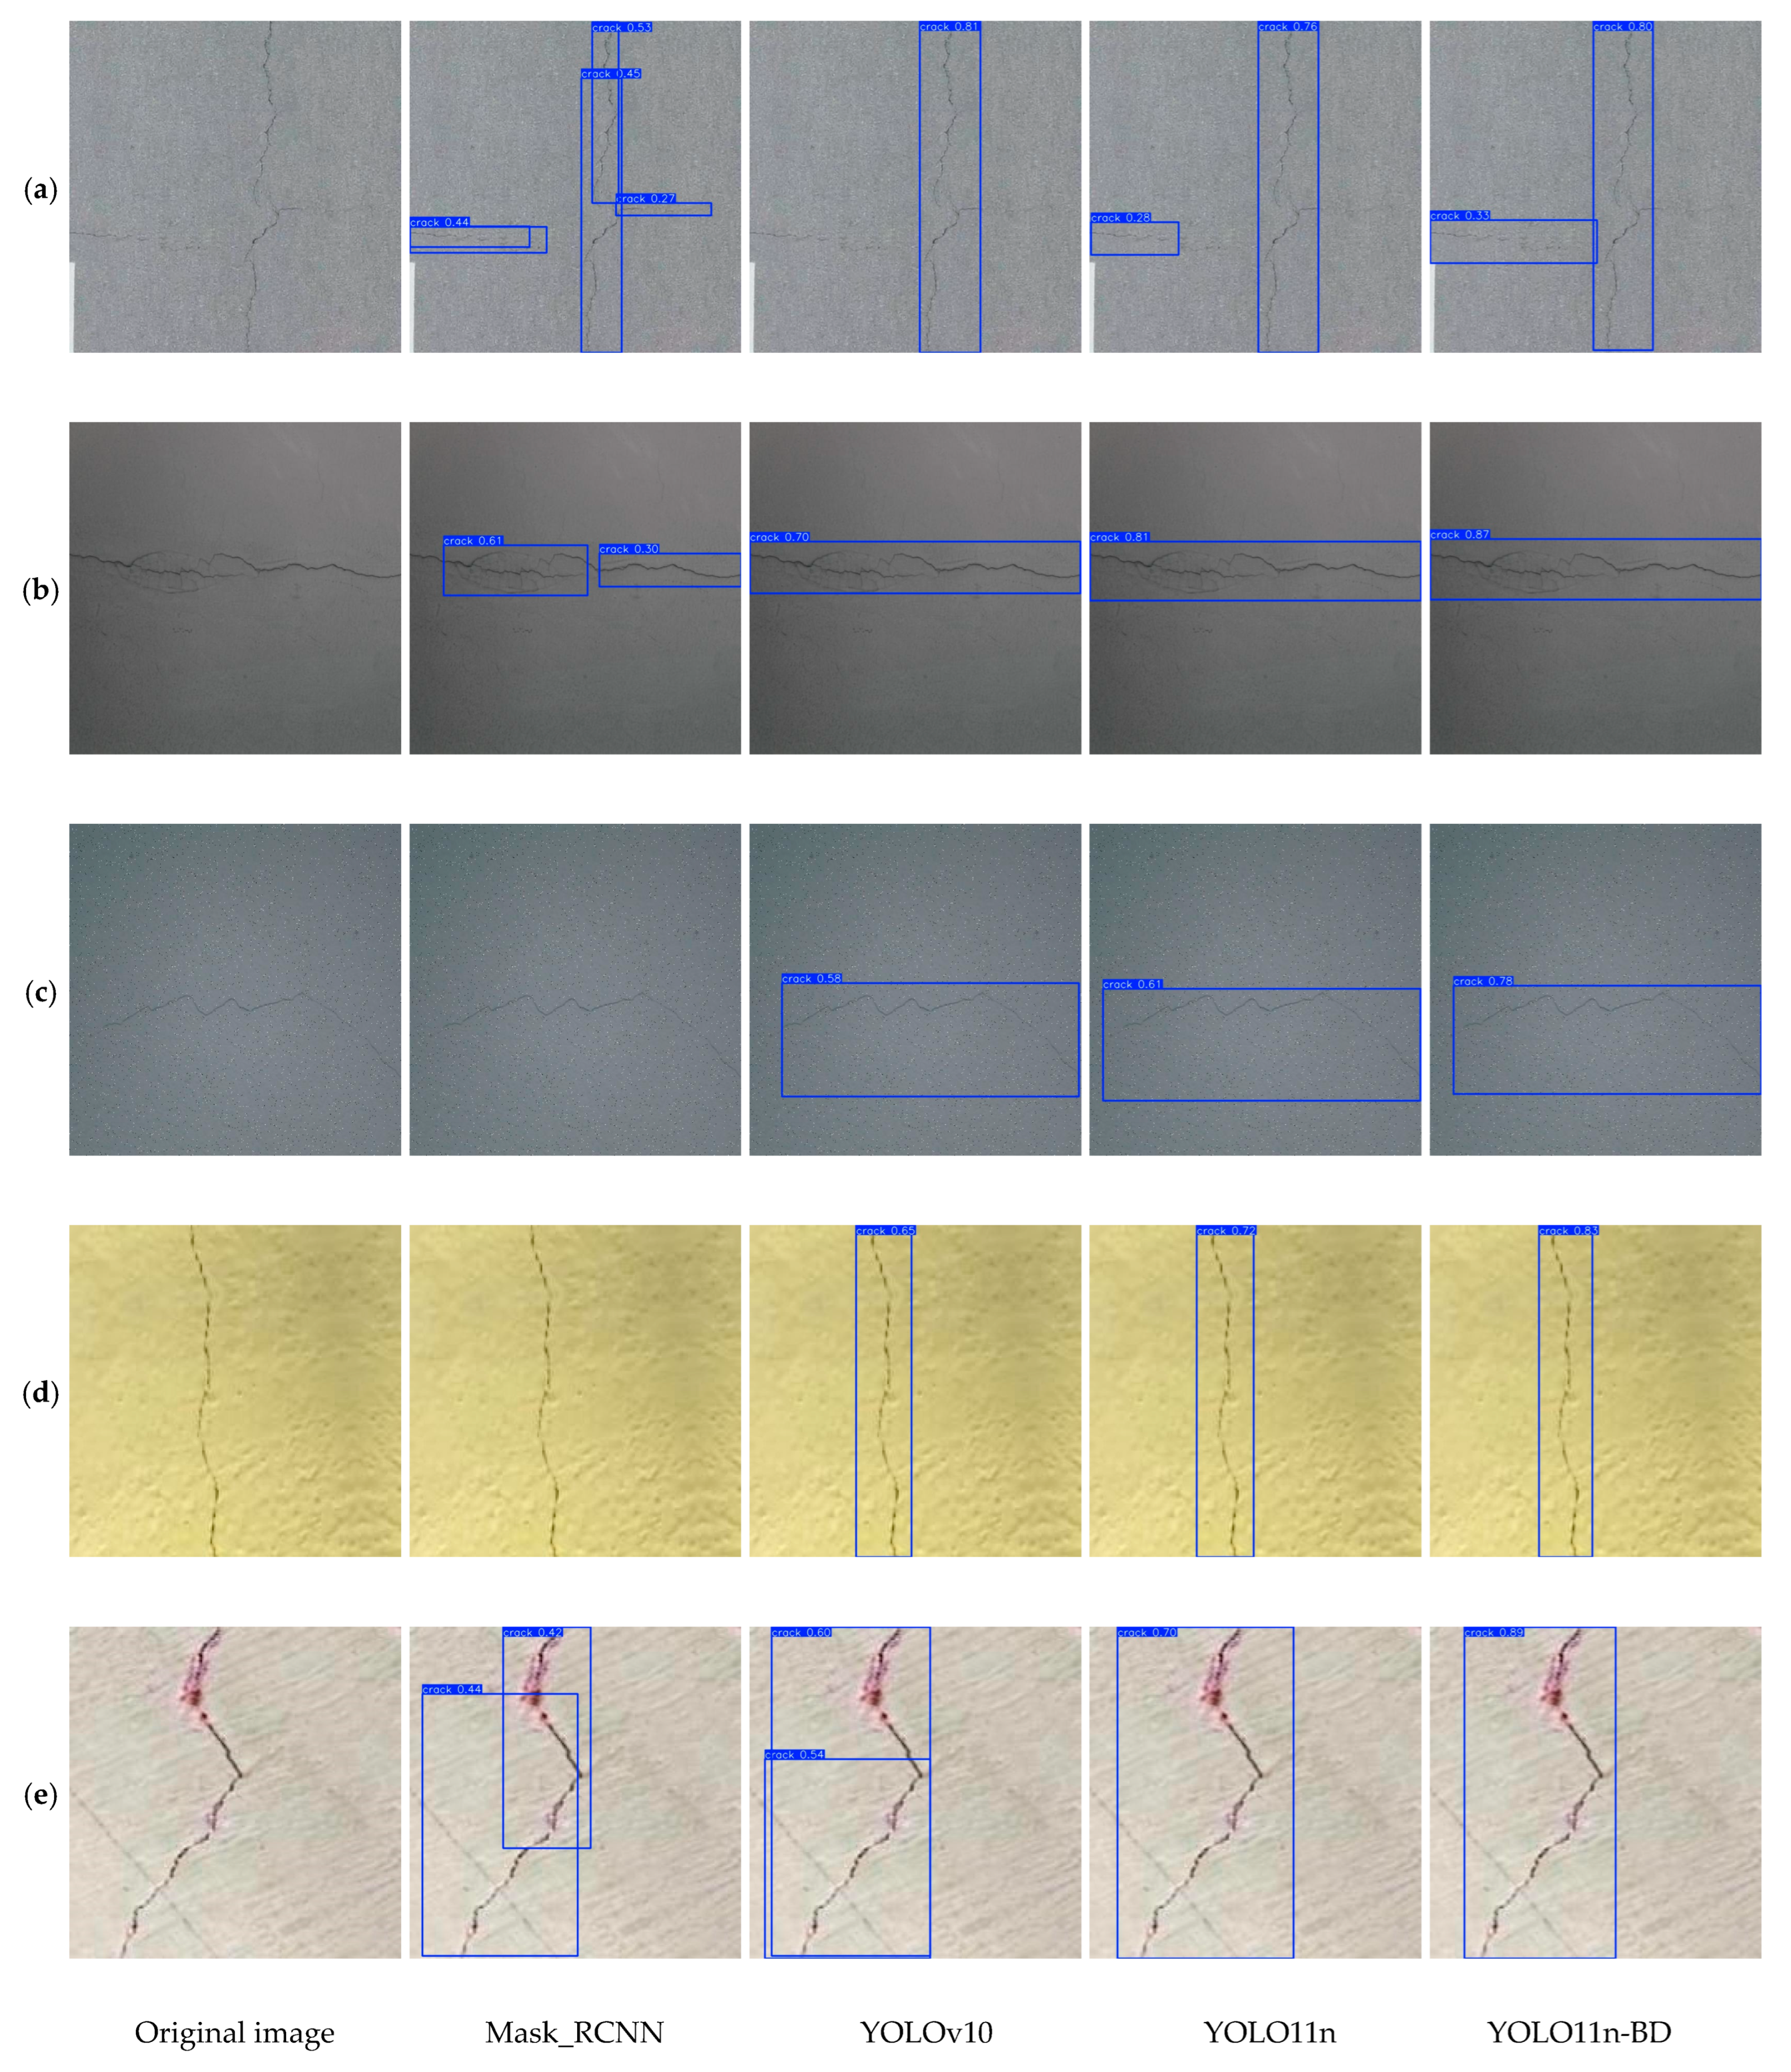
6.2. Comparison of Detection Performance with Different Algorithms
6.3. Cross-Validation
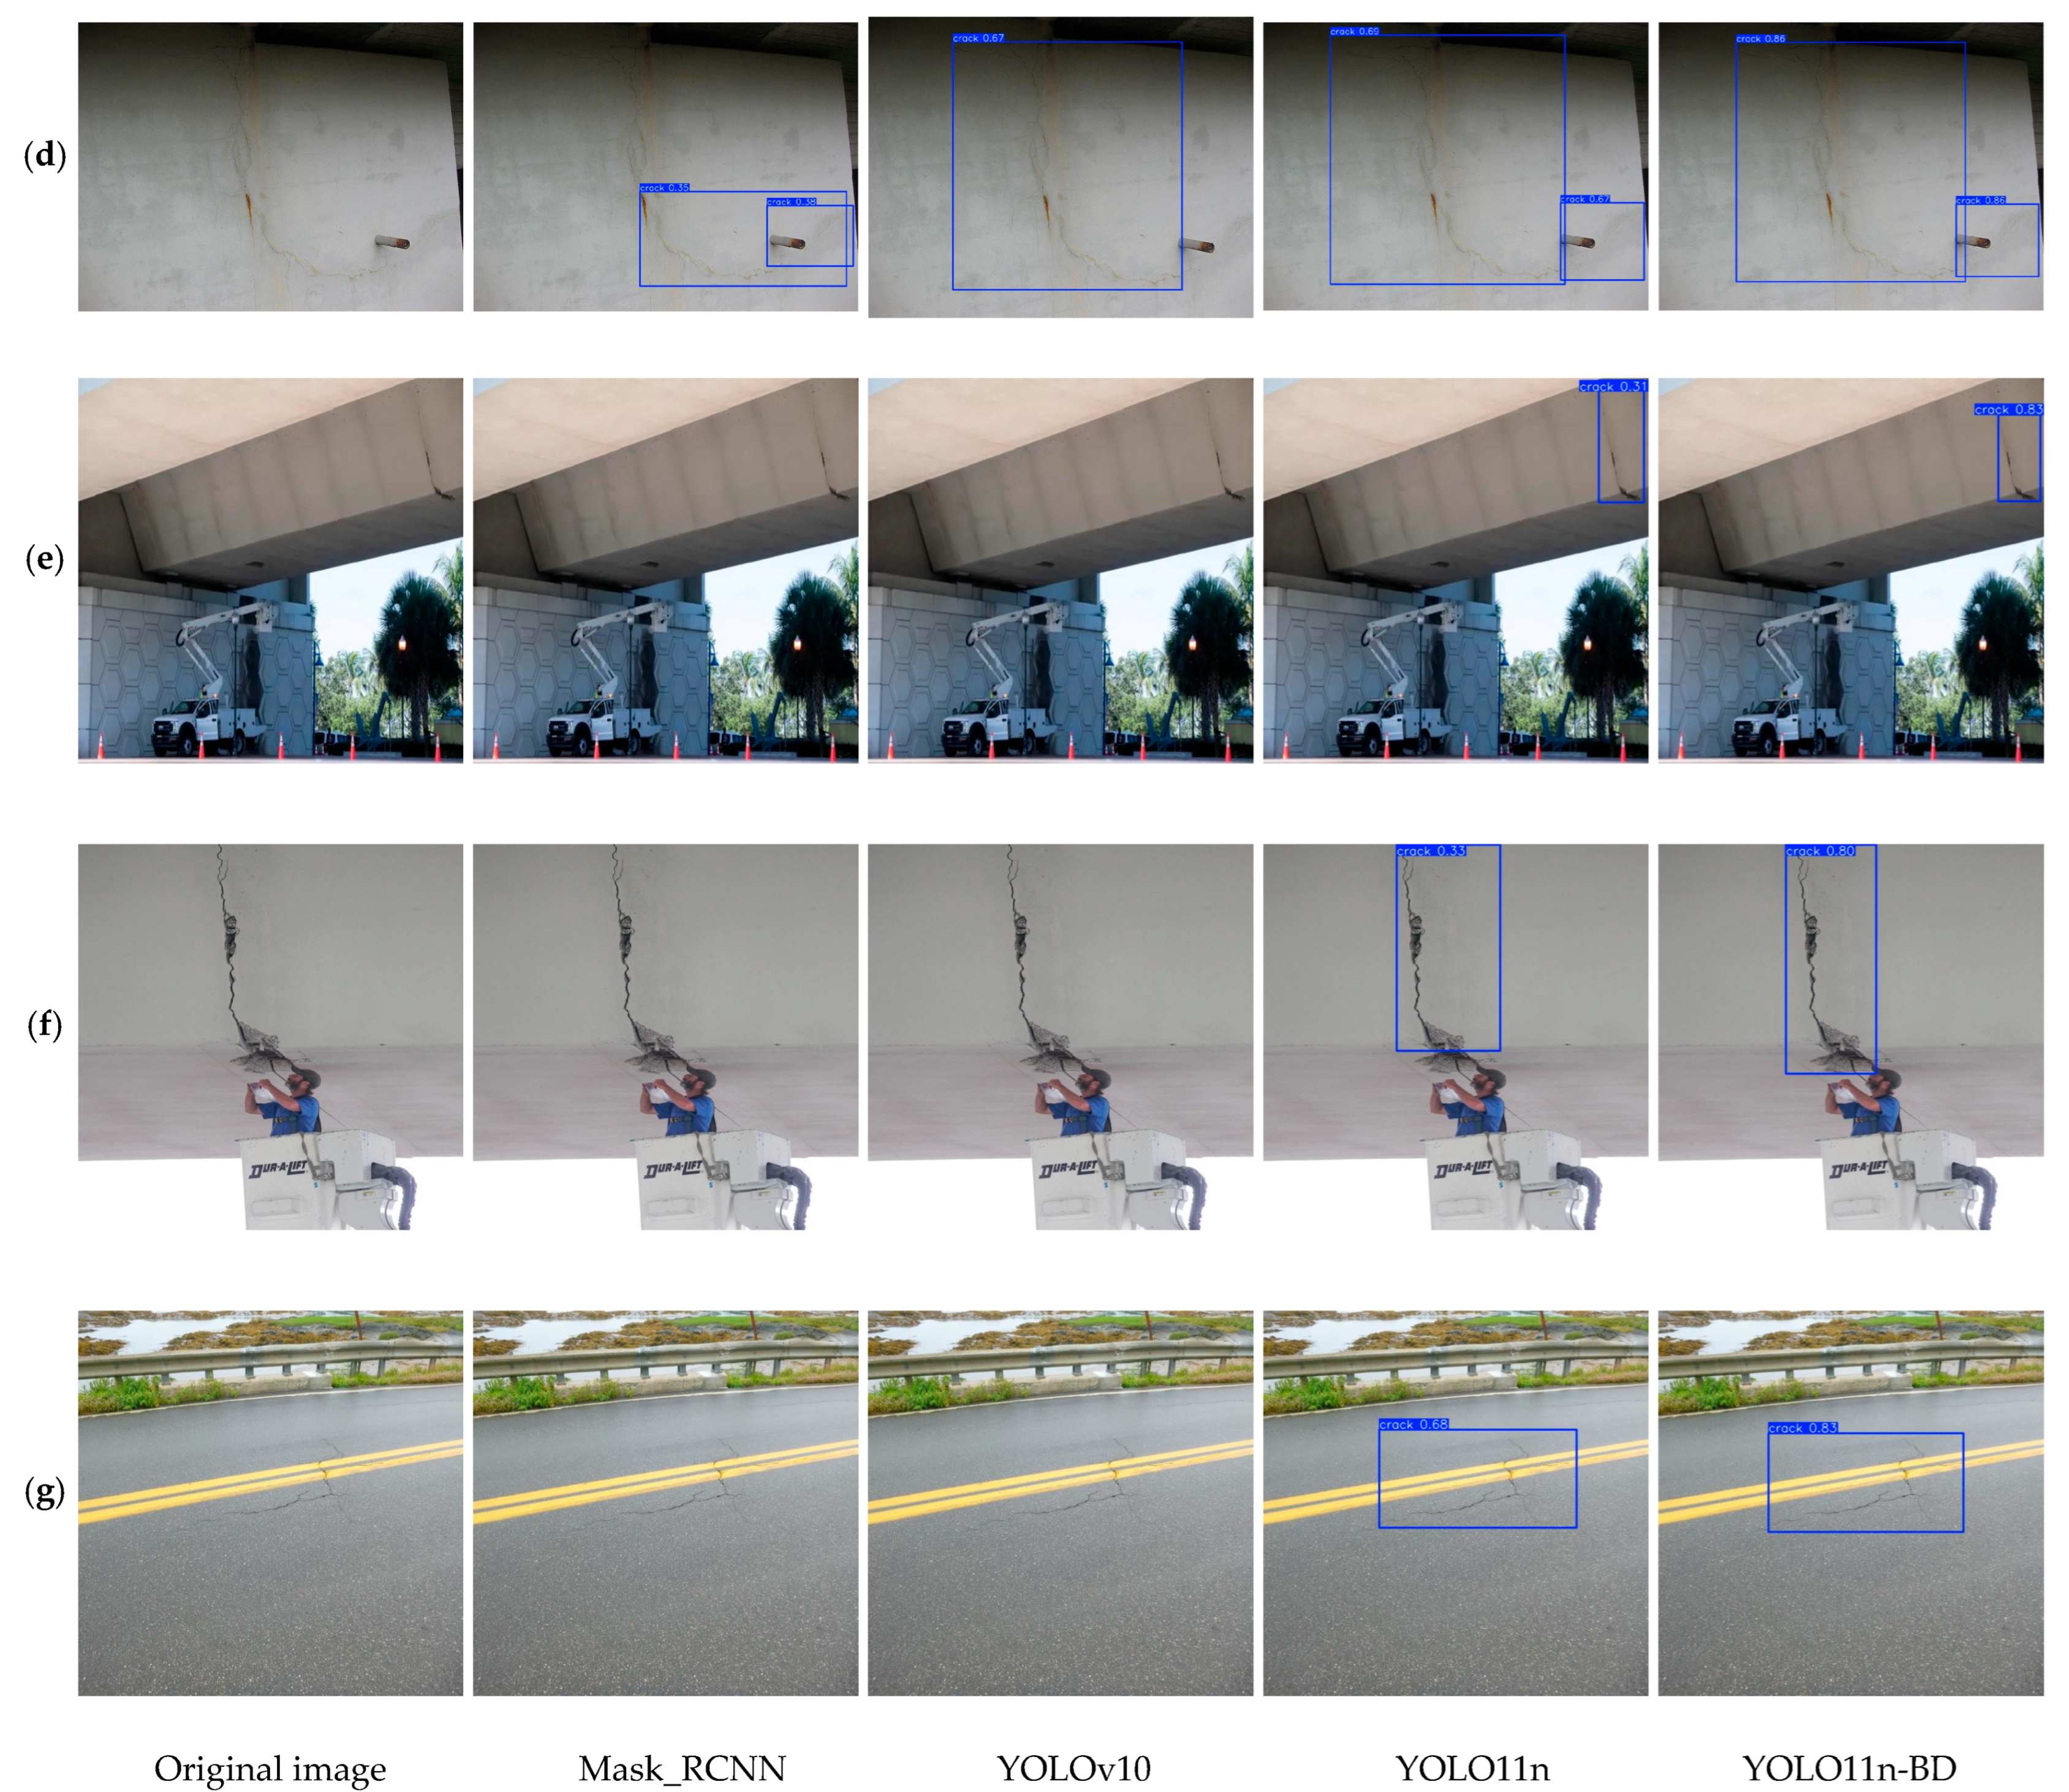
6.4. Detection in Different Complex Scenarios
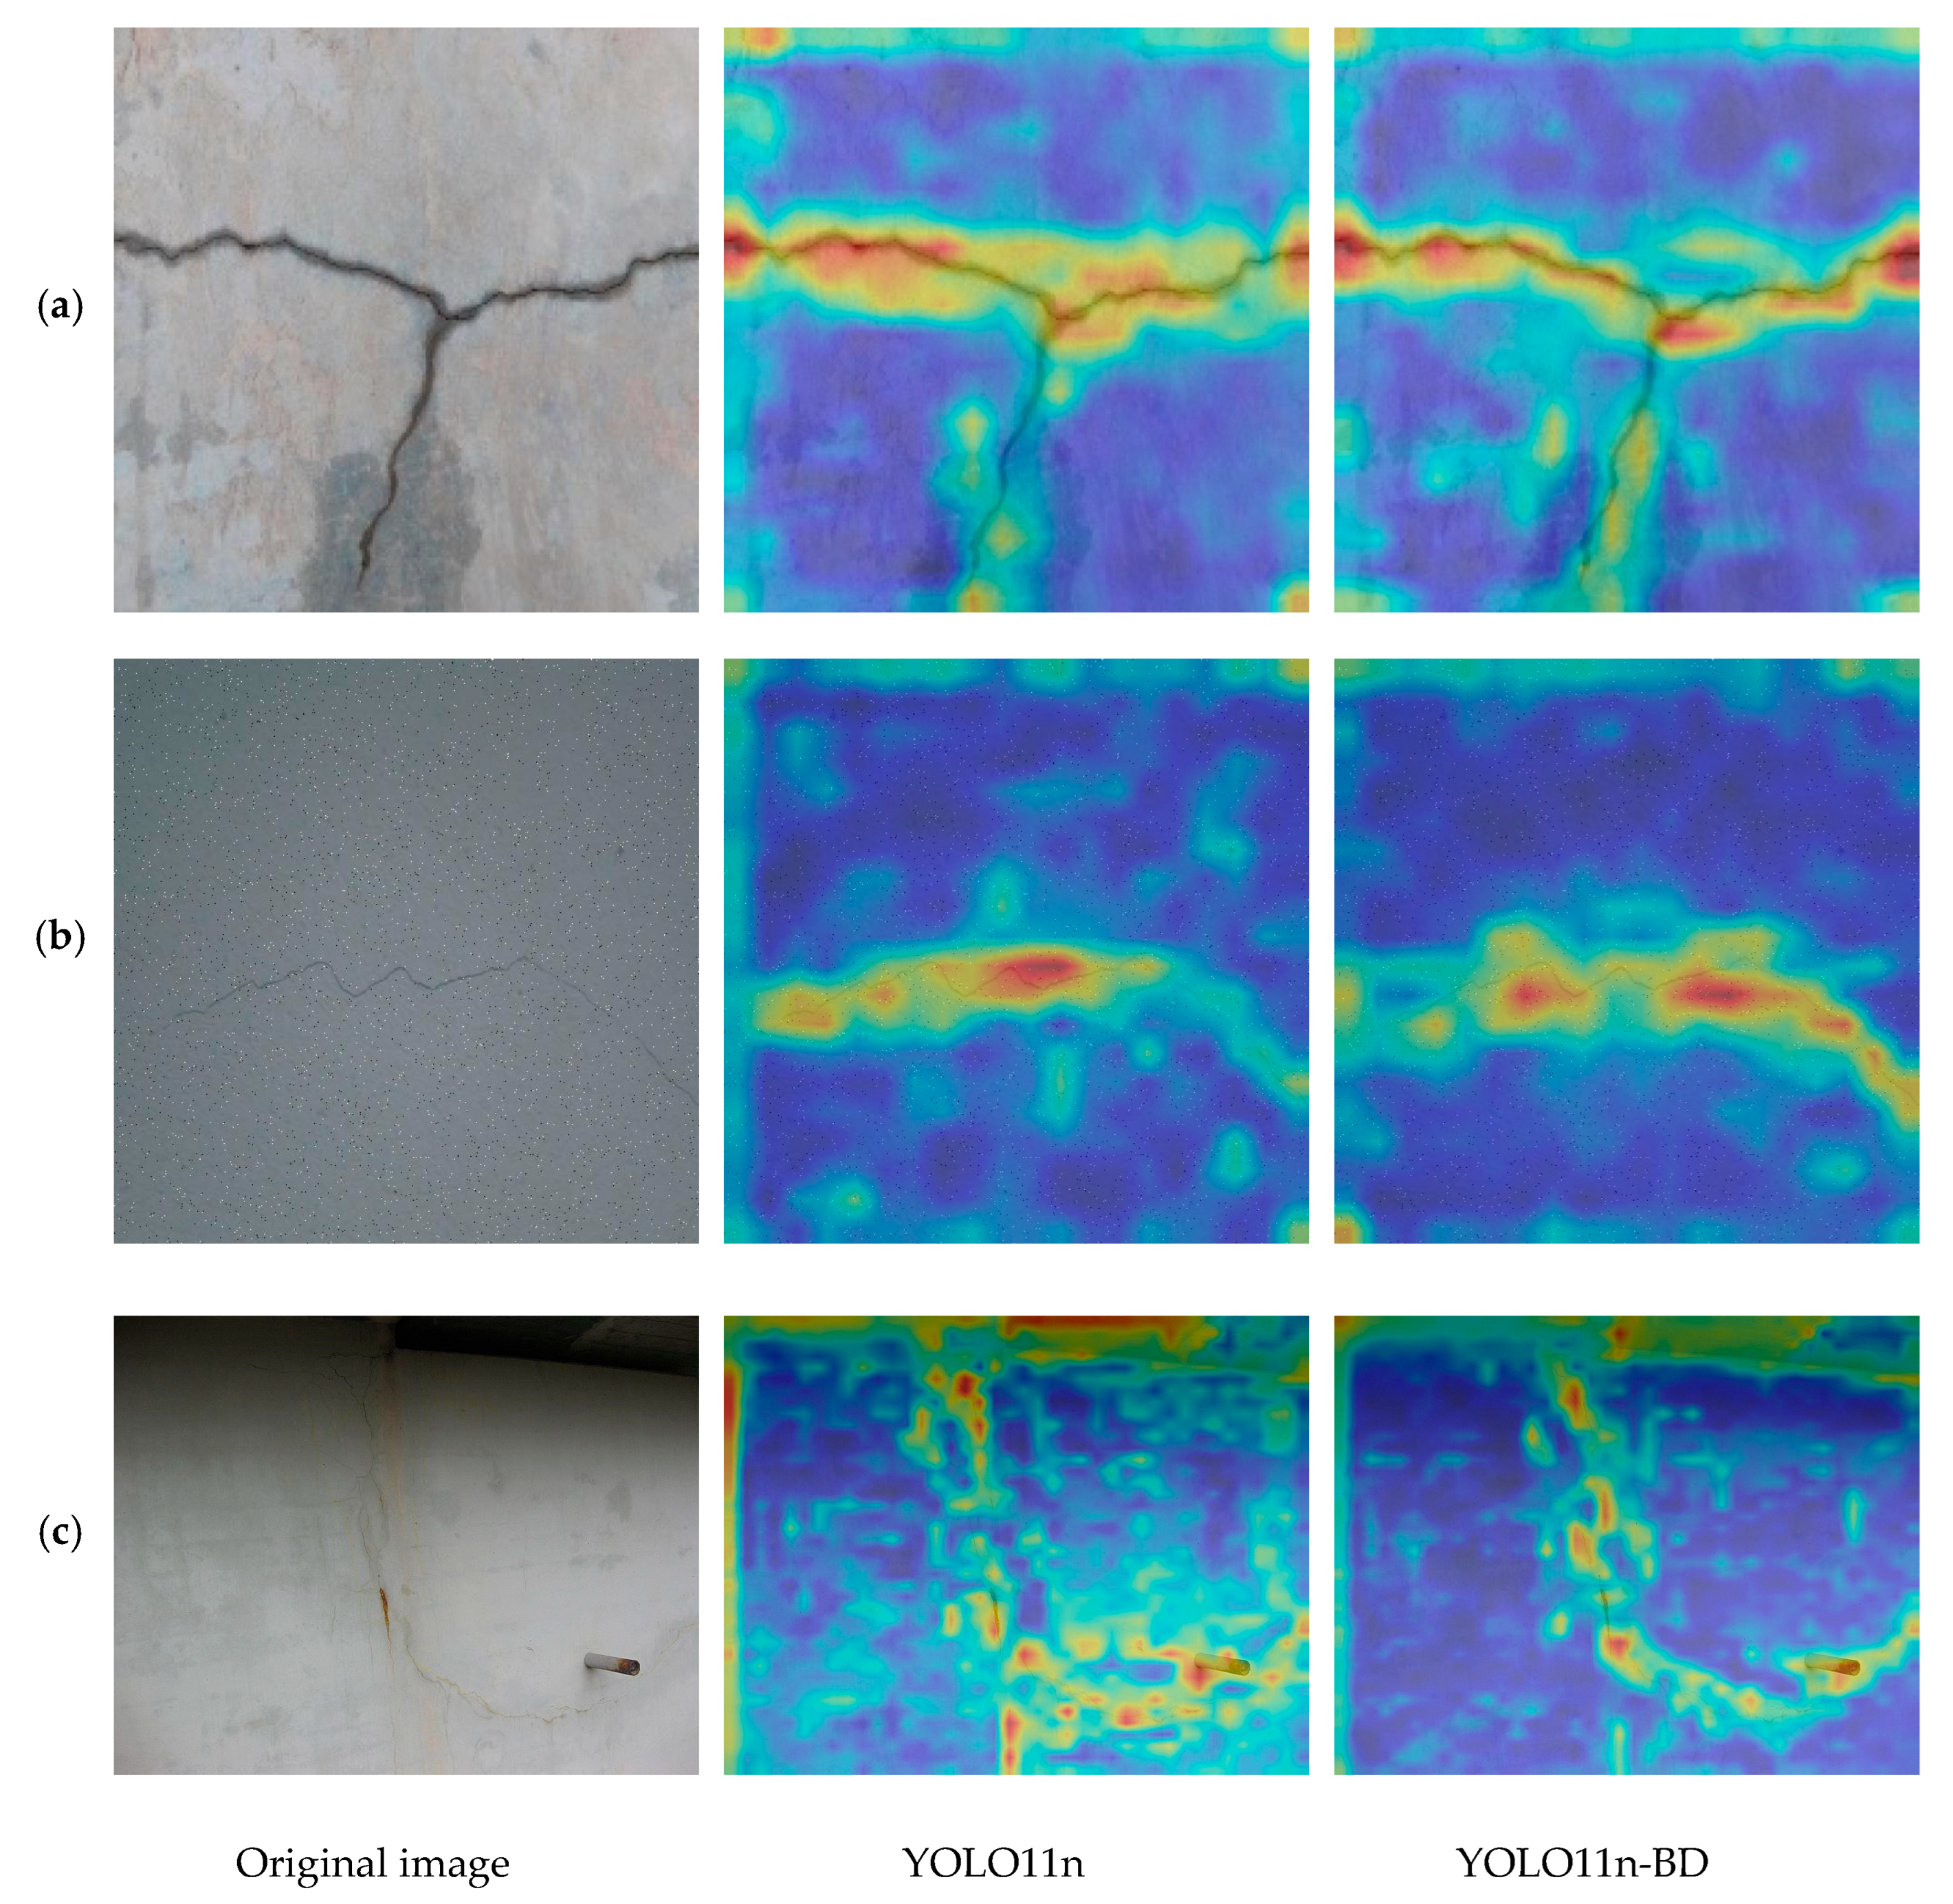
6.5. Activation Map Analysis
7. Conclusions
Author Contributions
Funding
Institutional Review Board Statement
Informed Consent Statement
Data Availability Statement
Acknowledgments
Conflicts of Interest
References
- Zhou, S.; Pan, Y.; Huang, X.; Yang, D.; Ding, Y.; Duan, R. Crack Texture Feature Identification of Fiber Reinforced Concrete Based on Deep Learning. Materials 2022, 15, 3940. [Google Scholar] [CrossRef] [PubMed]
- Tang, Y.; Huang, Z.; Chen, Z.; Chen, M.; Zhou, H.; Zhang, H.; Sun, J. Novel Visual Crack Width Measurement Based on Backbone Double-Scale Features for Improved Detection Automation. Eng. Struct. 2023, 274, 115158. [Google Scholar] [CrossRef]
- Khan, M.A.-M.; Kee, S.-H.; Pathan, A.-S.K.; Nahid, A.-A. Image Processing Techniques for Concrete Crack Detection: A Scientometrics Literature Review. Remote Sens. 2023, 15, 2400. [Google Scholar] [CrossRef]
- Hu, K.; Chen, Z.; Kang, H.; Tang, Y. 3D Vision Technologies for a Self-Developed Structural External Crack Damage Recognition Robot. Autom. Constr. 2024, 159, 105262. [Google Scholar] [CrossRef]
- Ai, D.; Jiang, G.; Lam, S.-K.; He, P.; Li, C. Computer Vision Framework for Crack Detection of Civil Infrastructure—A Review. Eng. Appl. Artif. Intell. 2023, 117, 105478. [Google Scholar] [CrossRef]
- Sun, Z.; Caetano, E.; Pereira, S.; Moutinho, C. Employing Histogram of Oriented Gradient to Enhance Concrete Crack Detection Performance with Classification Algorithm and Bayesian Optimization. Eng. Fail. Anal. 2023, 150, 107351. [Google Scholar] [CrossRef]
- Wu, Y.; Han, Q.; Jin, Q.; Li, J.; Zhang, Y. LCA-YOLOv8-Seg: An Improved Lightweight YOLOv8-Seg for Real-Time Pixel-Level Crack Detection of Dams and Bridges. Appl. Sci. 2023, 13, 10583. [Google Scholar] [CrossRef]
- Li, R.; Yu, J.; Li, F.; Yang, R.; Wang, Y.; Peng, Z. Automatic Bridge Crack Detection Using Unmanned Aerial Vehicle and Faster R-CNN. Constr. Build. Mater. 2023, 362, 129659. [Google Scholar] [CrossRef]
- Zhang, E.; Jiang, T.; Duan, J. A Multi-Stage Feature Aggregation and Structure Awareness Network for Concrete Bridge Crack Detection. Sensors 2024, 24, 1542. [Google Scholar] [CrossRef]
- Otsu, N. A Threshold Selection Method from Gray-Level Histograms. Automatica 1975, 11, 23–27. [Google Scholar] [CrossRef]
- Canny, J. A Computational Approach to Edge Detection. IEEE Trans. Pattern Anal. Mach. Intell. 1986, PAMI-8, 679–698. [Google Scholar] [CrossRef]
- Mehnert, A.; Jackway, P. An Improved Seeded Region Growing Algorithm. Pattern Recognit. Lett. 1997, 18, 1065–1071. [Google Scholar] [CrossRef]
- Jena, K.K.; Mishra, S.; Mishra, S.; Bhoi, S.K. Unmanned Aerial Vehicle Assisted Bridge Crack Severity Inspection Using Edge Detection Methods. In Proceedings of the 2019 Third International conference on I-SMAC (IoT in Social, Mobile, Analytics and Cloud) (I-SMAC), Palladam, India, 12–14 December 2019; pp. 284–289. [Google Scholar]
- Akagic, A.; Buza, E.; Omanovic, S.; Karabegovic, A. Pavement Crack Detection Using Otsu Thresholding for Image Segmentation. In Proceedings of the 2018 41st International Convention on Information and Communication Technology, Electronics and Microelectronics (MIPRO), Opatija, Croatia, 21–25 May 2018; pp. 1092–1097. [Google Scholar]
- Song, M.; Cui, D.; Yu, C.; Chang, C.-I.; Song, M. Crack Detection Algorithm for Photovoltaic Image Based on Multi-Scale Pyramid and Improved Region Growing. In Proceedings of the 2018 IEEE 3rd International Conference on Image, Vision and Computing (ICIVC), Chongqing, China, 27–29 June 2018; pp. 128–132. [Google Scholar]
- Li, G.; Zhao, X.; Du, K.; Ru, F.; Zhang, Y. Recognition and Evaluation of Bridge Cracks with Modified Active Contour Model and Greedy Search-Based Support Vector Machine. Autom. Constr. 2017, 78, 51–61. [Google Scholar] [CrossRef]
- Shi, Y.; Cui, L.; Qi, Z.; Meng, F.; Chen, Z. Automatic Road Crack Detection Using Random Structured Forests. IEEE Trans. Intell. Transp. Syst. 2016, 17, 3434–3445. [Google Scholar] [CrossRef]
- Xu, H.; Su, X.; Wang, Y.; Cai, H.; Cui, K.; Chen, X. Automatic Bridge Crack Detection Using a Convolutional Neural Network. Appl. Sci. 2019, 9, 2867. [Google Scholar] [CrossRef]
- Gan, L.; Liu, H.; Yan, Y.; Chen, A. Bridge Bottom Crack Detection and Modeling Based on Faster R-CNN and BIM. IET Image Process. 2024, 18, 664–677. [Google Scholar] [CrossRef]
- Zhang, Q.; Barri, K.; Babanajad, S.K.; Alavi, A.H. Real-Time Detection of Cracks on Concrete Bridge Decks Using Deep Learning in the Frequency Domain. Engineering 2021, 7, 1786–1796. [Google Scholar] [CrossRef]
- Zhang, Y.; Huang, J.; Cai, F. On Bridge Surface Crack Detection Based on an Improved YOLO v3 Algorithm. IFAC-PapersOnLine 2020, 53, 8205–8210. [Google Scholar] [CrossRef]
- Liu, Y.; Zhou, T.; Xu, J.; Hong, Y.; Pu, Q.; Wen, X. Rotating Target Detection Method of Concrete Bridge Crack Based on YOLO V5. Appl. Sci. 2023, 13, 11118. [Google Scholar] [CrossRef]
- Zou, X.; Jiang, S.; Yang, J.; Huang, X. Concrete Bridge Crack Detection Based on YOLO V8s in Complex Background. In Proceedings of the International Conference on Image, Vision and Intelligent Systems 2023 (ICIVIS 2023), Baoding, China, 16–18 August 2023; You, P., Liu, S., Wang, J., Eds.; Lecture Notes in Electrical Engineering. Springer Nature: Berlin, Germany, 2024; Volume 1163, pp. 436–443, ISBN 978-981-9708-54-3. [Google Scholar]
- Lu, G.; He, X.; Wang, Q.; Shao, F.; Wang, J.; Jiang, Q. Bridge Crack Detection Based on Improved Single Shot Multi-Box Detector. PLoS ONE 2022, 17, e0275538. [Google Scholar] [CrossRef]
- Ruggieri, S.; Cardellicchio, A.; Nettis, A.; Renò, V.; Uva, G. Using Attention for Improving Defect Detection in Existing RC Bridges. IEEE Access 2025, 13, 18994–19015. [Google Scholar] [CrossRef]
- Redmon, J.; Girshick, R.; Divvala, S.; Farhadi, A. You Only Look Once: Unified, Real-Time Object Detection. In Proceedings of the IEEE Conference on Computer Vision and Pattern Recognition, Las Vegas, NV, USA, 27–30 June 2016; pp. 779–788. [Google Scholar]
- Li, W. Damage Characteristics and YOLO Automated Crack Detection of Fissured Rock Masses under True-Triaxial Mining Unloading Conditions. Eng. Fract. Mech. 2025, 314, 110790. [Google Scholar] [CrossRef]
- Yeerjiang, A.; Wang, Z.; Huang, X.; Zhang, J.; Chen, Q.; Qin, Y.; He, J. YOLOv1 to YOLOv10: A Comprehensive Review of YOLO Variants and Their Application in Medical Image Detection. J. Artif. Intell. Pract. 2024, 7, 112–122. [Google Scholar]
- Jegham, N.; Koh, C.Y.; Abdelatti, M.; Hendawi, A. Evaluating the Evolution of YOLO (You Only Look Once) Models: A Comprehensive Benchmark Study of YOLO11 and Its Predecessors. arXiv 2024, arXiv:2411.00201. [Google Scholar]
- Khanam, R.; Hussain, M. YOLOv11: An Overview of the Key Architectural Enhancements. arXiv 2024, arXiv:2410.17725. [Google Scholar]
- Huang, J.; Wang, K.; Hou, Y.; Wang, J. LW-YOLO11: A Lightweight Arbitrary-Oriented Ship Detection Method Based on Improved YOLO11. Sensors 2024, 25, 65. [Google Scholar] [CrossRef]
- Dong, X.; Liu, Y.; Dai, J. Concrete Surface Crack Detection Algorithm Based on Improved YOLOv8. Sensors 2024, 24, 5252. [Google Scholar] [CrossRef]
- Rahman, M.M.; Munir, M.; Marculescu, R. EMCAD: Efficient Multi-Scale Convolutional Attention Decoding for Medical Image Segmentation. In Proceedings of the IEEE/CVF Conference on Computer Vision and Pattern Recognition, Seattle, WA, USA, 16–22 June 2024; pp. 11769–11779. [Google Scholar]
- Rahman, M.M.; Marculescu, R. Medical Image Segmentation via Cascaded Attention Decoding. In Proceedings of the 2023 IEEE/CVF Winter Conference on Applications of Computer Vision (WACV), Waikoloa, HI, USA, 2–7 January 2023; pp. 6211–6220. [Google Scholar]
- Nair, V.; Hinton, G.E. Rectified Linear Units Improve Restricted Boltzmann Machines. In Proceedings of the 27th International Conference on Machine Learning (ICML-10), Haifa, Israel, 21–24 June 2010; pp. 807–814. [Google Scholar]
- Ioffe, S.; Szegedy, C. Batch Normalization: Accelerating Deep Network Training by Reducing Internal Covariate Shift. In Proceedings of the International Conference on Machine Learning, Lille, France, 7–9 July 2015; pp. 448–456. [Google Scholar]


| Model | Anchor | Input | Backbone | Neck |
|---|---|---|---|---|
| YOLOv8 | No | 640 × 640 × 3 | CBS + C2f + SPPF | SPP/PAN |
| YOLOv9 | Yes | 640 × 640 × 3 | CBS + G-ELAN | PAN |
| YOLOv10 | No | 640 × 640 × 3 | PSA | C2f/PAN |
| YOLO11 | No | 640 × 640 × 3 | CBS + C3k2 + SPPF + C2PSA | C3k2/PAN |
| YOLO11n | EMSCA | LDH | F1/% | mAP50/% | mAP50-95/% | GFLOPs | FPS |
|---|---|---|---|---|---|---|---|
| √ | 86.8 | 91.5 | 68.1 | 6.3 | 526 | ||
| √ | √ | 89.4 | 94.0 | 71.3 | 6.3 | 555 | |
| √ | √ | 88.4 | 94.1 | 70.7 | 5.1 | 526 | |
| √ | √ | √ | 89.2 | 94.3 | 71.4 | 5.1 | 555 |
| Algorithm | F1/% | mAP50/% | mAP50-95/% | GFLOPs | FPS |
|---|---|---|---|---|---|
| Mask-RCNN | 77.4 | 85.2 | 60.3 | 133.6 | 138 |
| YOLOv10 | 80.5 | 89.0 | 66.4 | 8.2 | 500 |
| YOLO11 | 86.8 | 91.5 | 68.1 | 6.3 | 526 |
| YOLO11-BD | 89.2 | 94.3 | 71.4 | 5.1 | 555 |
| Algorithm | F1/% | mAP50/% | mAP50-95/% | GFLOPs | FPS |
|---|---|---|---|---|---|
| YOLO11 | 88.8 | 92.1 | 70.6 | 6.3 | 263 |
| YOLO11-BD | 89.5 | 94.6 | 73.3 | 5.1 | 333 |
| Fold | Training Set | Validation Set | F1/% | mAP50/% | mAP50-95/% |
|---|---|---|---|---|---|
| 1 | Fold 2, 3, 4, 5 | Fold 1 | 89.2 | 94.4 | 71.5 |
| 2 | Fold 1, 3, 4, 5 | Fold 2 | 89.3 | 94.7 | 71.9 |
| 3 | Fold 1, 2, 4, 5 | Fold 3 | 89.1 | 94.2 | 71.1 |
| 4 | Fold 1, 2, 3, 5 | Fold 4 | 89.4 | 95.1 | 72.4 |
| 5 | Fold 1, 2, 3, 4 | Fold 5 | 88.9 | 93.9 | 71.3 |
| Average | 89.2 | 94.5 | 71.6 |
| Algorithm | F1/% | mAP50/% | mAP50-95/% | GFLOPs |
|---|---|---|---|---|
| Mask-RCNN | 55.3 | 60.2 | 41.4 | 133.6 |
| YOLOv10 | 60.7 | 68.5 | 47.4 | 8.2 |
| YOLO11 | 74.9 | 77.8 | 54.7 | 6.3 |
| YOLO11-BD | 78.5 | 83.6 | 57.1 | 5.1 |
Disclaimer/Publisher’s Note: The statements, opinions and data contained in all publications are solely those of the individual author(s) and contributor(s) and not of MDPI and/or the editor(s). MDPI and/or the editor(s) disclaim responsibility for any injury to people or property resulting from any ideas, methods, instructions or products referred to in the content. |
© 2025 by the authors. Licensee MDPI, Basel, Switzerland. This article is an open access article distributed under the terms and conditions of the Creative Commons Attribution (CC BY) license (https://creativecommons.org/licenses/by/4.0/).
Share and Cite
Dong, X.; Yuan, J.; Dai, J. Study on Lightweight Bridge Crack Detection Algorithm Based on YOLO11. Sensors 2025, 25, 3276. https://doi.org/10.3390/s25113276
Dong X, Yuan J, Dai J. Study on Lightweight Bridge Crack Detection Algorithm Based on YOLO11. Sensors. 2025; 25(11):3276. https://doi.org/10.3390/s25113276
Chicago/Turabian StyleDong, Xuwei, Jiashuo Yuan, and Jinpeng Dai. 2025. "Study on Lightweight Bridge Crack Detection Algorithm Based on YOLO11" Sensors 25, no. 11: 3276. https://doi.org/10.3390/s25113276
APA StyleDong, X., Yuan, J., & Dai, J. (2025). Study on Lightweight Bridge Crack Detection Algorithm Based on YOLO11. Sensors, 25(11), 3276. https://doi.org/10.3390/s25113276