
Mathematical Framework for the Representation of the Travel of an Accelerometer-Based Texture Testing Device


Abstract
1. Introduction
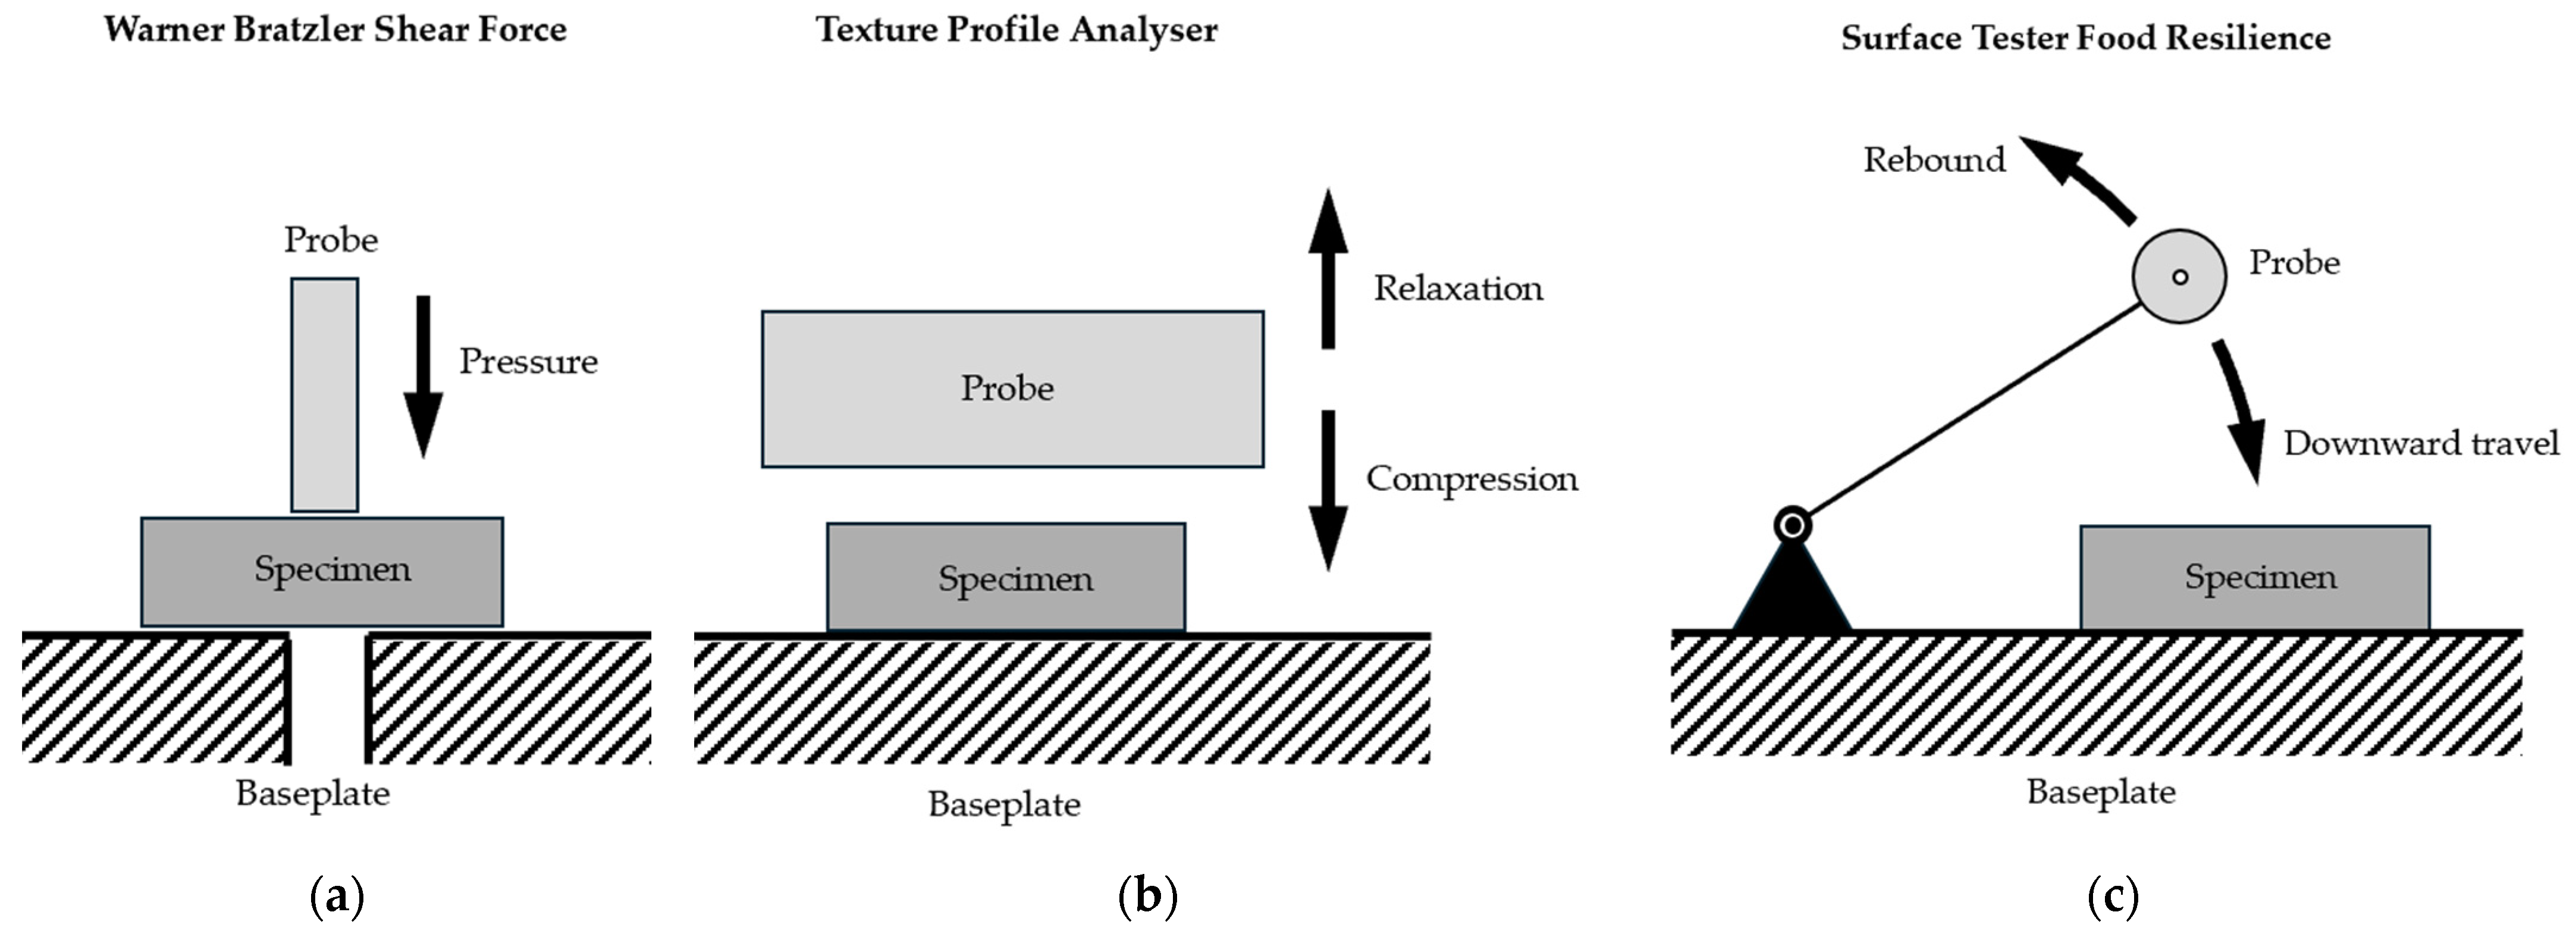
2. Materials, Methods and Results
2.1. The STFR and Its Mode of Operation
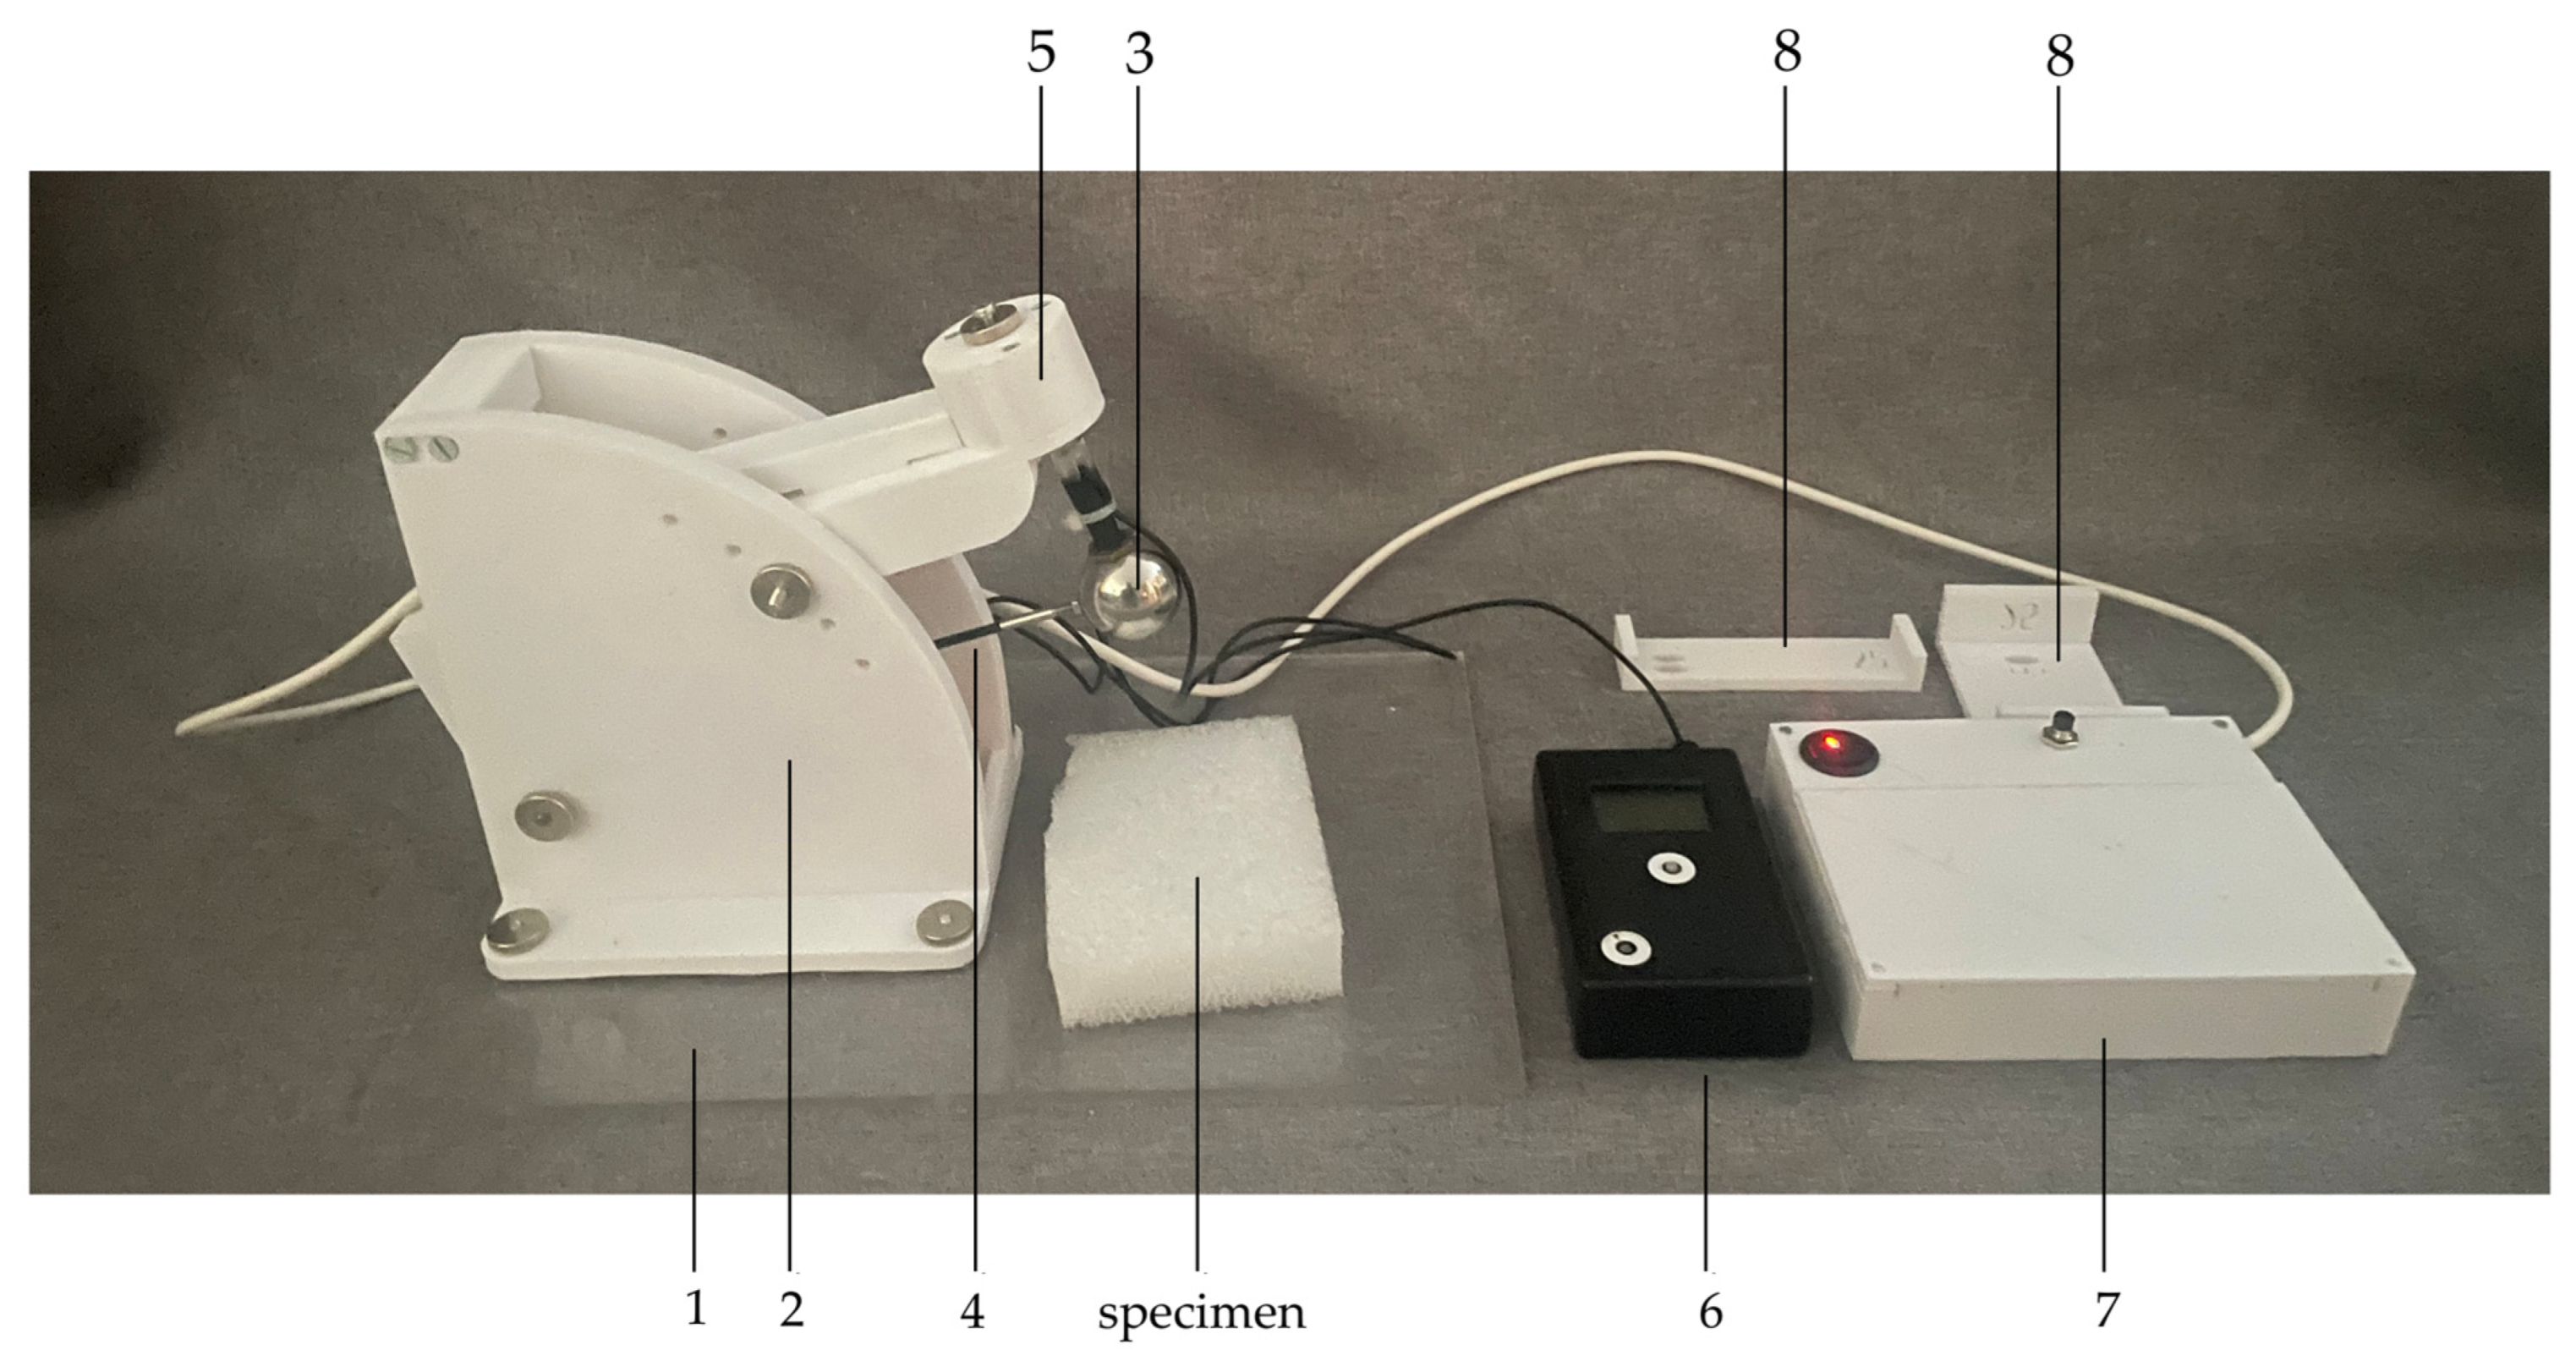
2.1.1. The STFR Device
- A baseplate (“1” in Figure 2);
- A rig attached to the baseplate, with a height-adjustable electromagnet, 2;
- A sphere 3, made from steel, with 30 mm diameter and a mass of 0.104 kg; inside the sphere, two accelerometers (one sensitive; ±2× g; one less sensitive; up to 200× g) are placed and the sphere is attached to a carbon-fiber rod 4 with a swivel on the other end; the distance from the center of the sphere to the rotation center of the swivel is 170 mm;
- A magnetic holding device 5 attached to the sphere;
- A digital data acquisition system which records and stores acceleration data for further analysis 6;
- A trigger for the electromagnetic holder and power supply 7;
- Spacers (25 mm, 50 mm, 75 mm) to check the distance between specimen surface and sphere.
2.1.2. Principle of Operation
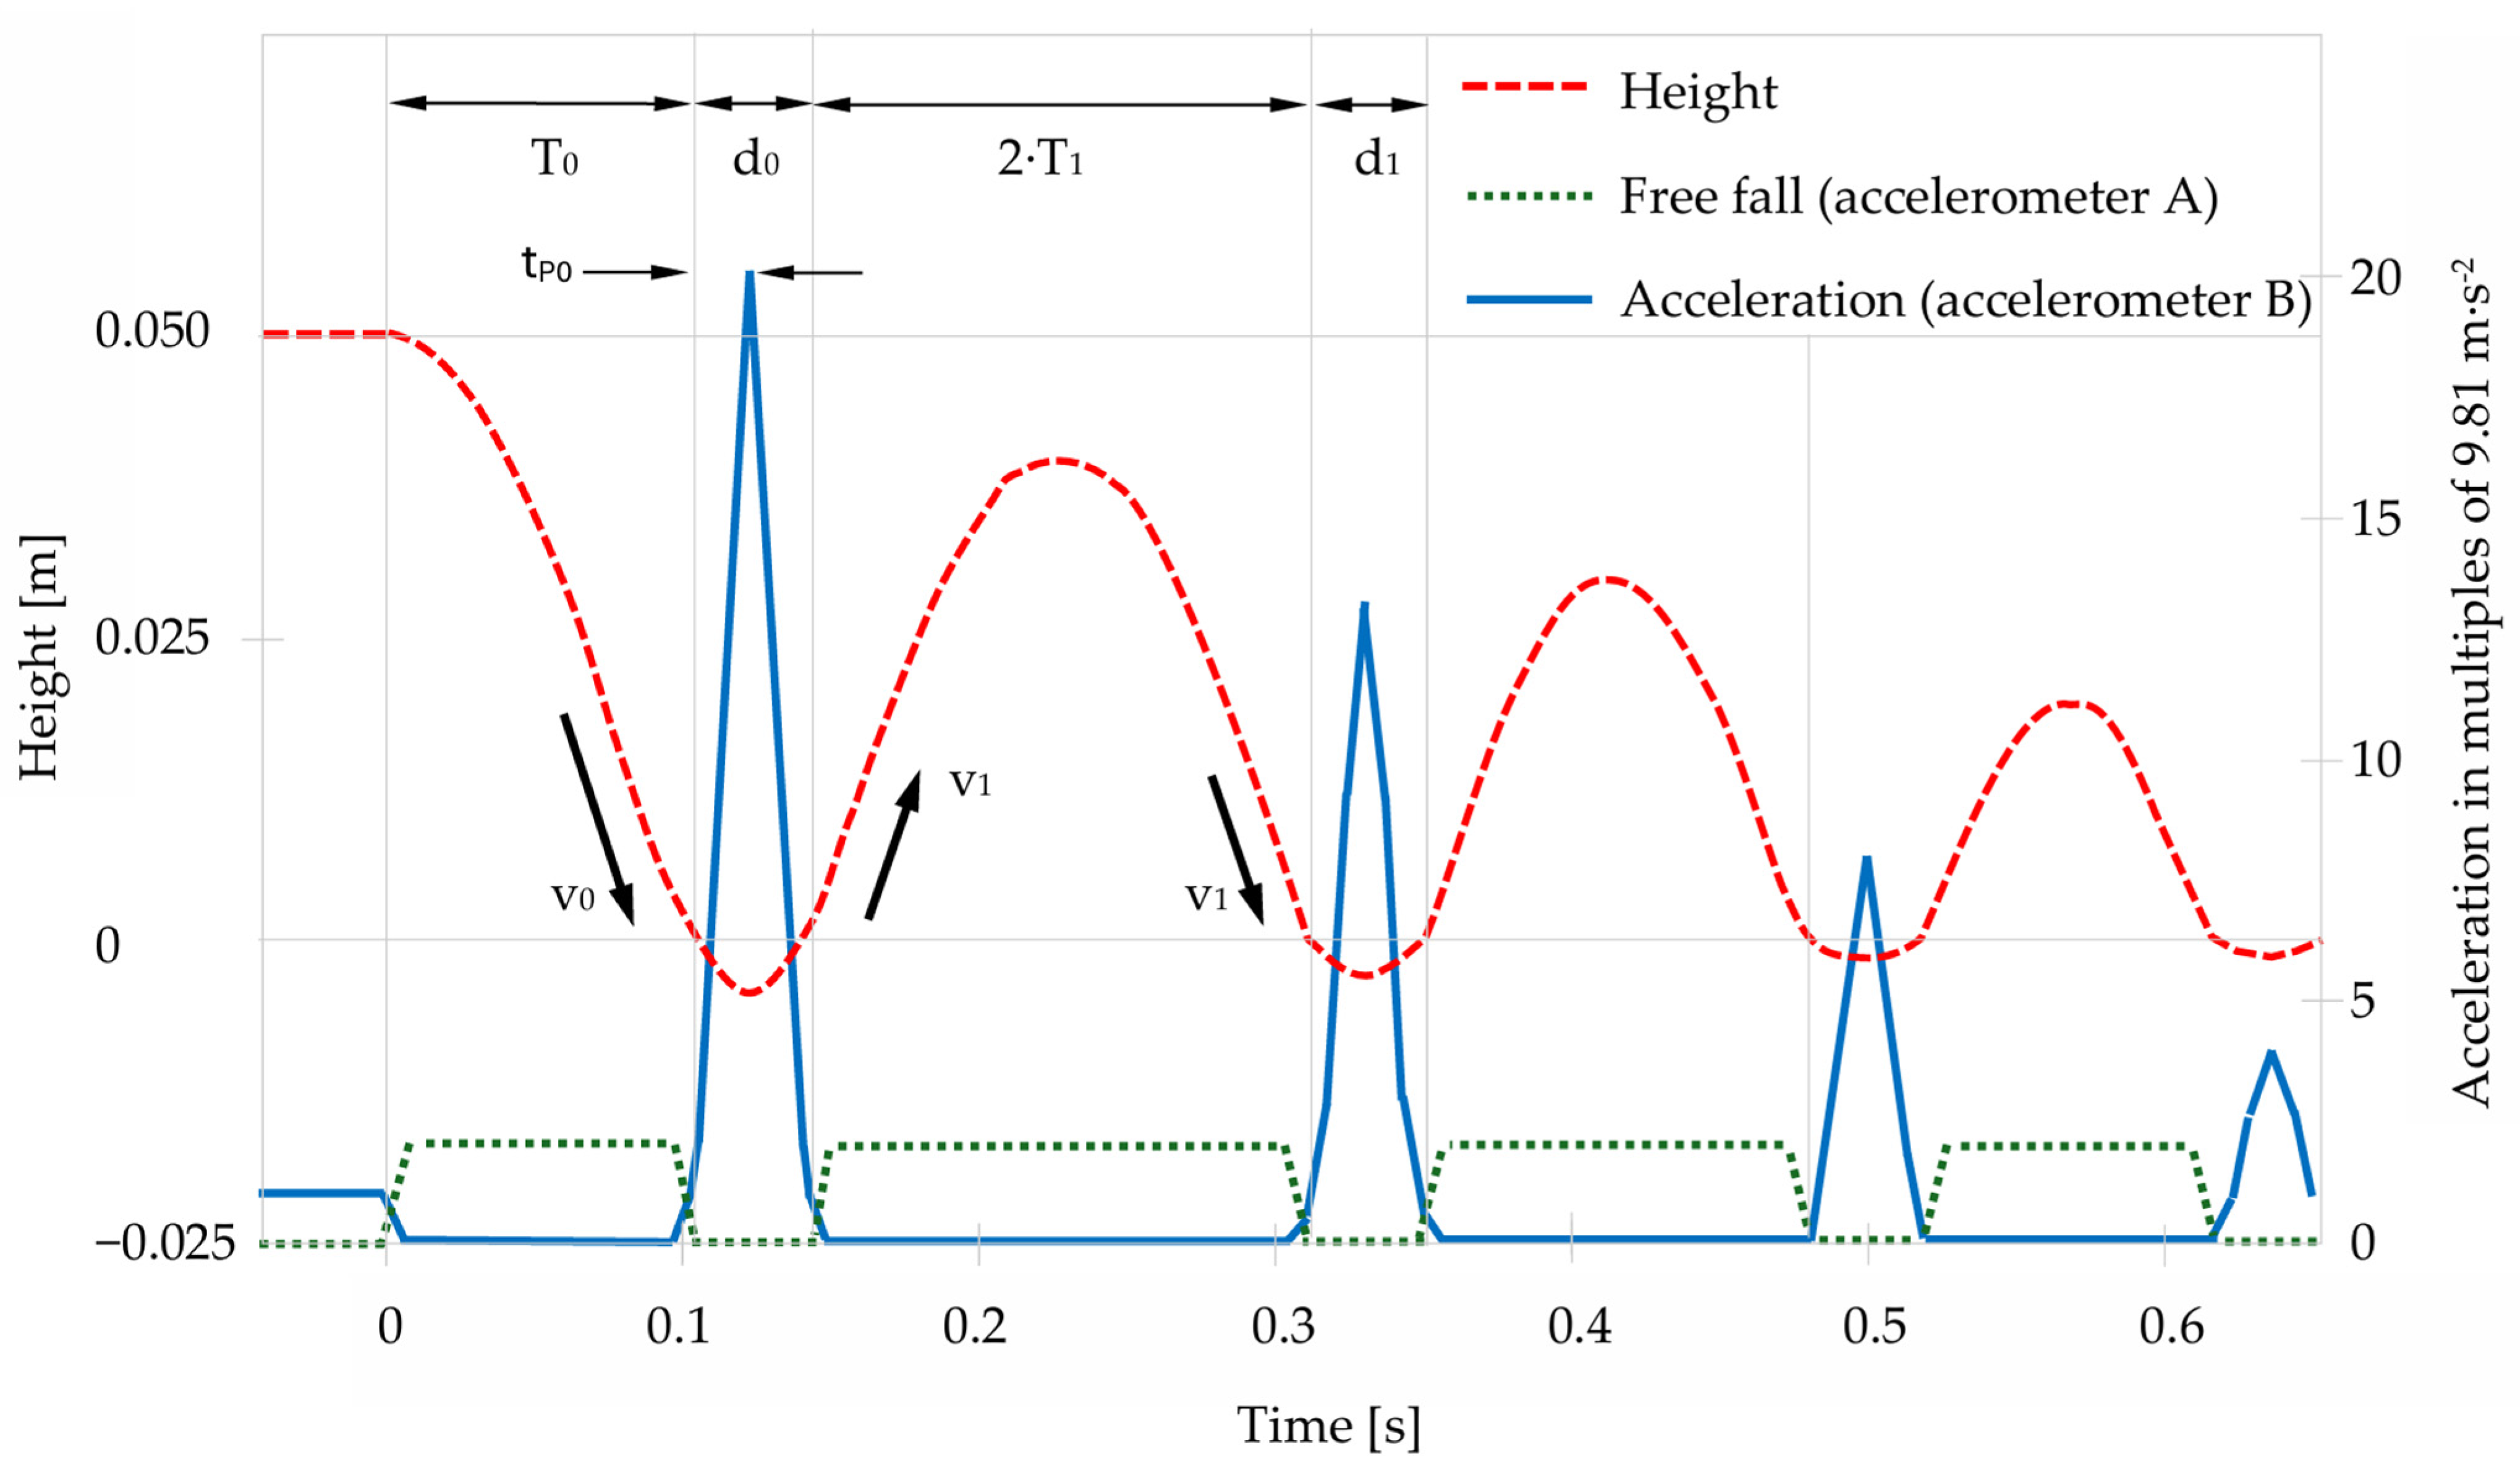
2.1.3. Data Recorded by the STFR
2.2. Mathematical–Physical Modeling of the Movement of the Sphere
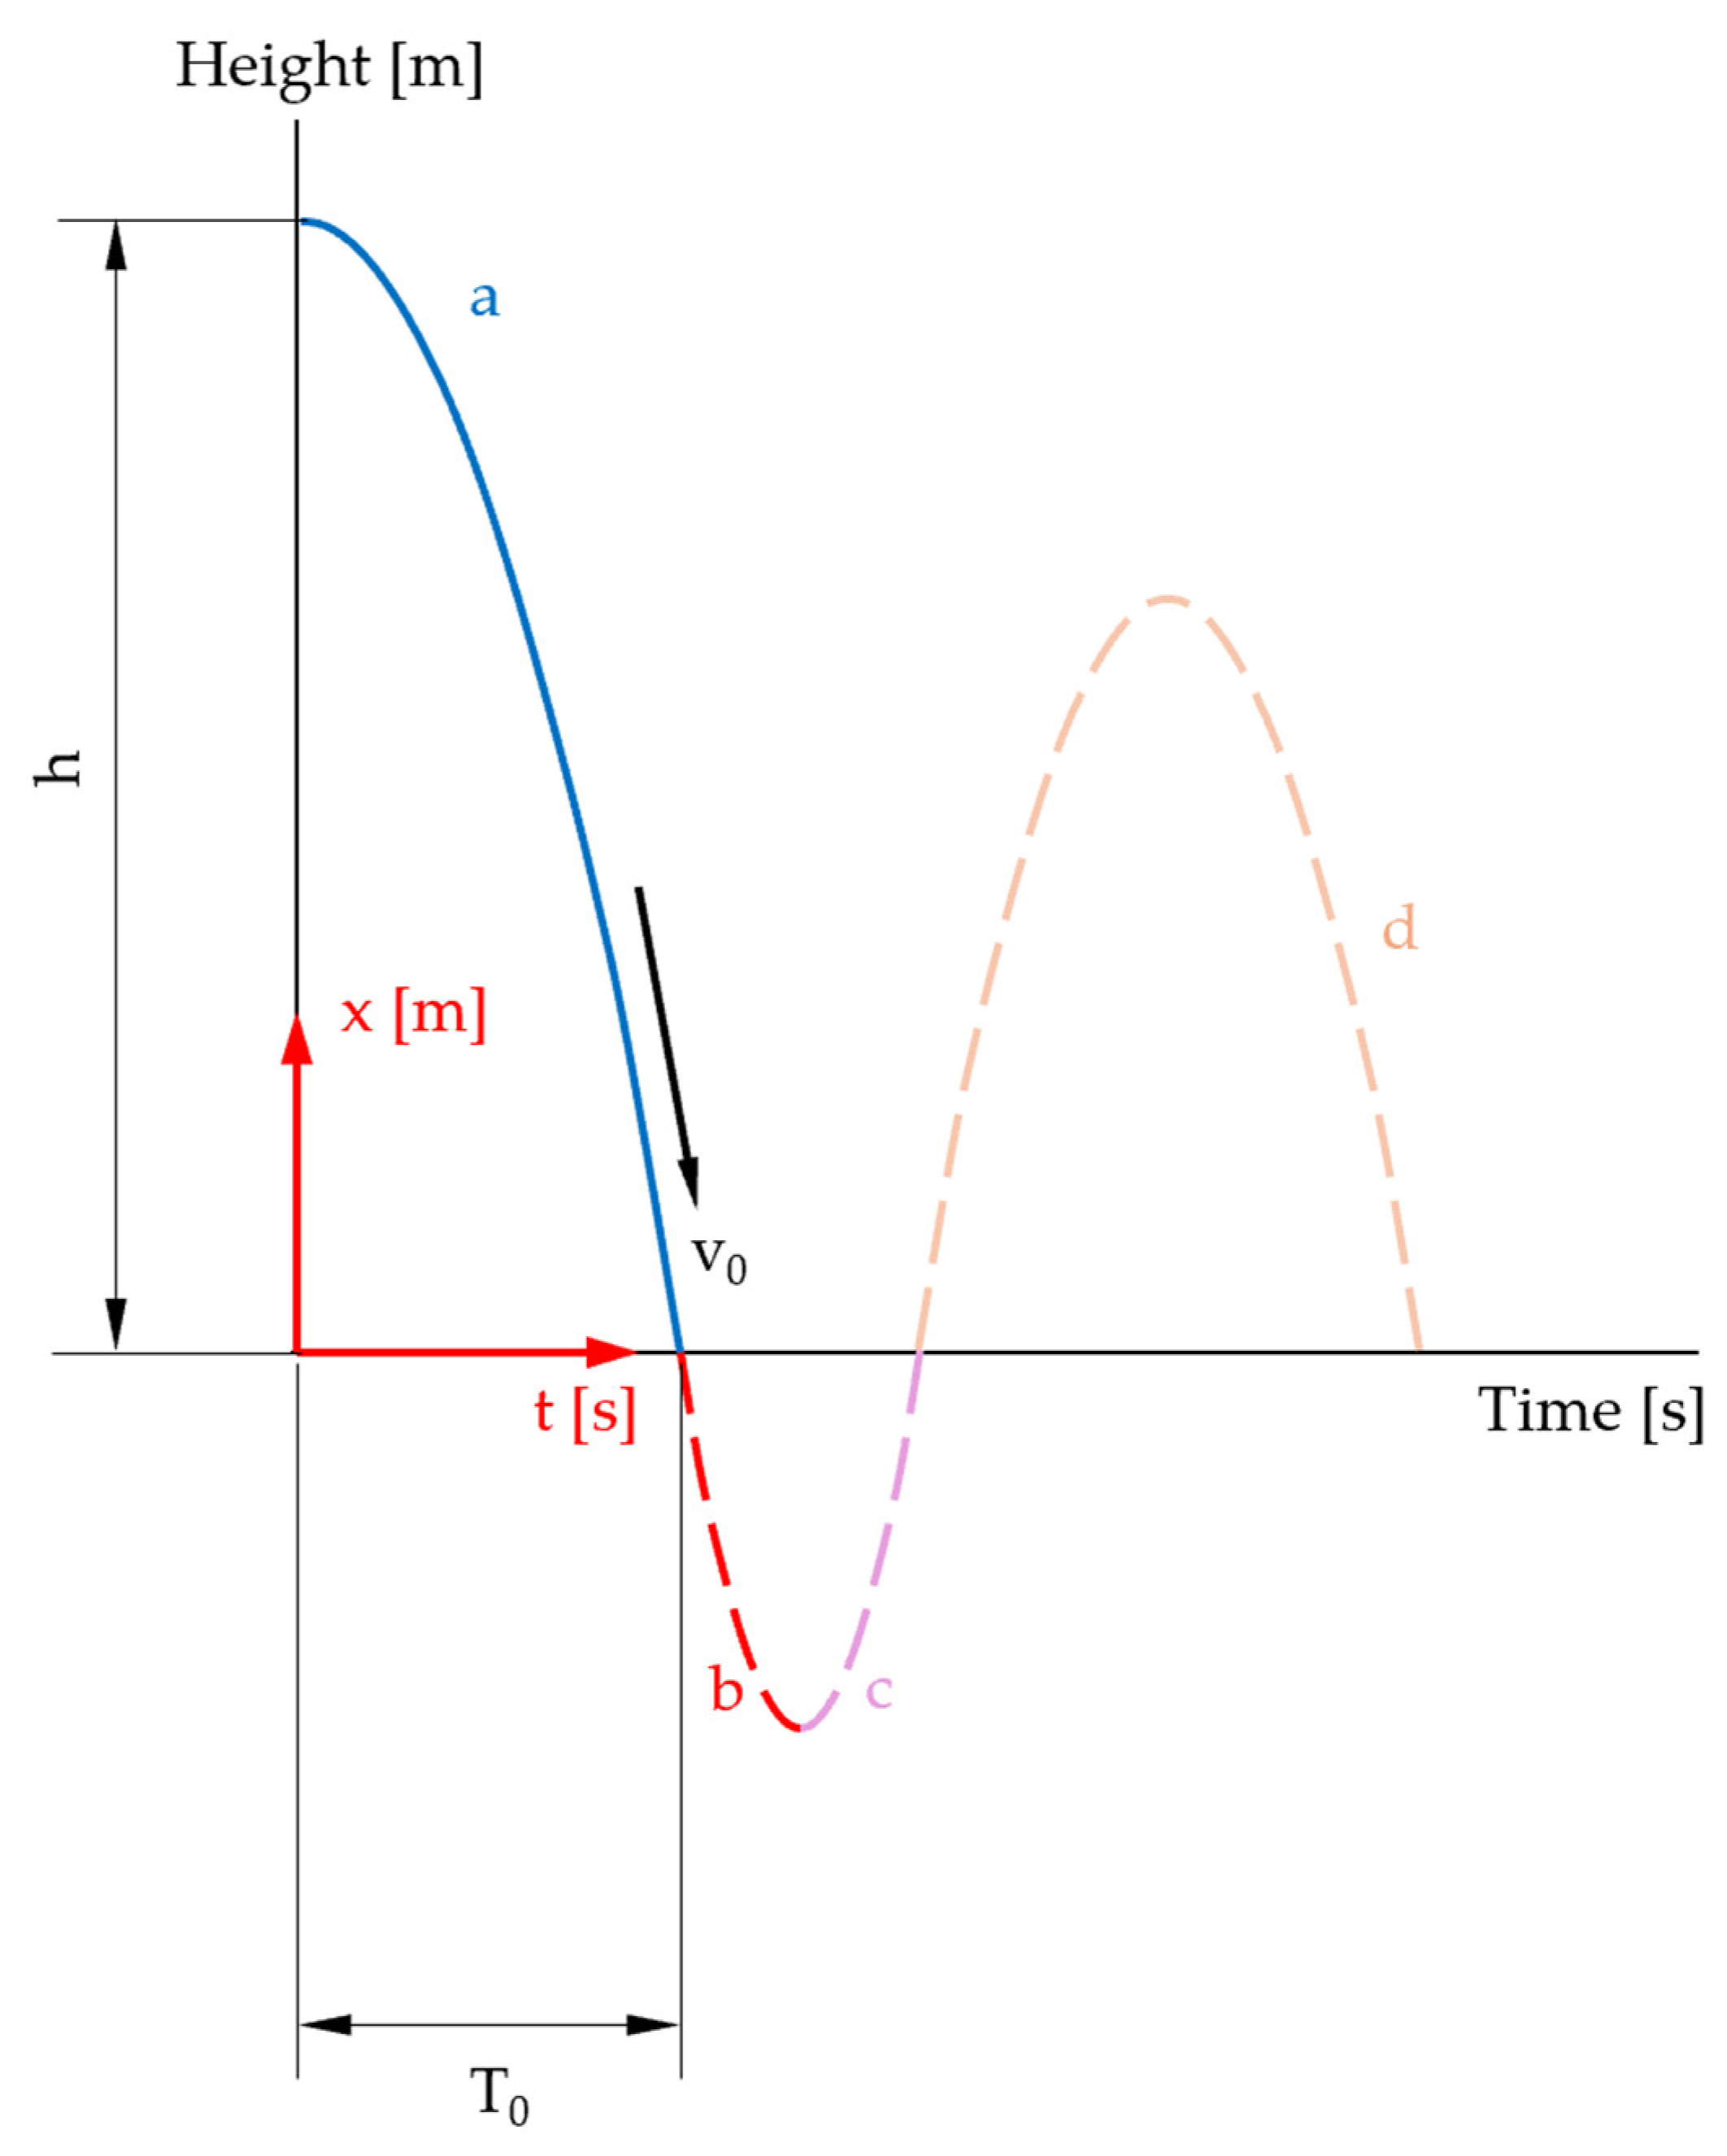
2.2.1. Derivation of the Equation of Motion
2.2.2. Solving the Equation of Motion with Small-Angle Approximation
2.2.3. Solving the Equations of Motion Using the Power Series Approach
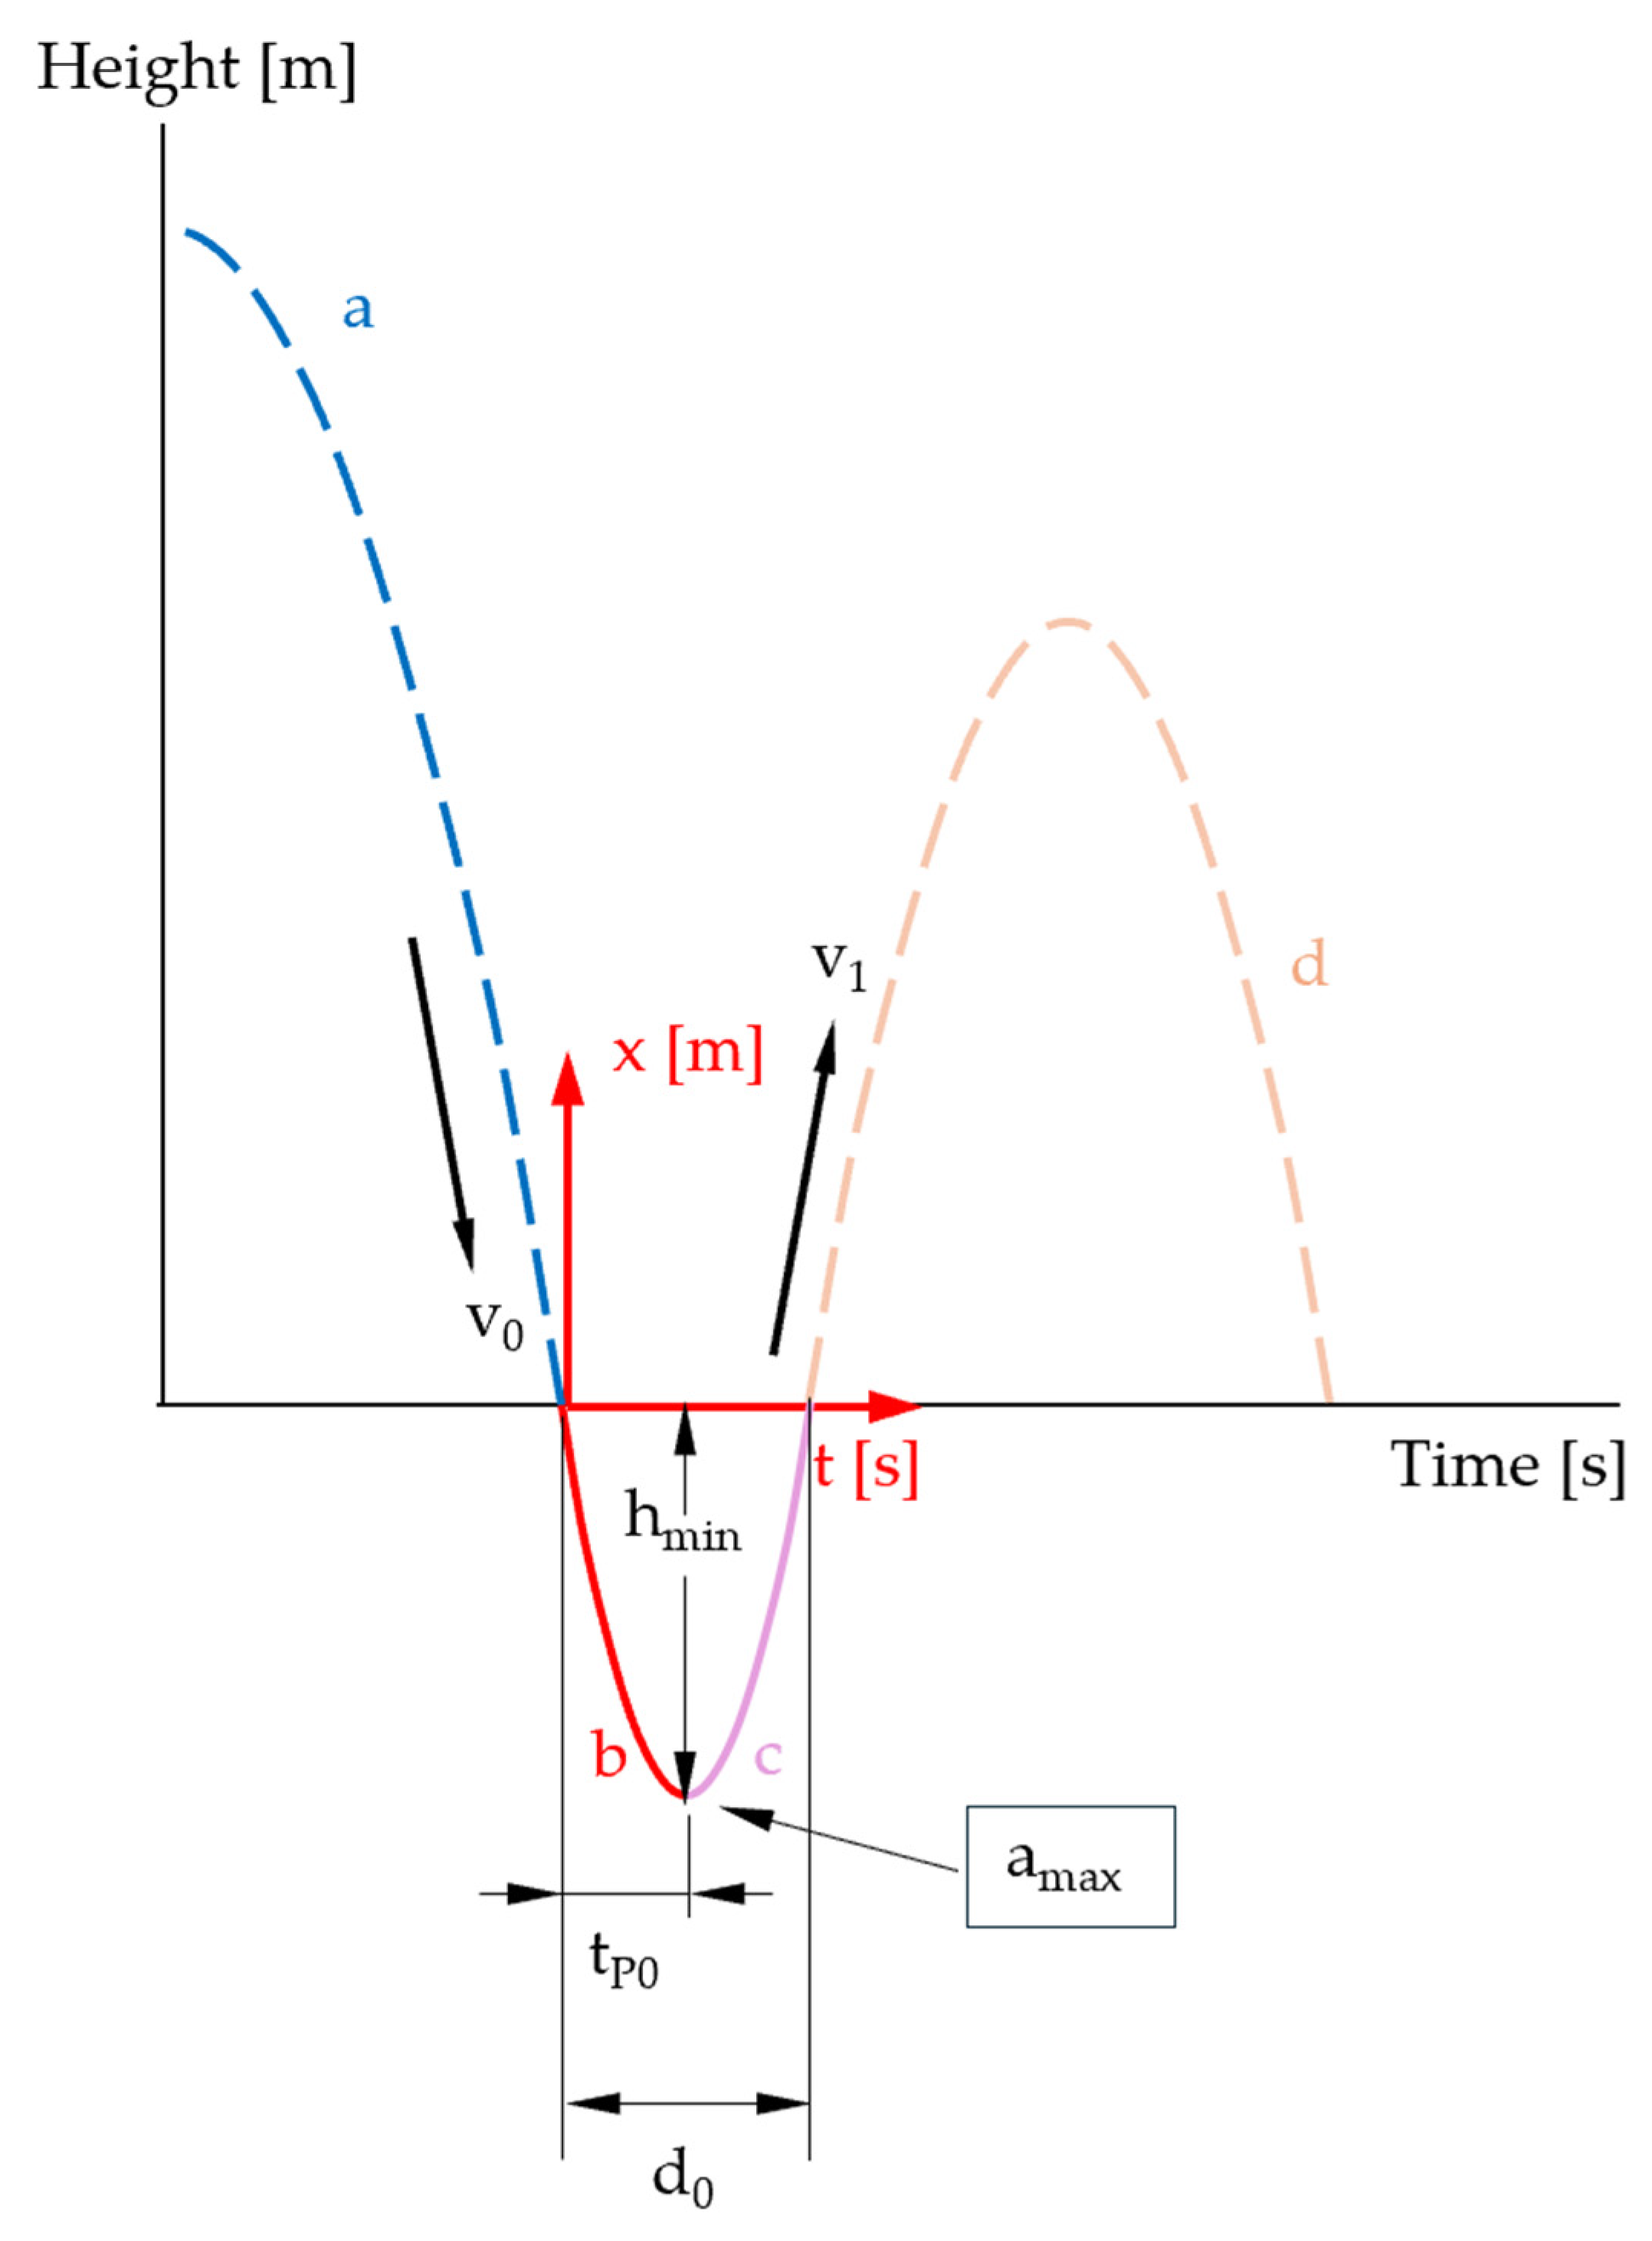
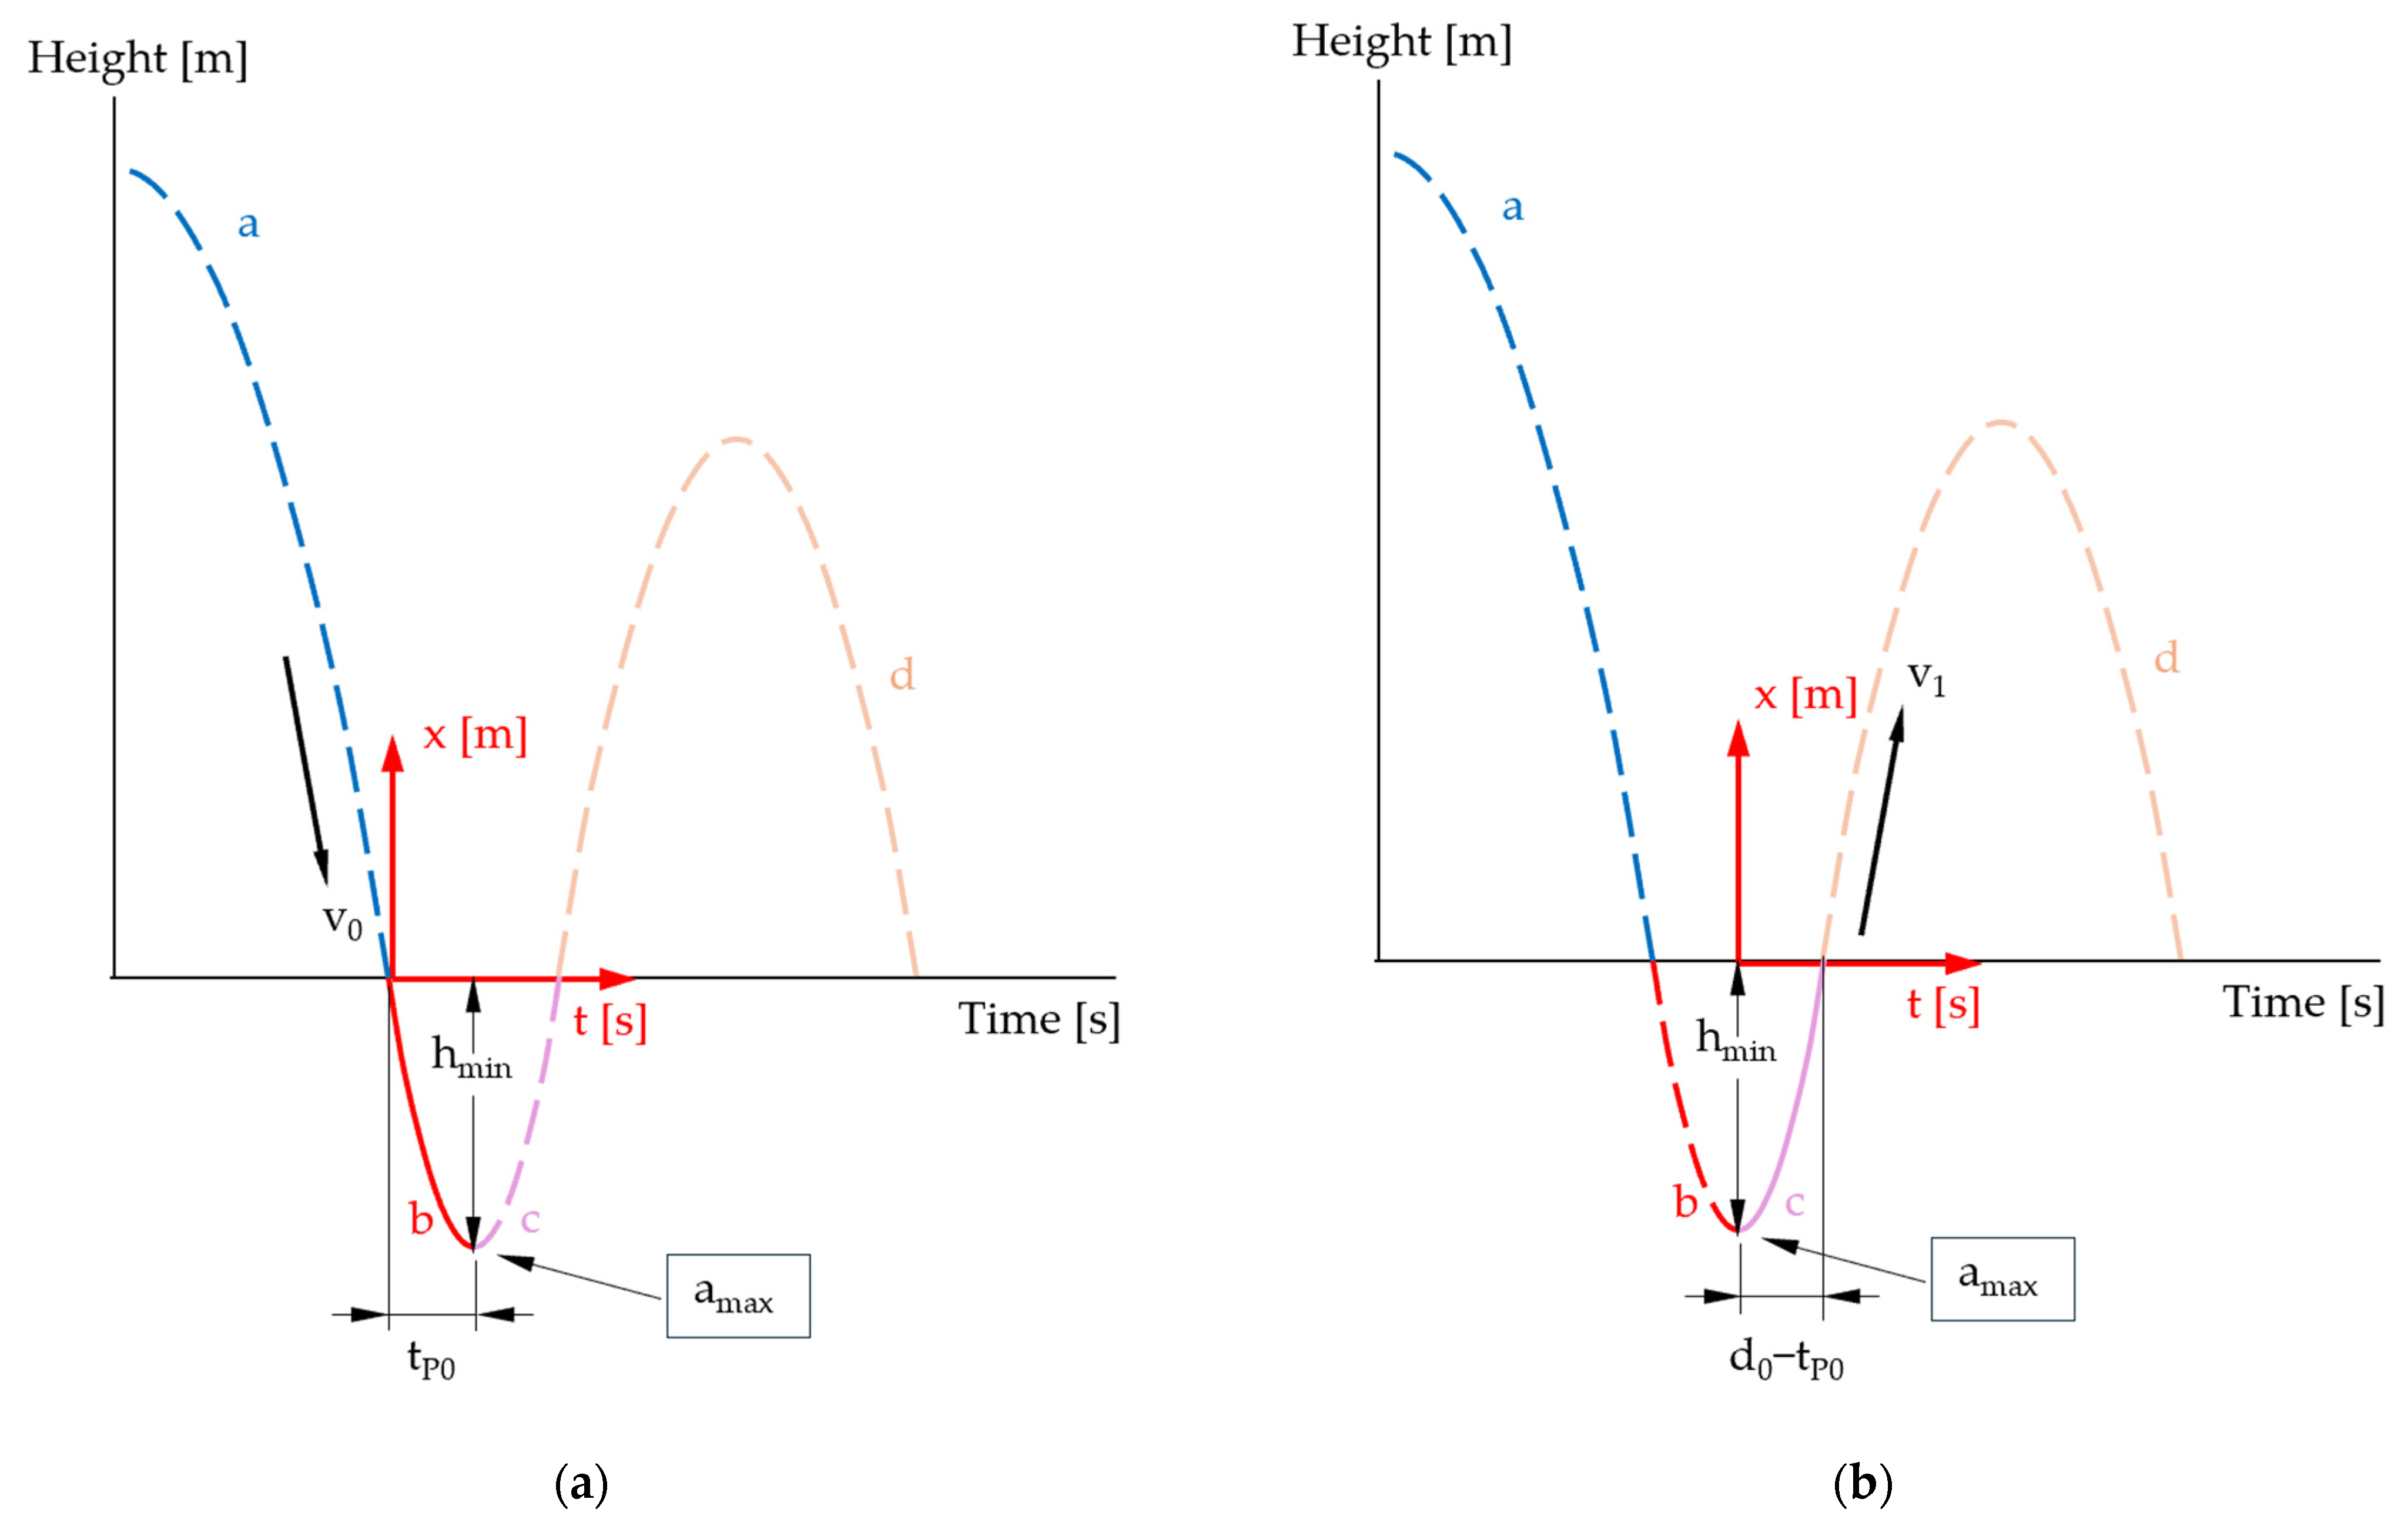
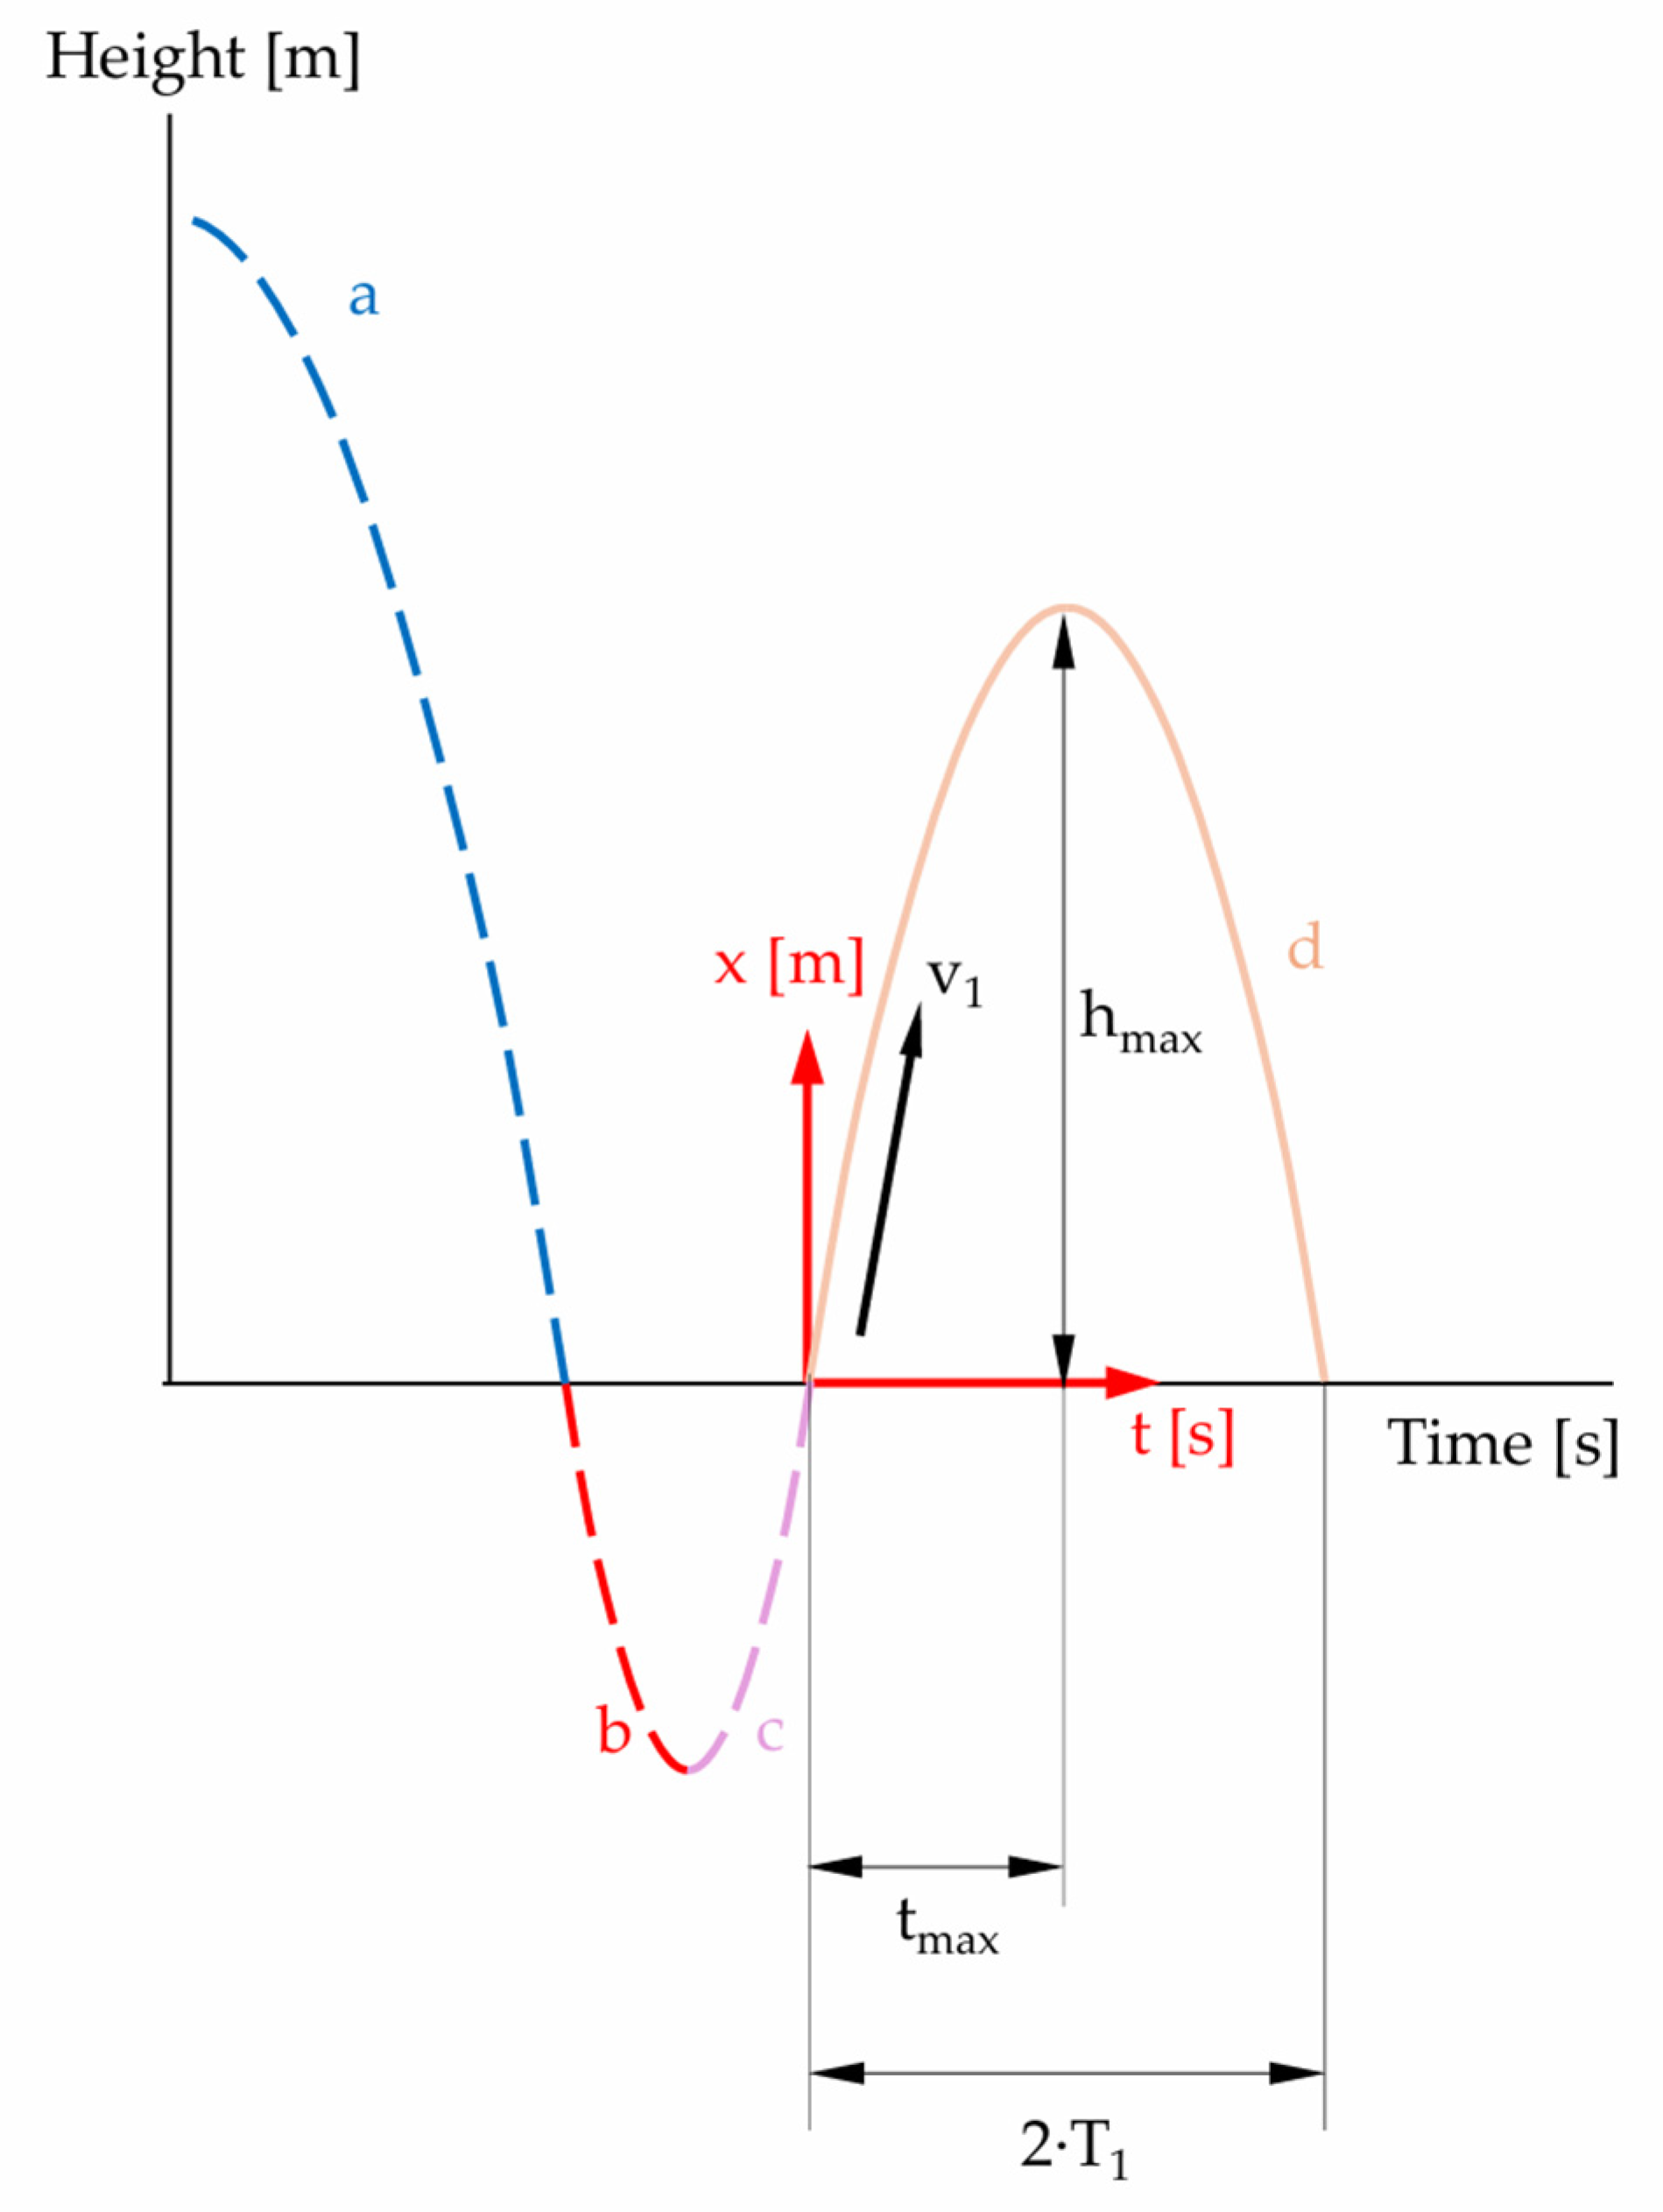
- For the individual movement phases, we consider the initial and boundary conditions. For the first flight phase (Figure 6: curve section a), we obtain Equation (16).
- The first movement phase in the specimen (Figure 6: curve sections b and c) is represented by Equation (17).
- The second phase in the air (Figure 6: curve section d) is described by the function (18).
2.2.4. Initial Drop Movement in the Power Series Approach
2.2.5. Movement in the Specimen in the Power Series Approach
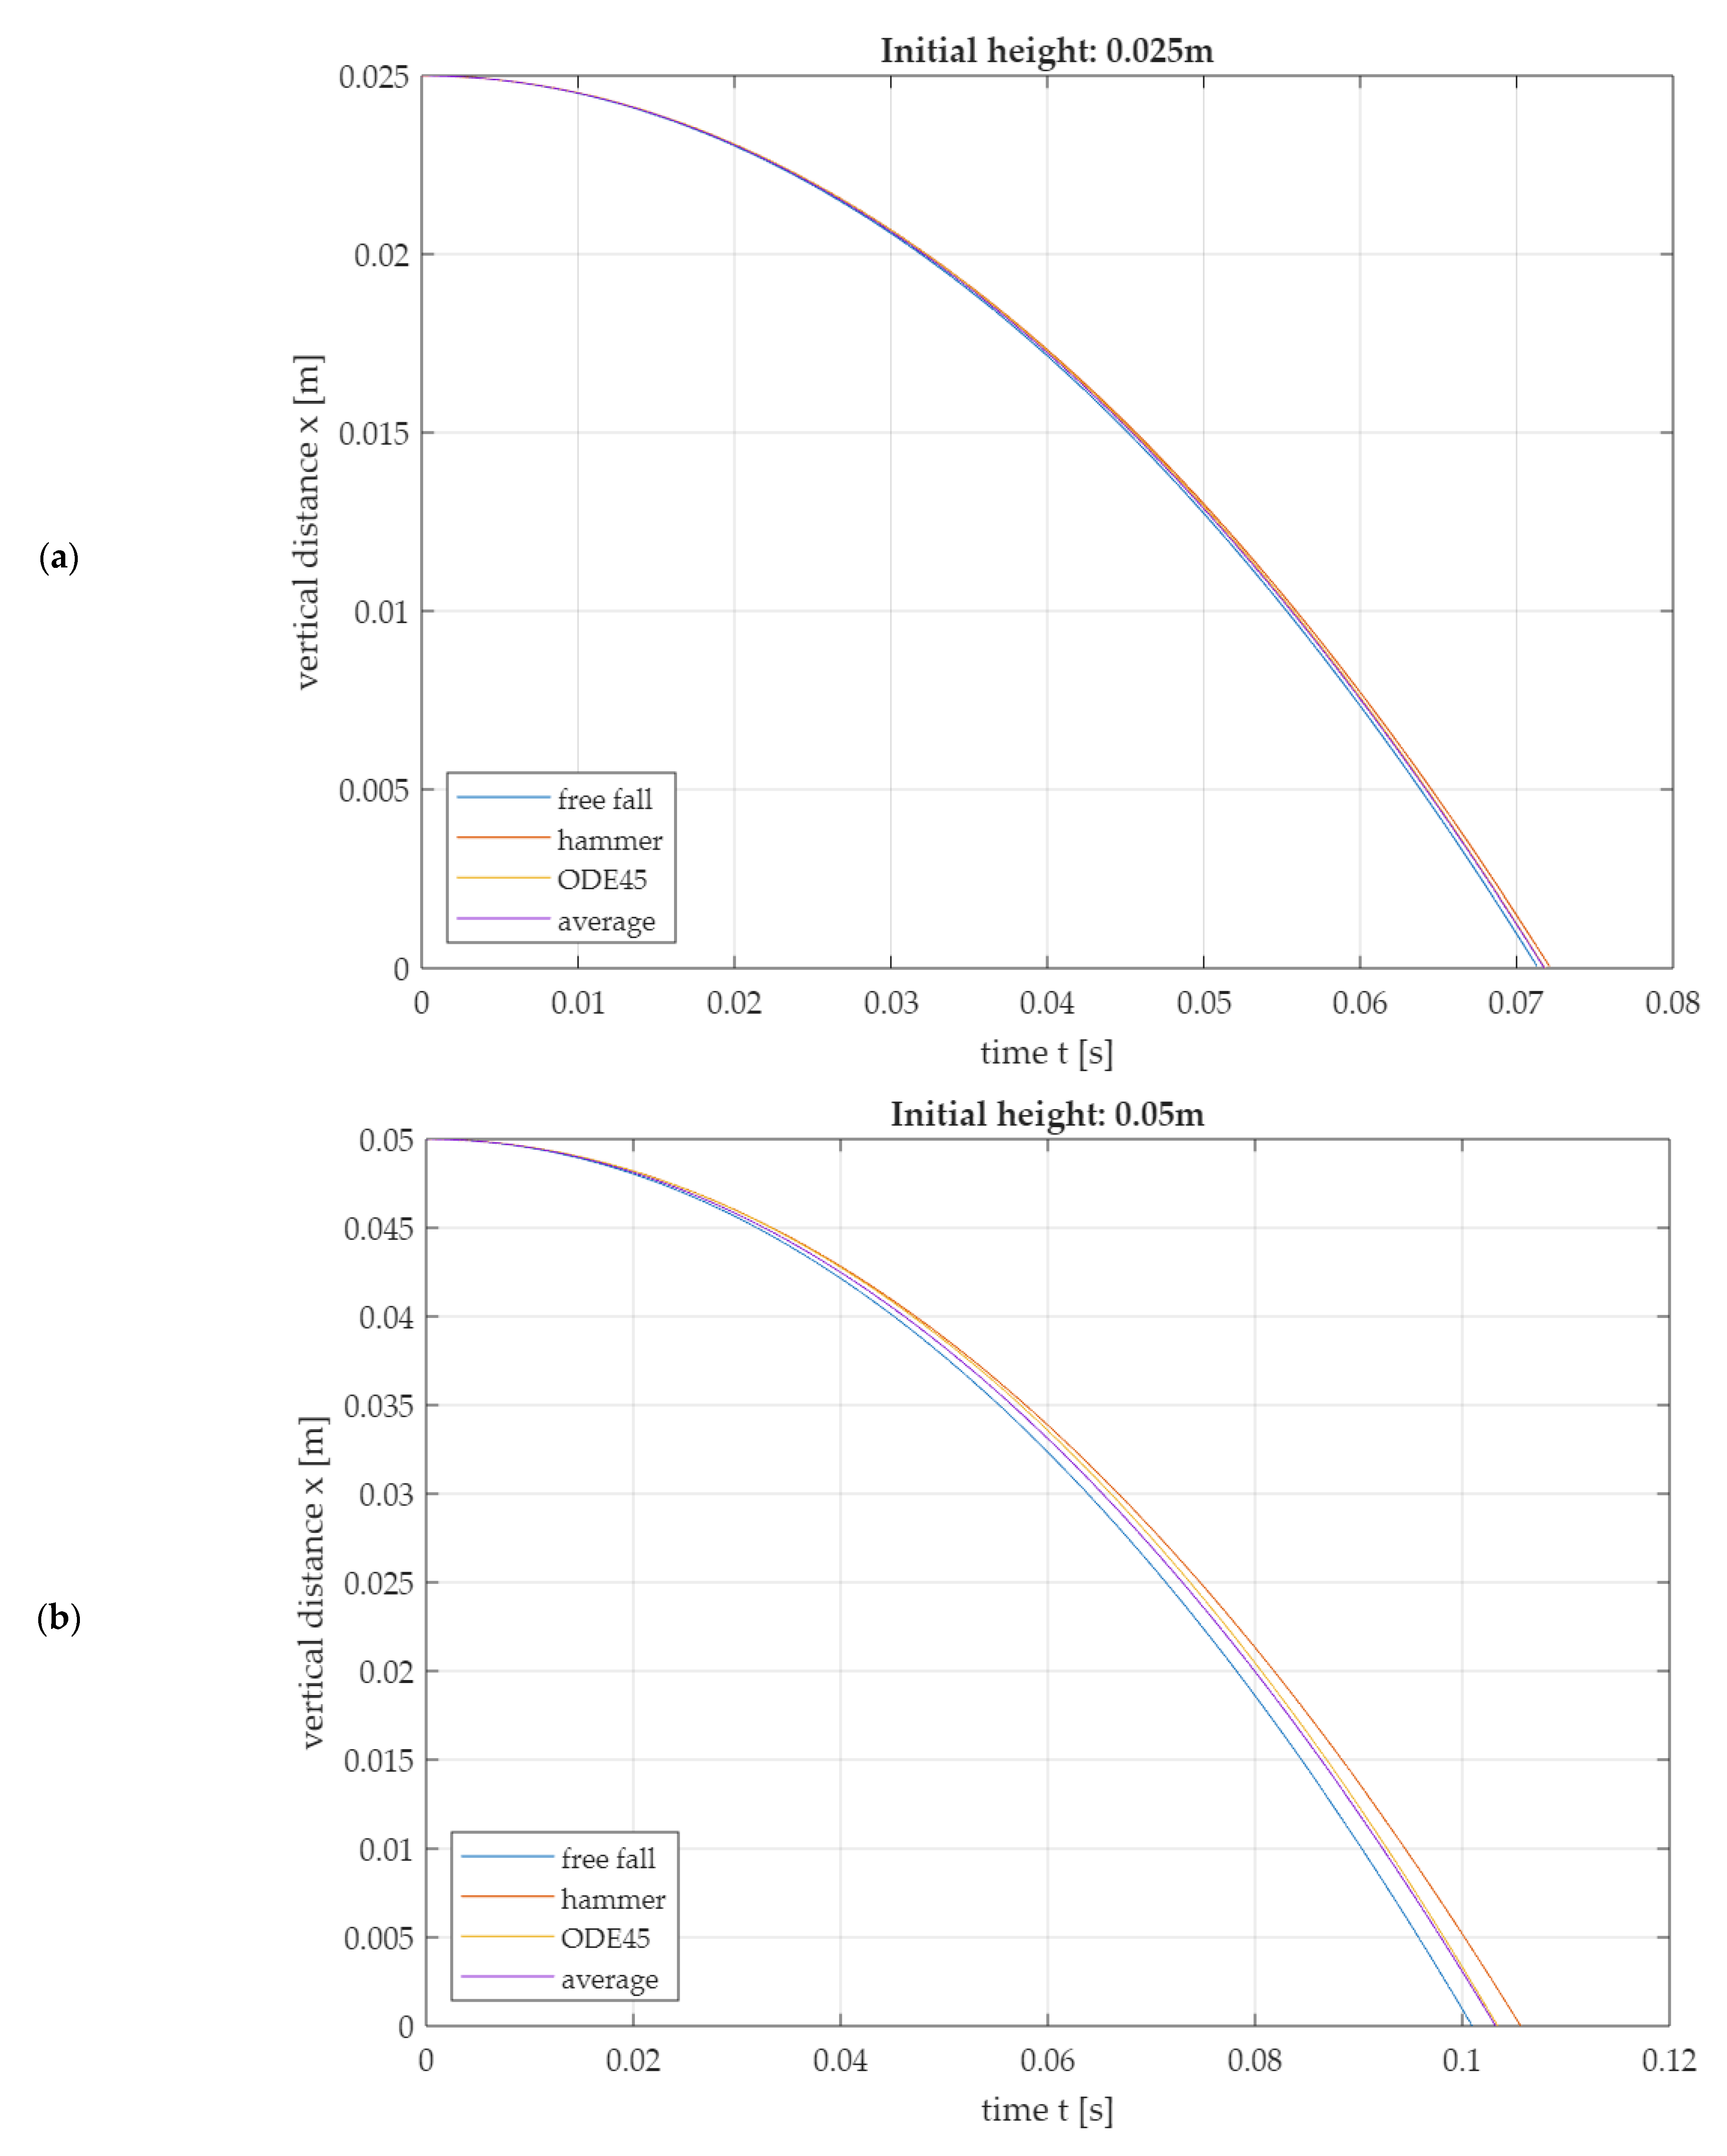
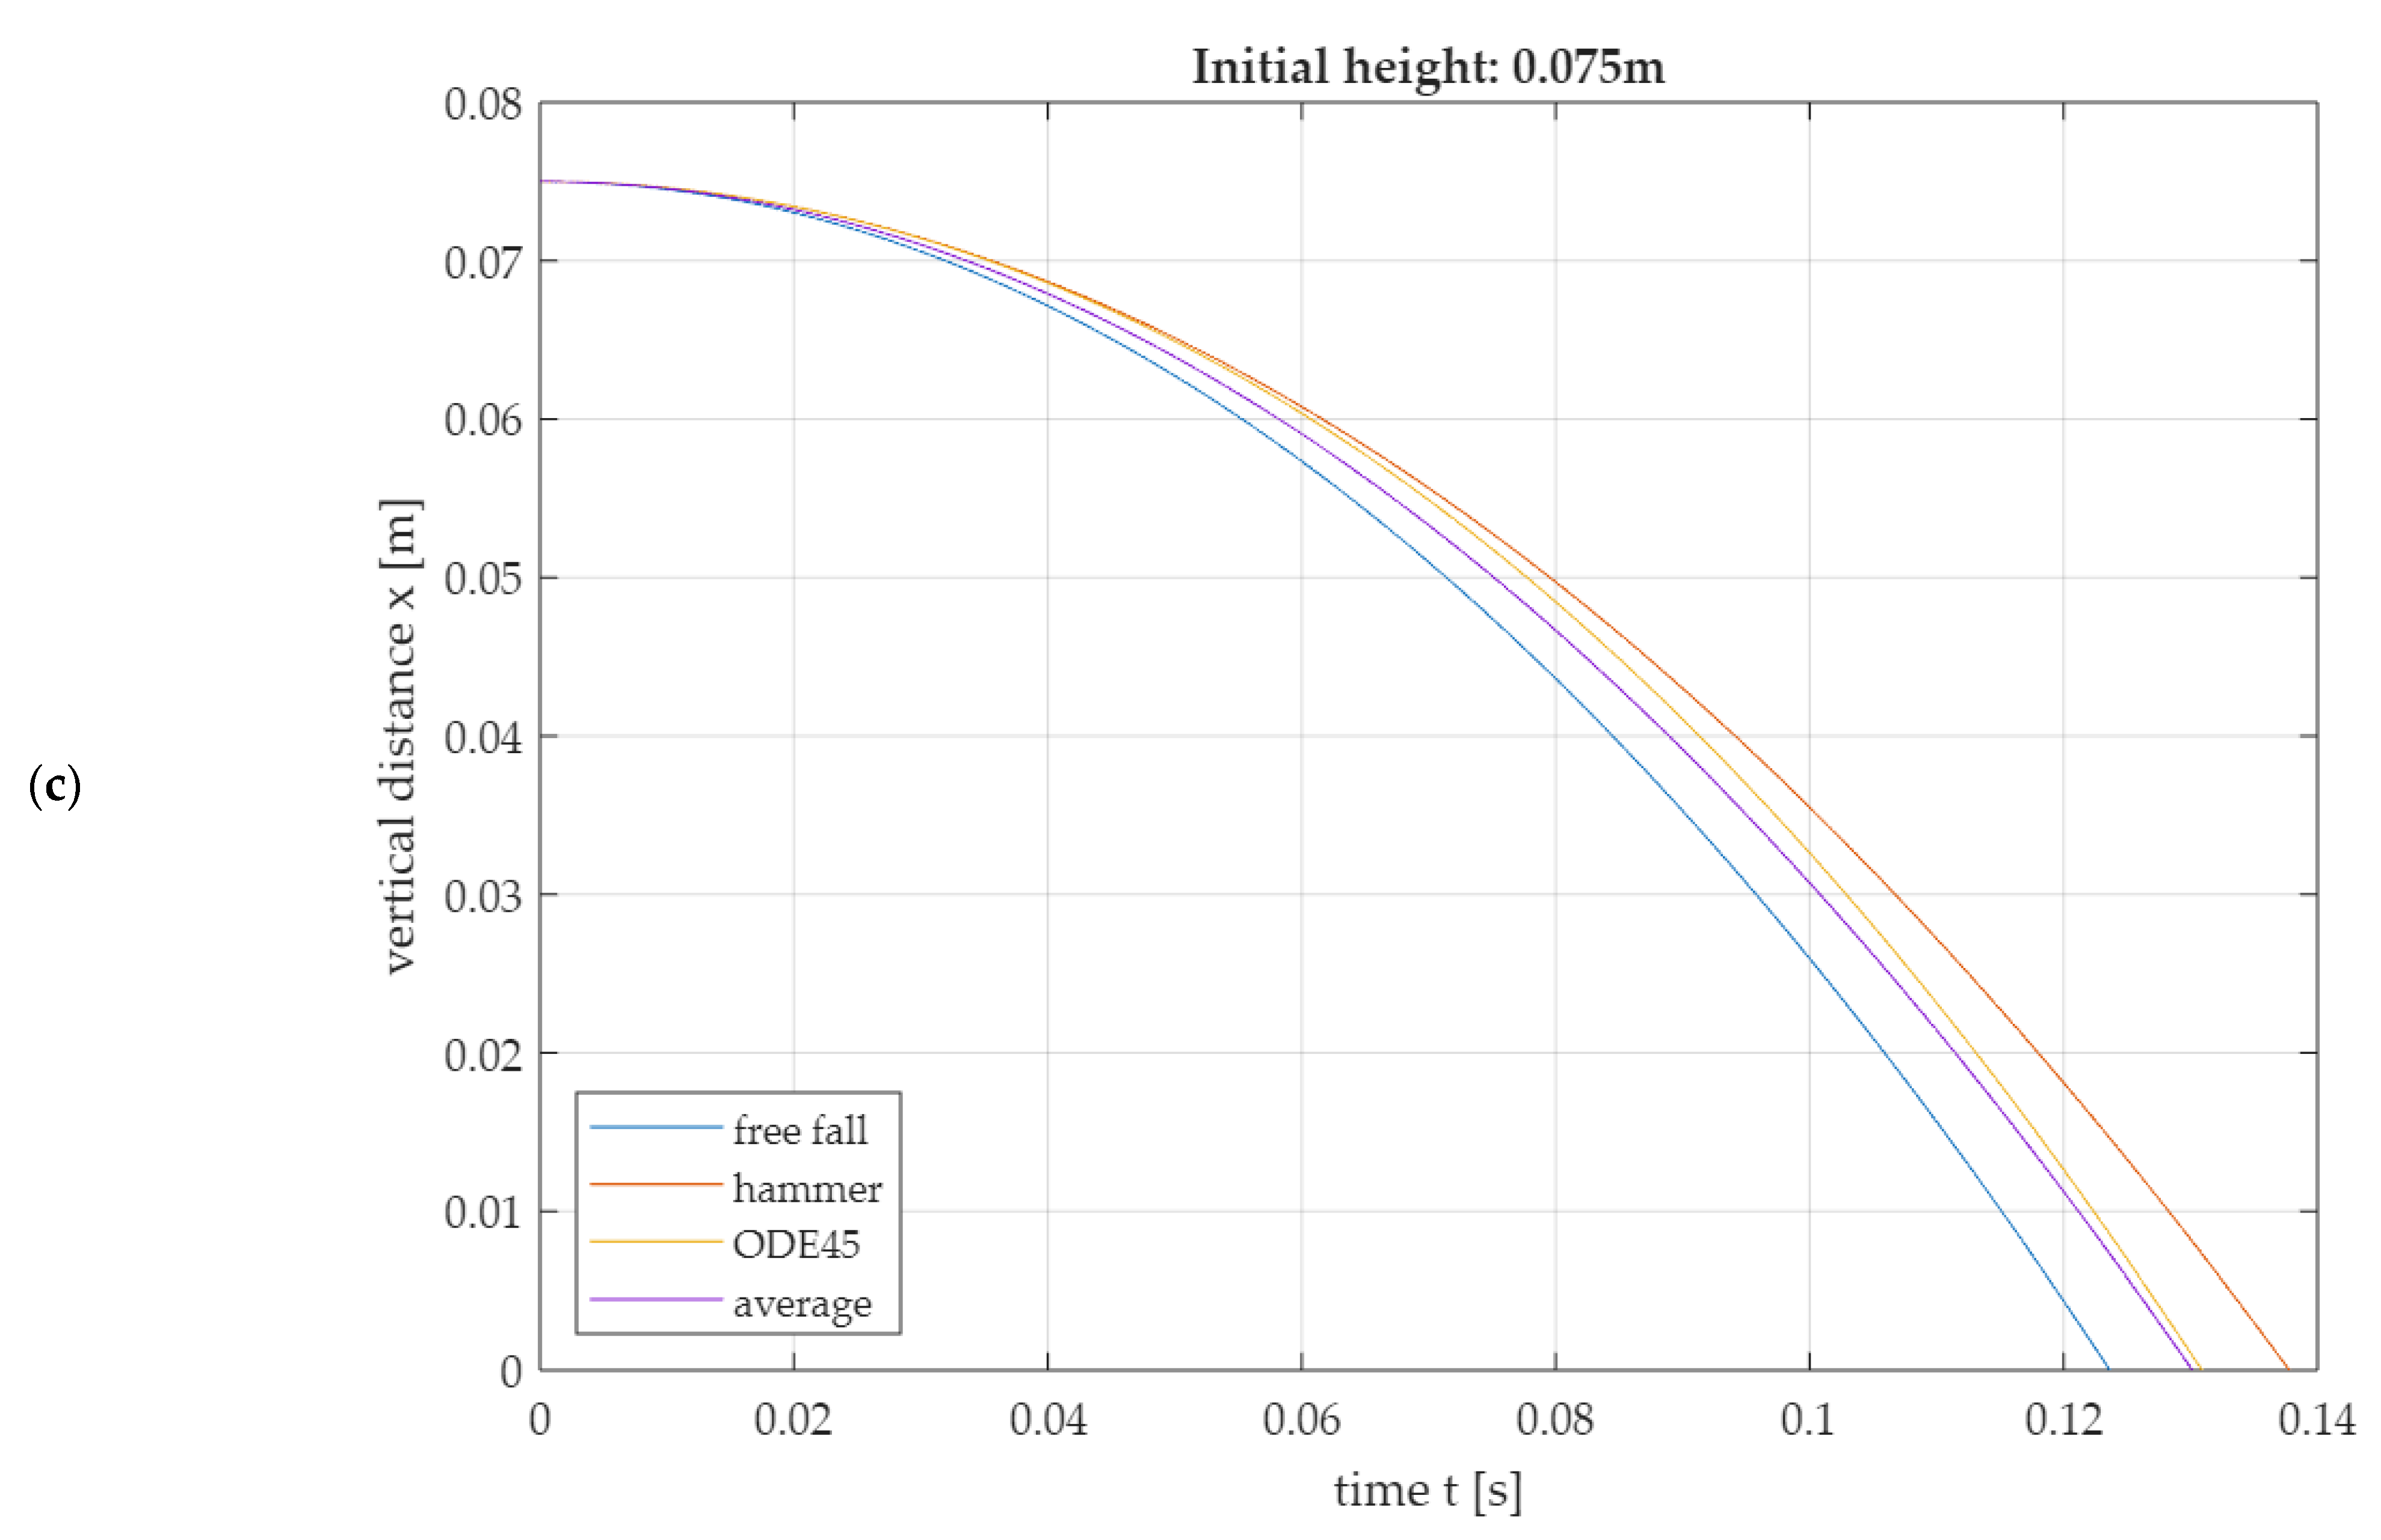
- To be able to compare the model described above with measured values of the STFR, further modeling is carried out using cubic functions. To take possible asymmetry into account, the movement in the specimen is divided into a descending curve section (Figure 12a) and an ascending curve section (Figure 12b). At the transition point, both curves coincide in speed and acceleration.
2.2.6. Flight Phase After the First Rebound in the Power Series Approach
2.3. Derivation of Formulae for Material Characteristics
2.3.1. Approximations for Energy Restitution
2.3.2. Approximations for Spring Constant and Damping Constant
- The second order approximation (38)
- Considering the third-order Equations (28) and (29), comparison of the coefficients results in Equation (40),
2.4. Practical Relevance of the Selection of Mathematical Models for Calculation of T0
3. Discussion
3.1. Rationale for This Study
3.2. Selection of Mathematical Approaches and Constraints
3.3. Consequences of the Modeling Approaches for the Refinement of the STFR Software
4. Final Conclusions
Supplementary Materials
Author Contributions
Funding
Institutional Review Board Statement
Informed Consent Statement
Data Availability Statement
Conflicts of Interest
Abbreviations and Symbols
| |x| | Absolute amount (modulus) of x |
| . over letter | First derivation |
| .. over letter | Second derivation |
| Δ | Difference, error |
| 2∙T1 | Duration of the second free-flight phase, [s] |
| amax | Maximum acceleration, [m∙s−2] |
| cs | Damping constant near the specimen’s surface, [kg∙s−1] |
| ch | Damping constant for larger distances from the specimen’s surface, [kg∙s−1] |
| D | Maximum penetration depth of the specimen at impact, [mm] |
| d0 | Duration of the first contact phase of the sphere with the specimen surface, [ms] |
| E* | Young’s modulus, [kPa] |
| ER | Energy restitution, % |
| ER,average | Energy restitution calculated by the average model, % |
| ER,free | Energy restitution calculated by the free fall model, % |
| ER,hammer | Energy restitution calculated by the hammer model, % |
| F | Force, [N] |
| fn | Resonance frequency, [Hz] |
| g | g = 9.81 m∙s−2 |
| Gmax | Factor for calculating the peak acceleration, [g-units] |
| h | Initial height, [mm] |
| hmin | Depth of penetration of the sphere in the specimen, [mm] |
| K, k | Spring constant, [N∙mm−1] |
| kaverage | Spring constant calculated by the average model, [N∙mm−1] |
| kfree | Spring constant calculated by the free fall model, [N∙mm−1] |
| khammer | Spring constant calculated by the hammer model, [N∙mm−1] |
| l | Length of the rod, [mm] |
| ODE | Ordinary differential equations |
| pd | Deviation, % |
| rad | Radiant |
| T0,average | Time to first impact calculated by the average model, [ms] |
| T0,free | Time to first impact calculated by the free fall model, [ms] |
| T0,hammer | Time to first impact calculated by the hammer model, [ms] |
| T0 | Duration from release of the sphere to first impact, [s] |
| tP0 | Duration from first sphere-specimen contact phase to the extremum of acceleration, [ms] |
| v0 | Velocity at first impact of the sphere, [m∙s−1] |
| x | Height, [mm] |
| δ | Damping coefficient, [s−1] |
| ηair | Dynamic viscosity of air, [Pa∙s] |
| ρ | Density, [kg∙s−2] |
| φ | Angle, [rad] |
| ω | Angular frequency, [s−1] |
| ω0 | Characteristic frequency, [s−1] |
References
- Peham, C.; Schramel, J. Vorrichtung Zur Bestimmung Der Elastischen Eigenschaften Von Oberflächen Und Böden Und Verfahren Zum Betrieb Der Vorrichtung. EP 3 045 890 A1, 20 July 2016. [Google Scholar]
- Weimar, K.R.; Pichlbauer, B.; Guse, C.; Schramel, J.P.; Peham, C.; Drillich, M.; Iwersen, M. Evaluation of an Accelerometer-Based Device for Testing the Softness of Bedding Materials Used for Livestock. Sensors 2022, 22, 8912. [Google Scholar] [CrossRef] [PubMed]
- Graydon, R.; Northrop, A.J.; Martin, J.H.; Lucey, M.; Schramel, J.P.; Peham, C.; Roepstorff, L.; Sinclair, J.; Hobbs, S.J. The Development of a Standardized Protocol for Quantifying Equestrian Eventing Cross-Country Ground. Biomechanics 2023, 3, 343–361. [Google Scholar] [CrossRef]
- Hruza, J.; Peham, C. Objektive Messverfahren zur Bestimmung von Reitbodeneigenschaften und deren Einfluss auf den Bewegungsapparat des Pferdes—Ein Überblick. Wien. Tierarztl. Mon.—Vet. Med. Austria 2023, 110, 1–24. [Google Scholar]
- Thaler, M. Eignung eines Resilienztestgerätes zur Zerstörungsfreien Bestimmung der Zartheit von Fleisch. Diploma Thesis, University of Veterinary Medicine Vienna, Vienna, Austria, 2018. [Google Scholar]
- Virag, Y. Bestimmung der Konsistenz von Extrawurst und Kochschinken Mittels Kugel-Resilienztester. Diploma Thesis, University of Veterinary Medicine Vienna, Vienna, Austria, 2018. [Google Scholar]
- Biber, P. Vergleich Verschiedener Verfahren zur Festigkeits- und Texturprüfung bei Lebensmitteln. Diploma Thesis, University of Veterinary Medicine Vienna, Vienna, Austria, 2021. [Google Scholar]
- Tipler, P.A.; Mosca, G. Physik: Für Studierende Der Naturwissenschaften Und Technik, 9; Vollständig überarbeitete und Ergänzte Auflage; Springer Spektrum: Berlin/Heidelberg, Germany, 2024. [Google Scholar] [CrossRef]
- Lüdde, H.J.; Lechner, U. Geschwindigkeitsabhängige Kräfte. Available online: https://itp.uni-frankfurt.de/~luedde/Lecture/Mechanik/Intranet/ (accessed on 30 December 2024).
- Schuppar, B. Elementare Numerische Mathematik; Vieweg: Braunschweig/Wiesbaden, Germany, 1999; pp. 67–70. [Google Scholar]
- Koch, J.; Stämpfle, M. Mathematik Für Das Ingenieurstudium, 4th ed.; 4. Aktualisierte Auflage; Carl Hanser Verlag GmbH & Co. KG: Munich, Germany, 2018. [Google Scholar] [CrossRef]
- Burg, K.; Haf, H.; Wille, F.; Meister, A. Potenzreihenansätze und Anwendungen. In Höhere Mathematik Für Ingenieure; Vieweg+Teubner: Wiesbaden, Germany, 2009. [Google Scholar] [CrossRef]
- Clegg, B. An impact testing device for in situ base course evaluation. Aust. Road Res. Board Conf. Proc. 1976, 8, 1–8. [Google Scholar]
- Warner, K.F. Progress report of the mechanical test for tenderness of meat. J. Anim. Sci. 1929, 1929, 114–116. [Google Scholar] [CrossRef]
- Bratzler, L.J. Measuring the Tenderness of Meat by Means of a Mechanical Shear. Master’s Thesis, Kansas State College, Manhattan, KA, USA, 1932. [Google Scholar]
- Szczesniak, A.S.; Brandt, M.A.; Friedman, H.H. Development of standard rating scales for mechanical parameters of texture and correlation between objective ad sensory method of texture evaluation. J. Food Sci. 1963, 28, 397–403. [Google Scholar] [CrossRef]
- Peleg, M. The instrumental texture profile analysis revisited. J. Texture Stud. 2019, 50, 362–368. [Google Scholar] [CrossRef] [PubMed]
- Animasaun, L.; Muhammad, T.; Yook, S.-J. Exploration of Half-Cycle Length of Converging Circular Wavy Duct with Diverging-Outlet: Turbulent Water Dynamics. Adv. Theory Simul. 2025, 2500038. [Google Scholar] [CrossRef]


| Variable | Meaning | Physical Unit |
|---|---|---|
| T0 | Duration from release of the sphere to the first impact (=first free-flight/-fall phase) | [s] |
| d0 | Duration of the first contact phase of the sphere with the specimen surface | [ms] |
| tP0 | Duration from first sphere-specimen contact to the extremum of acceleration | [ms] |
| 2∙T1 | Duration of the second free-flight phase | [s] |
| Gmax | Factor for calculating the peak acceleration | [g-unit] |
| Variable | Meaning | Physical Unit |
|---|---|---|
| Initial height (calculated as the distance from the lowest point of the sphere to the specimen surface) | [mm] | |
| Velocity at first impact of the sphere | [m/s] | |
| Maximum penetration depth of the specimen at impact | [mm] | |
| Young’s modulus | [kPa] | |
| Spring constant | [N/mm] | |
| Energy restitution | % | |
| Resonance frequency | [Hz] |
| φ [Radiant] | φ [Degrees] | cos(φ) | Approx. cos(φ)→1 | |
|---|---|---|---|---|
| 0.1408 | 8.1 | 0.9901 | 1 | 1% |
| 0.1984 | 11.4 | 0.9804 | 1 | 2% |
| 0.3098 | 17.8 | 0.9524 | 1 | 5% |
| 0.4296 | 24.6 | 0.9091 | 1 | 10% |
| Measuring Height [mm] | Subject | Free Fall Model | Hammer Model | Average Model | Simulation with ODE45 |
|---|---|---|---|---|---|
| 25 ± 1 | Time T0 [ms] | 71.392 ± 1.4278 | 72.177 ± 1.5167 | 71.781 ± 1.4716 | 71.808 |
| Height x [mm] | 0 ± 0 | 0 ± 0 | 0 ± 0 | 0.00108 | |
| Velocity v0 [m/s] | −0.70036 ± 0.014007 | −0.69274 ± 0.015963 | −0.69656 ± 0.014979 | −0.70034 | |
| 50 ± 1 | Time T0 [ms] | 100.96 ± 1.0096 | 105.64 ± 1.3153 | 103.22 ± 1.153 | 103.41 |
| Height x [mm] | 0 ± 0 | 0 ± 0 | 0 ± 0 | 0.000379 | |
| Velocity v0 [m/s] | −0.99045 ± 0.009905 | −0.94665 ± 0.016427 | −0.9688 ± 0.013089 | −0.99045 | |
| 75 ± 1 | Time T0 [ms] | 123.65 ± 0.82437 | 137.79 ± 1.5585 | 130.15 ± 1.1373 | 130.9 |
| Height x [mm] | 0 ± 0 | 0 ± 0 | 0 ± 0 | 0.00143 | |
| Velocity v0 [m/s] | −1.2131 ± 0.008087 | −1.0886 ± 0.022424 | −1.1525 ± 0.014847 | −1.213 |
| Initial Height [mm] | T0,free [s] | T0,hammer [s] | T0,average [s] | T0,free:T0,hammer:T0,average * |
|---|---|---|---|---|
| 25 | 0.071393156 | 0.072176881 | 0.071781302 | 1:1.011:1.005 |
| 50 | 0.100963755 | 0.105636123 | 0.103220712 | 1:1.046:1.022 |
| 75 | 0.123654842 | 0.137789208 | 0.130149893 | 1:1.114:1.053 |
| Initial Height [mm] | * |
|---|---|
| 25 | 1:0.978:0.989 |
| 50 | 1:0.913:0.957 |
| 75 | 1:0.805:0.903 |
Disclaimer/Publisher’s Note: The statements, opinions and data contained in all publications are solely those of the individual author(s) and contributor(s) and not of MDPI and/or the editor(s). MDPI and/or the editor(s) disclaim responsibility for any injury to people or property resulting from any ideas, methods, instructions or products referred to in the content. |
© 2025 by the authors. Licensee MDPI, Basel, Switzerland. This article is an open access article distributed under the terms and conditions of the Creative Commons Attribution (CC BY) license (https://creativecommons.org/licenses/by/4.0/).
Share and Cite
Paulsen, H.; Peham, C.; Schramel, J.P.; Gföhler, M. Mathematical Framework for the Representation of the Travel of an Accelerometer-Based Texture Testing Device. Sensors 2025, 25, 3273. https://doi.org/10.3390/s25113273
Paulsen H, Peham C, Schramel JP, Gföhler M. Mathematical Framework for the Representation of the Travel of an Accelerometer-Based Texture Testing Device. Sensors. 2025; 25(11):3273. https://doi.org/10.3390/s25113273
Chicago/Turabian StylePaulsen, Harald, Christian Peham, Johannes Peter Schramel, and Margit Gföhler. 2025. "Mathematical Framework for the Representation of the Travel of an Accelerometer-Based Texture Testing Device" Sensors 25, no. 11: 3273. https://doi.org/10.3390/s25113273
APA StylePaulsen, H., Peham, C., Schramel, J. P., & Gföhler, M. (2025). Mathematical Framework for the Representation of the Travel of an Accelerometer-Based Texture Testing Device. Sensors, 25(11), 3273. https://doi.org/10.3390/s25113273