
A Digital Signal Processing-Based Multi-Channel Acoustic Emission Acquisition System with a Simplified Analog Front-End

Abstract
Highlights
- A simplified analog front-end circuit can effectively support multi-channel AE signal acquisition without compromising signal integrity.
- The proposed DSP-based system enables the real-time processing and accurate characterization of AE signals across all acquisition channels.
- The simplified analog front-end design lowers system cost and complexity, making multi-channel AE monitoring more accessible for industrial applications.
- The real-time DSP-based processing approach provides a scalable foundation for intelligent structural health monitoring systems.
Abstract
1. Introduction
2. System Design
2.1. Hardware Implementation
2.1.1. AE Sensors
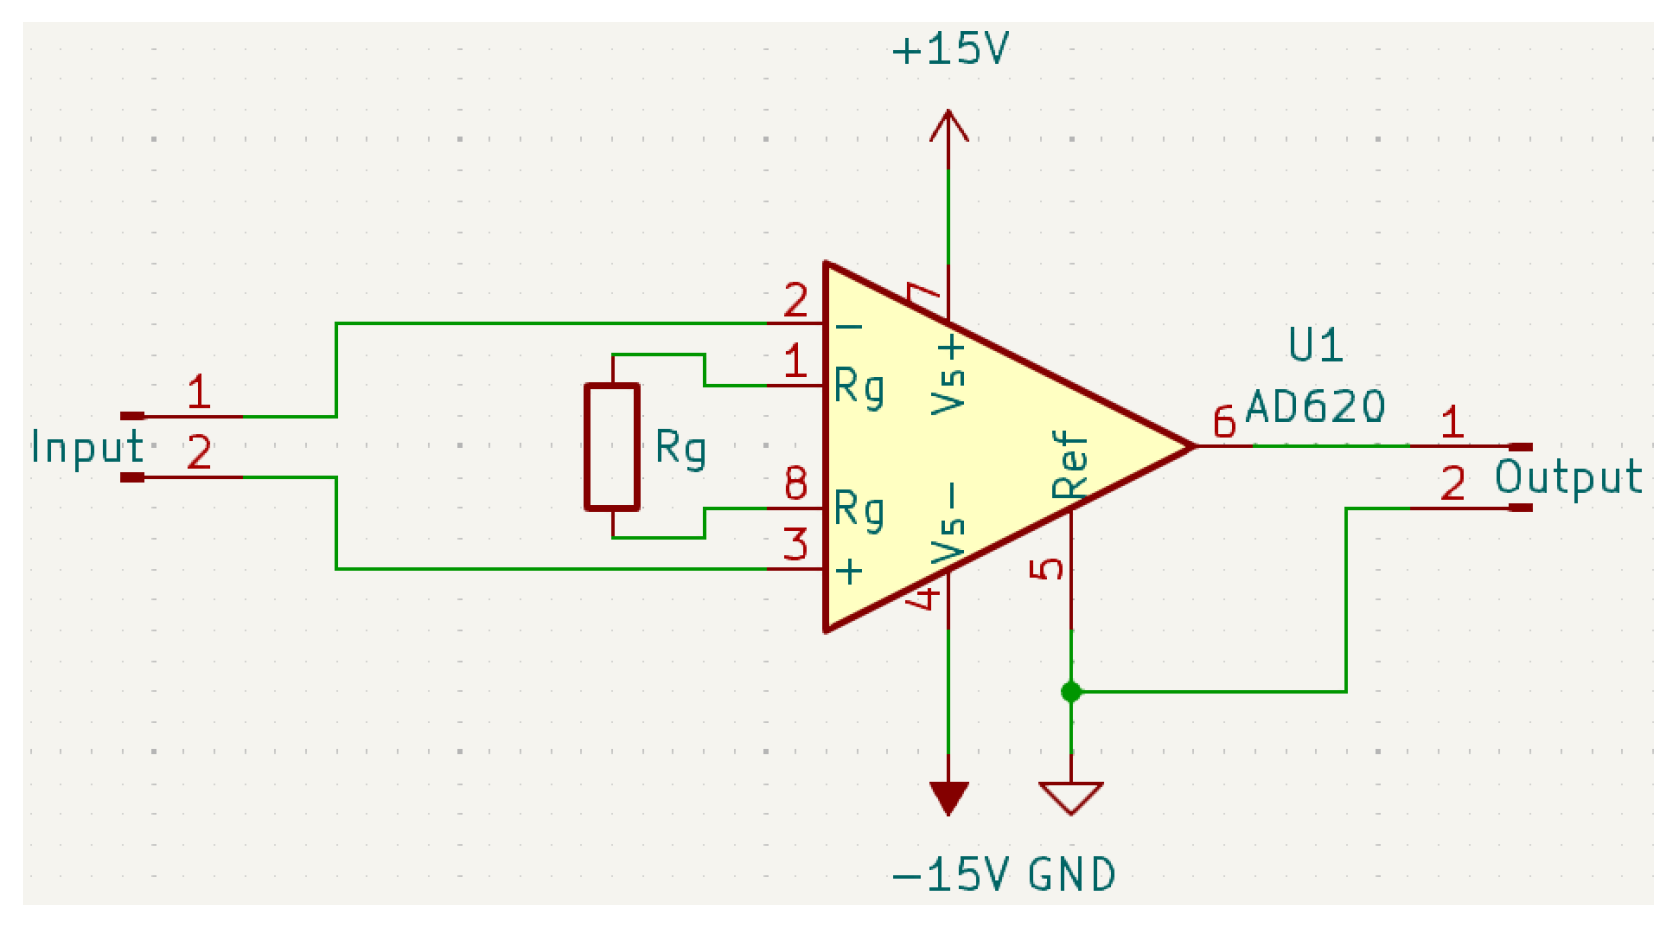
2.1.2. Preamplifier Stage
2.1.3. Core Data Acquisition and Synchronization
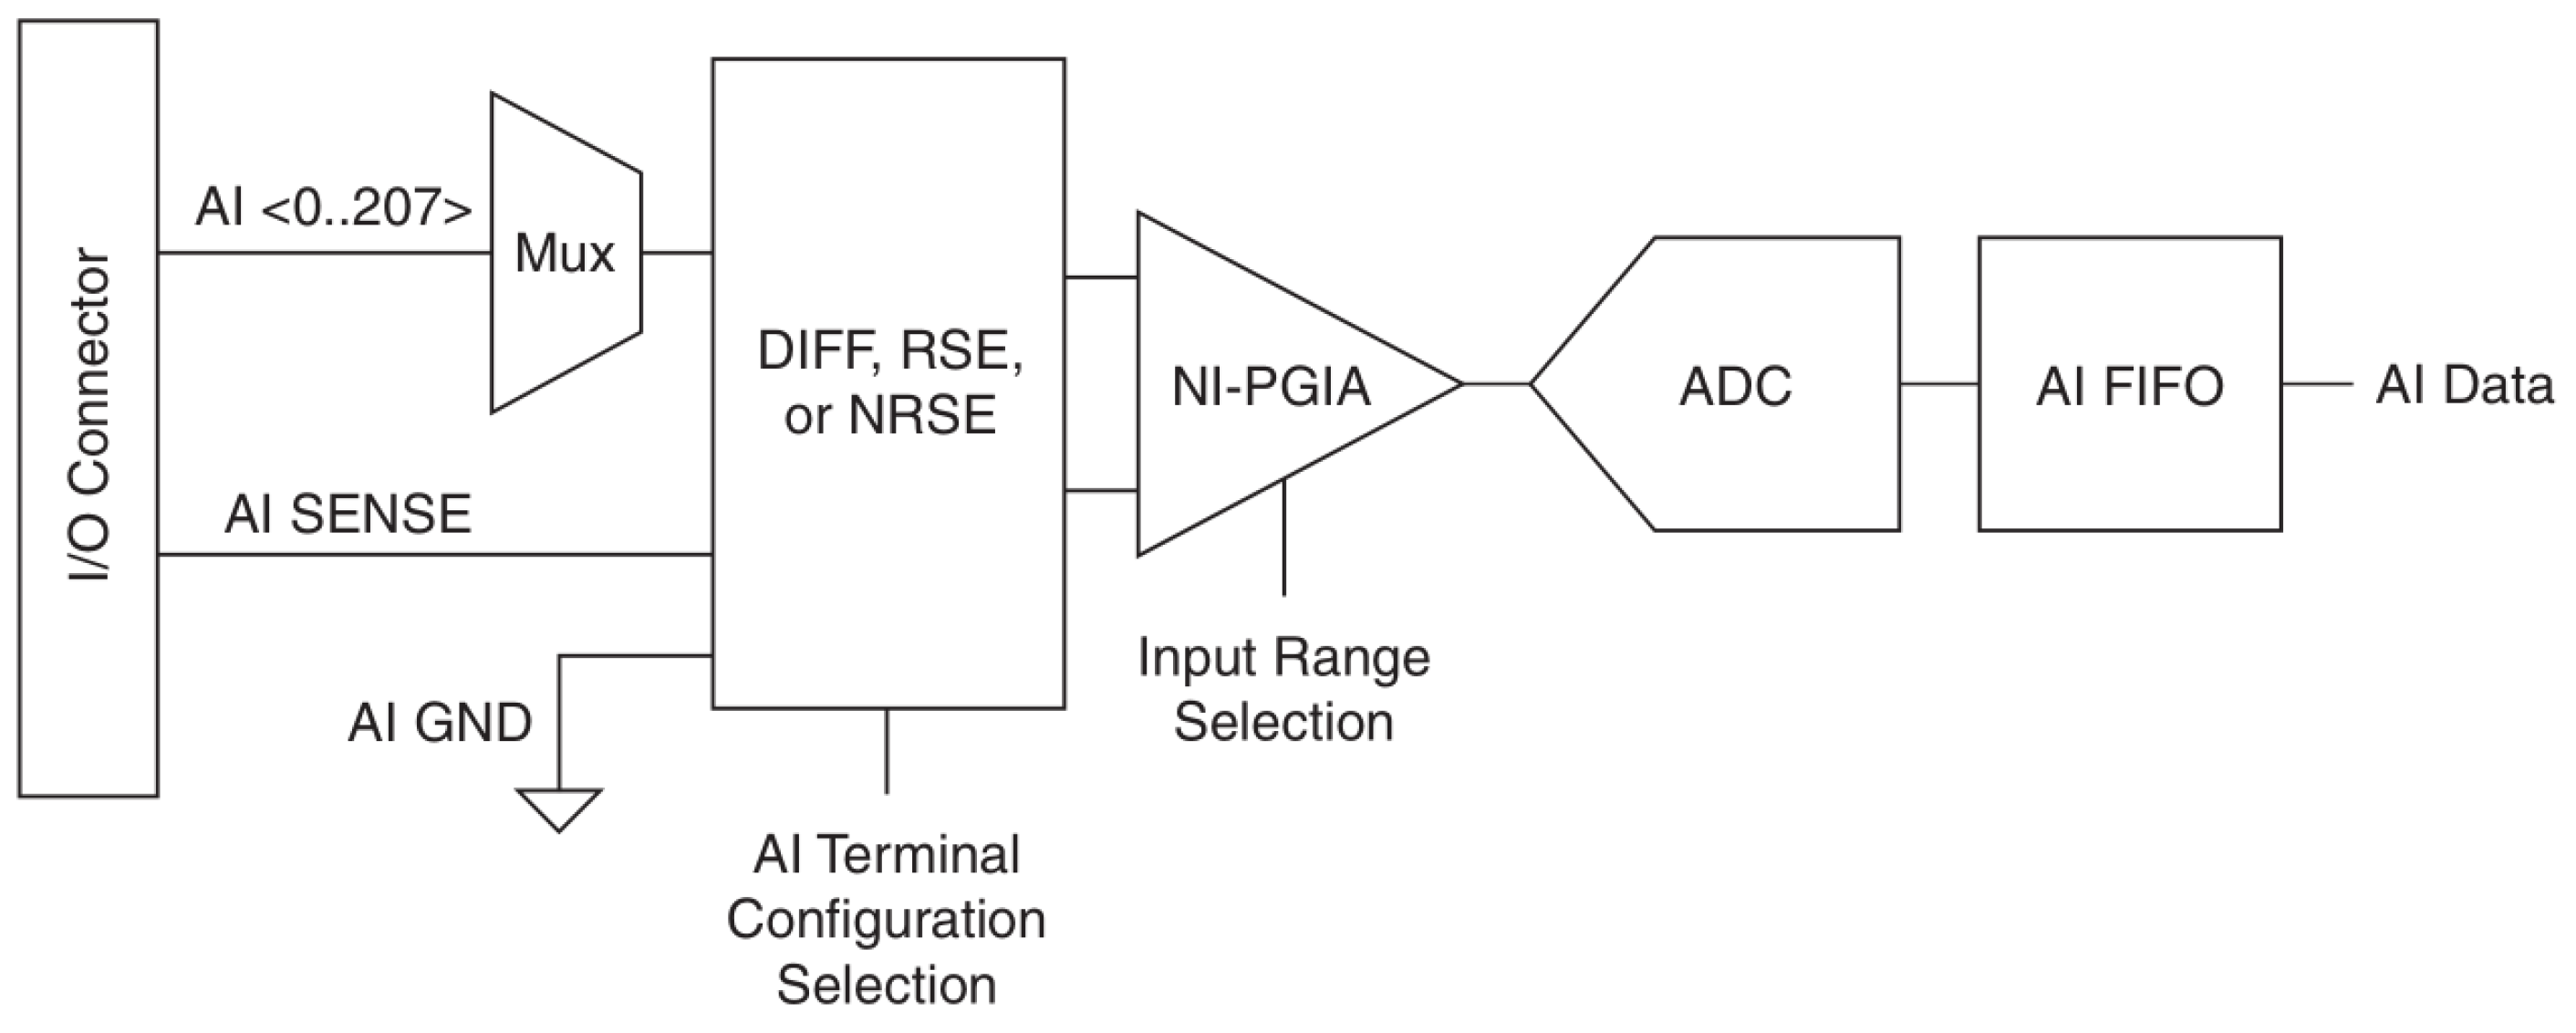
- High resolution and synchronous multi-channel capability: The 16-bit ADCs ensure accurate digitization. Critically, it supports simultaneous sampling across up to eight differential input channels, managed by the integrated NI-STC3 timing and synchronization technology. This built-in hardware synchronization ensures precise temporal correlation between channels, essential for AE analysis techniques like source localization [17].
- Sampling rate and anti-aliasing considerations: While the card supports a maximum sampling rate of up to 1.25 MS/s per channel, the primary AE validation experiments (Section 3.2) utilized 500 kS/s per channel. This rate was deliberately chosen as it sufficiently satisfies the Nyquist sampling theorem for the primary frequency range of the PLB AE signals observed (effectively capturing components up to 250 kHz), making the higher maximum rate unnecessary for these tests while aiding data management. It is important to note that the NI USB-6356 does not incorporate hardware anti-aliasing filters. Therefore, aliasing mitigation in this system relies on the combined effect of the RS-2A sensor’s limited nominal bandwidth (50 kHz–400 kHz), the bandwidth limitations of the AD620 preamplifier at the employed gain, and the fact that the dominant signal energy was well below the 250 kHz Nyquist frequency.
- Input impedance and interfacing: The NI USB-6356 features a very high input impedance (>100 GΩ||100 pF). This characteristic facilitates impedance bridging when connected to the low output impedance of the AD620 preamplifier (Section 2.1.2), ensuring minimal signal loading and accurate voltage transfer for digitization.
- Flexible input ranges: Software-selectable input ranges (±1 V to ±10 V) allow matching to the preamplifier output, optimizing the use of the ADC’s dynamic range.
2.1.4. Data Interface
2.2. Software Design
2.2.1. Core Architecture
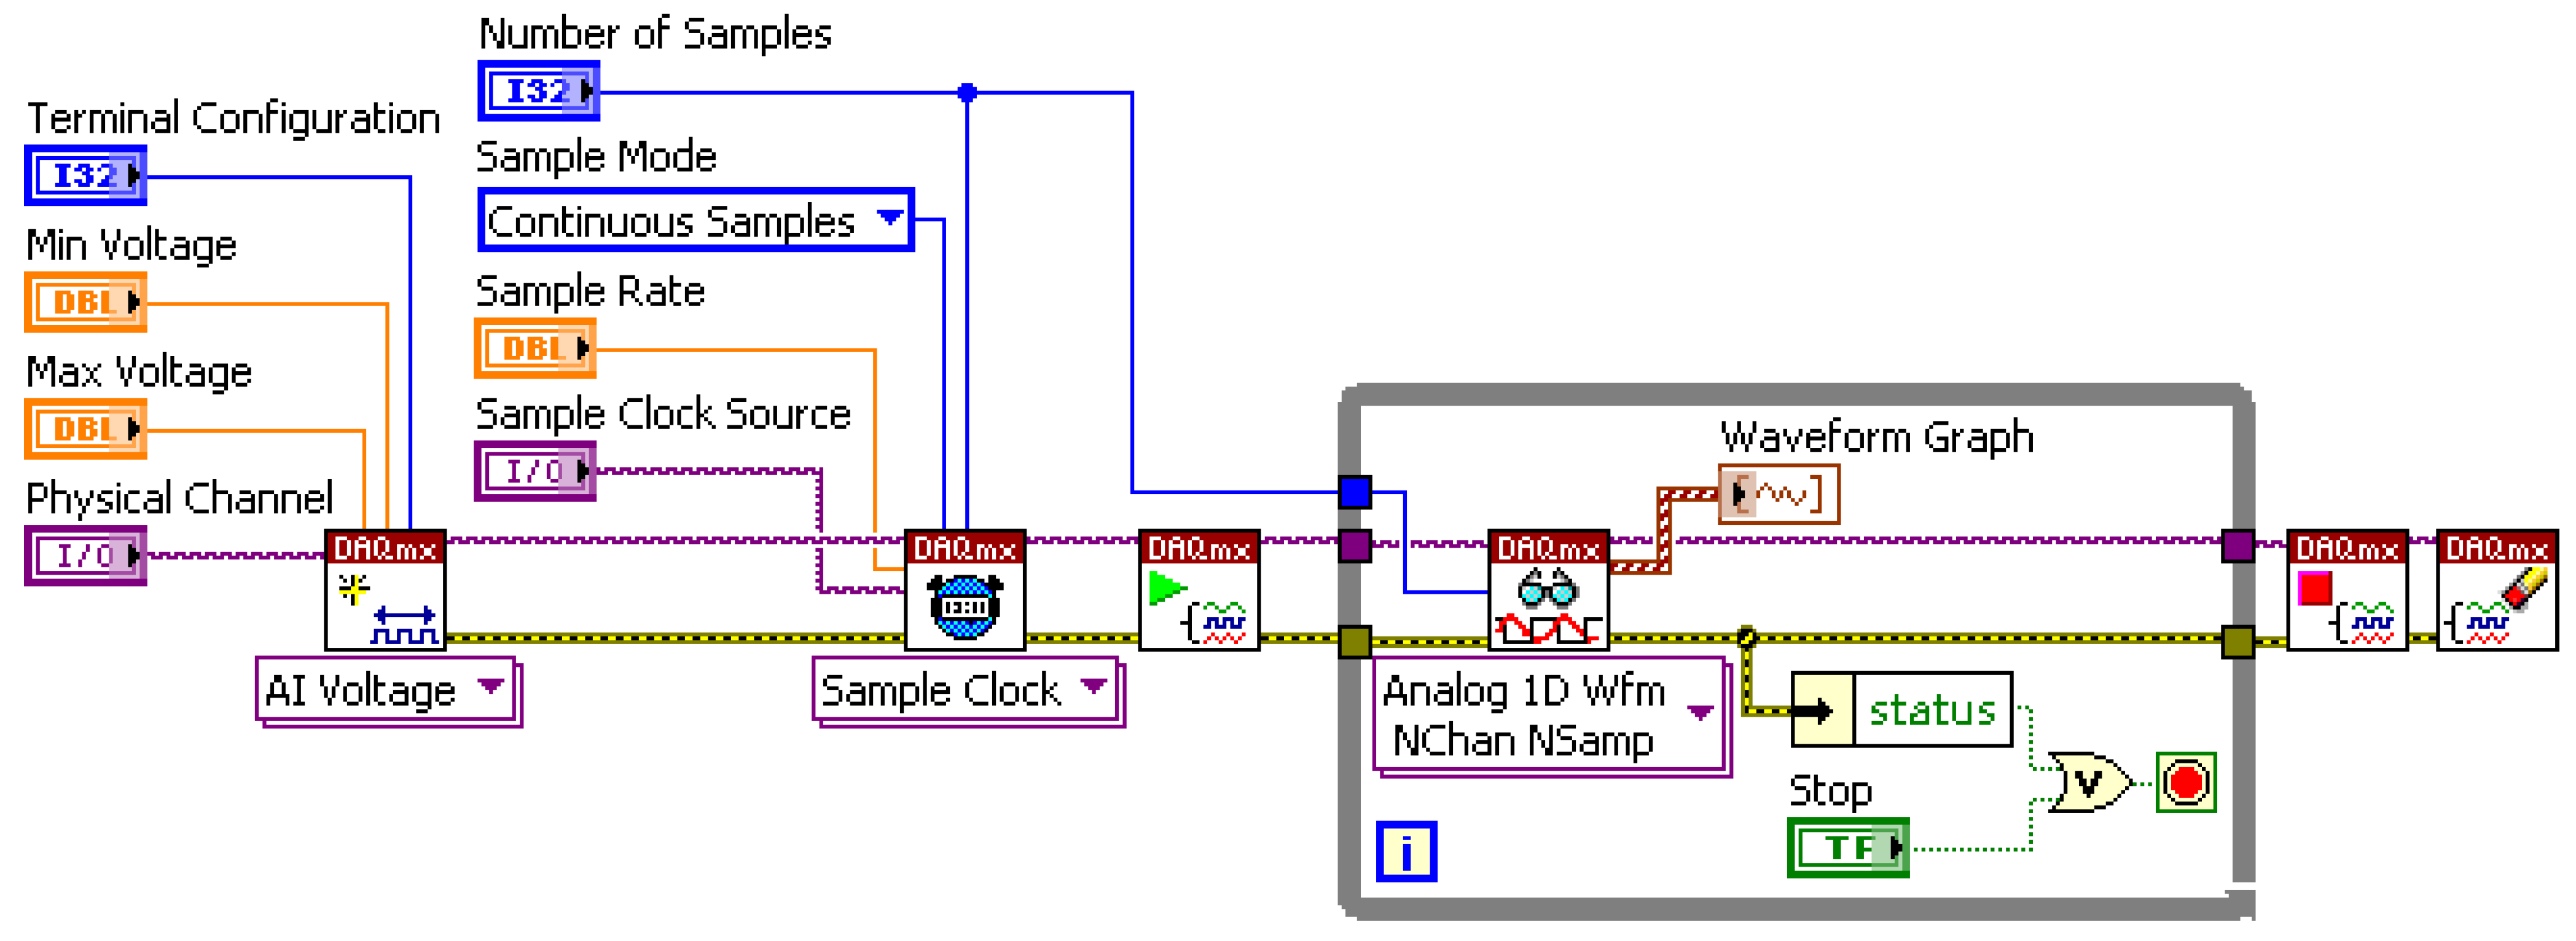
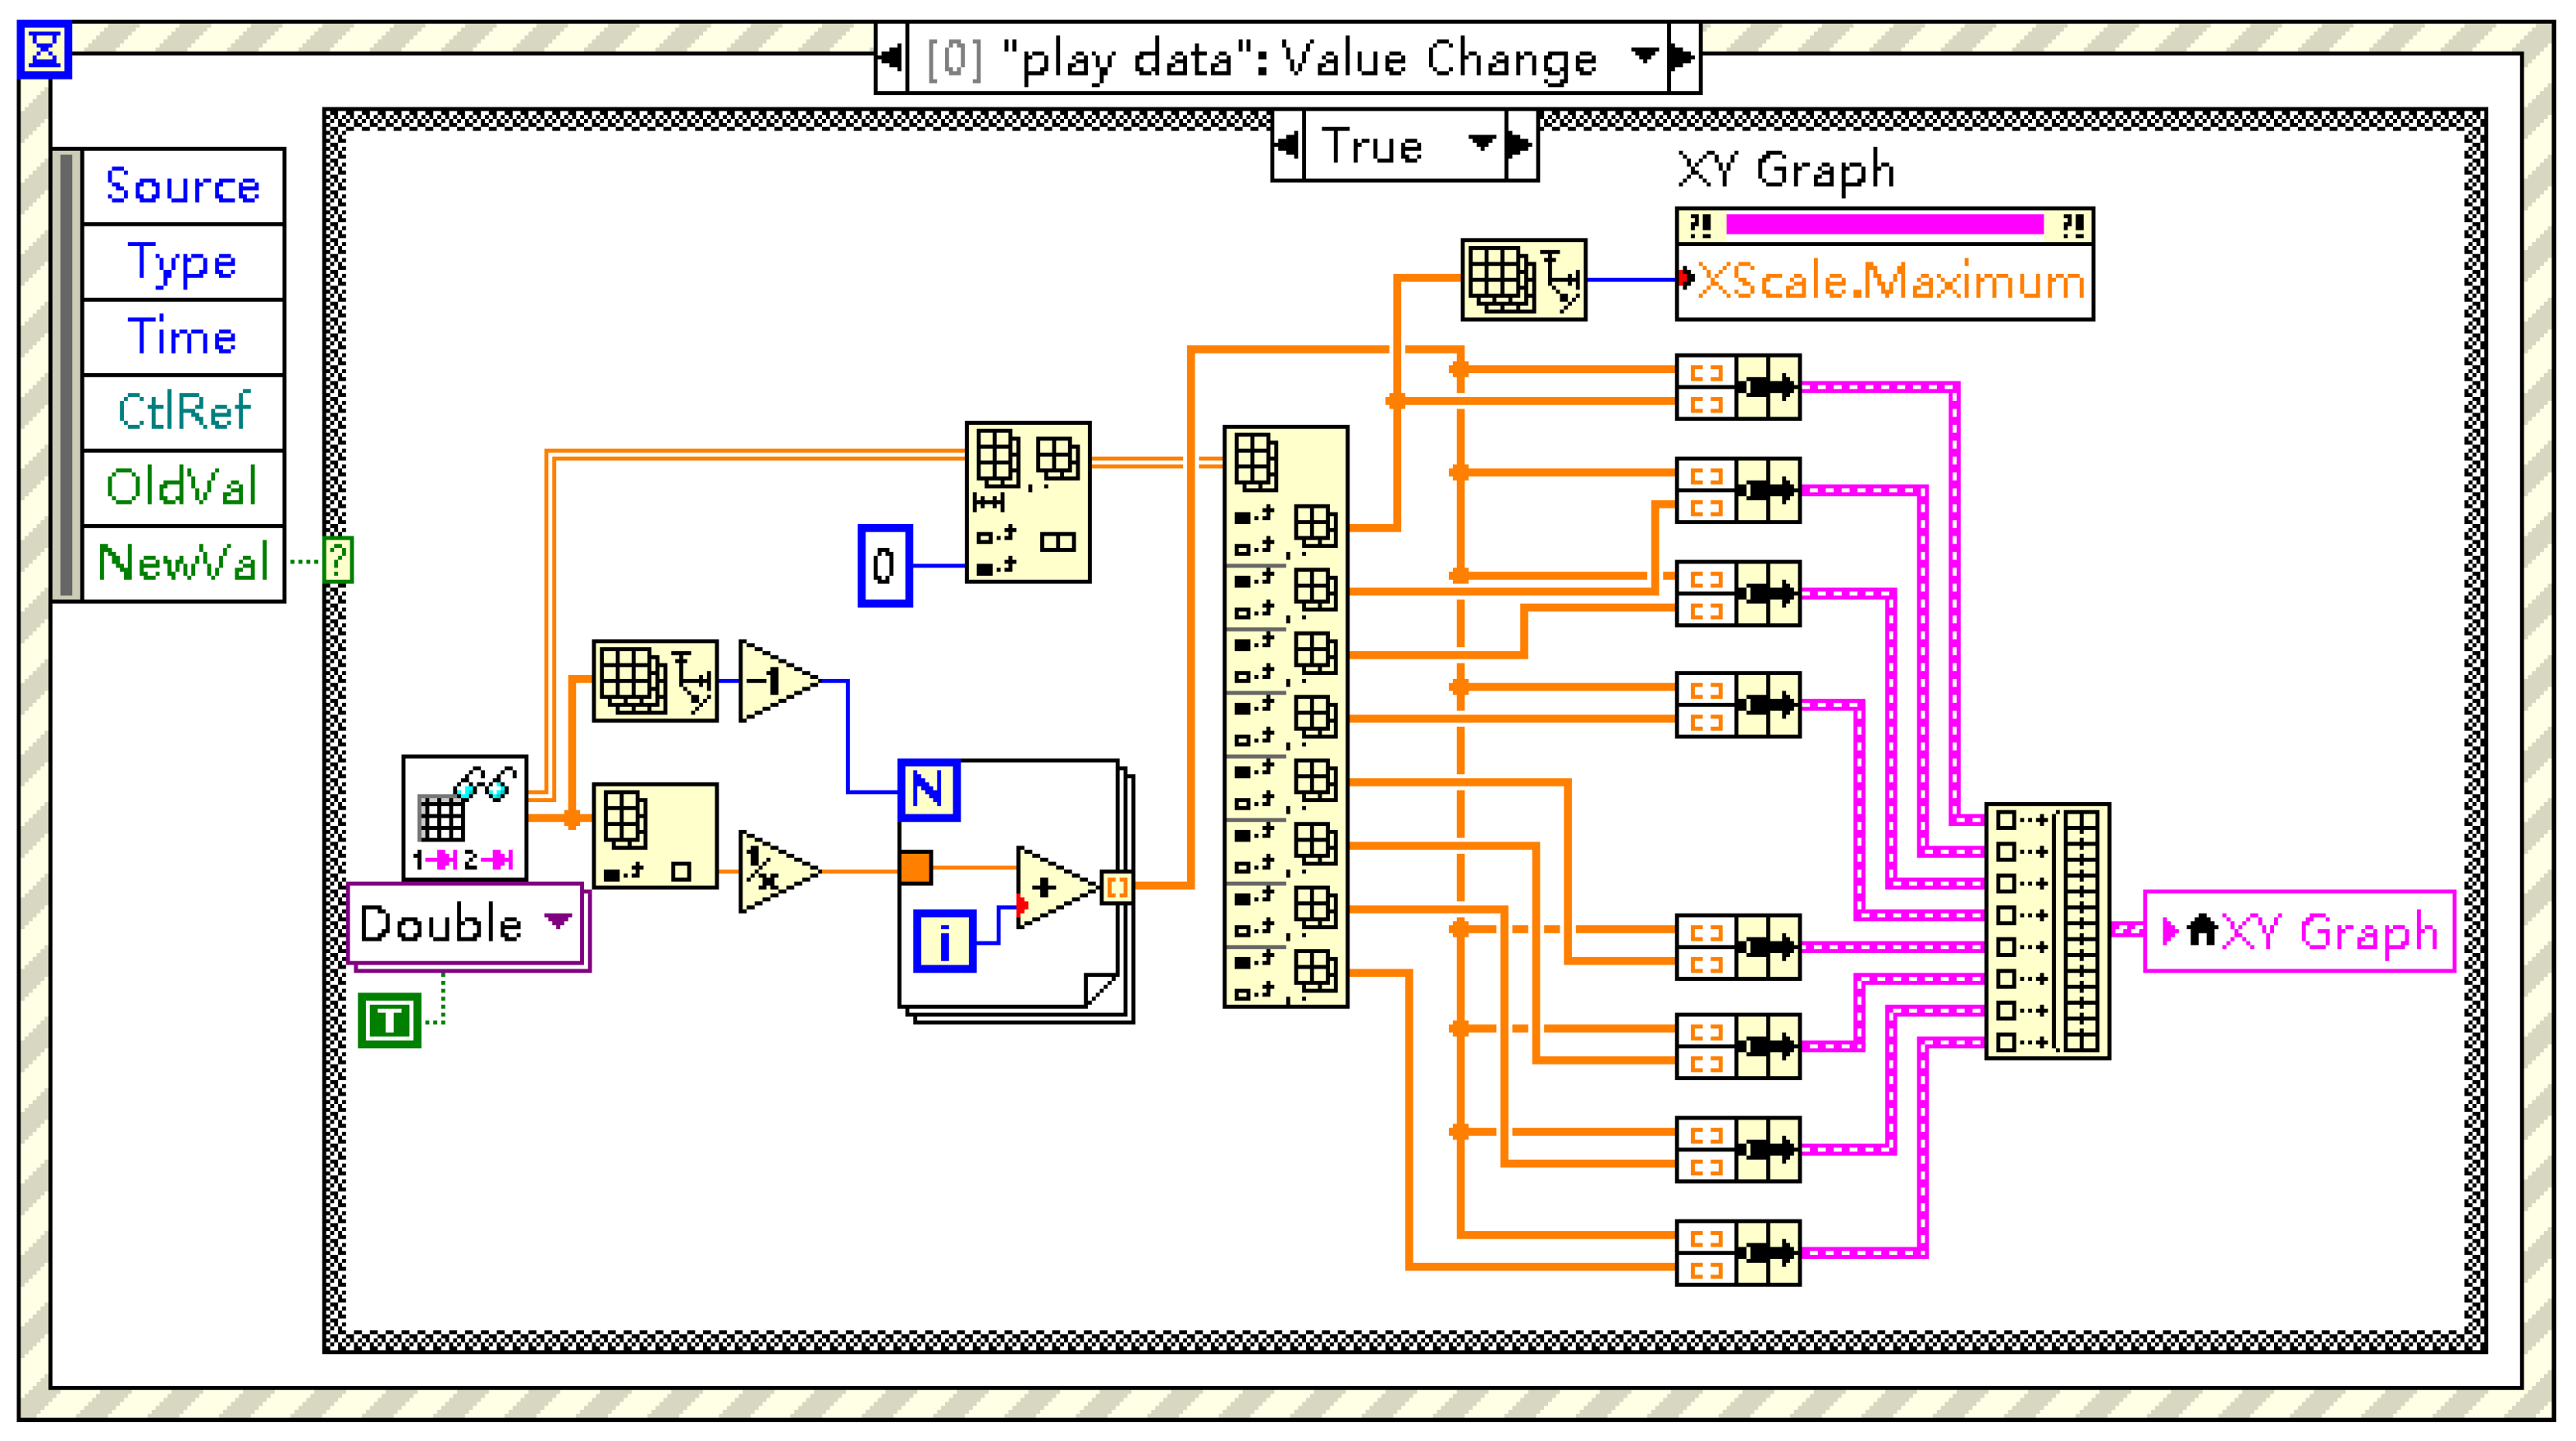
- DAQ Data Producer Loop: This loop interacts directly with the NI USB-6356 hardware via the NI DAQmx driver API (Figure 5) [19]. It handles device initialization and configuration (channels, sampling rate, range, hardware triggering) and continuously fetches acquired data blocks from the DAQ card’s buffer, placing them into a robust queue for consumption by other loops.
- DAQ Data Consumer Loop(s): One or more consumer loops retrieve data blocks from the queue. This is where core signal processing occurs, most importantly, the digital filtering (detailed below) but also potentially real-time feature extraction (e.g., amplitude, RMS), FFT-based spectral analysis (Power Spectrum, PSD), and preparation for visualization.
- Interface Event Response Loop: Handles all user interactions via the GUI (button presses and parameter changes), ensuring the system responds promptly to user commands without interrupting data flow.
- Data Storage Loop: Dedicated loop for writing raw or processed data to disk in selected formats (e.g., TDMS) for offline analysis and archival, ensuring data integrity even during high-throughput acquisition.
2.2.2. Software-Defined Digital Filtering
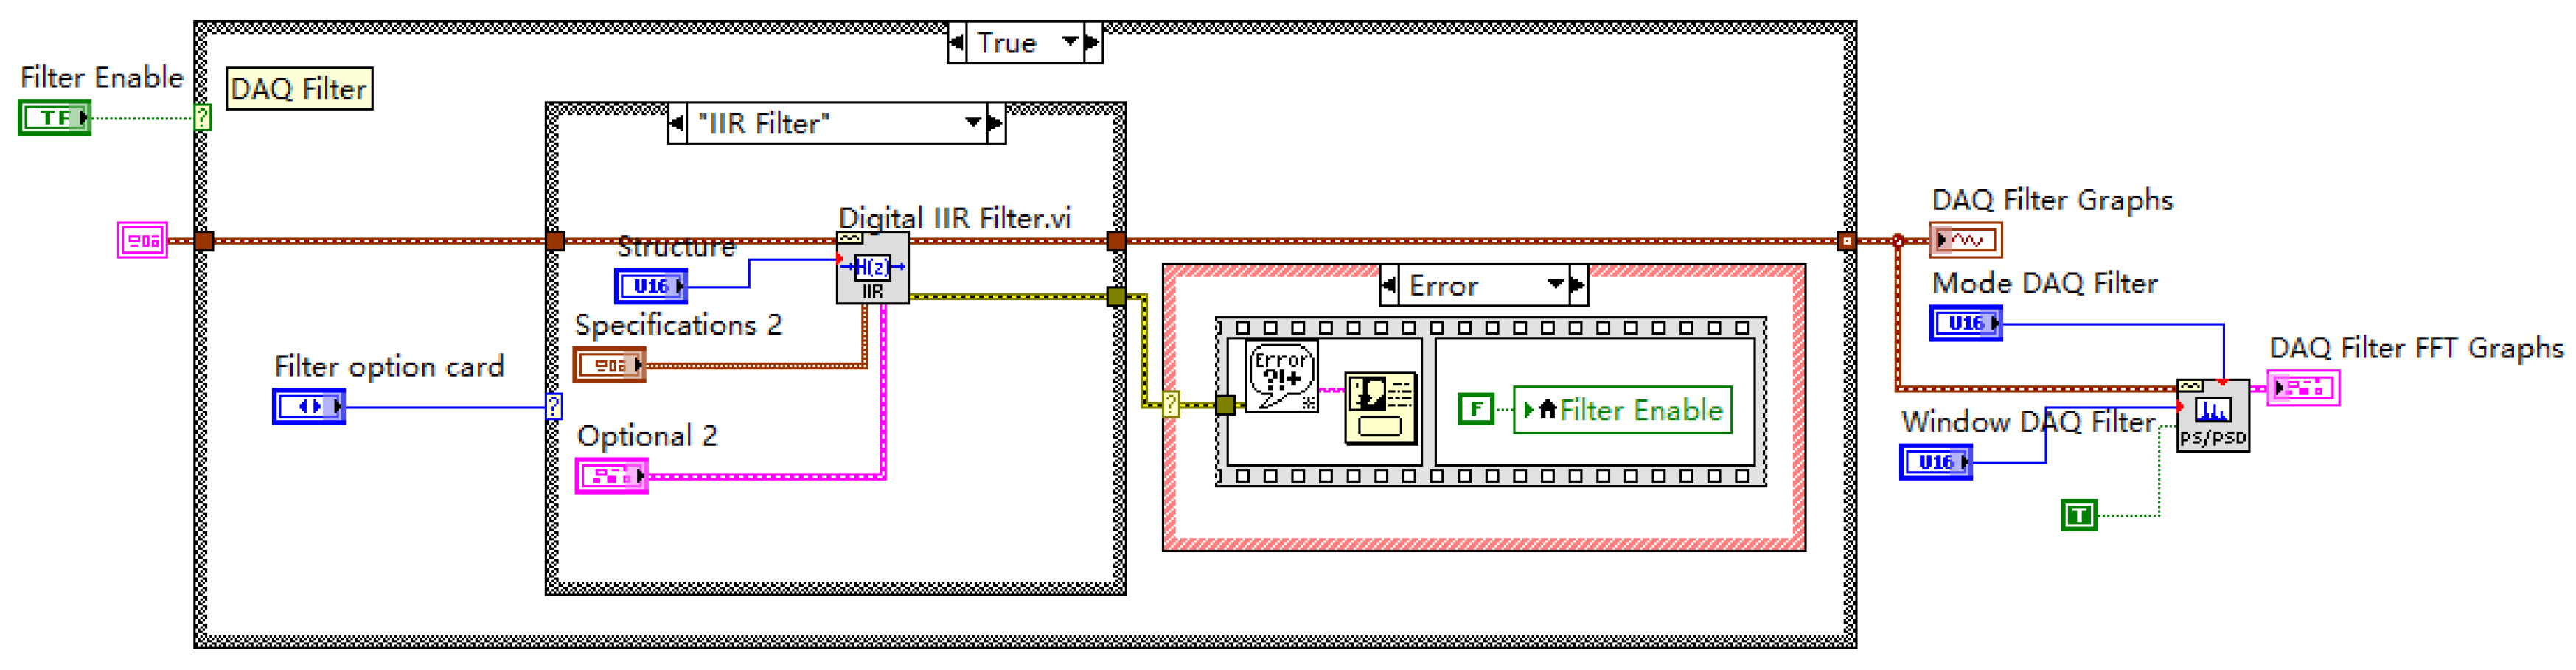
- A cornerstone of our simplified AFE approach is the implementation of band-pass filtering entirely within the LabVIEW software (typically executed in the DAQ Data Consumer Loop, Figure 6). This replaces inflexible hardware filters, offering significant advantages:
- Dynamic parameter adjustment: Filter characteristics (e.g., filter type, order, cutoff frequencies) can be easily modified through the GUI without any hardware changes, allowing rapid adaptation to different AE sources, materials, or noise environments. Users can select standard filter types like Butterworth, Chebyshev, etc. (e.g., 4th-order Butterworth used in validation tests).
- Real-time or post-processing: The filtering can be applied either in real-time to the incoming data stream (for immediate visualization or triggering) or applied/re-applied during the post-processing of the stored raw data, providing maximum analytical flexibility.
- Simplified hardware: Eliminates the need for complex analog filter circuits in the AFE.
2.2.3. System Control and User Interface (GUI)
- Function Control: Start/stop acquisition, save data, playback, screenshot, and status indicators.
- Acquisition Parameter Settings: Interactive configuration of channels, input ranges, sampling rate, acquisition duration/samples per channel, and trigger settings via the DAQmx API.
- Data Display: Real-time visualization of time-domain waveforms, frequency spectra (FFT), and key calculated parameters (e.g., RMS and peak amplitude), including interactive cursor measurements for quick analysis.
3. System Performance Validation
3.1. Basic Performance Indicator Testing
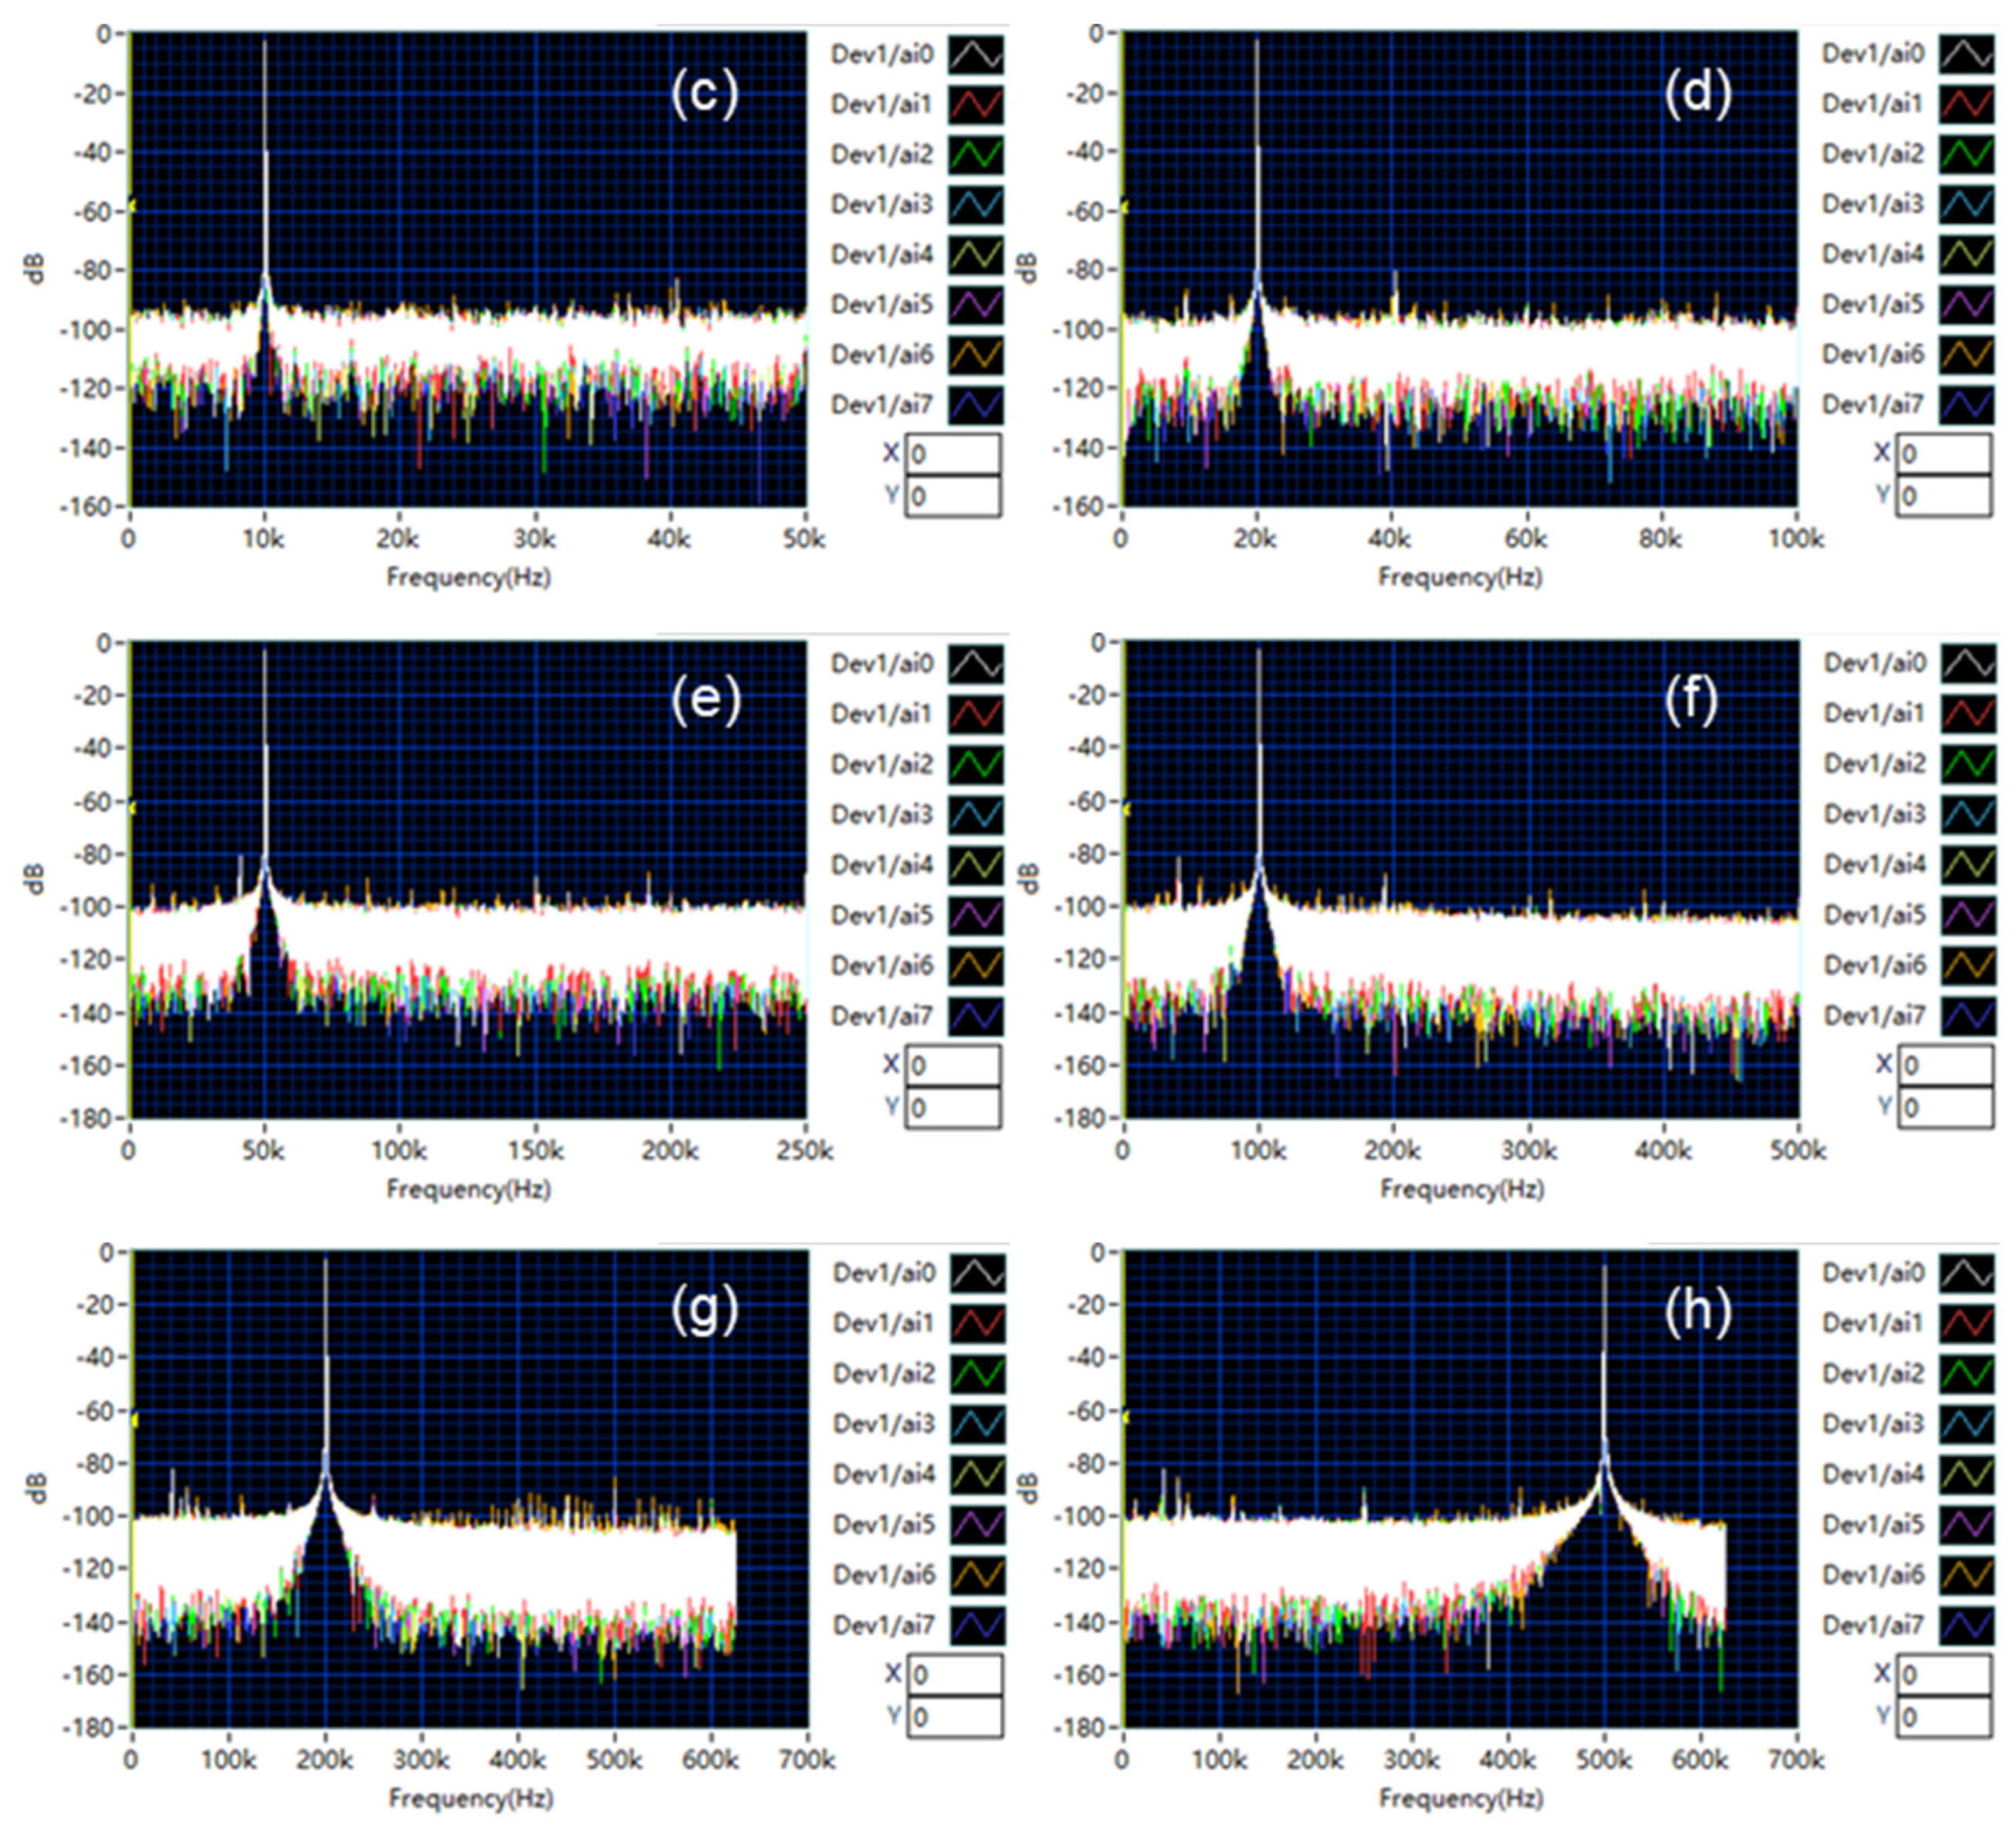
3.1.1. Sampling Rate and Frequency Accuracy
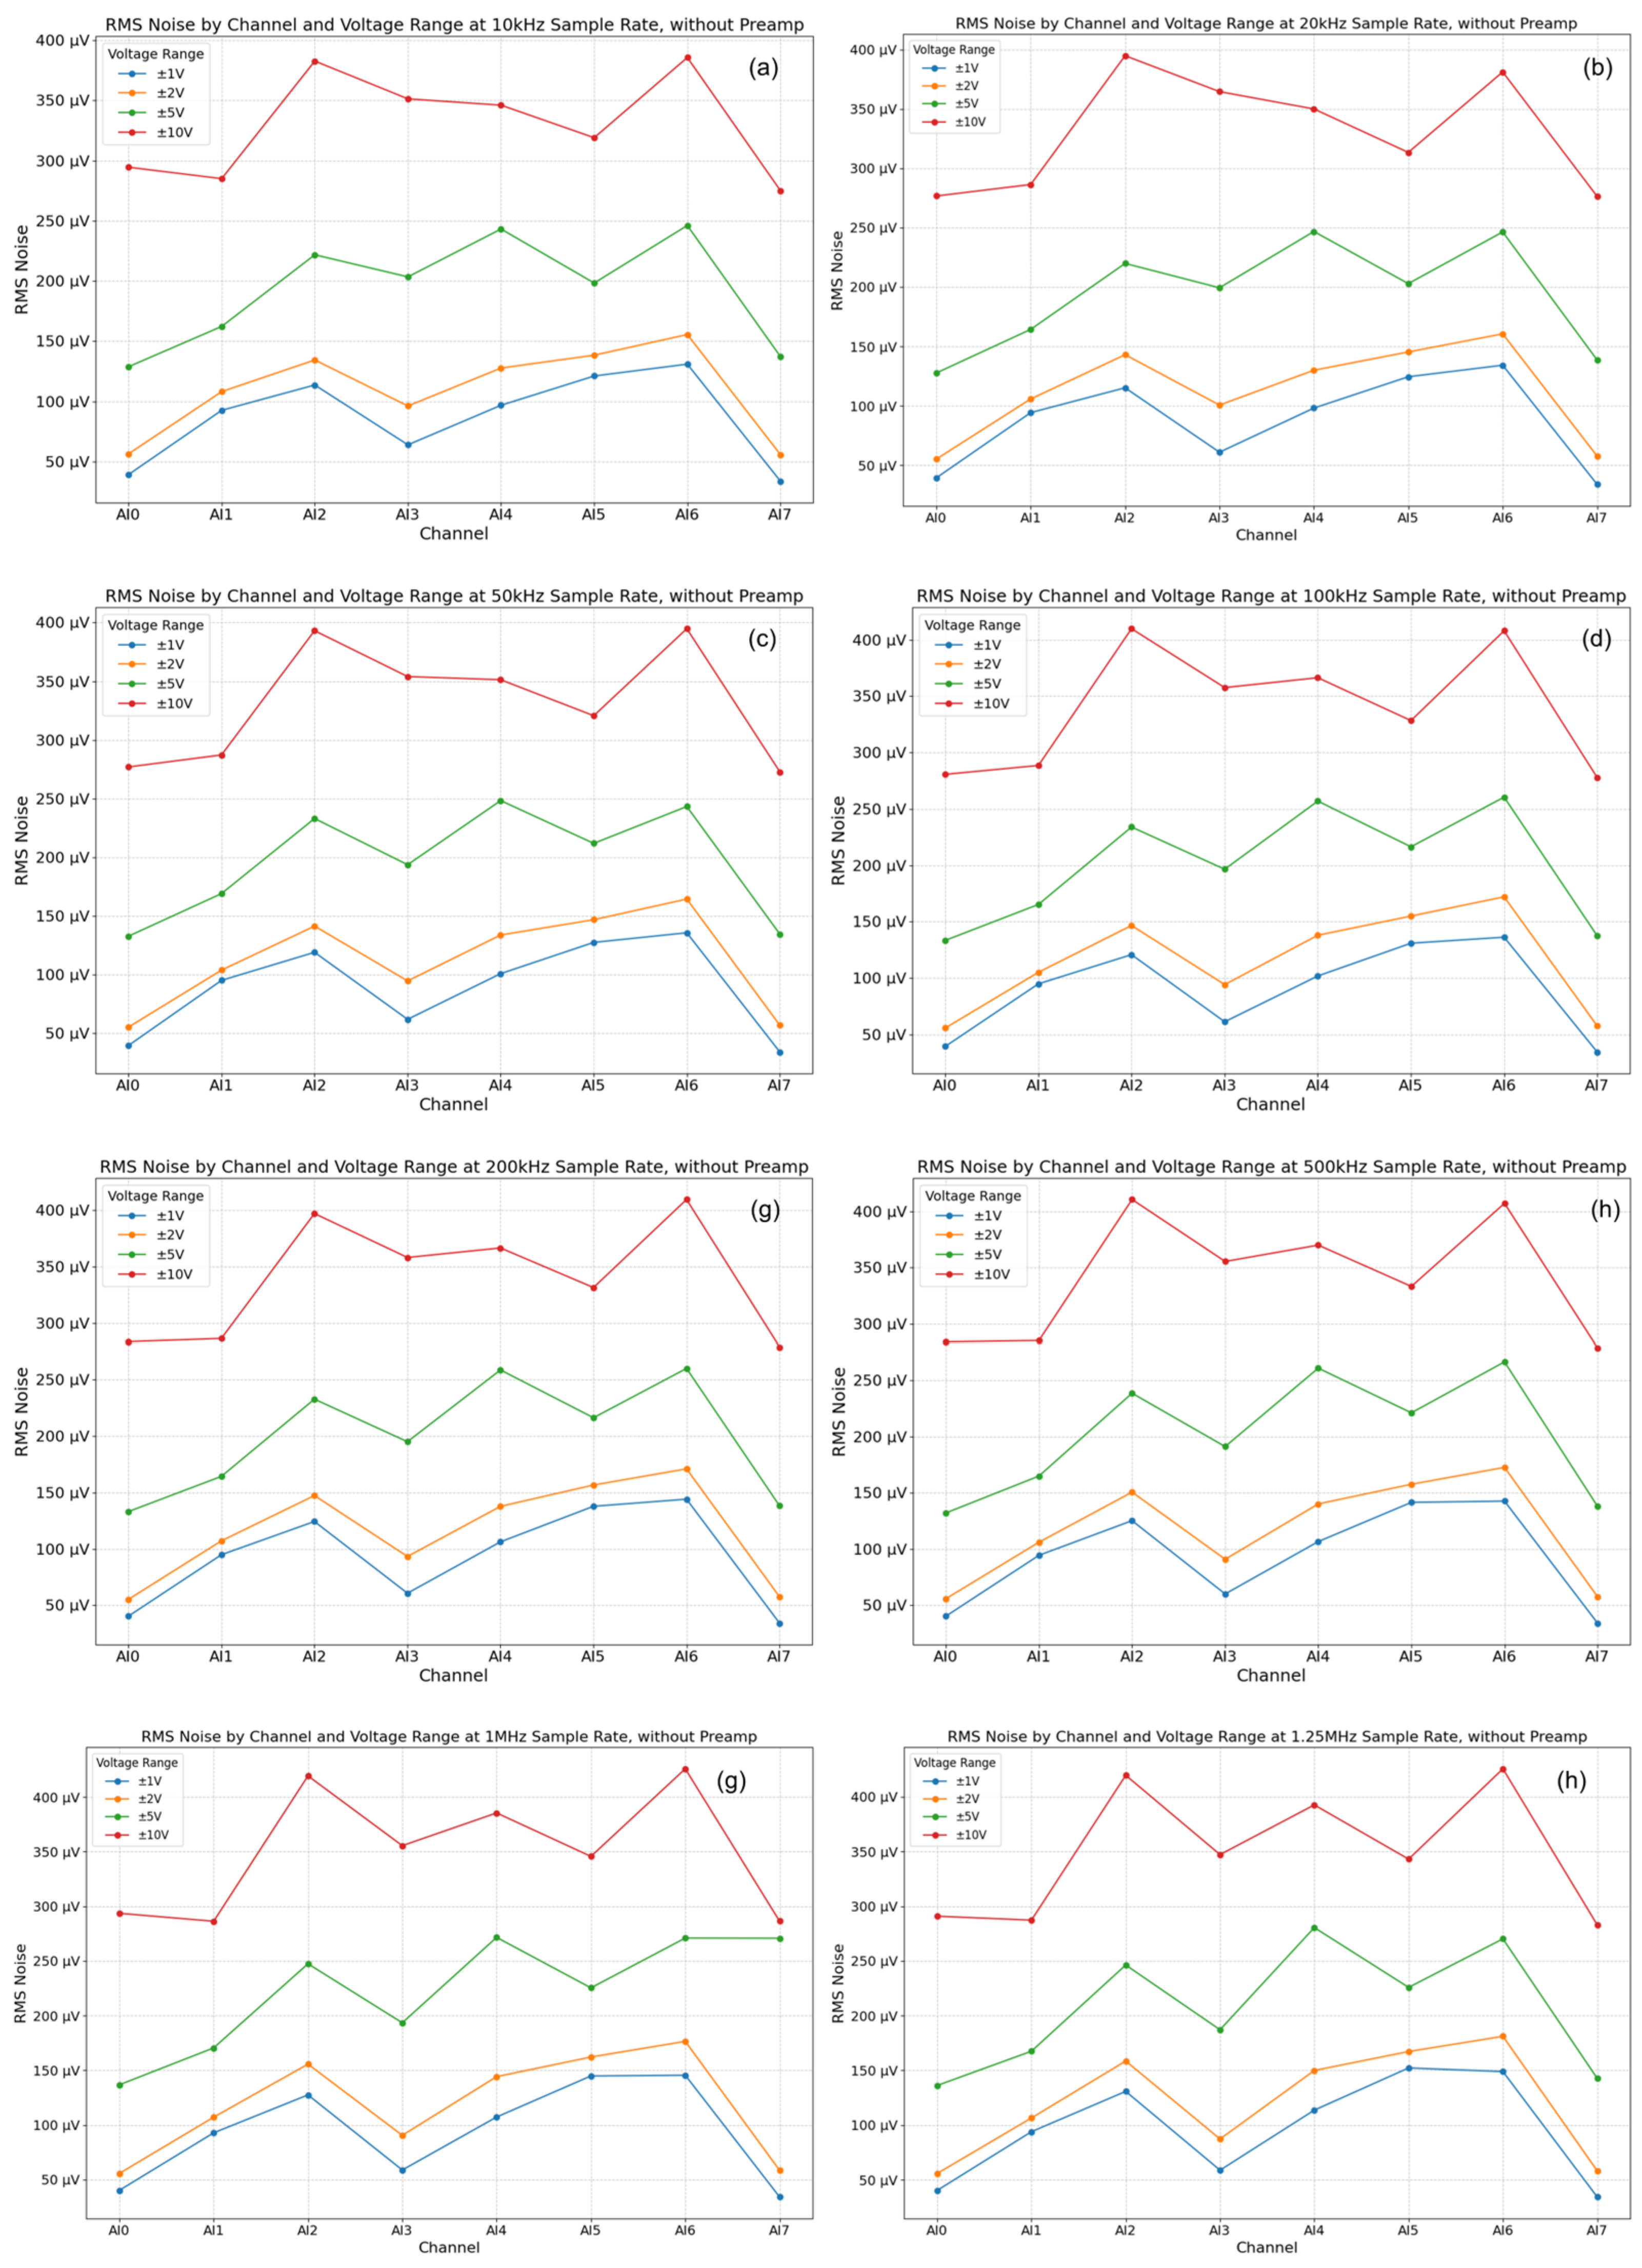
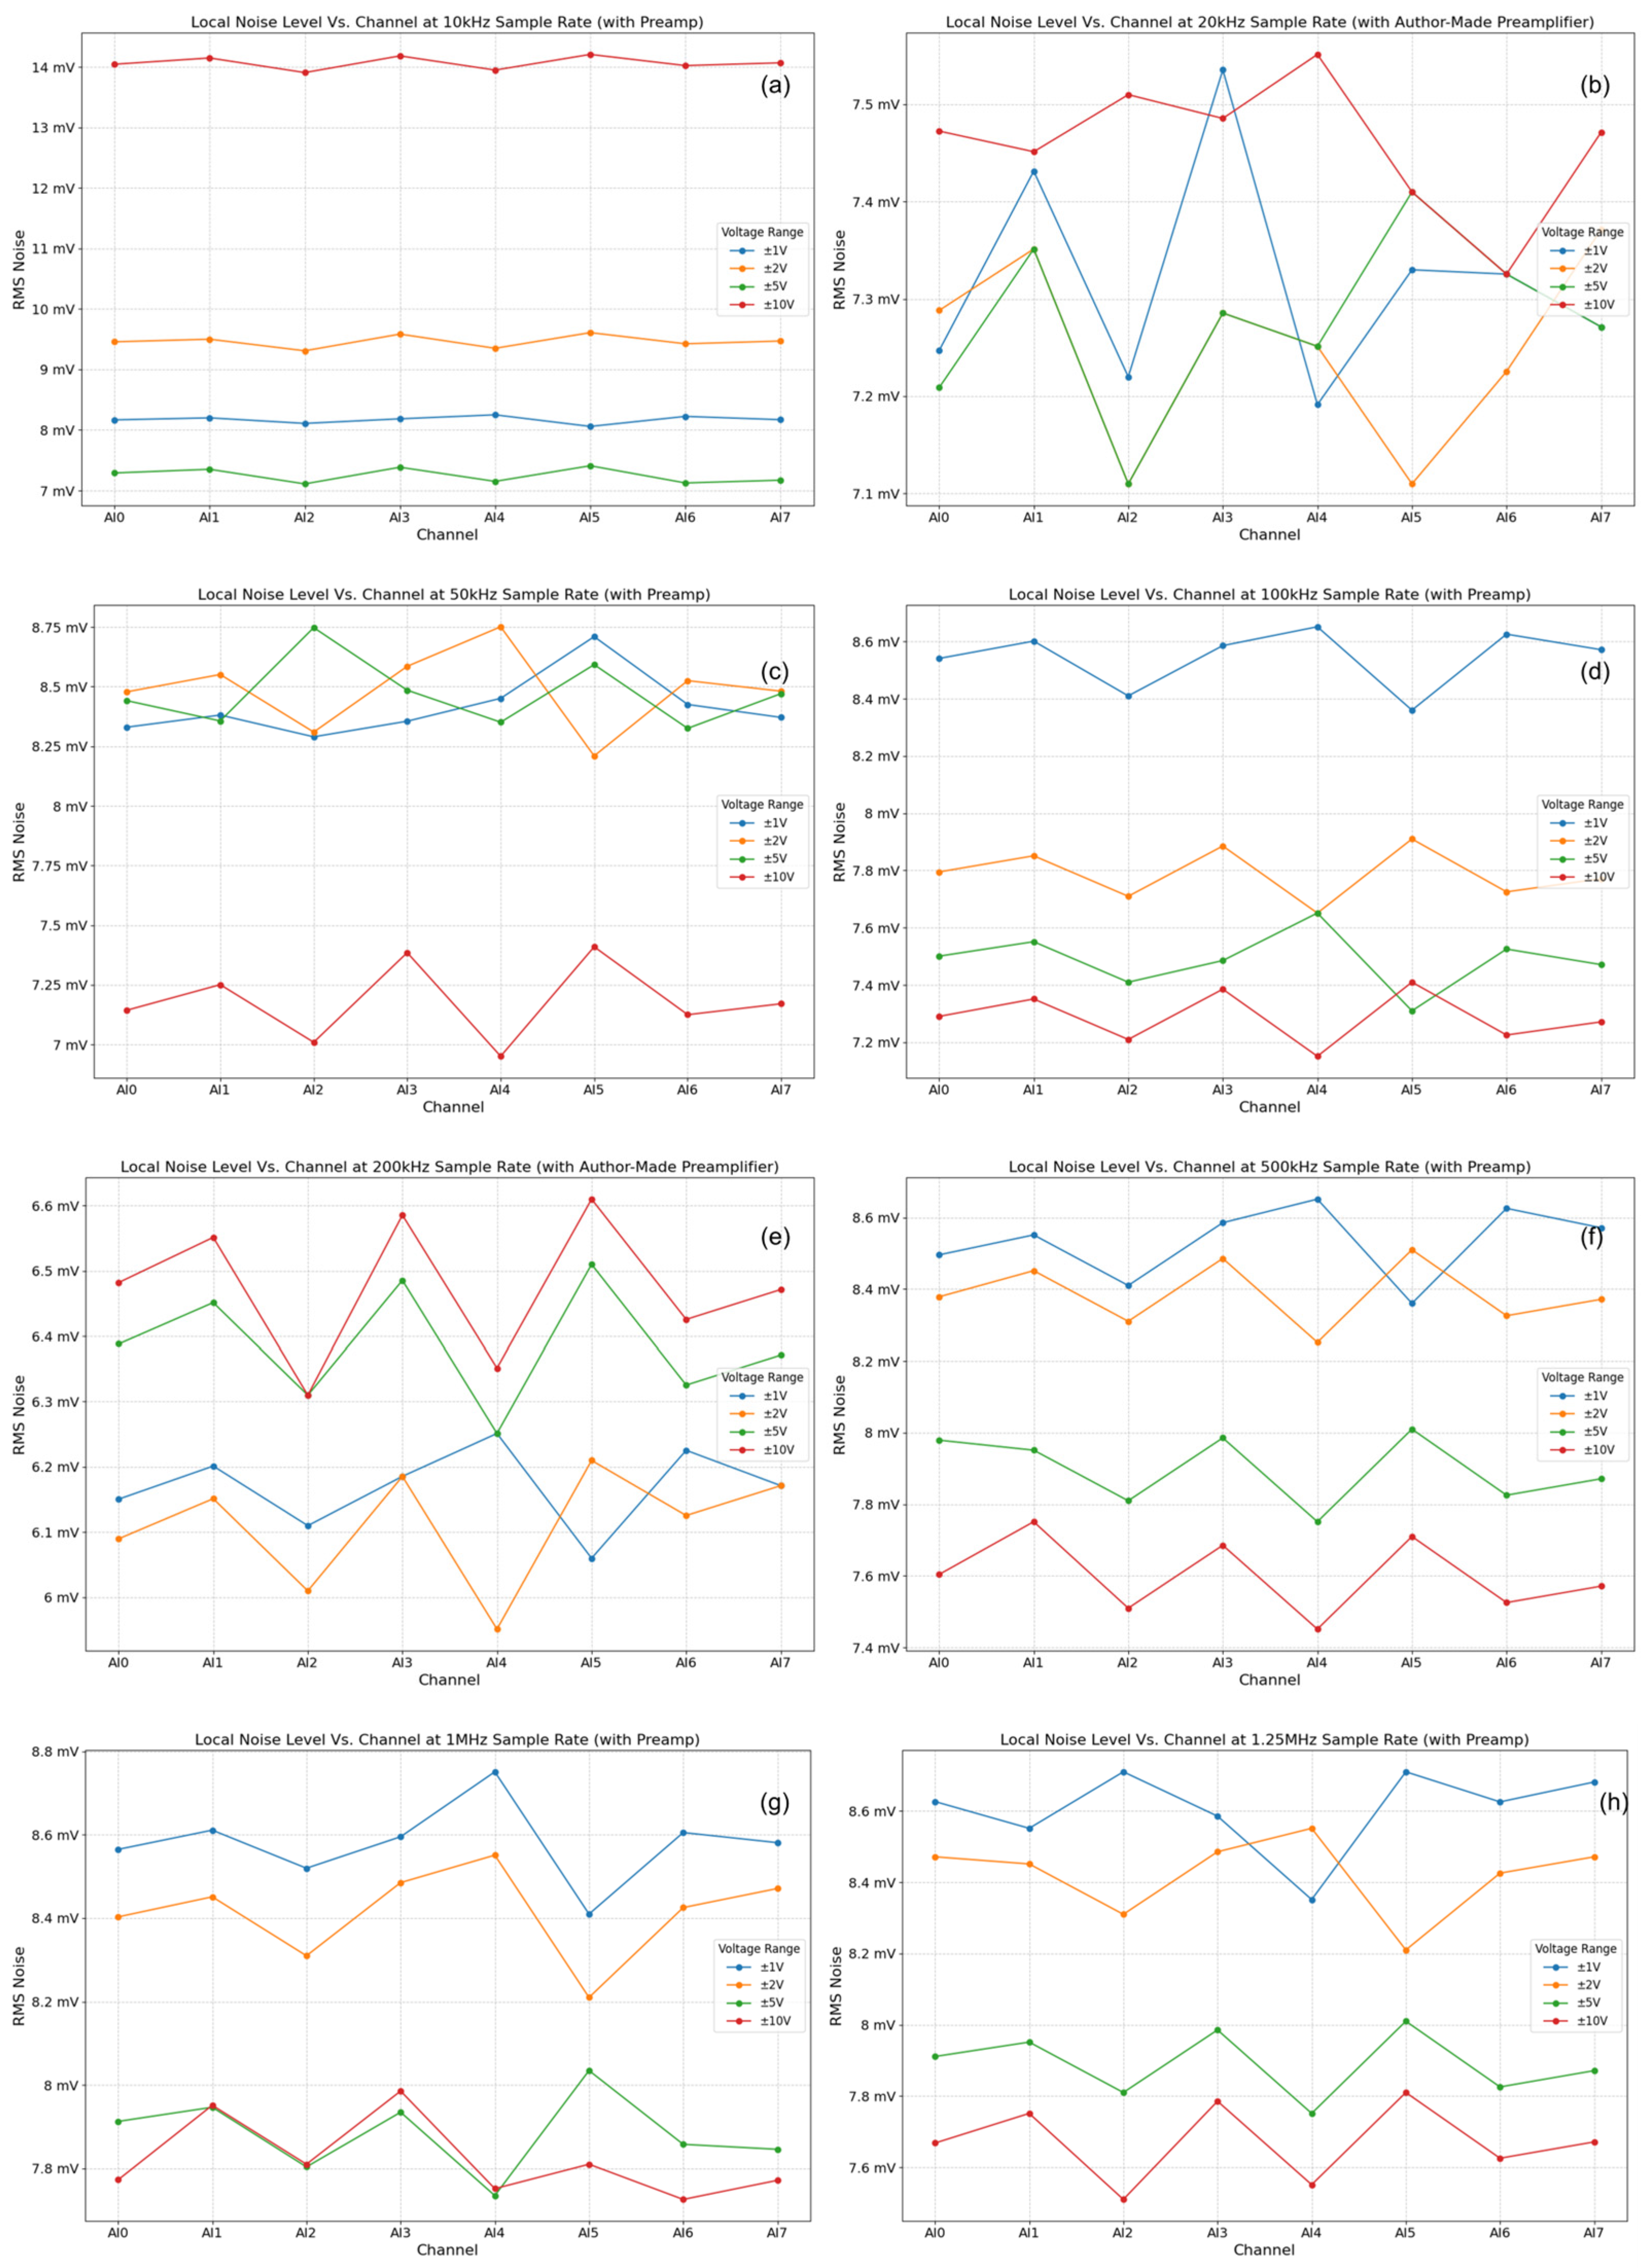
3.1.2. Noise Characterization
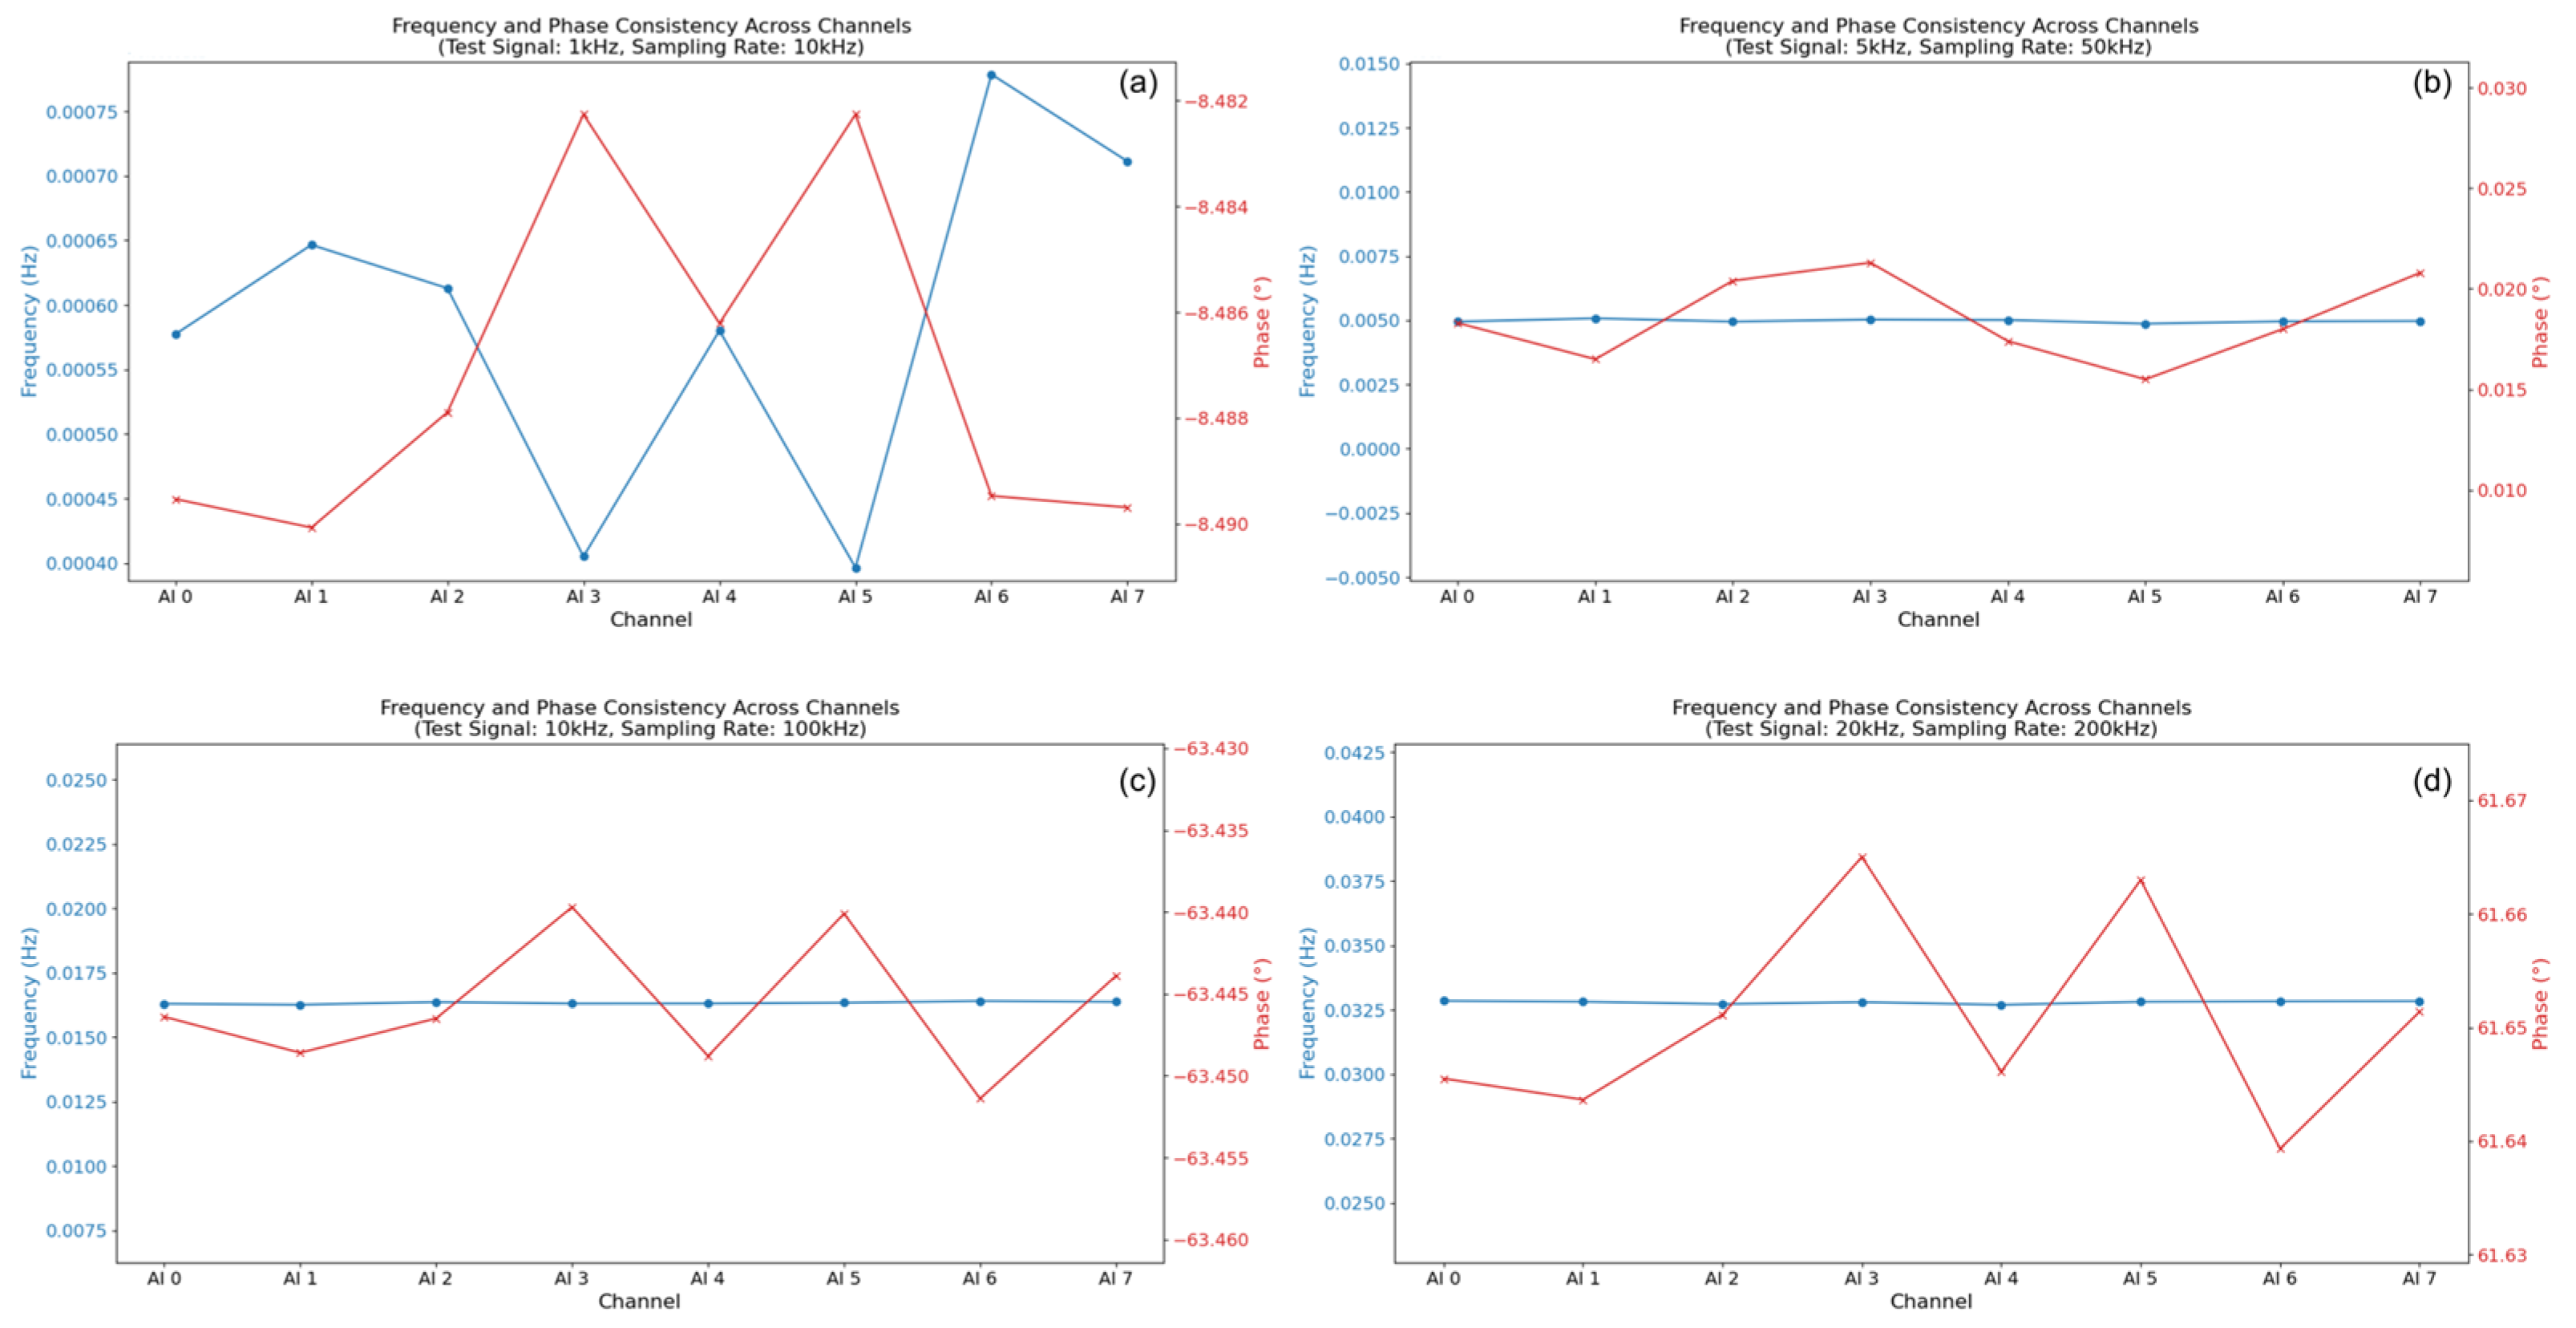
3.1.3. Inter-Channel Consistency: Frequency and Phase
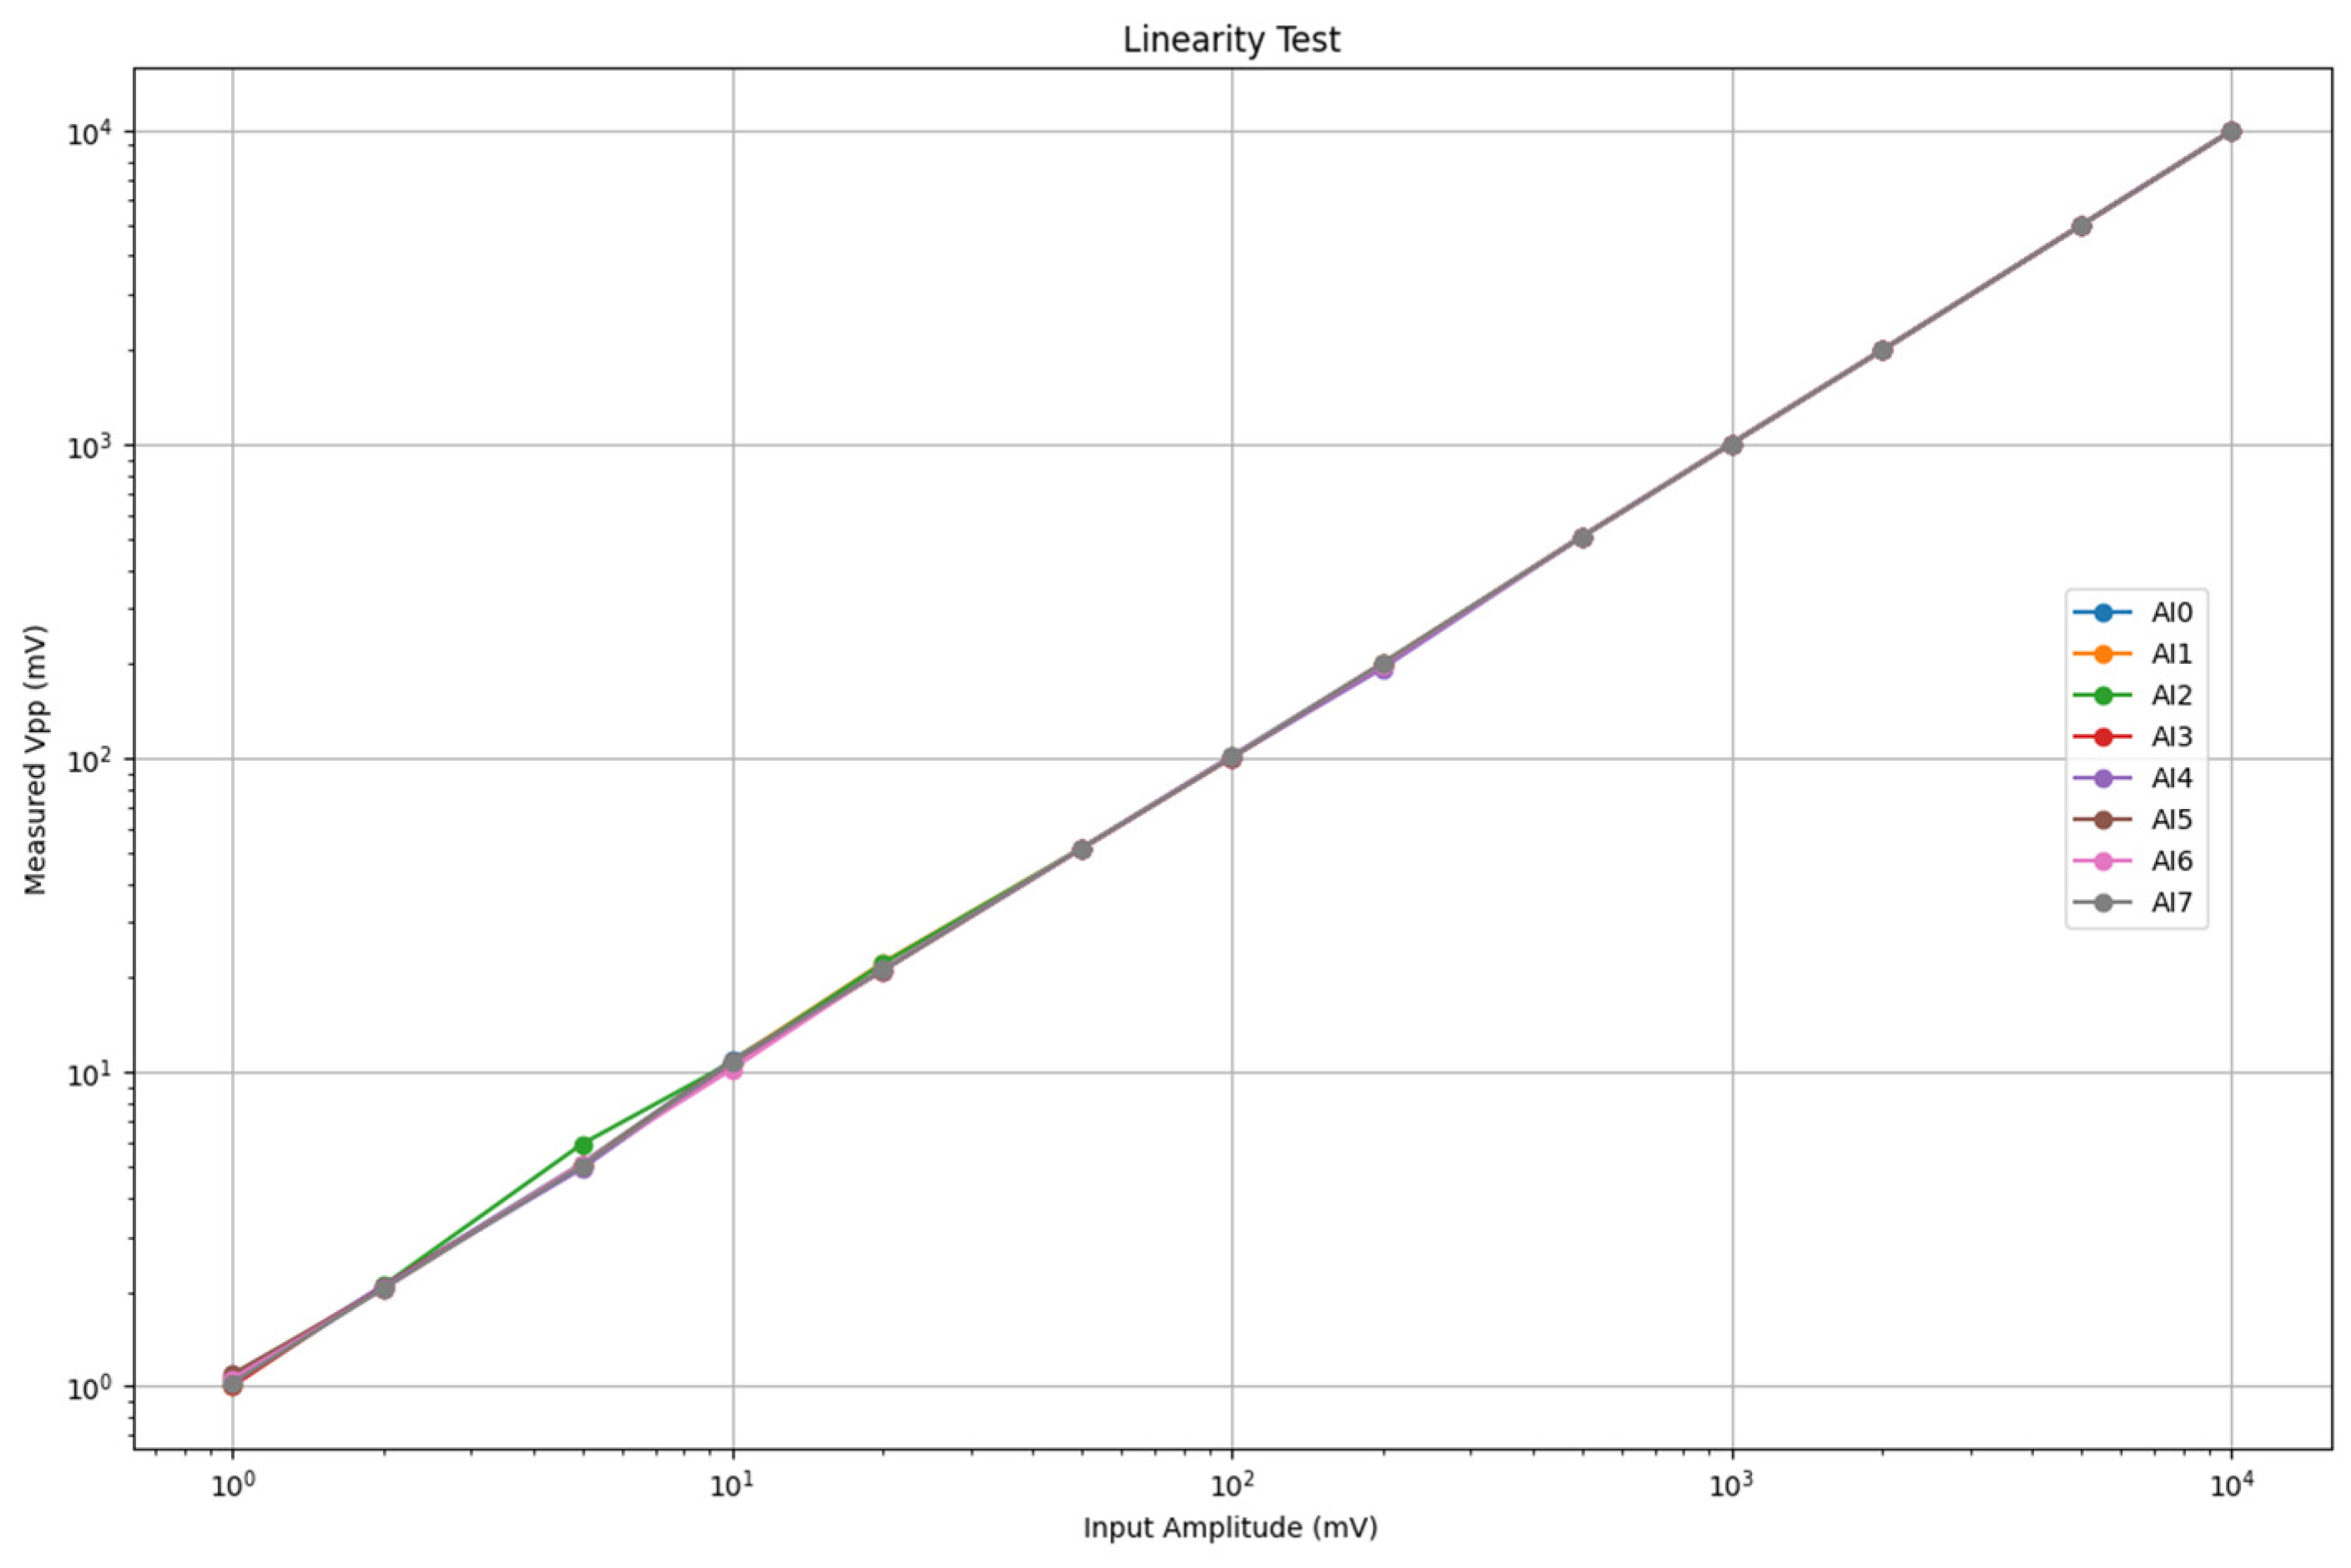
3.1.4. Amplitude Linearity
3.1.5. Dynamic Range and Signal-to-Noise Ratio
- Dynamic range (DR): The DR of the DAQ card (without preamplifier) was assessed based on the ratio of the maximum measurable signal (approximated by the RMS value of a near full-scale 10 Vpp, 1 kHz sine wave within the ±10 V range) to the minimum detectable signal (approximated by the RMS noise floor measured with inputs shorted at a 1 MS/s sampling rate, using noise data from Section 3.1.2).
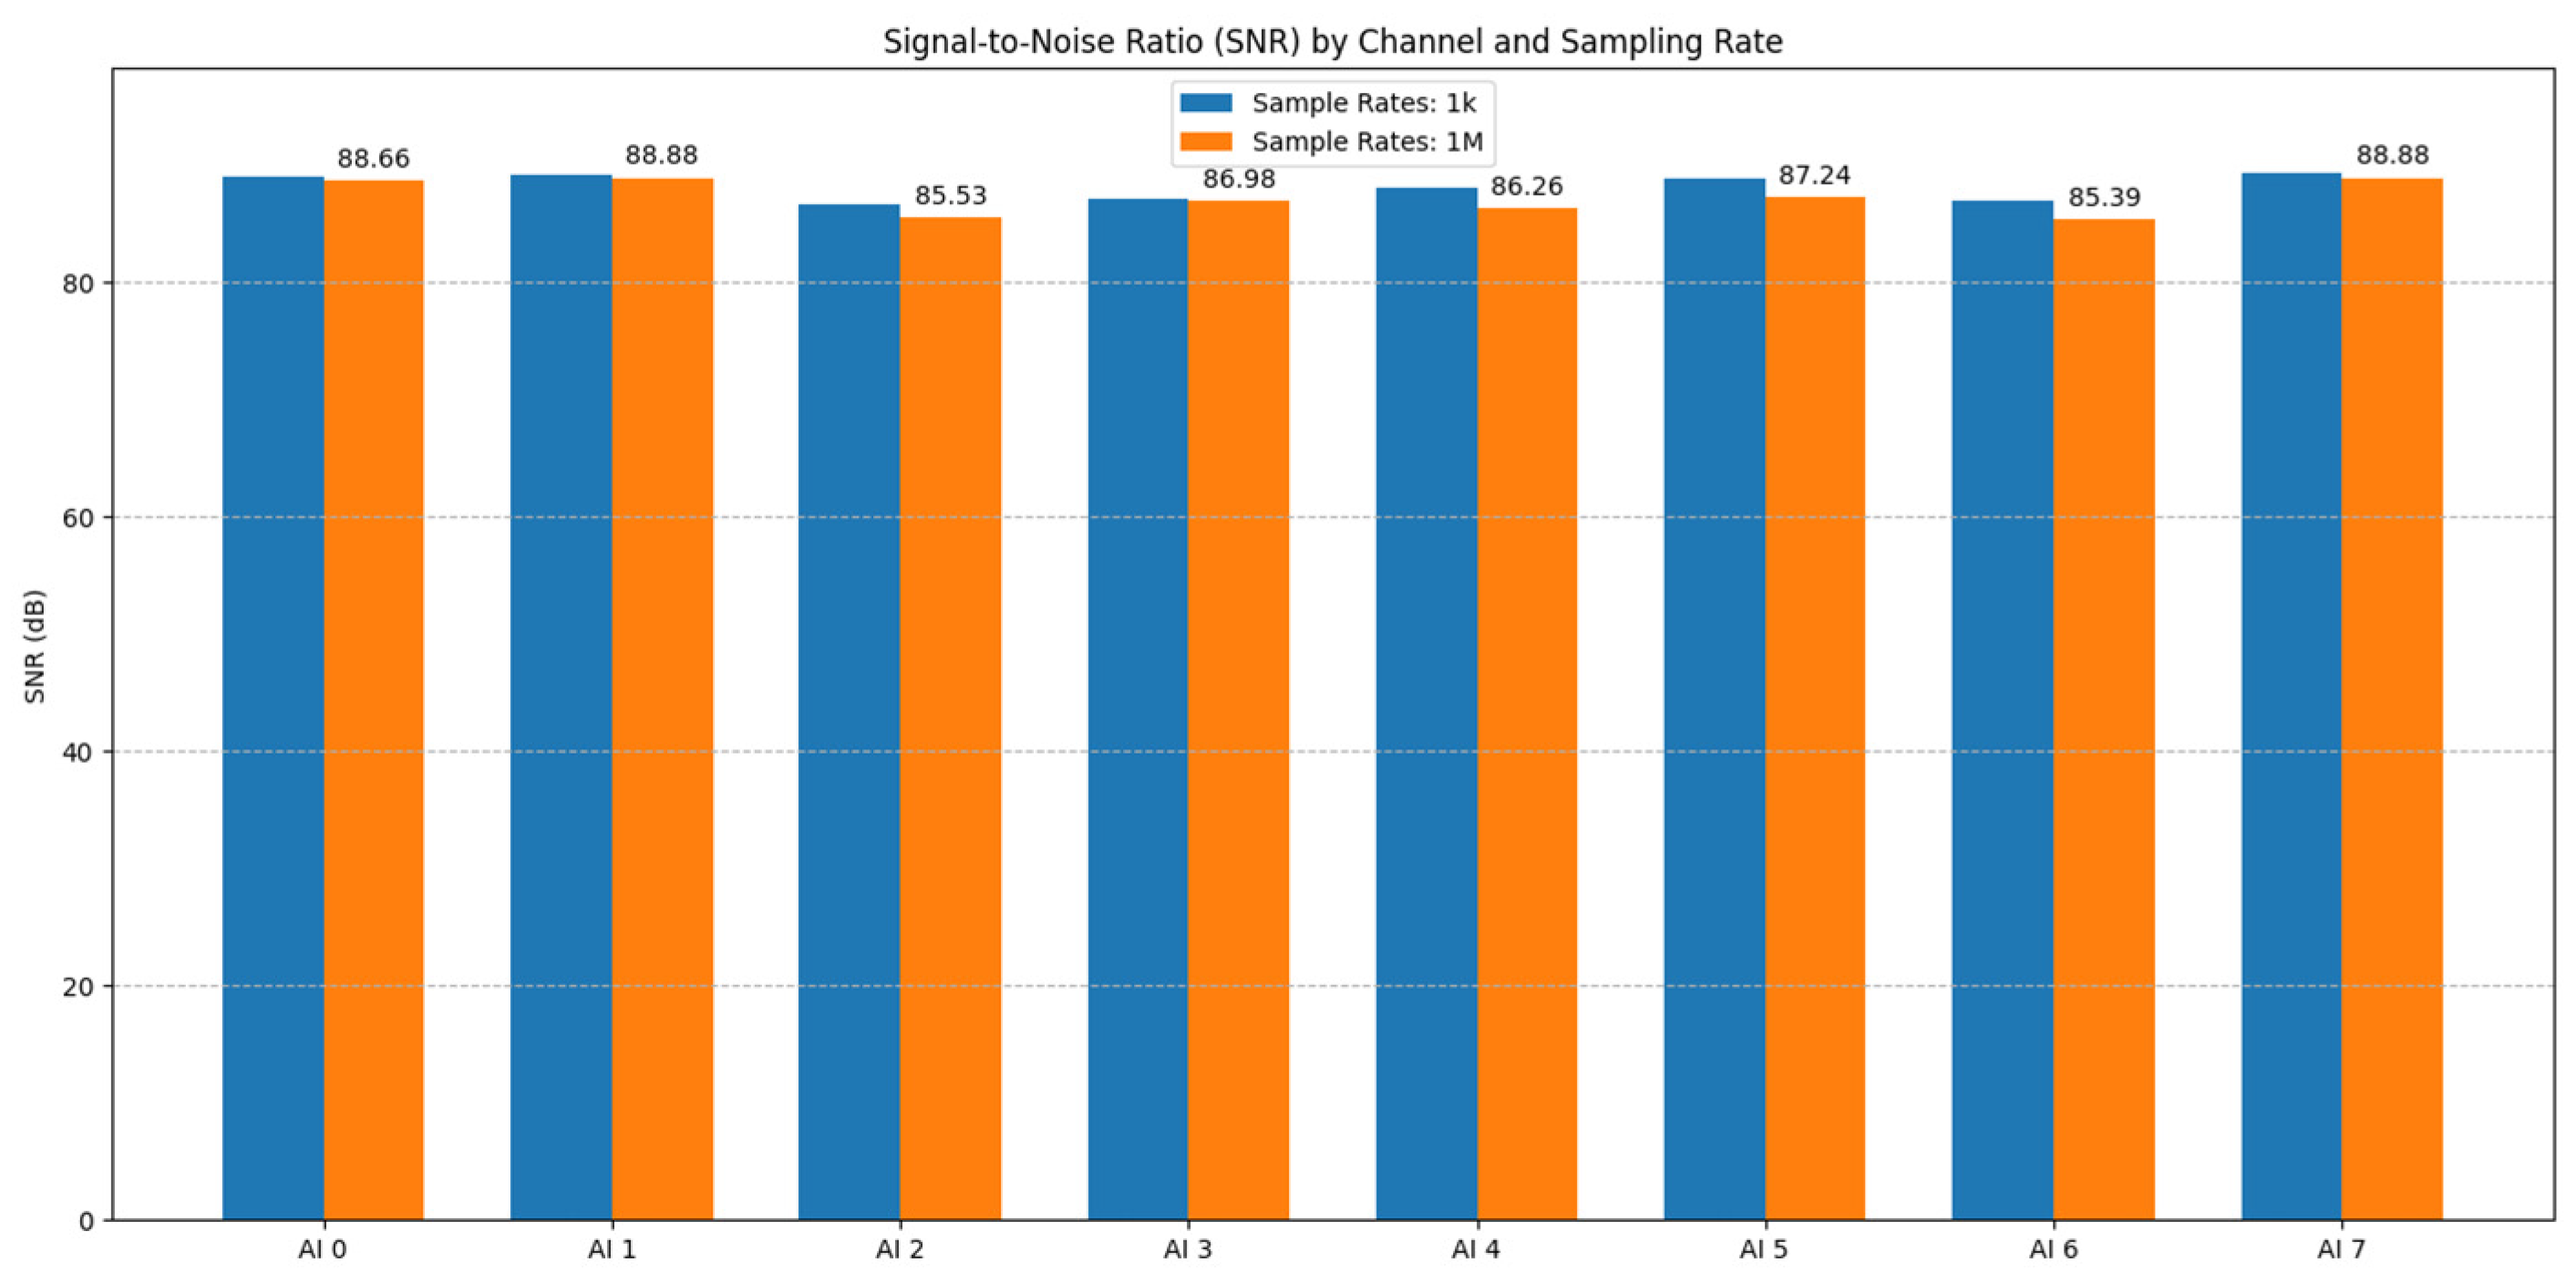
- Signal-to-noise ratio (SNR): The SNR was calculated for a specific high-level input signal. A 10 Vpp, 1 kHz sine wave served as the signal (Vsignal_RMS). The noise (Vnoise_RMS) was taken as the baseline RMS noise measured with inputs shorted (from Section 3.1.2) at two different sampling rates, 1 kS/s and 1 MS/s, allowing the assessment of the impact of the sampling bandwidth on the SNR.
- The calculated dynamic range for the NI USB-6356 DAQ card was found to be approximately 80 dB across the channels (Figure 15). This indicates a strong capability to handle a wide range of signal amplitudes, suitable for capturing both relatively strong AE events and weaker preceding signals, limited primarily by the card’s inherent noise floor and 16-bit resolution. Minor inter-channel variations (e.g., AI0 ~80.1 dB and AI5 ~79.8 dB) were observed. It is important to note that this DR value is based on the measured noise floor and the maximum signal within the ±10 V range; performance with signals in the µV range, potentially limited by linearity (Section 3.1.4) or requiring pre-amplification, warrants further investigation, ideally using lower noise signal sources.
- The signal-to-noise ratio (SNR), evaluated using a high-level 10 Vpp signal, was excellent, exceeding 80 dB for most channels at both 1 kS/s and 1 MS/s sampling rates (Figure 16). This demonstrates the system’s ability to maintain high signal fidelity for strong signals. As expected, the SNR was marginally higher at the lower sampling rate (1 kS/s) compared to the higher rate (1 MS/s), reflecting the integration of a wider noise bandwidth at higher Fs. Inter-channel variations in SNR were also present, mirroring the baseline noise differences. These results confirm the DAQ card’s high intrinsic SNR but also reinforce the practical consideration that system SNR for low-level AE signals will be dominated by the preamplifier noise (Figure 12) and the chosen gain, requiring careful optimization for specific measurement needs.
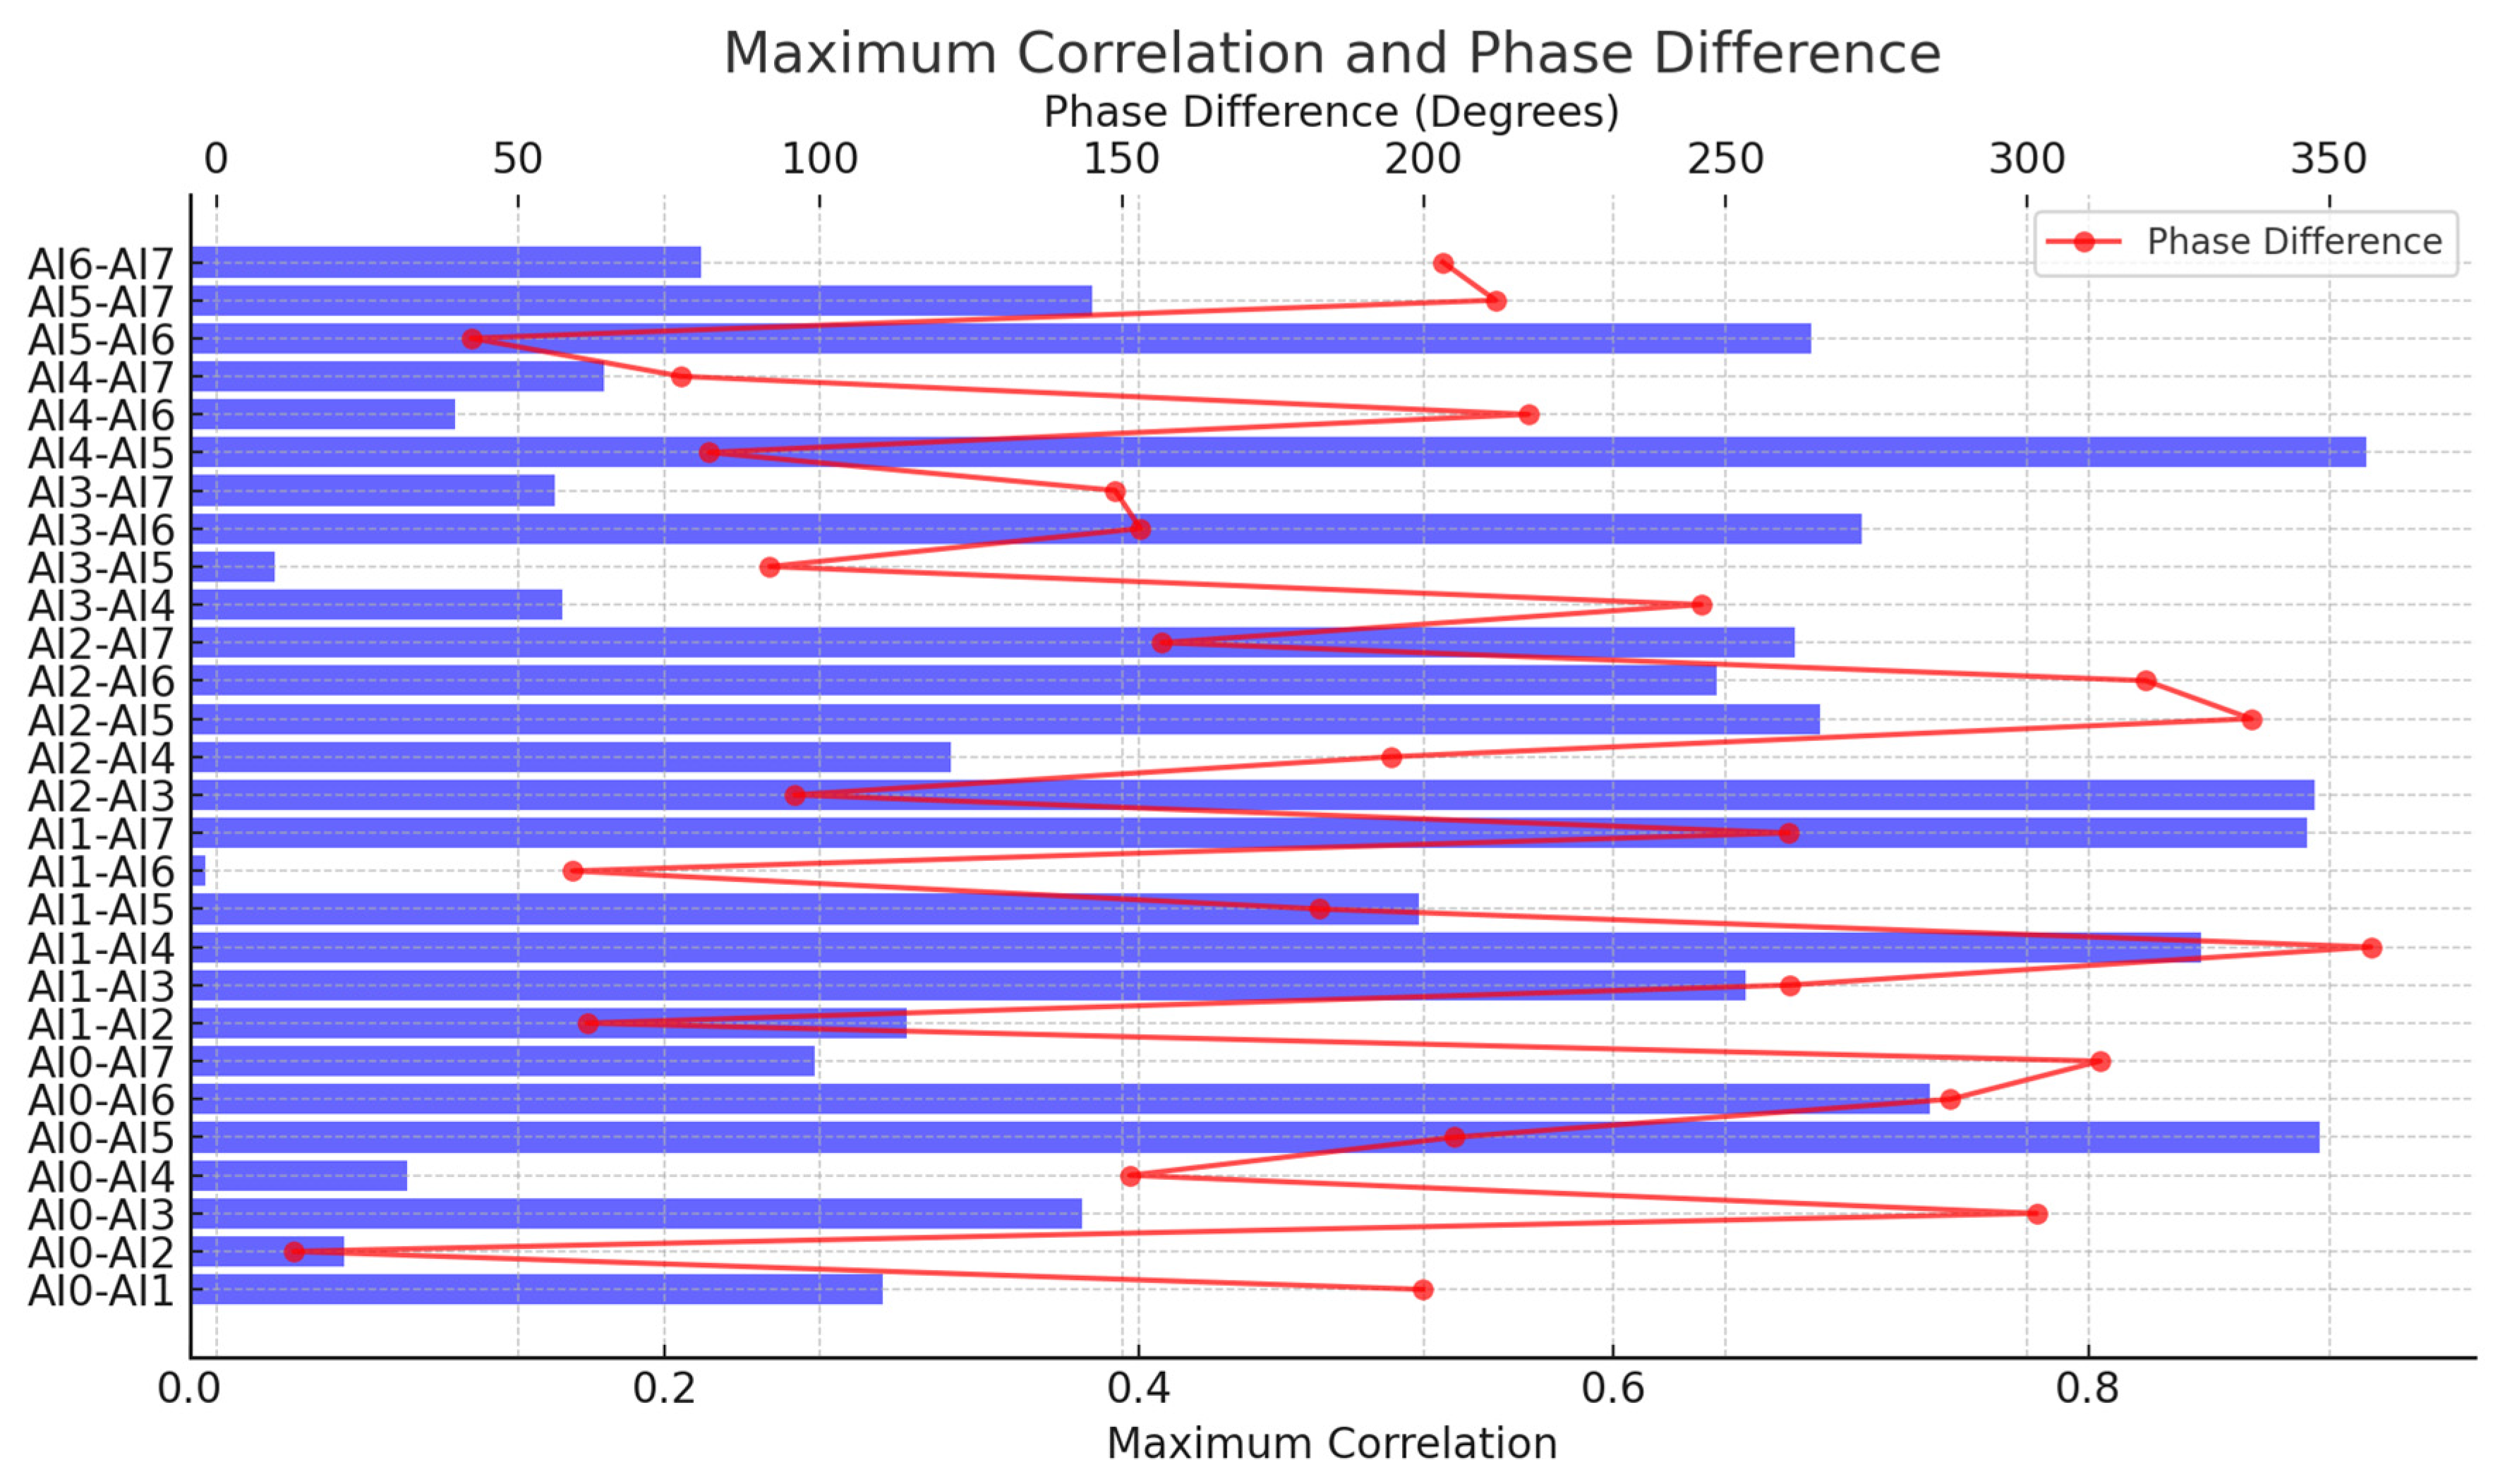
3.1.6. System-Level Synchronization Performance
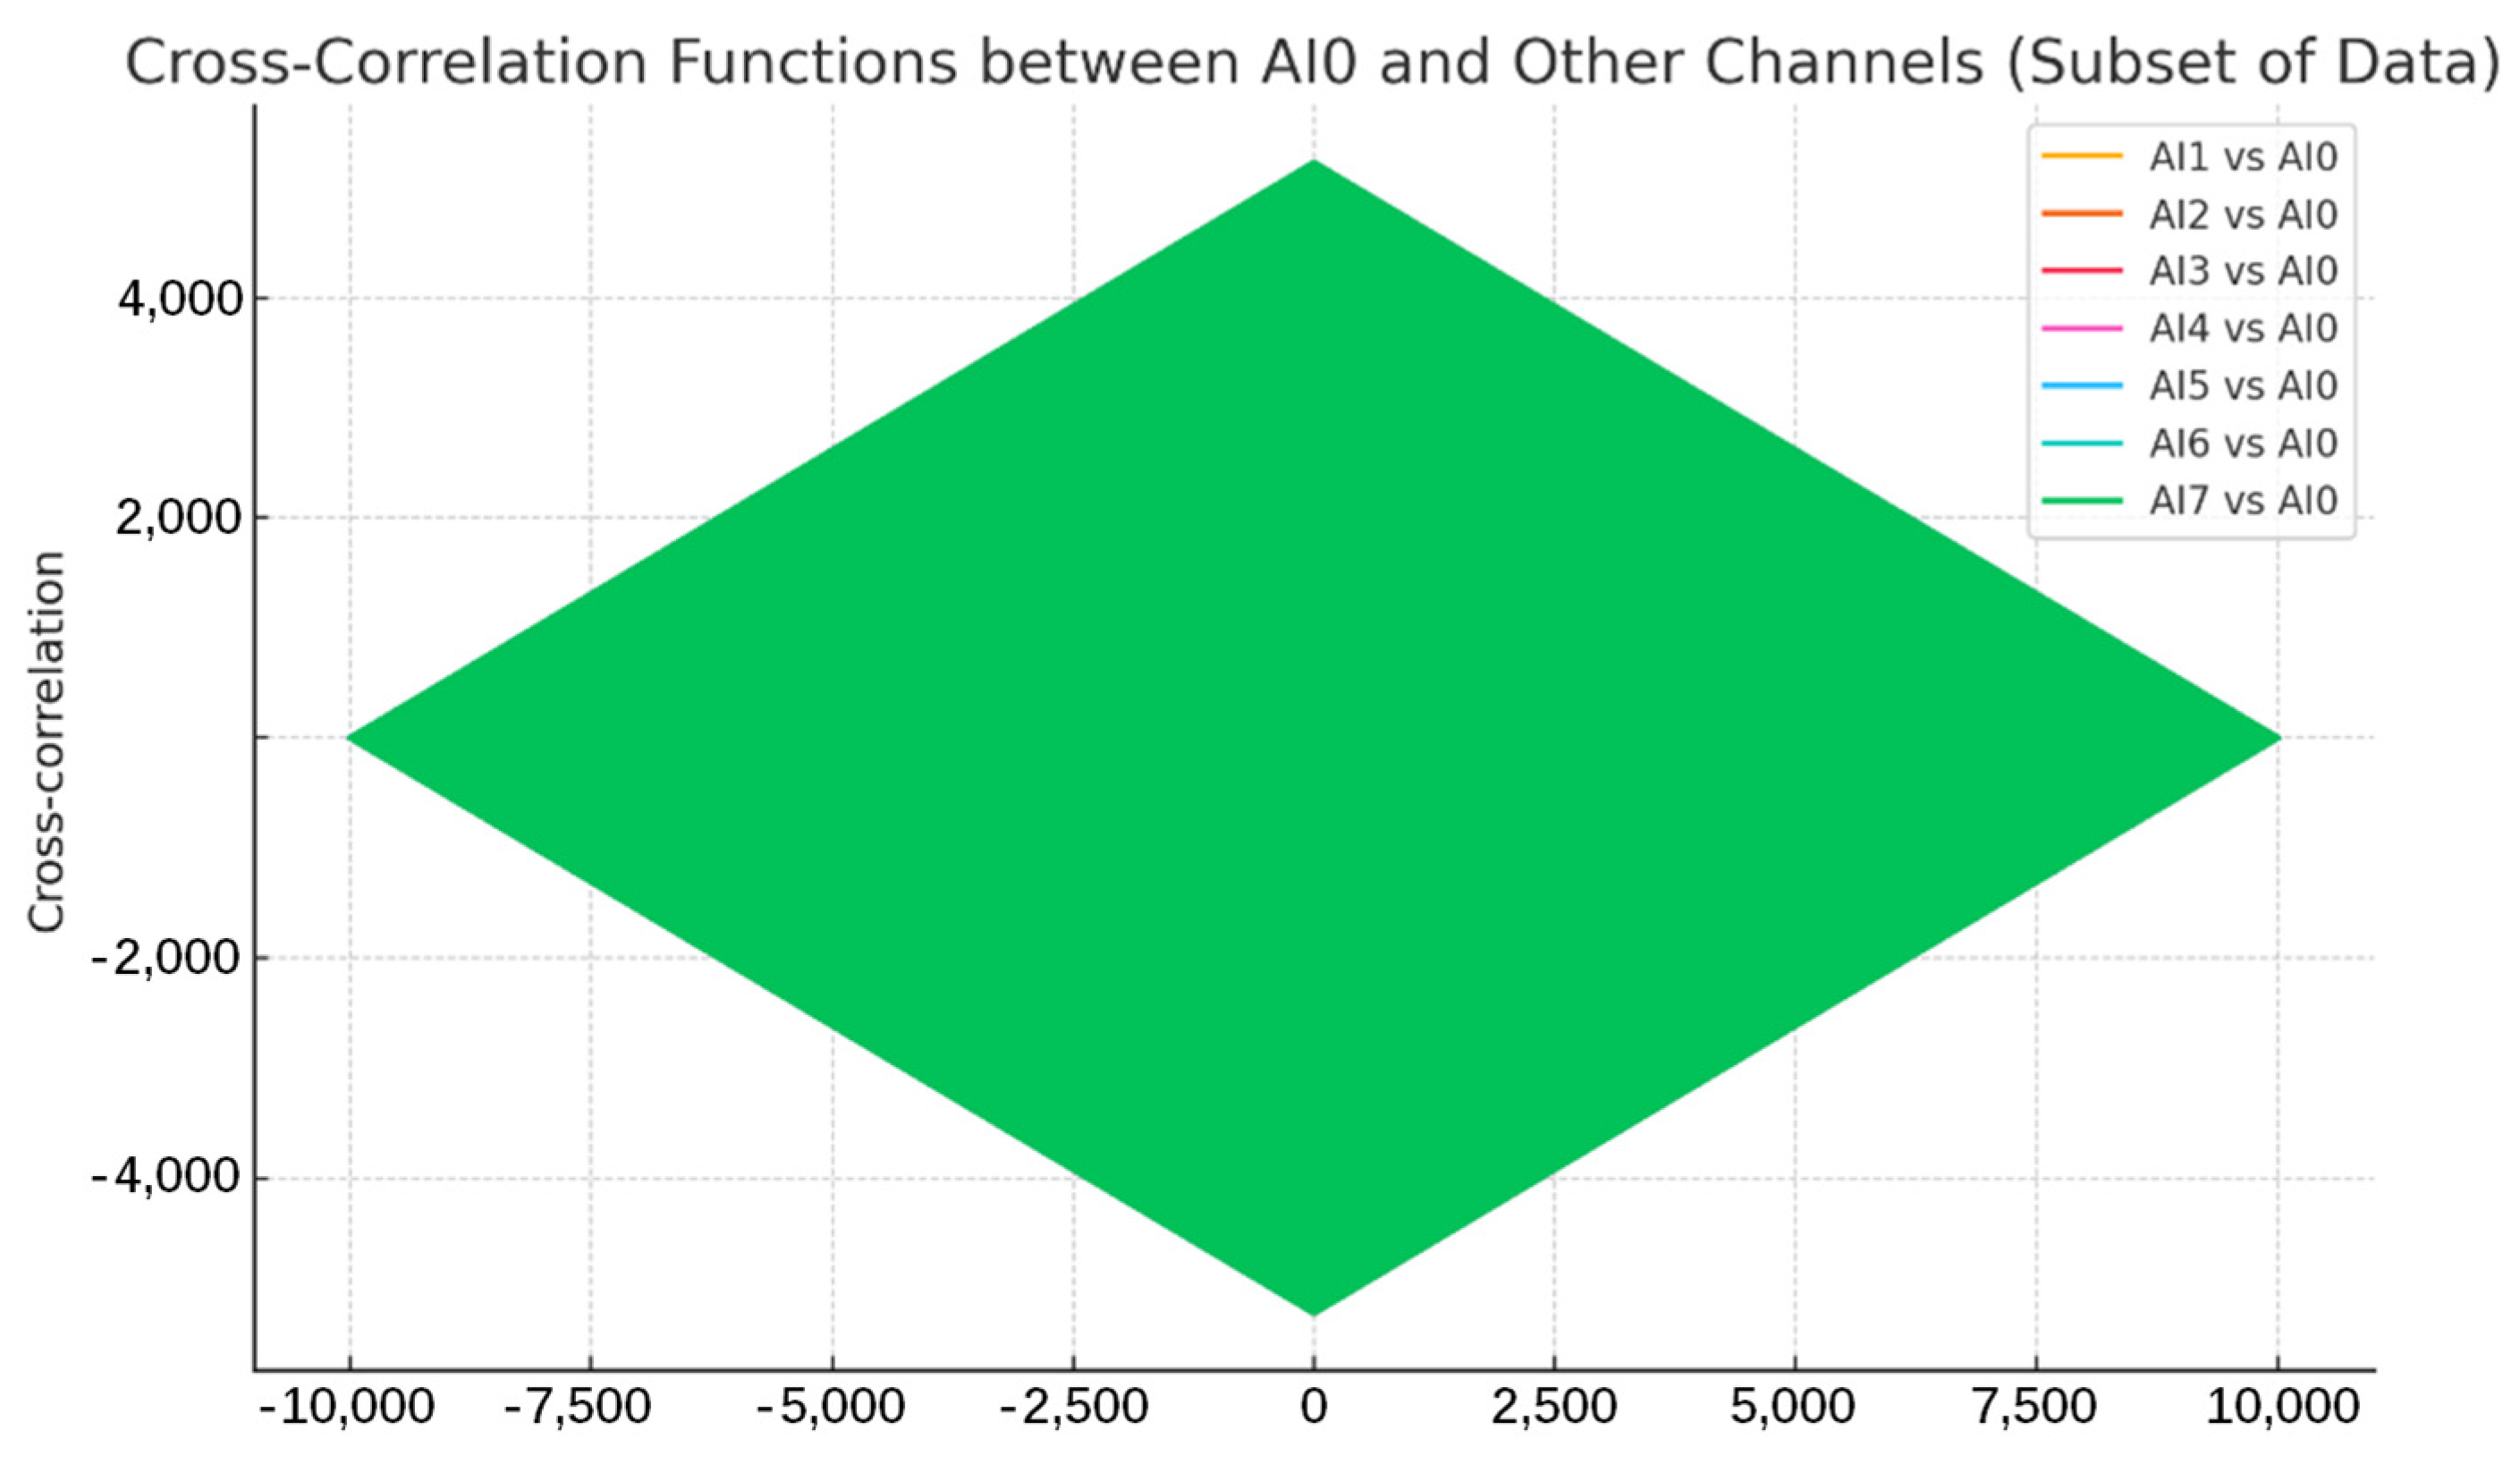
- Cross-correlation: The maximum value of the cross-correlation function computed between all pairs of channels was determined. Values approaching 1 indicate high waveform similarity and phase coherence.
- Relative phase difference: The phase difference (Δφ) between signals acquired on different channels was calculated for each test frequency (as discussed in Section 3.1.3). This Δφ provides a measure of the relative timing error (Δt ≈ Δφ/(2πf)).
3.2. Validation with Acoustic Emission Signals
3.2.1. Experimental Setup
3.2.2. Data Acquisition and Software-Based Filtering
3.2.3. Representative AE Signal Capture and Analysis
4. Conclusions
Limitations and Future Work
Funding
Institutional Review Board Statement
Informed Consent Statement
Data Availability Statement
Acknowledgments
Conflicts of Interest
References
- Green, R.E., Jr. Acoustic Emission: Establishing the Fundamentals; Rep. NBSIR 84-2860; National Bureau of Standards, U.S. Dept. of Commerce: Gaithersburg, MD, USA, 1984.
- Kang, M.; Kim, J.; Kim, J.-M. An FPGA-based multicore system for real-time bearing fault diagnosis using ultrasampling rate AE signals. IEEE Trans. Ind. Electron. 2015, 62, 2319–2329. [Google Scholar] [CrossRef]
- Xiang, X.Y.; Jangjaimon, I.; Madani, M.; Tzeng, N.F. A Reliable and Cost-Effective Sand Monitoring System on the Field Programmable Gate Array (FPGA). IEEE Trans. Instrum. Meas. 2013, 62, 1870–1881. [Google Scholar] [CrossRef]
- Li, X.B.; Dong, L.J. Comparison of Two Methods in Acoustic Emission Source Location Using Four Sensors Without Measuring Sonic Speed. Sens. Lett. 2011, 9, 2025–2029. [Google Scholar] [CrossRef]
- Aburatani, H. Acoustic Emission Measurements on Piezoelectric/Ferroelectric Materials. J. Acoust. Emiss. 2011, 29, 149–159. [Google Scholar]
- Chilibon, I. Acoustic Emission Sensing of Materials and Structures. In Proceedings of the Thirteenth International Conference on Sensor Device Technologies and Applications (SENSORDEVICES 2022), Lisbon, Portugal, 24–28 July 2022. [Google Scholar]
- Wojenski, A.; Zbroszczyk, H.; Kruszewski, M.; Szymanski, P.; Wawrzyn, E.; Wielanek, D.; Zabolotny, W.; Pawlowska, D.; Gniazdowski, T. Hardware acceleration of complex HEP algorithms with HLS and FPGAs: Methodology and preliminary implementation. Comput. Phys. Commun. 2024, 295, 108997. [Google Scholar] [CrossRef]
- Mao, M.; Jiang, Z.; Tan, Z.; Xiao, W.; Du, G. Tilting Pad Thrust Bearing Fault Diagnosis Based on Acoustic Emission Signal and Modified Multi-Feature Fusion Convolutional Neural Network. Sensors 2025, 25, 904. [Google Scholar] [CrossRef] [PubMed]
- Capellari, G.; Chatzi, E.; Mariani, S. Cost–Benefit Optimization of Structural Health Monitoring Sensor Networks. Sensors 2018, 18, 2174. [Google Scholar] [CrossRef] [PubMed]
- Underbrink, J. Boeing Measures Reduced Aircraft Noise Emissions with NI PXI and LabVIEW. Boeing Aero/Noise/Propulsion Laboratory, National Instruments. Available online: https://www.ni.com/en/solutions/aerospace-defense/case-studies/boeing-measures-reduced-aircraft-noise-emissions-with-ni-pxi-an-labview.html (accessed on 22 March 2024).
- Niu, H.; Chen, B.; Yuan, Z. Freeze-thaw damage characteristics and damage evolution law of foam concrete based on acoustic emission-digital image correlation technology. Acta Mater. Compos. Sin. 2024, 42, 1–9. (In Chinese) [Google Scholar]
- Wu, C.; Yang, J.; Li, Q. Compressive damage characteristics of concrete based on acoustic emission technology. J. Vib. Meas. Diagn. 2024, 44, 608–613+626. [Google Scholar] [CrossRef]
- Shi, D.; Chen, X.; Shang, K.; Ma, L. Study on failure characteristics of high-strength coral aggregate concrete slabs reinforced with steel bars based on acoustic emission technology. J. Vib. Shock 2024, 43, 221–231. [Google Scholar] [CrossRef]
- Hassan, F.; Mahmood, A.K.B.; Yahya, N.; Saboor, A.; Abbas, M.Z.; Khan, Z.; Rimsan, M. State-of-the-Art Review on the Acoustic Emission Source Localization Techniques. IEEE Access 2021, 9, 101246–101265. [Google Scholar] [CrossRef]
- Ono, K. Review on Structural Health Evaluation with Acoustic Emission. Appl. Sci. 2018, 8, 958. [Google Scholar] [CrossRef]
- Analog Devices. AD620: Low Cost, Low Power Instrumentation Amplifier. 2003. Available online: https://www.analog.com/media/en/technical-documentation/data-sheets/ad620.pdf (accessed on 2 April 2024).
- National Instruments. What Is NI-X Series? Available online: https://www.ni.com/en/support/documentation/supplemental/09/what-is-ni-x-series-.html (accessed on 2 April 2024).
- National Instruments. X Series User Manual (for NI 632x/634x/635x/636x/637x/638x/639x Devices); Part No. 370784K-01; National Instruments: Austin, TX, USA, 2019. [Google Scholar]
- National Instruments. NI-DAQmx User Manual. Available online: https://www.ni.com/docs/en-US/bundle/ni-daqmx/page/user-manual-welcome.html (accessed on 2 April 2024).


| No. | Test Channel(s) | Test Signal Type | Test Signal Frequency | Test Signal Amplitude | Sampling Rate |
|---|---|---|---|---|---|
| 1 | AI 0~AI 7 | Sine Wave | 1 kHz | 1 Vpp | 10 kS/s |
| 2 | AI 0~AI 7 | Sine Wave | 5 kHz | 1 Vpp | 50 kS/s |
| 3 | AI 0~AI 7 | Sine Wave | 10 kHz | 1 Vpp | 100 kS/s |
| 4 | AI 0~AI 7 | Sine Wave | 20 kHz | 1 Vpp | 200 kS/s |
| 5 | AI 0~AI 7 | Sine Wave | 50 kHz | 1 Vpp | 500 kS/s |
| 6 | AI 0~AI 7 | Sine Wave | 100 kHz | 1 Vpp | 1 MS/s |
| 7 | AI 0~AI 7 | Sine Wave | 200 kHz | 1 Vpp | 1 MS/s |
| 8 | AI 0~AI 7 | Sine Wave | 500 kHz | 1 Vpp | 1.25 MS/s |
| No. | Test Channel(s) | Input Condition | Sampling Rate |
|---|---|---|---|
| 1 | AI 0~AI 7 | Directly Grounded | 10 kS/s |
| 2 | AI 0~AI 7 | Directly Grounded | 20 kS/s |
| 3 | AI 0~AI 7 | Directly Grounded | 50 kS/s |
| 4 | AI 0~AI 7 | Directly Grounded | 100 kS/s |
| 5 | AI 0~AI 7 | Directly Grounded | 200 kS/s |
| 6 | AI 0~AI 7 | Directly Grounded | 500 kS/s |
| 7 | AI 0~AI 7 | Directly Grounded | 1 MS/s |
| 8 | AI 0~AI 7 | Directly Grounded | 1.25 MS/s |
| No. | Test Channel(s) | Test Signal Type | Test Signal Frequency | Test Signal Amplitude | Sampling Rate |
|---|---|---|---|---|---|
| 1 | AI 0~AI 7 | Sine Wave | 1 kHz | 1 Vpp | 10 kS/s |
| 2 | AI 0~AI 7 | Sine Wave | 5 kHz | 1 Vpp | 50 kS/s |
| 3 | AI 0~AI 7 | Sine Wave | 10 kHz | 1 Vpp | 100 kS/s |
| 4 | AI 0~AI 7 | Sine Wave | 20 kHz | 1 Vpp | 200 kS/s |
| 5 | AI 0~AI 7 | Sine Wave | 50 kHz | 1 Vpp | 500 kS/s |
| 6 | AI 0~AI 7 | Sine Wave | 100 kHz | 1 Vpp | 1 MS/s |
| 7 | AI 0~AI 7 | Sine Wave | 200 kHz | 1 Vpp | 1 MS/s |
| 8 | AI 0~AI 7 | Sine Wave | 500 kHz | 1 Vpp | 1.25 MS/s |
| No. | Test Channel(s) | Test Signal Type | Test Signal Frequency | Test Signal Amplitude | Sampling Rate |
|---|---|---|---|---|---|
| 1 | AI 0~AI 7 | Sine Wave | 1 kHz | 1 mVpp, 2 mVpp, 5 mVpp | 10 kS/s |
| 2 | AI 0~AI 7 | Sine Wave | 1 kHz | 10 mVpp, 20 mVpp, 50 mVpp | 10 kS/s |
| 3 | AI 0~AI 7 | Sine Wave | 1 kHz | 100 mVpp, 200 mVpp, 500 mVpp | 10 kS/s |
| 4 | AI 0~AI 7 | Sine Wave | 1 kHz | 1 Vpp, 2 Vpp, 5 Vpp | 10 kS/s |
| 5 | AI 0~AI 7 | Sine Wave | 1 kHz | 10 Vpp | 10 kS/s |
Disclaimer/Publisher’s Note: The statements, opinions and data contained in all publications are solely those of the individual author(s) and contributor(s) and not of MDPI and/or the editor(s). MDPI and/or the editor(s) disclaim responsibility for any injury to people or property resulting from any ideas, methods, instructions or products referred to in the content. |
© 2025 by the author. Licensee MDPI, Basel, Switzerland. This article is an open access article distributed under the terms and conditions of the Creative Commons Attribution (CC BY) license (https://creativecommons.org/licenses/by/4.0/).
Share and Cite
Tang, G. A Digital Signal Processing-Based Multi-Channel Acoustic Emission Acquisition System with a Simplified Analog Front-End. Sensors 2025, 25, 3206. https://doi.org/10.3390/s25103206
Tang G. A Digital Signal Processing-Based Multi-Channel Acoustic Emission Acquisition System with a Simplified Analog Front-End. Sensors. 2025; 25(10):3206. https://doi.org/10.3390/s25103206
Chicago/Turabian StyleTang, Gan. 2025. "A Digital Signal Processing-Based Multi-Channel Acoustic Emission Acquisition System with a Simplified Analog Front-End" Sensors 25, no. 10: 3206. https://doi.org/10.3390/s25103206
APA StyleTang, G. (2025). A Digital Signal Processing-Based Multi-Channel Acoustic Emission Acquisition System with a Simplified Analog Front-End. Sensors, 25(10), 3206. https://doi.org/10.3390/s25103206