
AI-Based Enhancing of xBn MWIR Thermal Camera Performance at 180 Kelvin


Abstract
1. Introduction
- Q = heat transfer rate (W);
- U = overall heat transfer coefficient (W/m2K);
- A = surface area of the heat exchanger (m2);
- ΔT = temperature difference between the hot and cold sides (K).
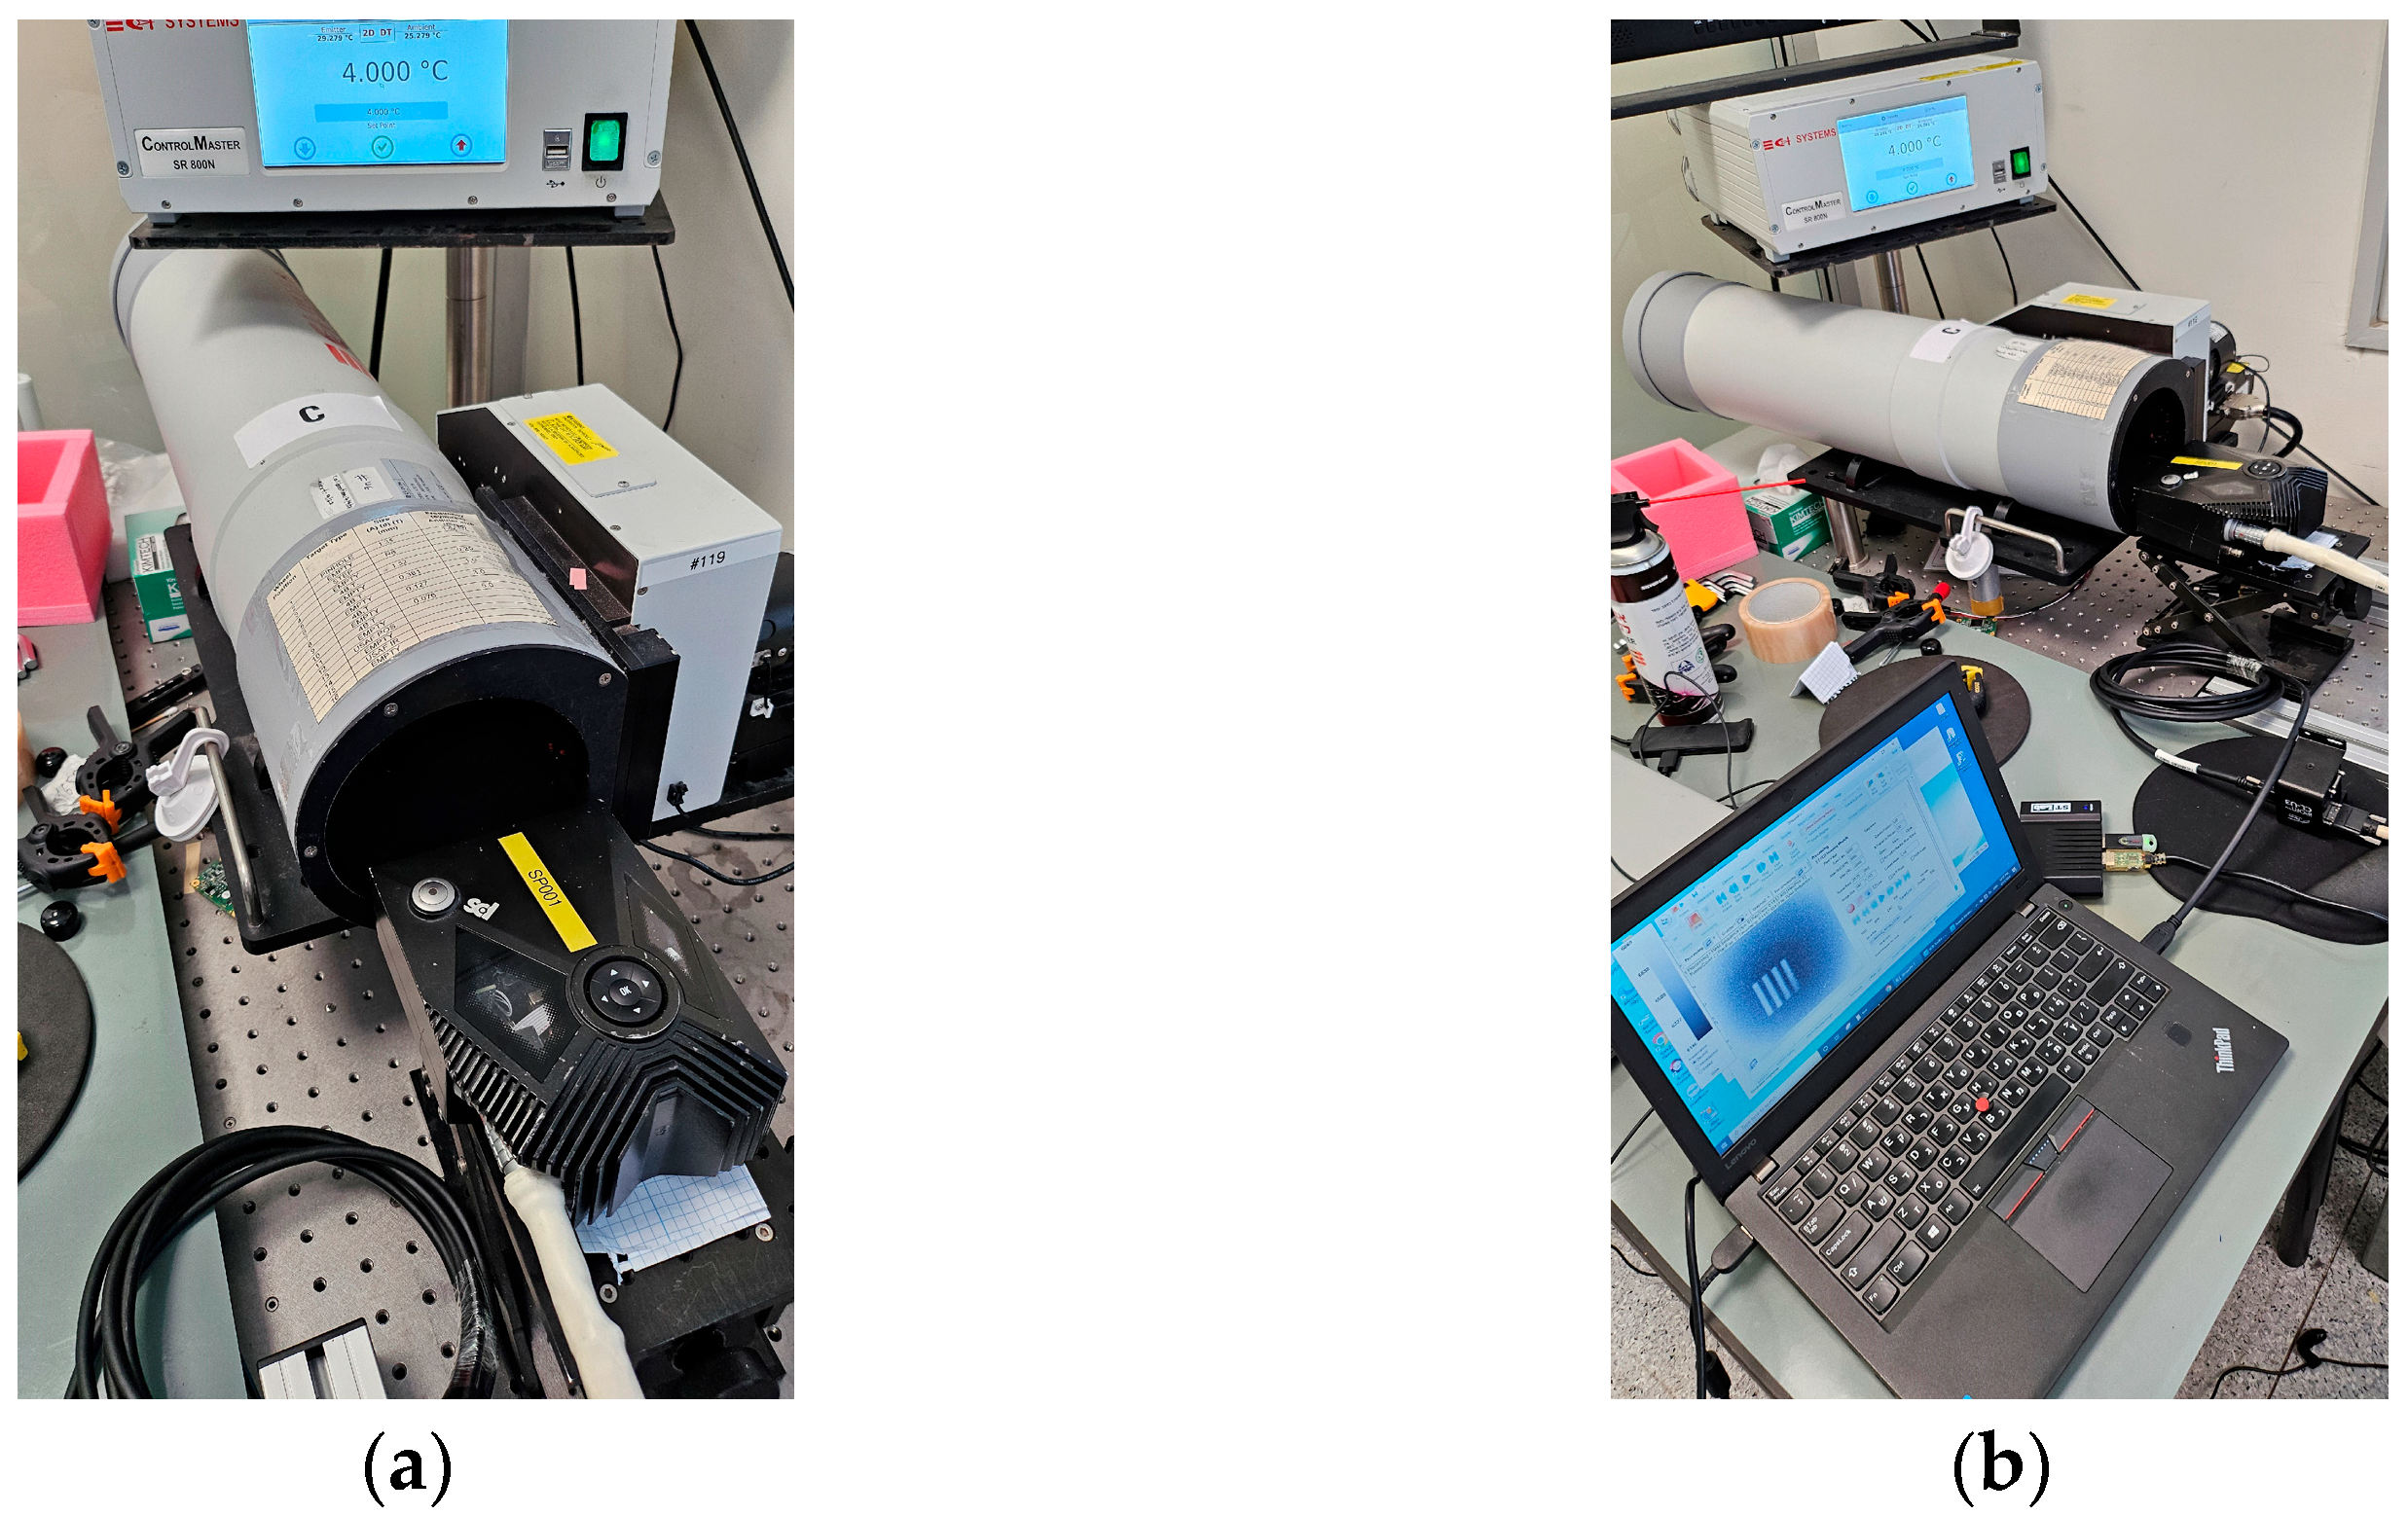
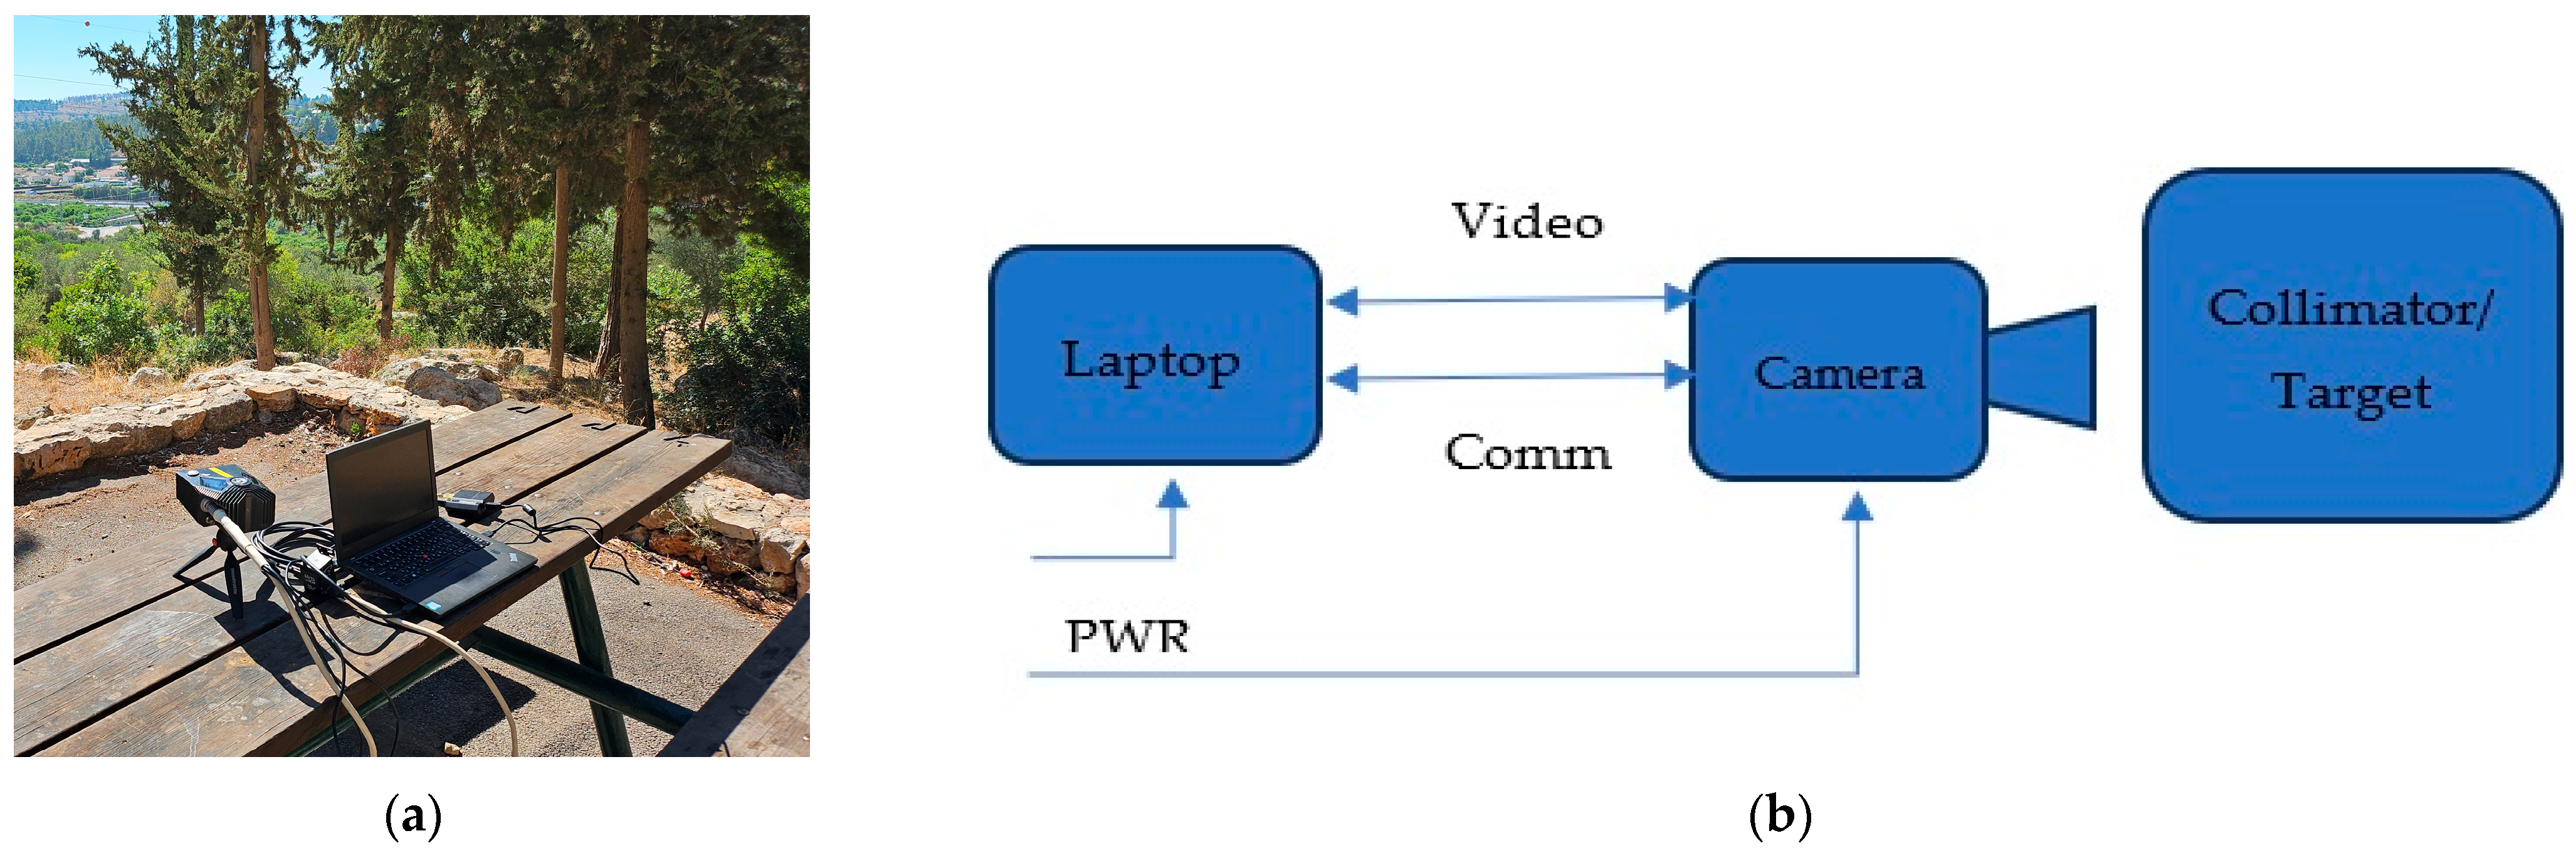
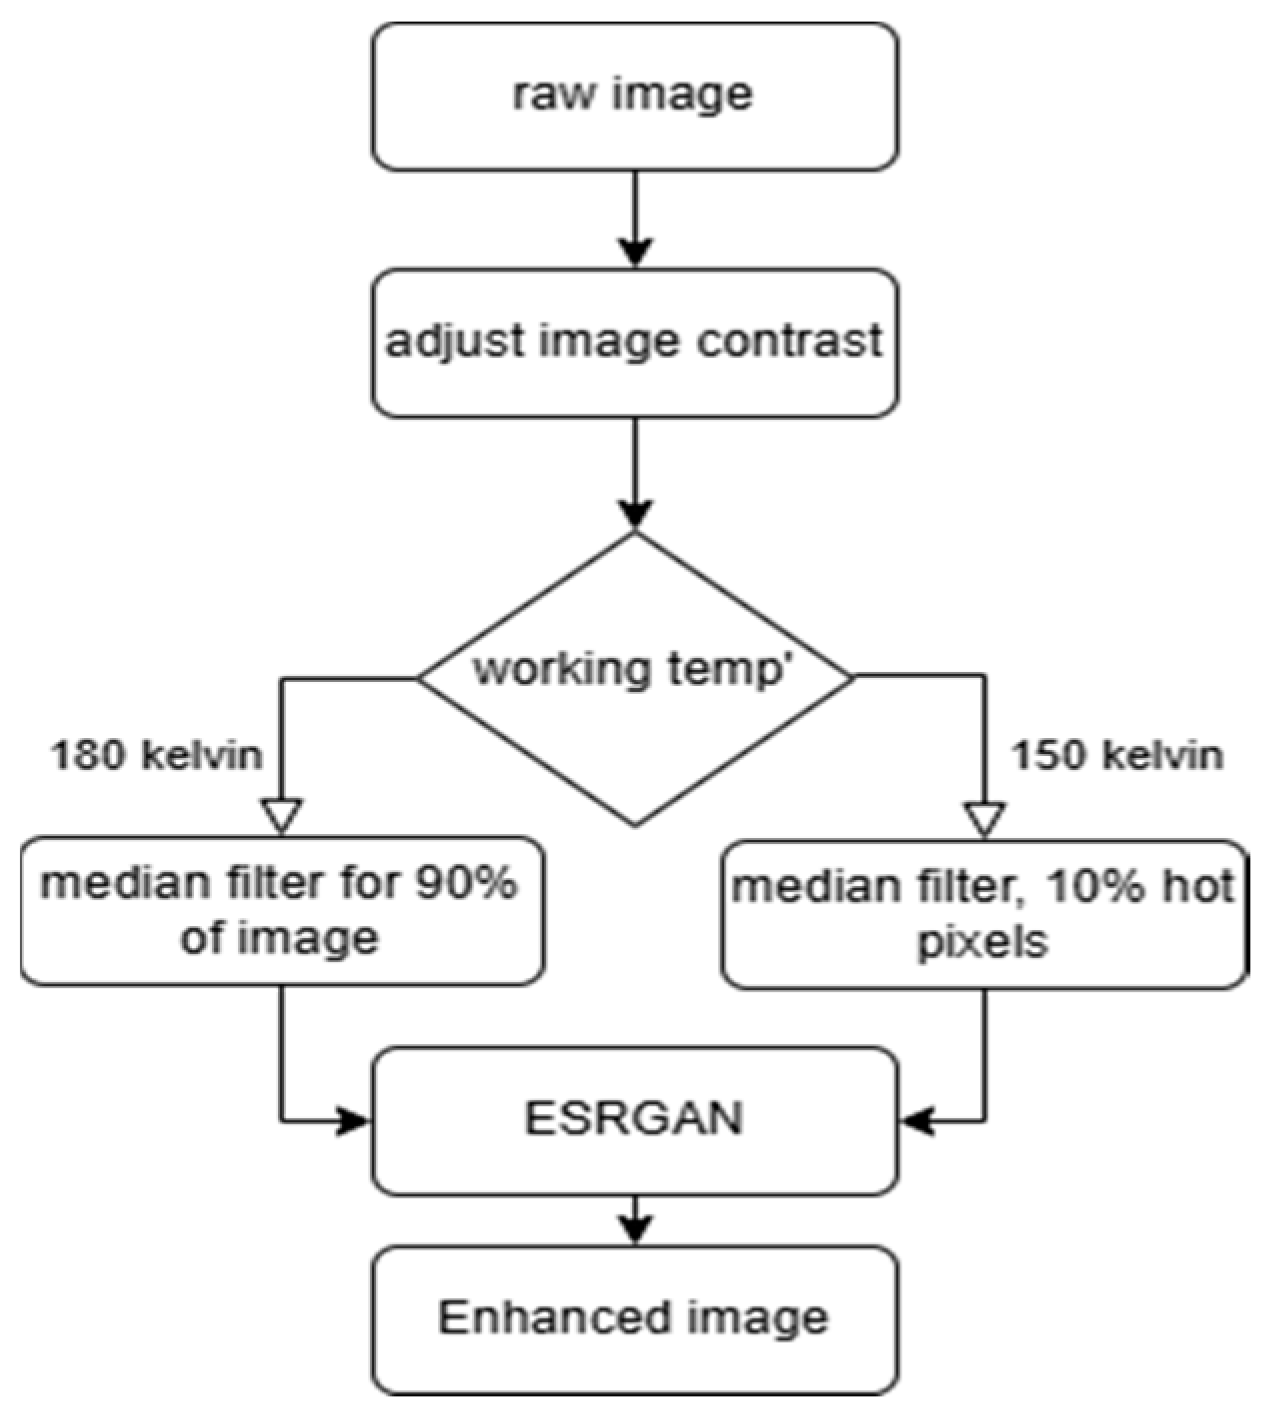
2. Materials and Methods
3. Results
3.1. First Experiment
3.2. Second Experiment
3.3. Third Experiment
3.4. Forth Experiment
3.5. Fifth Experiment
4. Discussion
4.1. Algorithm Optimization
4.2. Multi-Image Processing
5. Conclusions
Author Contributions
Funding
Institutional Review Board Statement
Informed Consent Statement
Data Availability Statement
Conflicts of Interest
References
- Jiao, J.; Zhao, L.; Pan, W.; Li, X. Development and core technologies for intelligent SWaP3 infrared cameras: A comprehensive review and analysis. Sensors 2023, 23, 4189. [Google Scholar] [CrossRef] [PubMed]
- Magid, A.; Shkedy, L.; Ben Ari, N.; Shiloah, N.; Jakobson, C.G.; Freiman, W.; Armon, E.; Almog, E.; Nawi, S.S.; Katz, A.; et al. New low SWaP high definition MWIR detector with 5um pitch. In Infrared Technology and Applications L.; SPIE: Bellingham, WA, USA, 2024; pp. 207–220. [Google Scholar]
- Pillans, L.; Ash, R.M.; Hipwood, L.; Knowles, P. MWIR mercury cadmium telluride detectors for high operating temperatures. In Infrared Technology and Applications XXXVIII; SPIE: Bellingham, WA, USA, 2012; pp. 1006–1017. [Google Scholar]
- Madejczyk, P.; Gawron, W.; Sobieski, J.; Martyniuk, P.; Rutkowski, J. MCT heterostructures for higher operating temperature infrared detectors designed in Poland. Opto-Electron. Rev. 2023, 31, e144551. [Google Scholar]
- Klipstein, P.C.; Avnon, E.; Benny, Y.; Berkowicz, E.; Cohen, Y.; Dobromislin, R.; Fraenkel, R.; Gershon, G.; Glozman, A.; Hojman, E.; et al. Development and production of array barrier detectors at SCD. J. Electron. Mater. 2017, 46, 5386–5393. [Google Scholar] [CrossRef]
- Guo, X.; Li, Y.; Ling, H. LIME: Low-light image enhancement via illumination map estimation. IEEE Trans. Image Process. 2016, 26, 982–993. [Google Scholar] [CrossRef] [PubMed]
- Gur, E.; Sarafis, V.; Falat, I.; Vacha, F.; Vacha, M.; Zalevsky, Z. Super-resolution via iterative phase retrieval for blurred and saturated biological images. Opt. Express 2008, 16, 7894–7903. [Google Scholar] [CrossRef] [PubMed]
- Nagano, Y.; Kikuta, Y. SRGAN for super-resolving low-resolution food images. In Proceedings of the Joint Workshop on Multimedia for Cooking and Eating Activities and Multimedia Assisted Dietary Management; Association for Computing Machinery: New York, NY, USA, 2018; pp. 33–37. [Google Scholar]
- Wang, X.; Yu, K.; Wu, S.; Gu, J.; Liu, Y.; Dong, C.; Loy, C.C.; Qiao, Y.; Tang, X. Esrgan: Enhanced super-resolution generative adversarial networks. In Proceedings of the European Conference on Computer Vision (ECCV) Workshops, Munich, Germany, 8–14 September 2018. [Google Scholar]
- Liu, A.; Liu, Y.; Gu, J.; Qiao, Y.; Dong, C. Blind image super-resolution: A survey and beyond. IEEE Trans. Pattern Anal. Mach. Intell. 2022, 45, 5461–5480. [Google Scholar] [CrossRef] [PubMed]
- Wang, X.; Xie, L.; Dong, C.; Shan, Y. Real-esrgan: Training real-world blind super-resolution with pure synthetic data. In Proceedings of the IEEE/CVF International Conference on Computer Vision, Montreal, BC, Canada, 11–17 October 2021; pp. 1905–1914. [Google Scholar]
- Zhu, Z.; Lei, Y.; Qin, Y.; Zhu, C.; Zhu, Y. IRE: Improved image super-resolution based on real-ESRGAN. IEEE Access 2023, 11, 45334–45348. [Google Scholar] [CrossRef]
- Rajesh, R.; Lakshmi Priya, P.; Pooja, M.; Abhishek, G. A Survey on Remote Sensing Image Super-Resolution. Int. J. Adv. Eng. Manag. 2024, 6, 446–453. [Google Scholar]
- Shkedy, L.; Hirsh, I.; Klipstein, P.; Nitzani, M.; Gliksman, S.; Ben Ari, N.; Shiloah, N.; Jakobson, C.; Lury, Y.; Nahor, H.; et al. Advanced MAWS and DAS IR solutions based on HOT MWIR technology. In Infrared Technology and Applications XLIX; SPIE: Bellingham, WA, USA, 2023; pp. 255–268. [Google Scholar]
- Shkedy, L.; Armon, E.; Avnon, E.; Ben Ari, N.; Brumer, M.; Jakobson, C.; Klipstein, P.C.; Lury, Y.; Magen, O.; Rosenstock, T.; et al. HOT MWIR detector with 5 μm pitch. In Infrared Technology and Applications XLVII; SPIE: Bellingham, WA, USA, 2021; pp. 146–157. [Google Scholar]
- Klipstein, P.C.; Cohen, Y.; Dobromislin, M.; Benny, Y. Advanced Infrared Photodetectors at SCD. In ICOL-2019: Proceedings of the International Conference on Optics and Electro-Optics, Dehradun, India; Springer: Singapore, 2021; pp. 31–35. [Google Scholar]
- Mittal, A.; Soundararajan, R.; Bovik, A.C. Making a “completely blind” image quality analyzer. IEEE Signal Process. Lett. 2012, 20, 209–212. [Google Scholar] [CrossRef]
- Wang, J.; Zeng, X.; Duan, S.; Zhou, Q.; Peng, H. A fast and efficient two-scale fusion of infrared and visible images using median filter and intensity transfer. Ukr. J. Phys. Opt. 2022, 23, 155–165. [Google Scholar] [CrossRef]
- Zhang, X.; Li, C.; Meng, Q.; Liu, S.; Zhang, Y.; Wang, J. Infrared Image Super Resolution by Combining Compressive Sensing and Deep Learning. Sensors 2018, 18, 2587. [Google Scholar] [CrossRef]
- Wang, Y.; Wang, Y.; Liu, T.; Sui, X.; Gu, G.; Chen, Q. Enhancing infrared imaging systems with temperature-dependent nonuniformity correction via single-frame and inter-frame structural similarity. Appl. Opt. 2023, 62, 7075–7082. [Google Scholar] [CrossRef] [PubMed]
- Restrepo, H.D.B. Objective Image Quality Assessment in infrared non-destructive testing. In Proceedings of the 2012 XVII Symposium of Image, Signal Processing, and Artificial Vision (STSIVA), Medellin, Colombia, 12–14 September 2012; pp. 122–127. [Google Scholar]
- Merrouche, S.; Bondžulić, B.; Andrić, M.; Bujaković, D. Description and analysis of infrared image database–Subjective and objective image quality assessment. In Proceedings of the 8th International Scientific Conference on Defensive Technologies–OTEH, Belgrade, Serbia, 11–12 October 2018; pp. 307–313. [Google Scholar]
- Huang, Y.; Miyazaki, T.; Liu, X.; Omachi, S. Infrared image super-resolution: Systematic review, and future trends. arXiv 2022, arXiv:2212.12322. [Google Scholar]
- Woldamanuel, E.M. Grayscale image enhancement using water cycle algorithm. IEEE Access 2023, 11, 86575–86596. [Google Scholar] [CrossRef]
- Soundrapandiyan, R.; Satapathy, S.C.; Pvssr, C.M.; Nhu, N.G. A comprehensive survey on image enhancement techniques with special emphasis on infrared images. Multimed. Tools Appl. 2022, 81, 9045–9077. [Google Scholar] [CrossRef]
- Zhang, Y.; Li, K.; Li, K.; Wang, L.; Zhong, B.; Fu, Y. Image super-resolution using very deep residual channel attention networks. In Proceedings of the European Conference on Computer Vision (ECCV), Munich, Germany, 8–14 September 2018; pp. 286–301. [Google Scholar]


| Original Image | Original 150 k | Enhanced 150 k | Original 180 k | Enhanced 180 k |
|---|---|---|---|---|
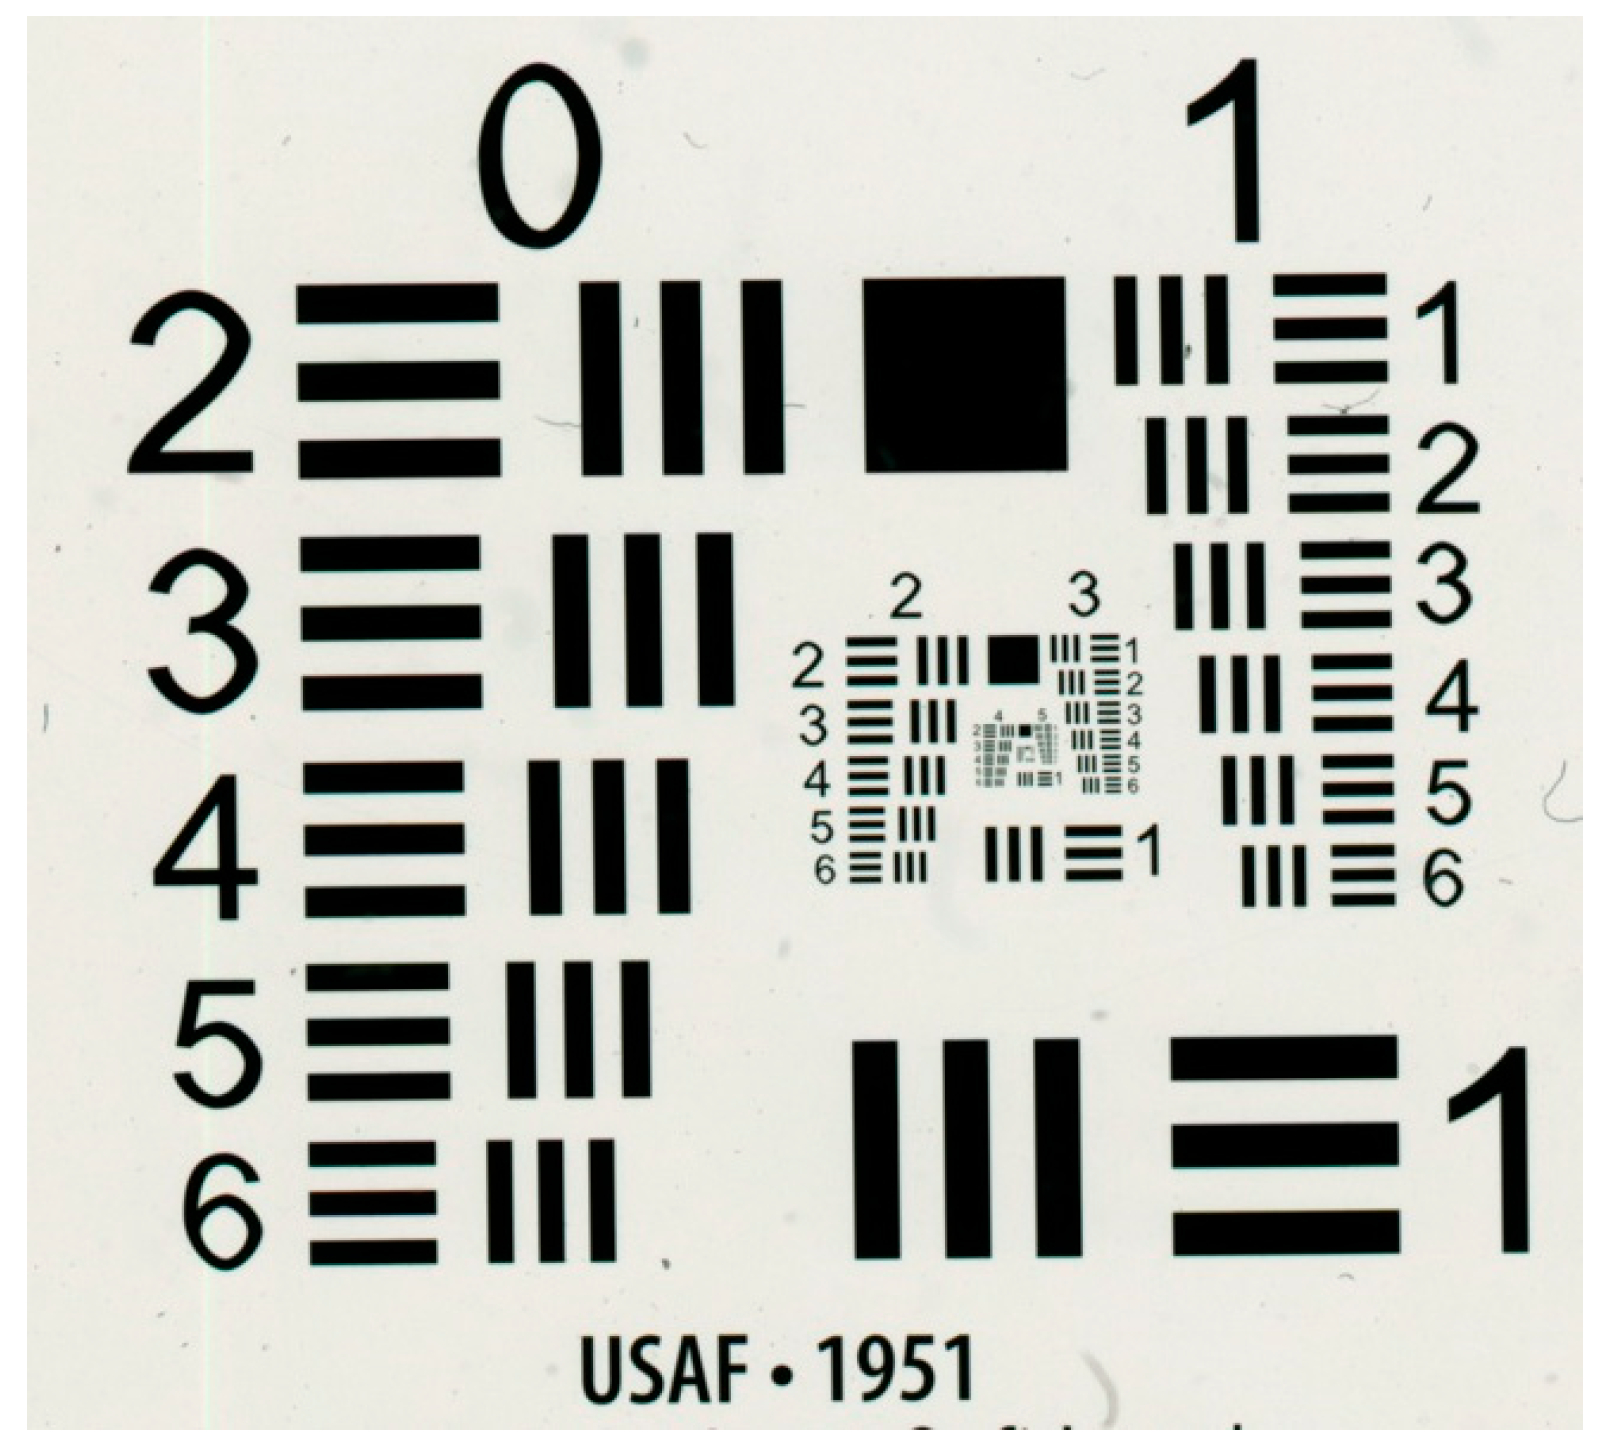
| USAF1951 | 3.637 | 3.76 | 12.421 | 5.73 |
| Daylight | 4.418 | 2.178 | 5.328 | 1.928 |
| Low light (evening) | 7.56 | 3.803 | 16.794 | 3.033 |
| Daylight (far distance) | 4.57 | 4.11 | 4.68 | 3.99 |
| Open view | 4.76 | 3.42 | 4.44 | 2.99 |
| Pair Images | MSE | PSNR | UIQI |
|---|---|---|---|
| USAF1951 150 original/150 enhanced | 0.013 | 18.846 | 0.826 |
| USAF1951 180 original/180 enhanced | 0.004 | 23.947 | 0.954 |
| Daylight 150 original/150 enhanced | 0.036 | 14.041 | 0.787 |
| Daylight 180 original/180 enhanced | 0.045 | 13.44 | 0.751 |
| Low light (evening) 150 original/150 enhanced | 0.014 | 18.42 | 0.902 |
| Low light (evening) 180 original/180 enhanced | 0.019 | 17.05 | 0.775 |
| Daylight (far distance) 150 original/150 enhanced | 0.002 | 28.02 | 0.987 |
| Daylight (far distance) 180 original/180 enhanced | 0.001 | 30.14 | 0.99 |
| Open view 150 original/150 enhanced | 0.007 | 21.64 | 0.925 |
| Open view 180 original/180 enhanced | 0.003 | 24.89 | 0.97 |
Disclaimer/Publisher’s Note: The statements, opinions and data contained in all publications are solely those of the individual author(s) and contributor(s) and not of MDPI and/or the editor(s). MDPI and/or the editor(s) disclaim responsibility for any injury to people or property resulting from any ideas, methods, instructions or products referred to in the content. |
© 2025 by the authors. Licensee MDPI, Basel, Switzerland. This article is an open access article distributed under the terms and conditions of the Creative Commons Attribution (CC BY) license (https://creativecommons.org/licenses/by/4.0/).
Share and Cite
Zadok, M.; Zalevsky, Z.; Milgrom, B. AI-Based Enhancing of xBn MWIR Thermal Camera Performance at 180 Kelvin. Sensors 2025, 25, 3200. https://doi.org/10.3390/s25103200
Zadok M, Zalevsky Z, Milgrom B. AI-Based Enhancing of xBn MWIR Thermal Camera Performance at 180 Kelvin. Sensors. 2025; 25(10):3200. https://doi.org/10.3390/s25103200
Chicago/Turabian StyleZadok, Michael, Zeev Zalevsky, and Benjamin Milgrom. 2025. "AI-Based Enhancing of xBn MWIR Thermal Camera Performance at 180 Kelvin" Sensors 25, no. 10: 3200. https://doi.org/10.3390/s25103200
APA StyleZadok, M., Zalevsky, Z., & Milgrom, B. (2025). AI-Based Enhancing of xBn MWIR Thermal Camera Performance at 180 Kelvin. Sensors, 25(10), 3200. https://doi.org/10.3390/s25103200