Highly Sensitive Pressure Transducer for Measuring Arterial Pulse Wave Velocity Based on Giant Magneto-Impedance Sensors


Abstract
Highlights
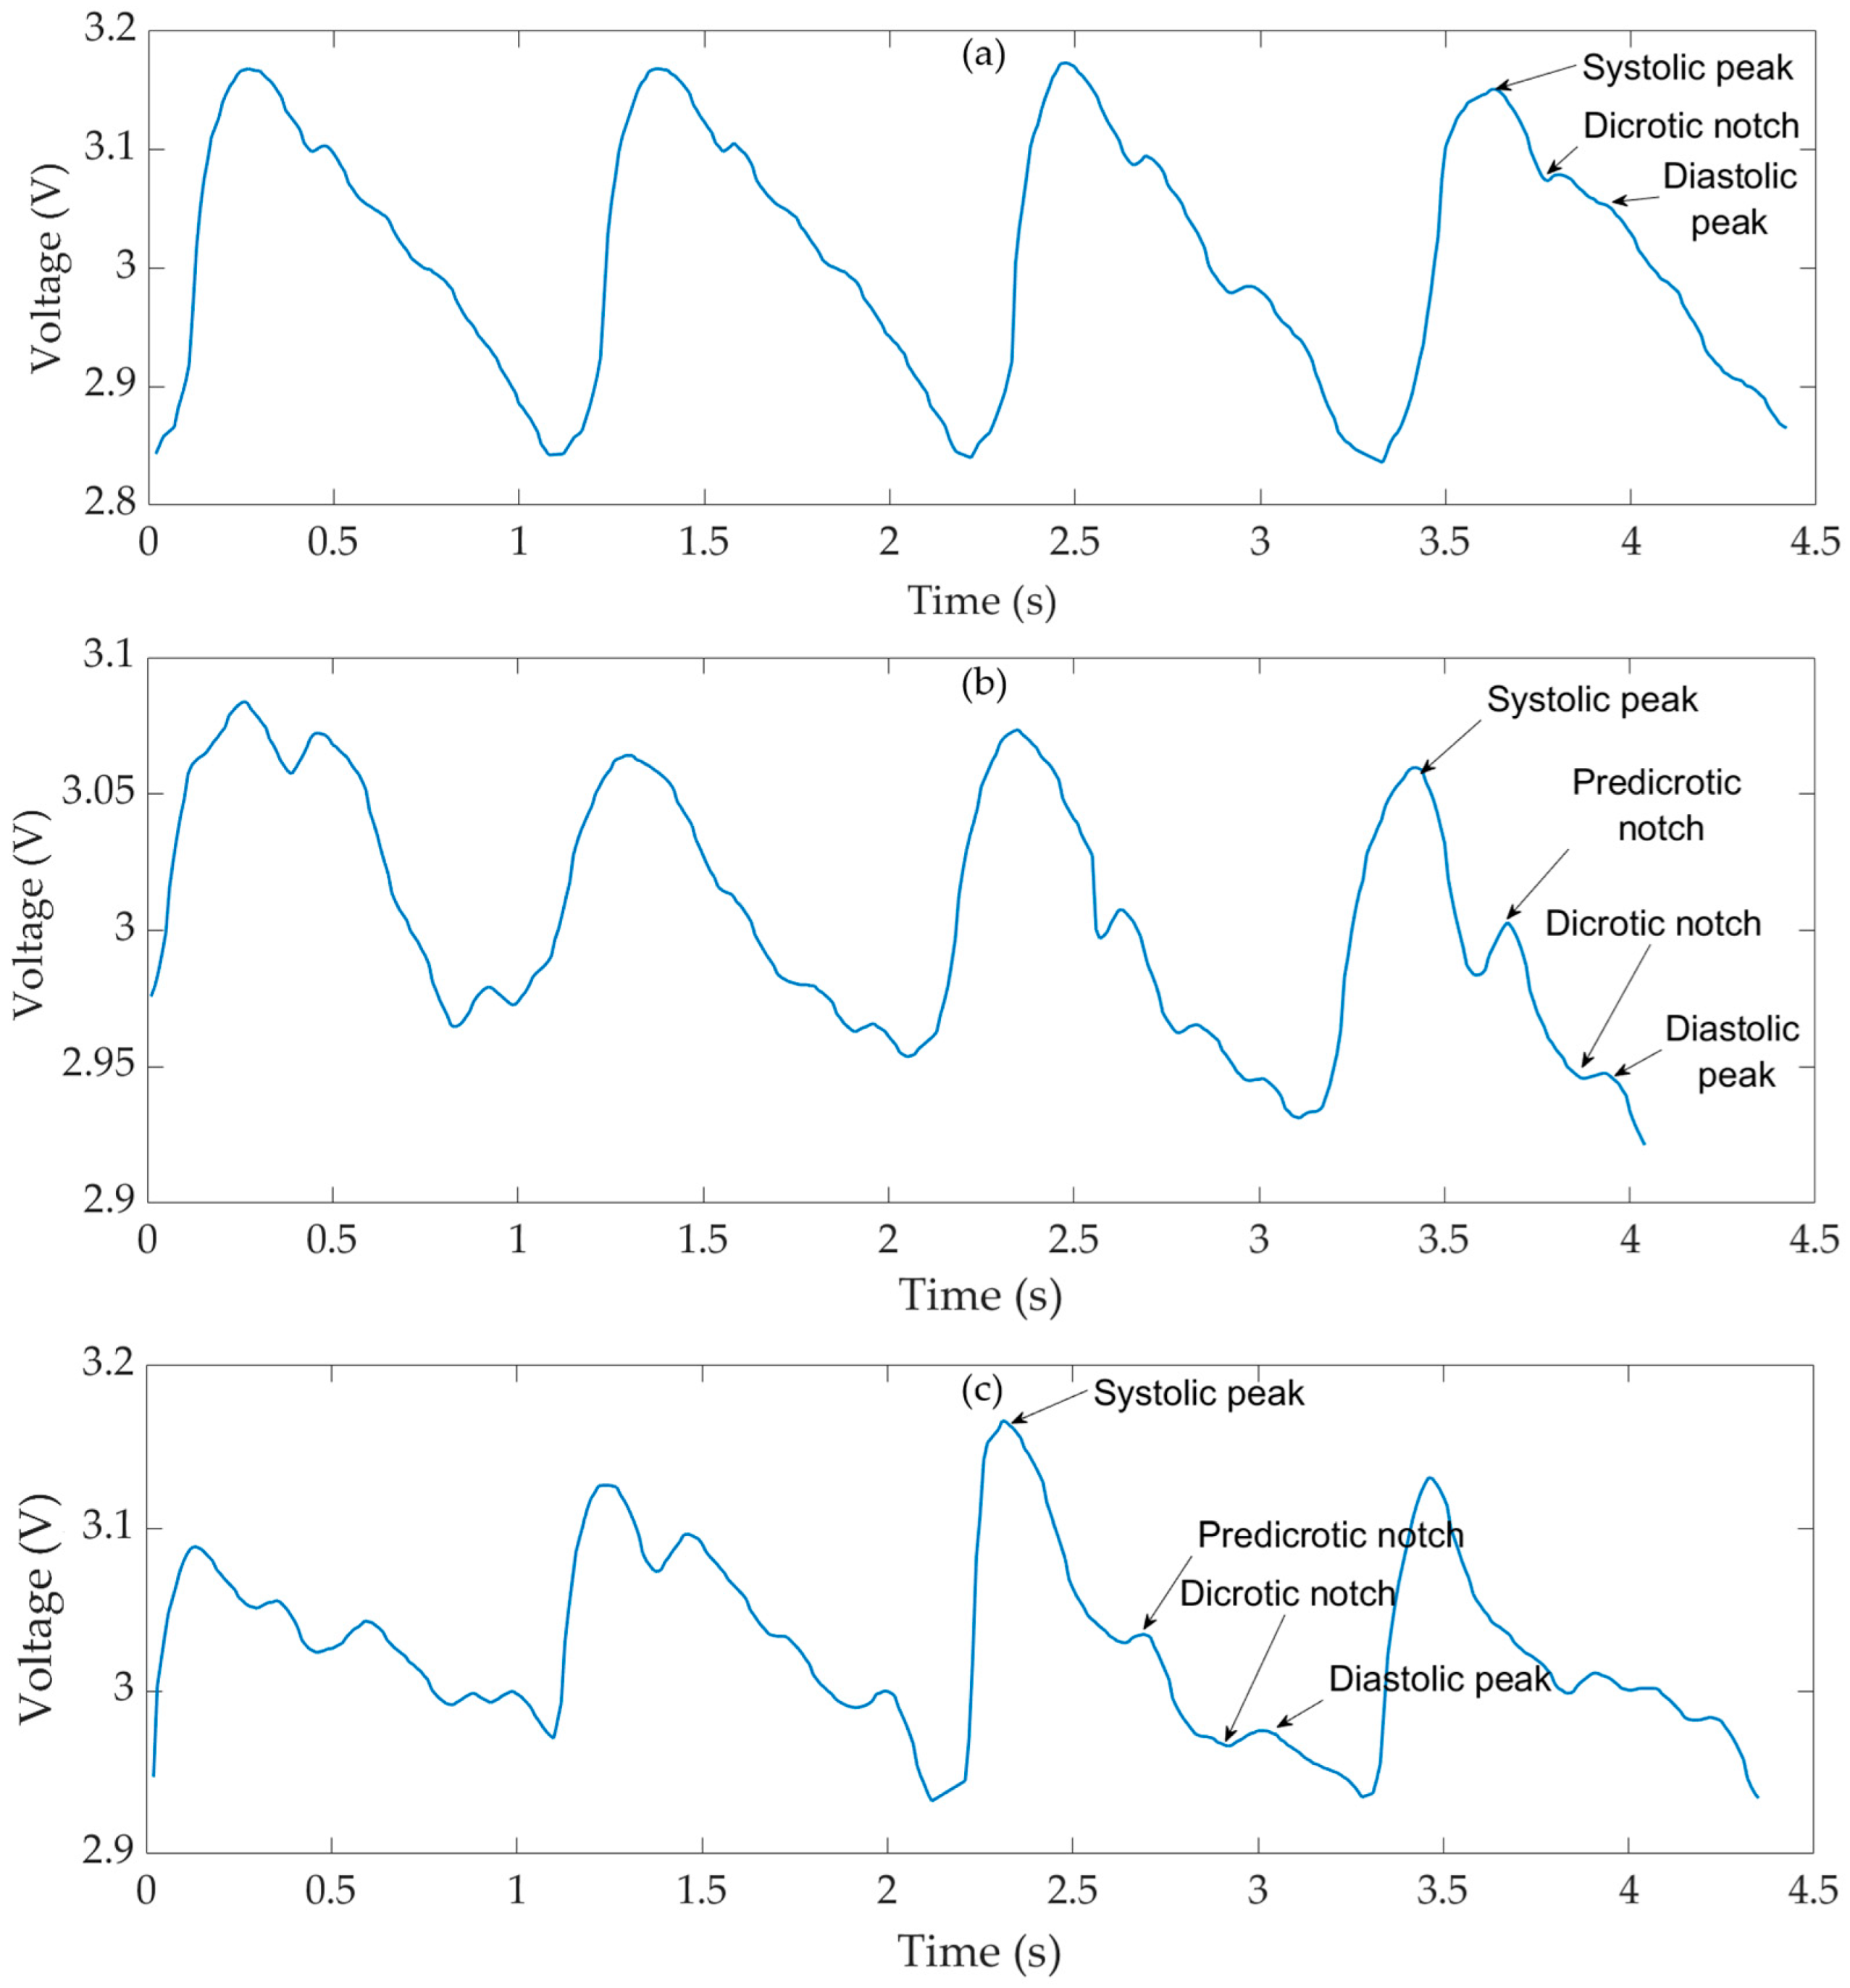
- The developed GMI-based magnetometer successfully captures arterial pulse waveforms and estimates pulse wave velocity (PWV) with high sensitivity and resolution.
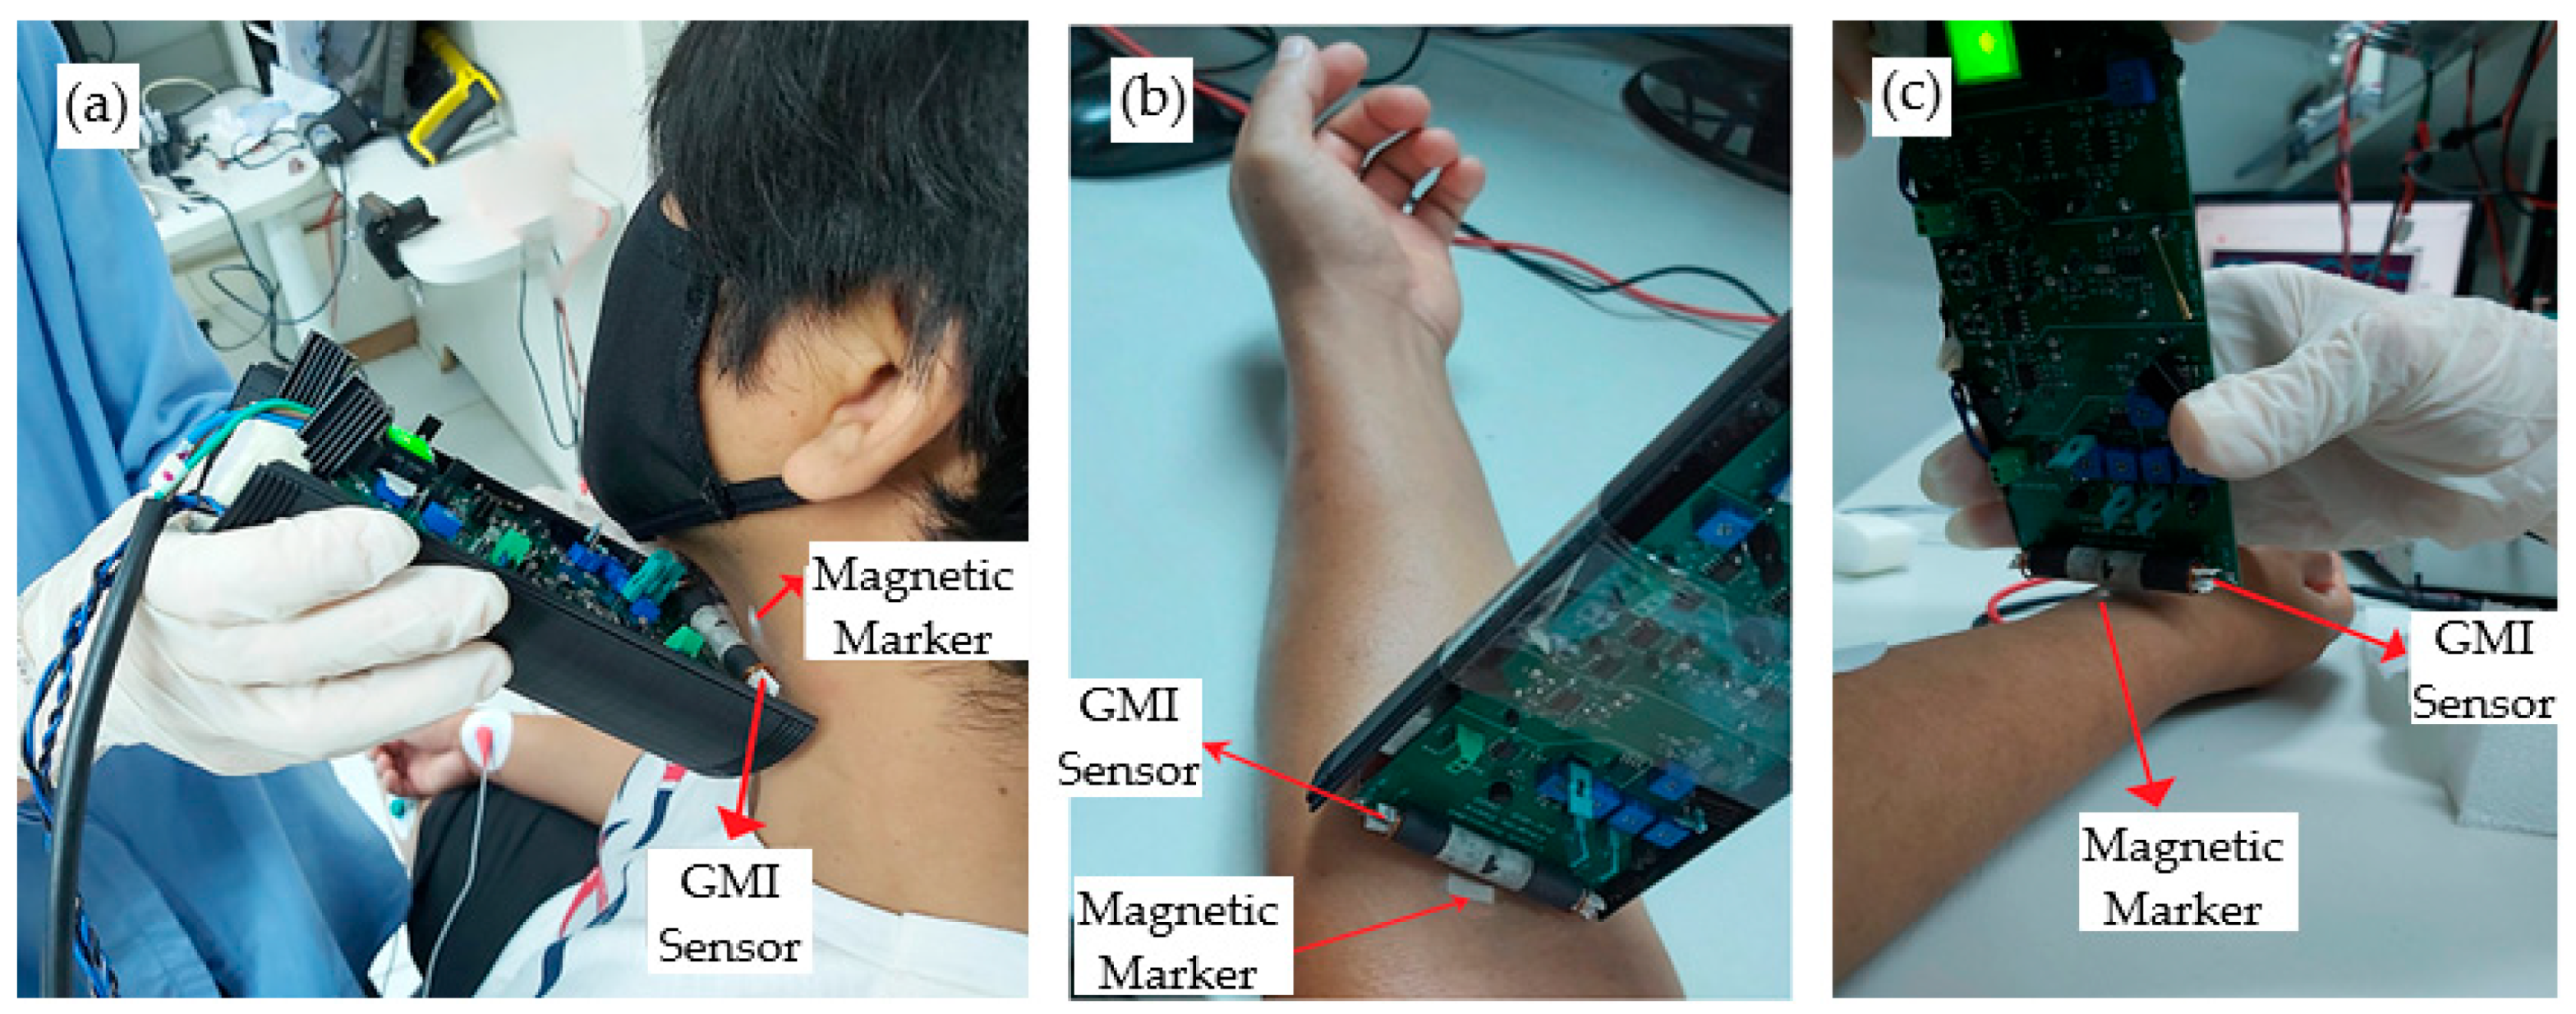
- A contactless approach using magnetic markers and phase-sensitive GMI sensors was tested in a proof-of-concept setup for simultaneous pulse wave acquisition at multiple arterial sites.
- This innovation provides a safe, non-invasive, and cost-effective alternative to conventional pressure transducers for cardiovascular monitoring, unaffected by influences associated with conventional measuring approaches caused by factors such as the angle and amplitude of the incident force of contact between the probe and the skin, the probe’s dimension, and optical aspects.
- The proposed system has the potential to enhance clinical diagnostics and expand access to cardiovascular assessment tools.
Abstract
1. Introduction
2. Arterial Pulse Wave Velocity
3. GMI Transducer
3.1. Experimental Characterization of the GMI Sensor
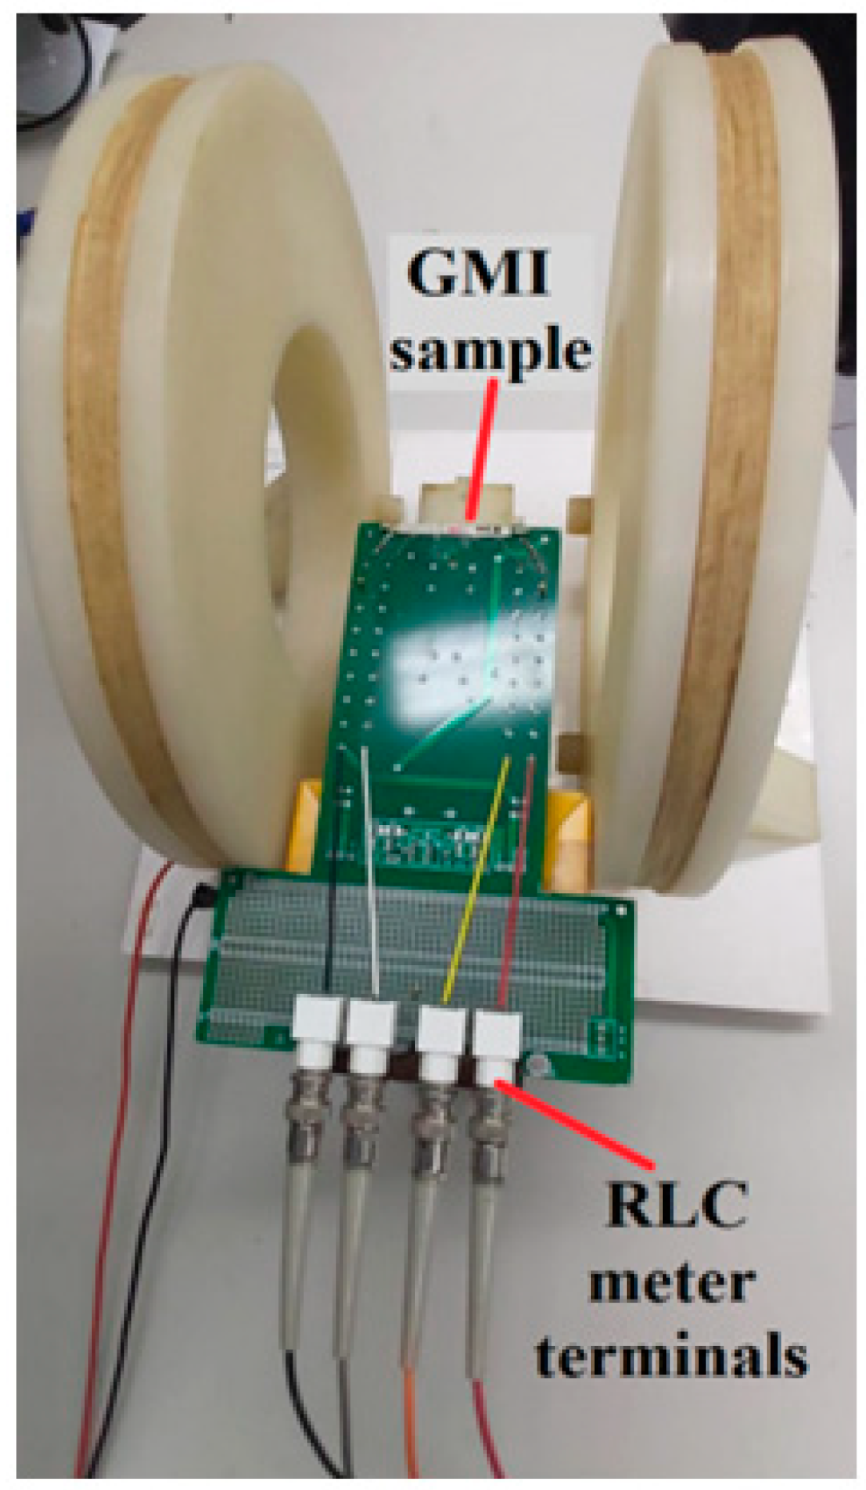
3.1.1. GMI Sample Characterization System
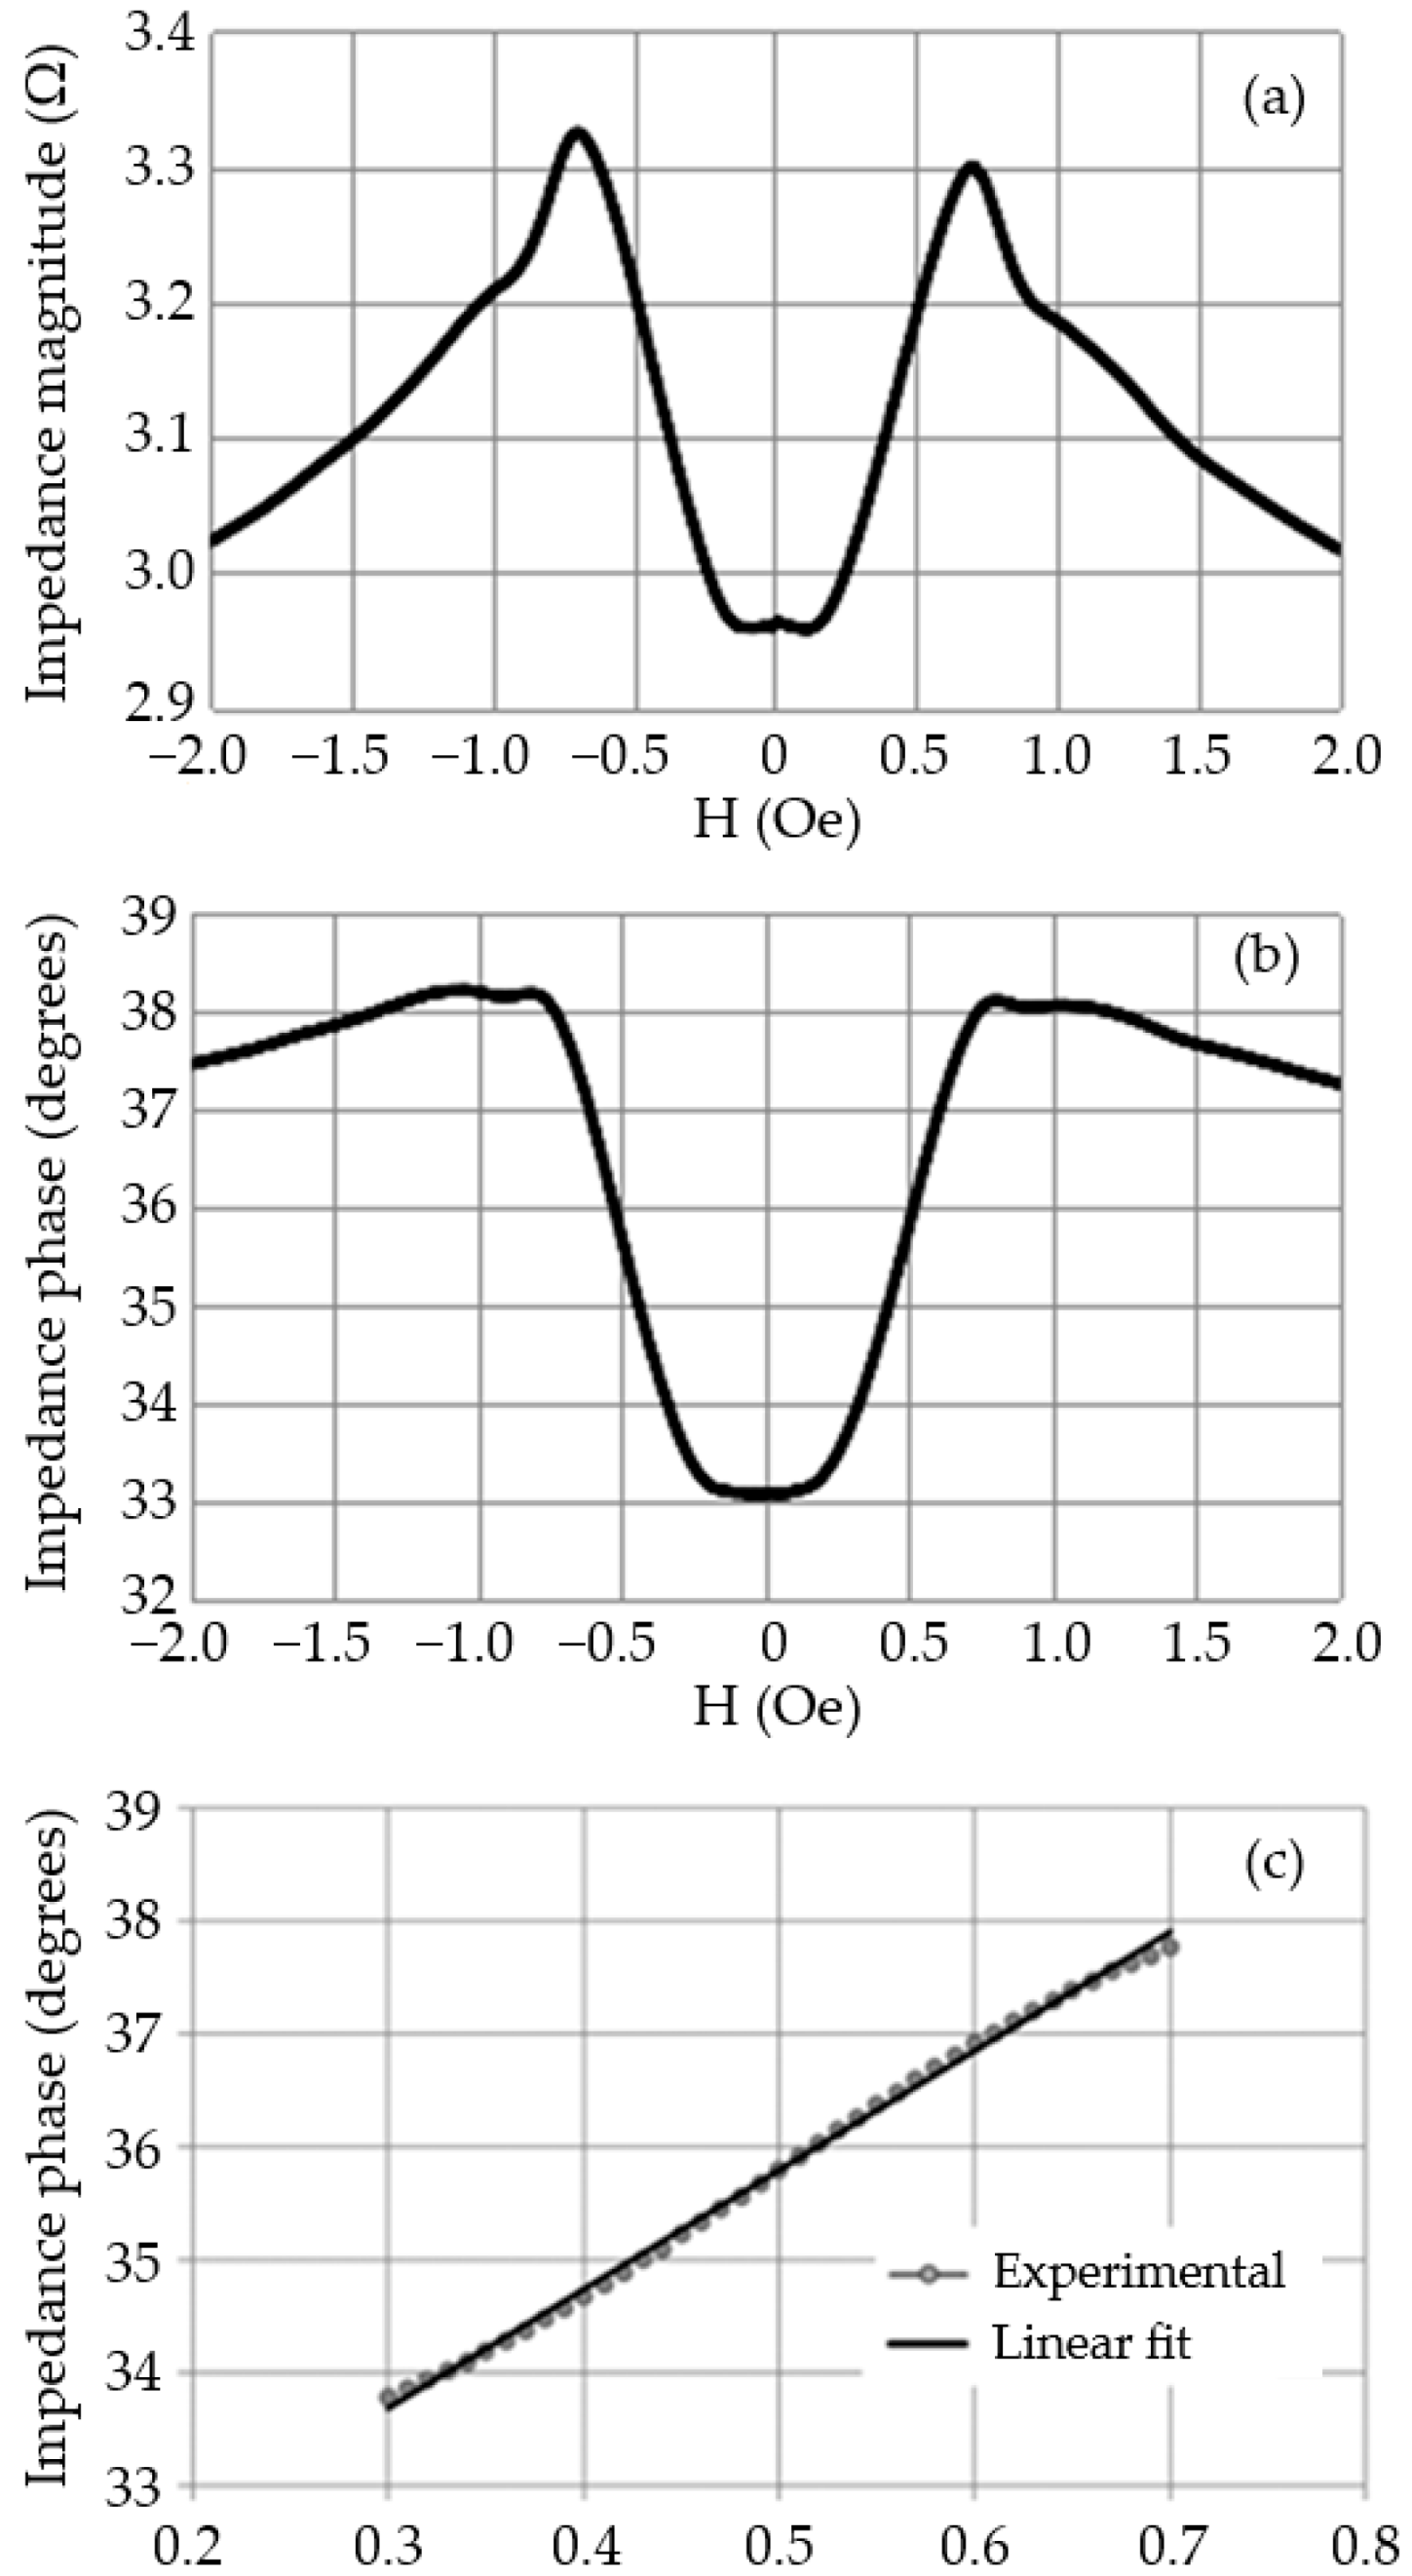
3.1.2. Experimental Characterization
3.1.3. GMI Sample Electrical Model
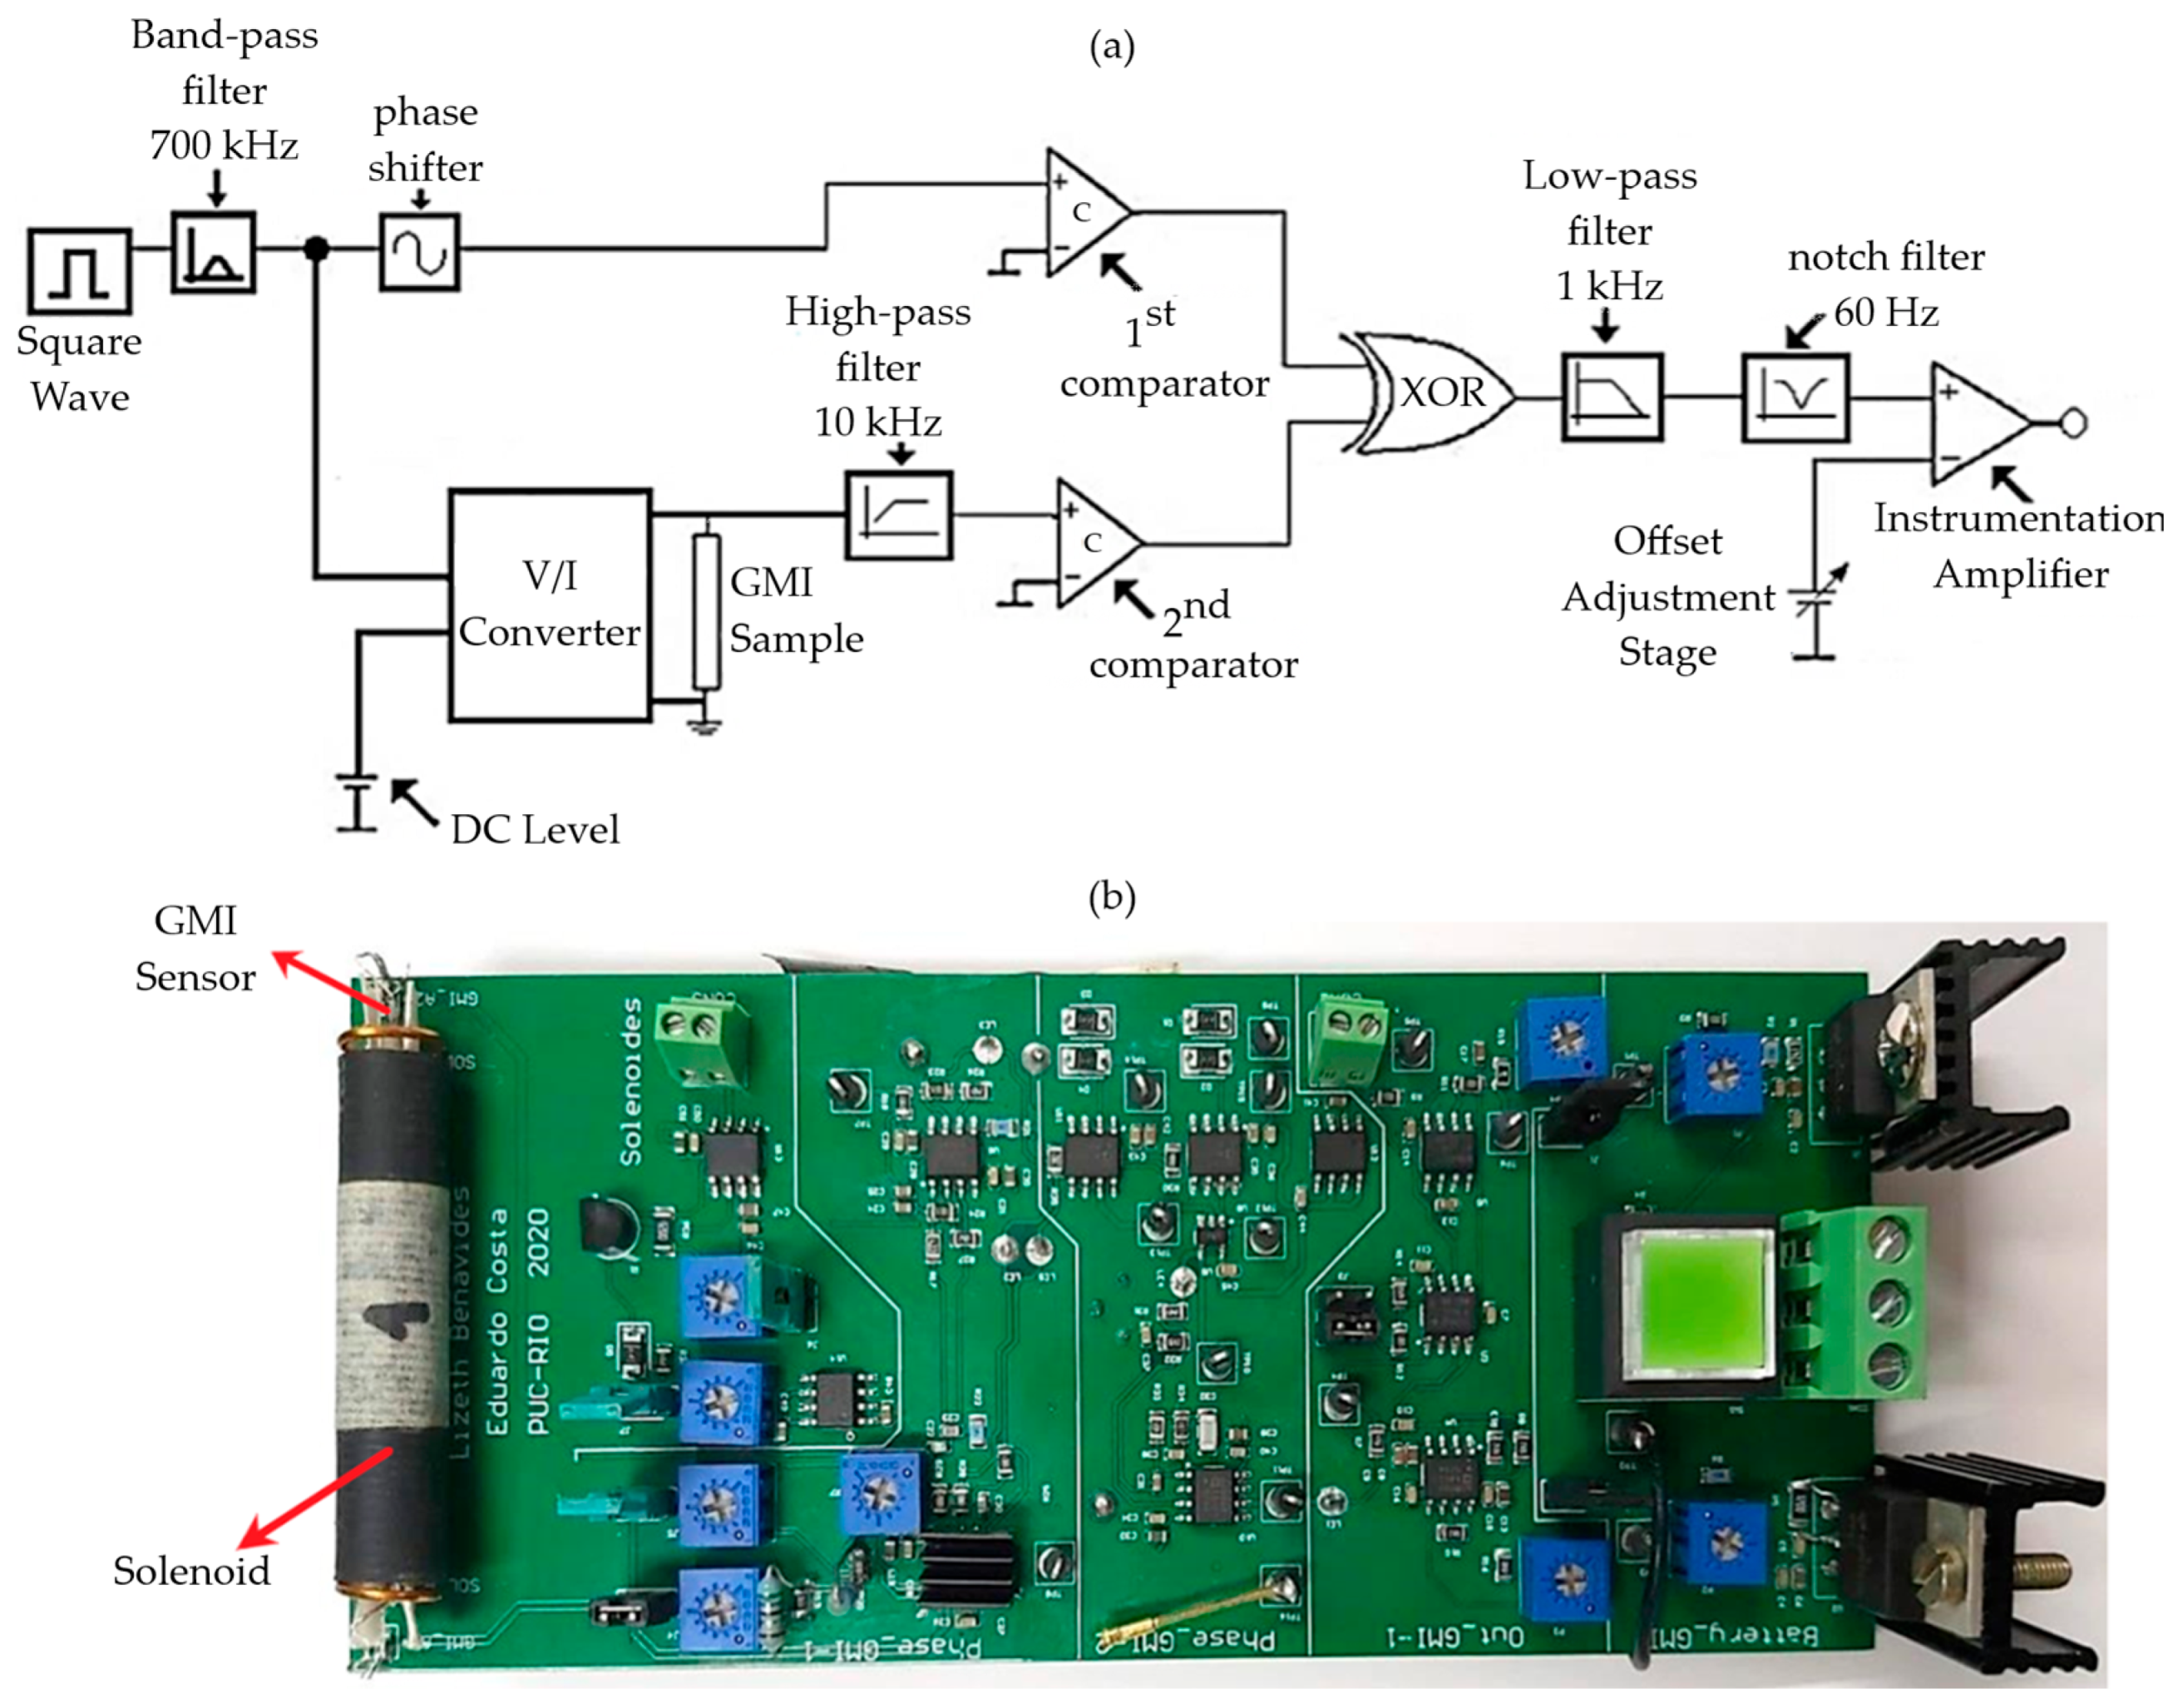
3.2. Electronic Transduction Circuit
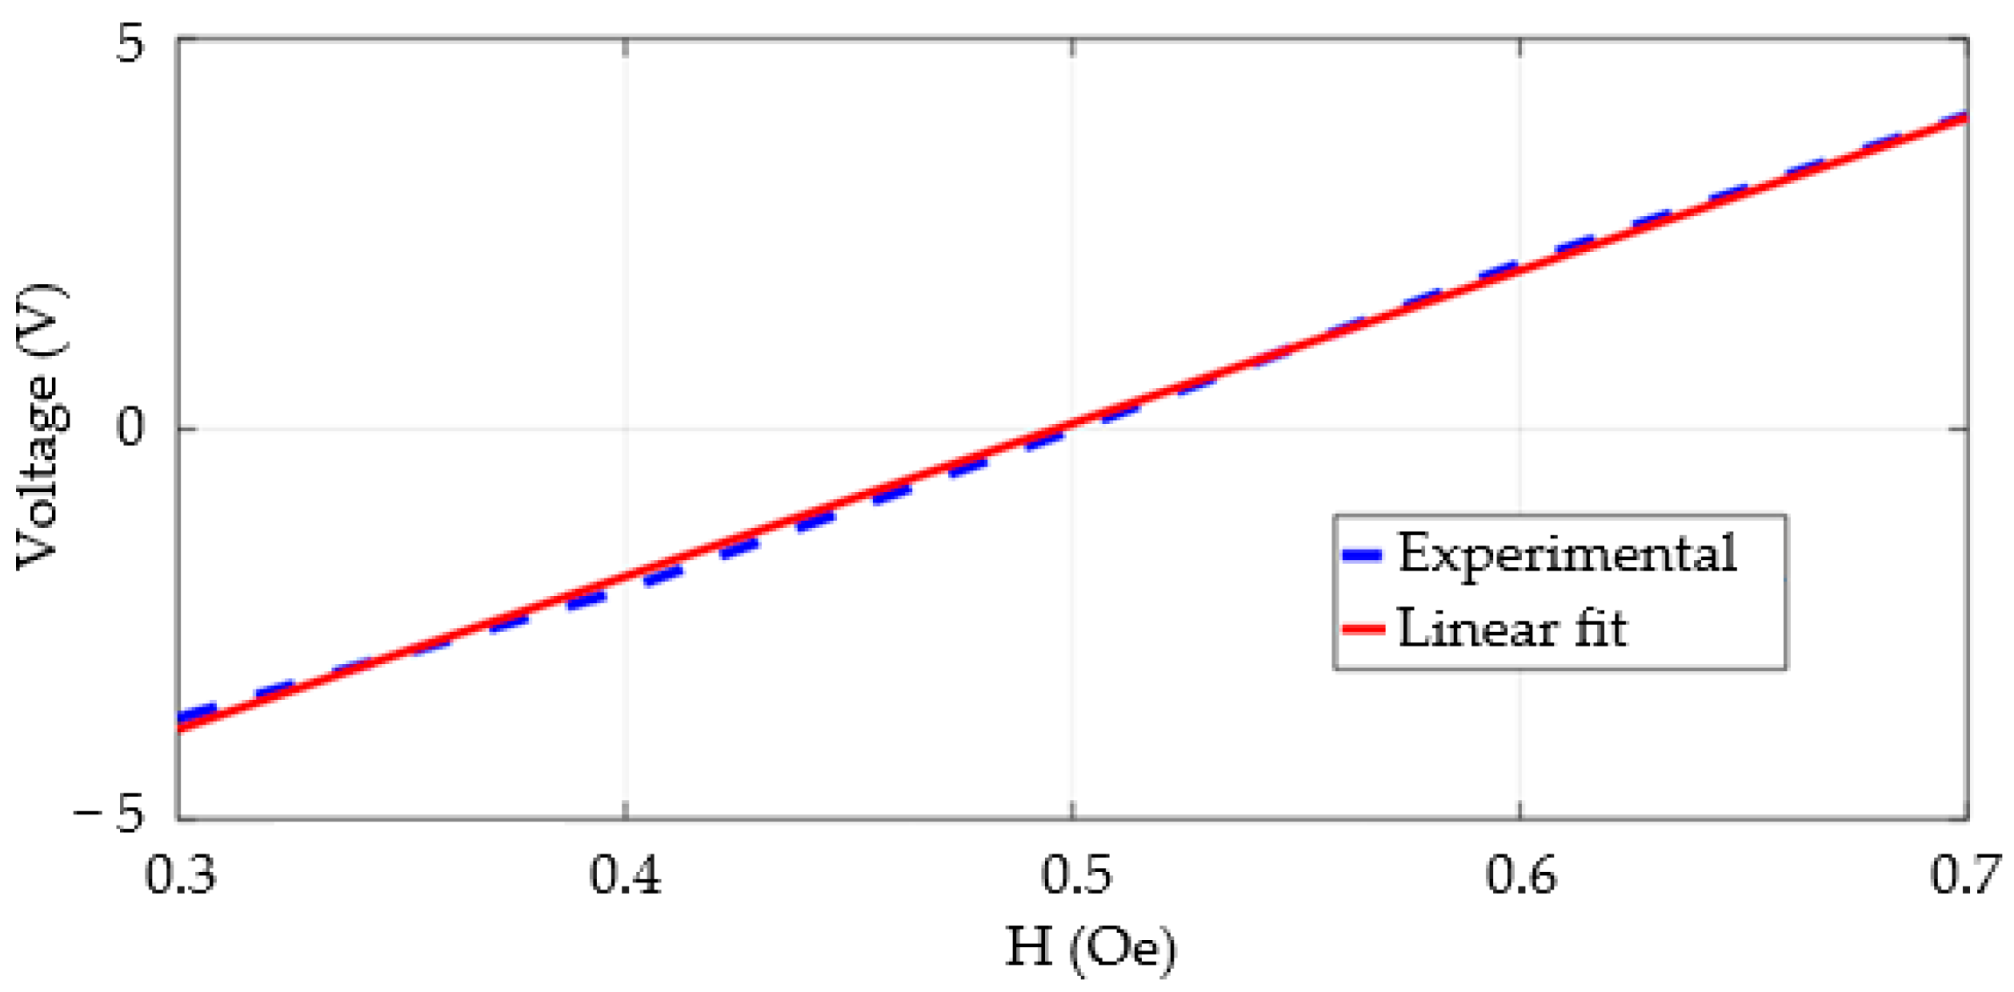
3.3. Sensitivity and Linearity
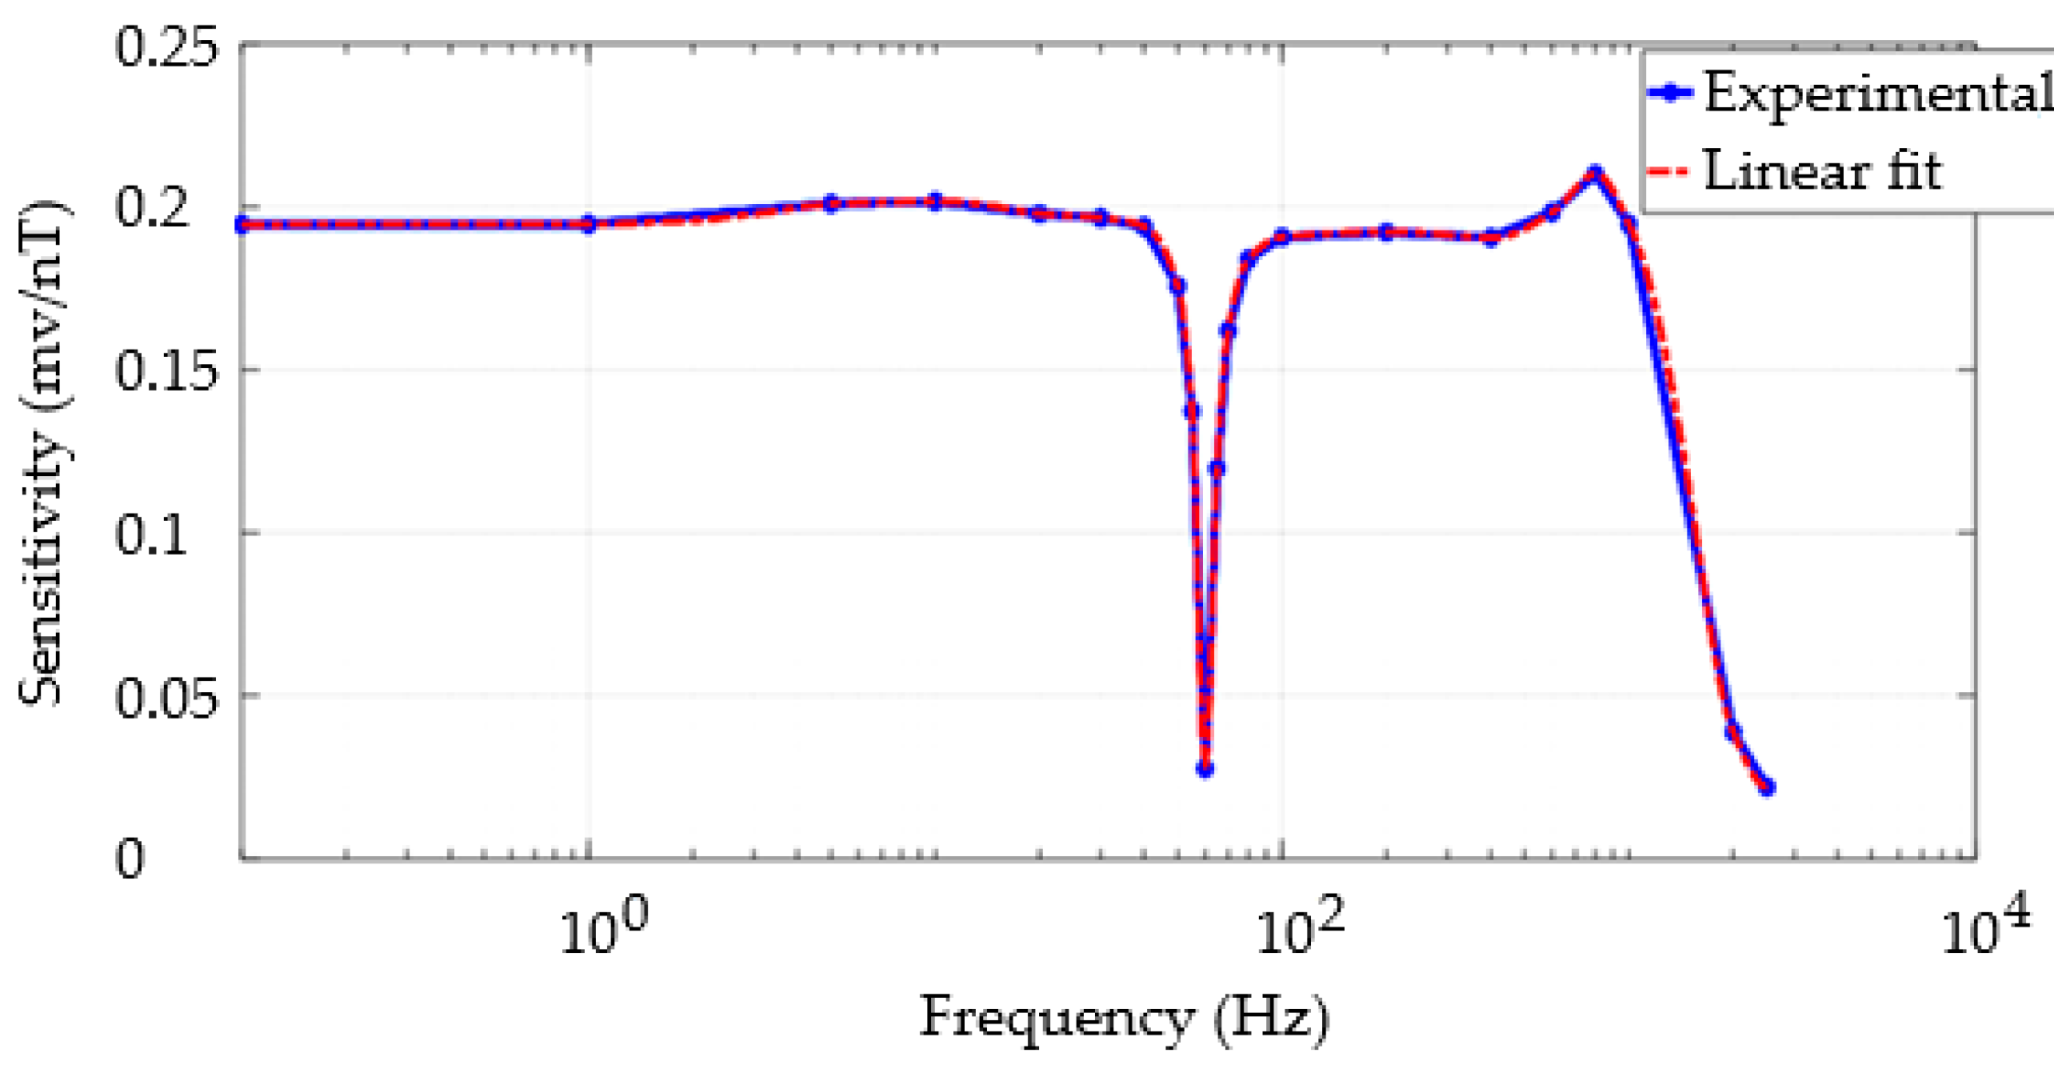
3.4. Frequency Response
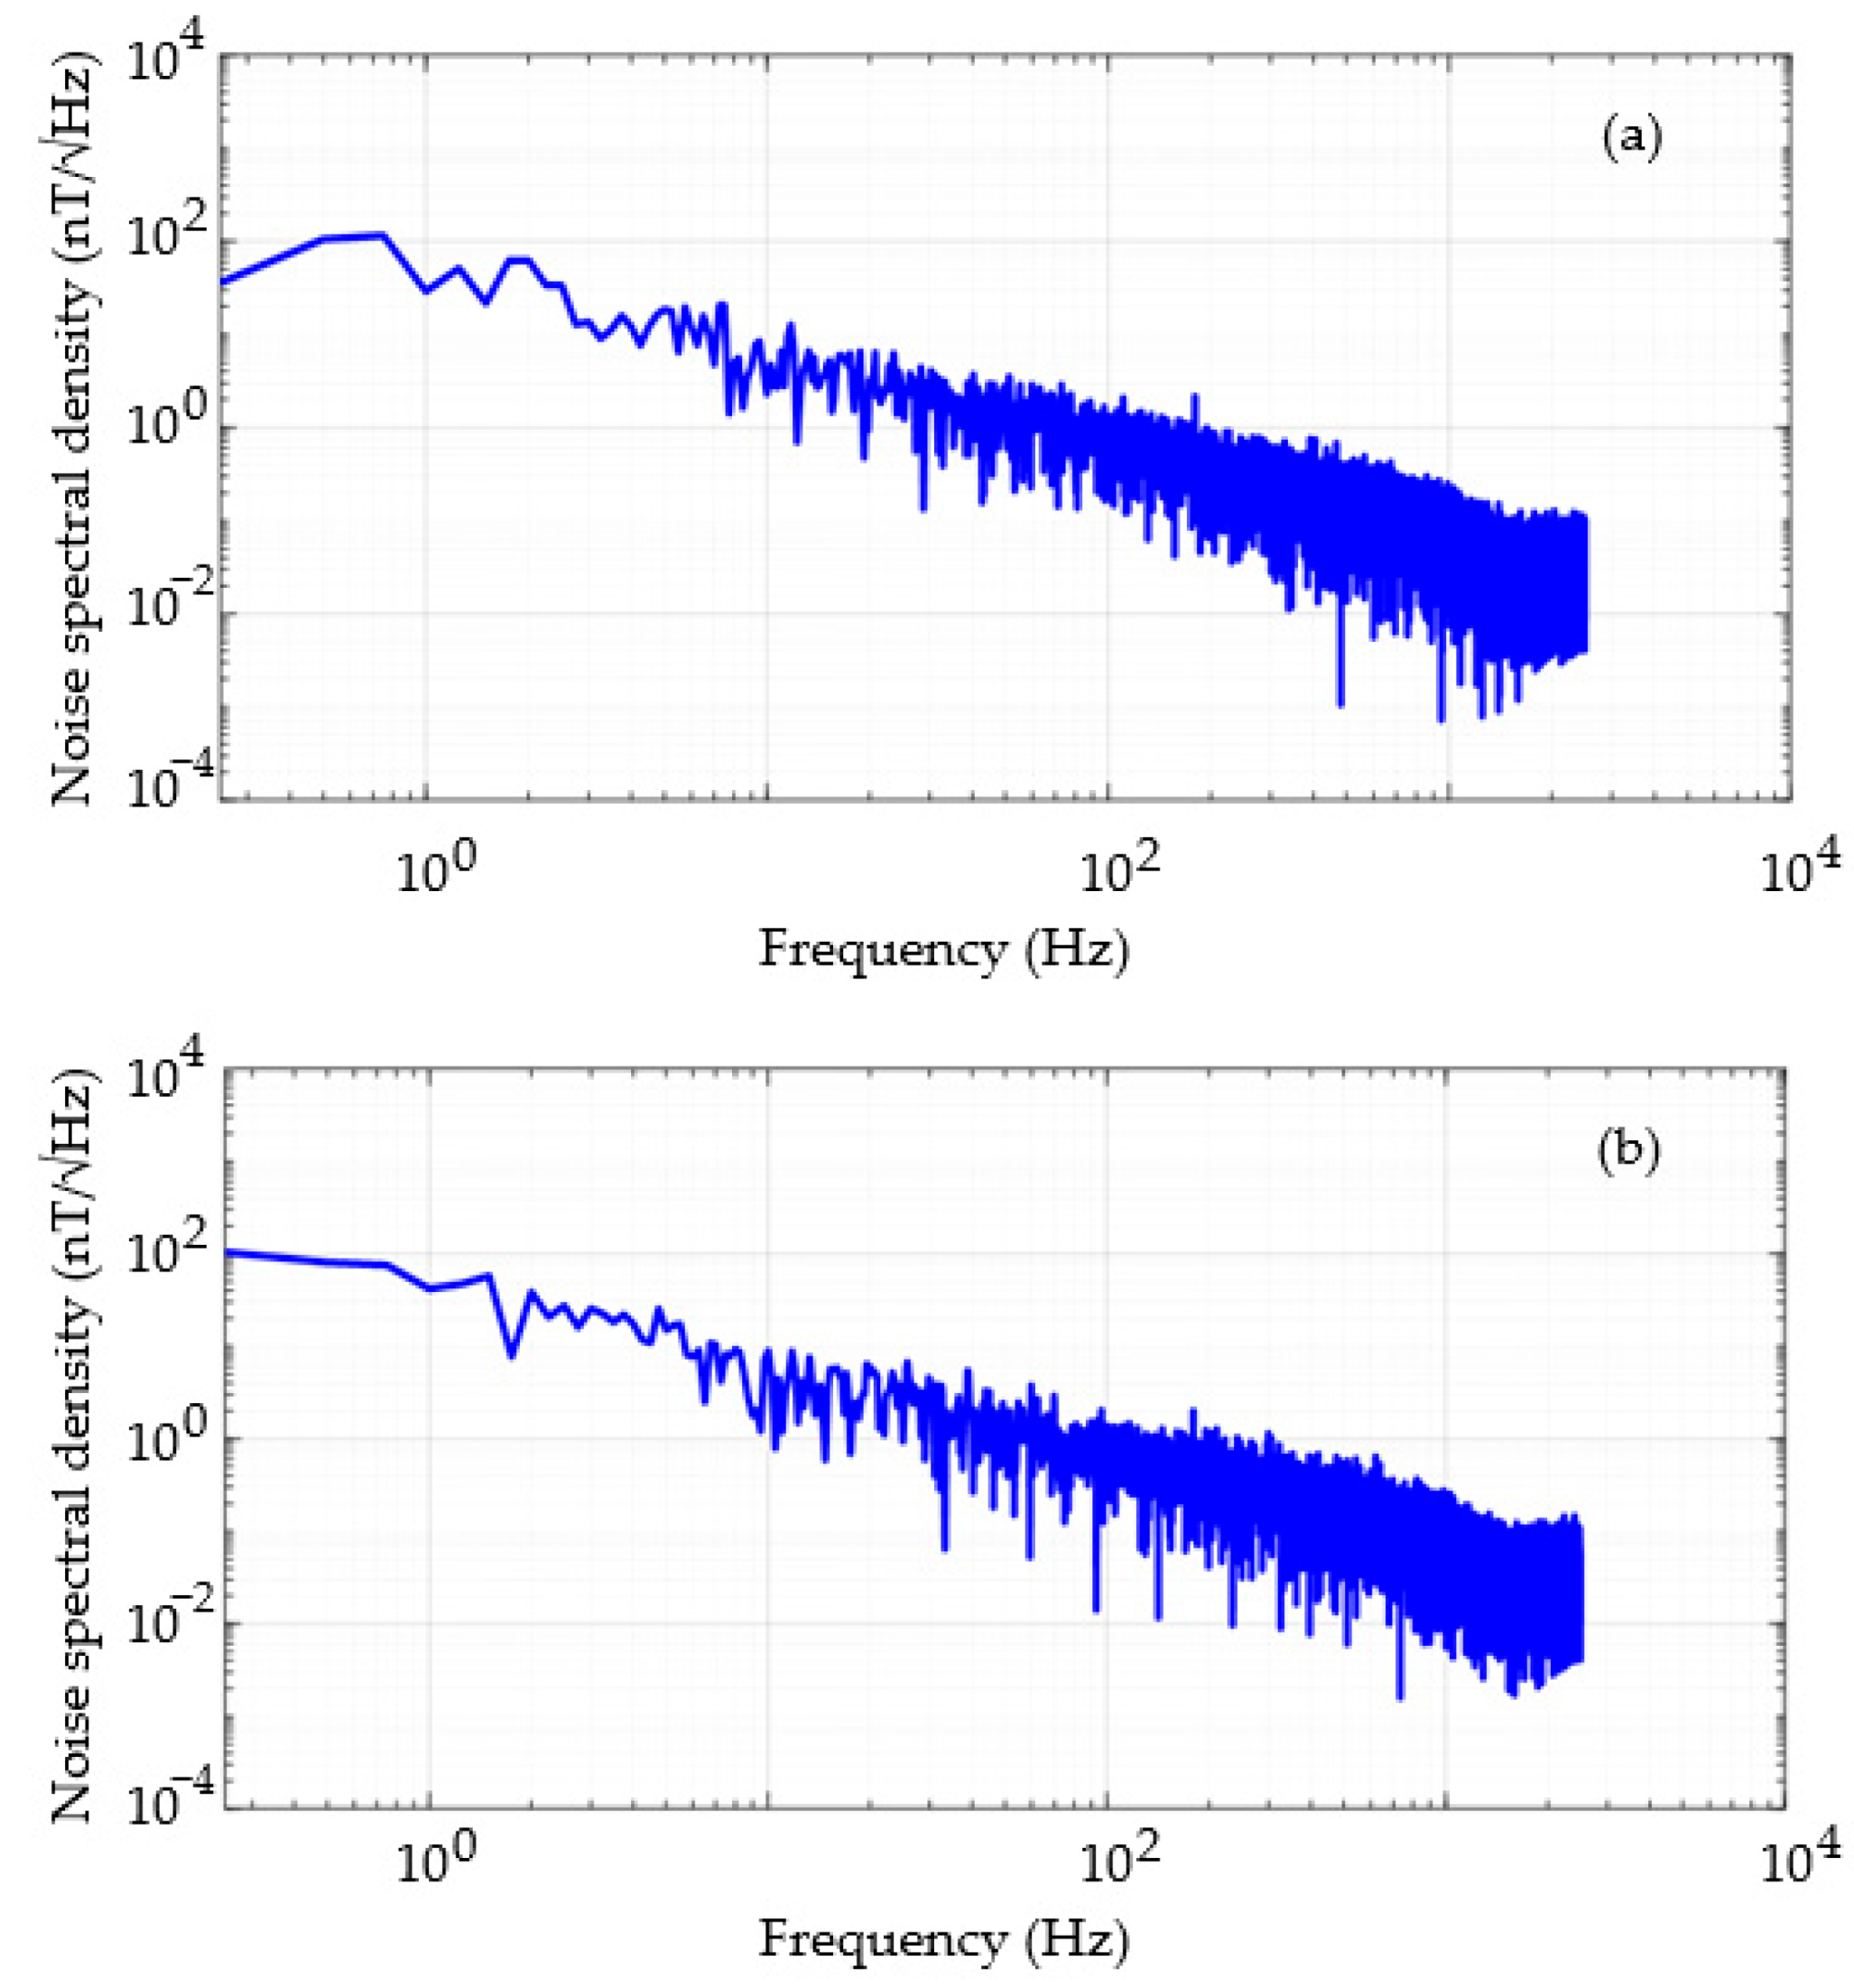
3.5. Noise Analysis and Resolution
4. Pulse Wave Measurements
5. Estimation of Pulse Wave Velocity (PWV)
6. Conclusions
Author Contributions
Funding
Institutional Review Board Statement
Informed Consent Statement
Data Availability Statement
Acknowledgments
Conflicts of Interest
References
- World Health Organization. Global Status Report on Noncommunicable Diseases 2010; World Health Organization: Geneva, Switzerland, 2011. [Google Scholar]
- Salvi, P. Pulse Waves: How Vascular Hemodynamics Affects Blood Pressure, 2nd ed.; Springer: Cham, Switzerland, 2017. [Google Scholar]
- Mattace-Raso, F.U.S.; Hofman, A.; Verwoert, G.C.; Witteman, J.C.M.; Wilkinson, I.; Cockcroft, J.; McEniery, C.; Yasmin; Laurent, S.; Boutouyrie, P.; et al. Determinants of pulse wave velocity in healthy people and in the presence of cardiovascular risk factors: ‘Establishing normal and reference values’. Eur. Heart J. 2010, 31, 2338–2350. [Google Scholar]
- Williams, B.; Mancia, G.; Spiering, W.; Agabiti Rosei, E.; Azizi, M.; Burnier, M.; Clem-ent, D.L.; Coca, A.; de Simone, G.; Dominiczak, A.; et al. 2018 ESC/ESH Guidelines for the management of arterial hypertension. Eur. Heart J. 2018, 39, 3021–3104. [Google Scholar] [CrossRef]
- Kim, H.L.; Kim, S.H. Pulse Wave Velocity in Atherosclerosis. Front. Cardiovasc. Med. 2019, 6, 41. [Google Scholar] [CrossRef]
- Castelli, R.; Gidaro, A.; Casu, G.; Merella, P.; Profili, N.I.; Donadoni, M.; Maioli, M.; Delitala, A.P. Aging of the Arterial System. Int. J. Mol. Sci. 2023, 24, 6910. [Google Scholar] [CrossRef]
- Woolam, G.L.; Schnur, P.L.; Vallbona, C.; Hoff, H.E. The pulse wave velocity as an early indicator of atherosclerosis in diabetic subjects. Circulation 1962, 25, 533–539. [Google Scholar] [CrossRef]
- Kis, É.; Cseprekál, O.; Horváth, Z.; Katona, G.; Fekete, B.C.; Hrapka, E.; Szabó, A.; Szabó, A.J.; Fekete, A.; Reusz, G.S. Pulse wave velocity in end-stage renal disease: Influence of age and body dimensions. Pediatr. Res. 2008, 63, 95–98. [Google Scholar] [CrossRef]
- Yang, H.-H.; Chen, Y.-C.; Ho, C.-C.; Hsu, B.-G. Serum Phenylacetylglutamine among Potential Risk Factors for Arterial Stiffness Measuring by Carotid–Femoral Pulse Wave Velocity in Patients with Kidney Transplantation. Toxins 2024, 16, 111. [Google Scholar] [CrossRef]
- Sharma, R.K.; Kamble, S.H.; Krishnan, S.; Liu, I.-C.; Gumz, M.L.; Gomes, J.; To, B.; Li, S.; Mohandas, R. Involvement of lysyl oxidase in the pathogenesis of arterial stiffness in chronic kidney disease. Am. J. Physiol. Renal Physiol. 2023, 324, F364–F373. [Google Scholar] [CrossRef]
- Lever-Megina, C.G.; Cavero-Redondo, I.; Saz-Lara, A.; Martínez-Vizcaíno, V.; Álvarez-Bueno, C. Association between pulse wave velocity and cerebral microbleeds: A systematic review and meta-analysis. Hypertens. Res. 2025, 48, 314–326. [Google Scholar] [CrossRef]
- Wang, H.; Wang, L.; Sun, N.; Yao, Y.; Hao, L.; Xu, L.; Greenwald, S.E. Quantitative Comparison of the Performance of Piezoresistive, Piezoelectric, Acceleration, and Optical Pulse Wave Sensors. Front. Physiol. 2020, 10, 1563. [Google Scholar] [CrossRef]
- Zieff, G.; Stone, K.; Paterson, C.; Fryer, S.; Diana, J.; Blackwell, J.; Meyer, M.L.; Stoner, L. Pulse-wave velocity assessments derived from a simple photoplethysmography device: Agreement with a referent device. Front. Cardiovasc. Med. 2023, 10, 1108219. [Google Scholar] [CrossRef] [PubMed]
- Silva, E.C.; Gusmão, L.A.P.; Barbosa, C.R.H.; Monteiro, E.C. Magnetic field transducers based on the phase characteristics of GMI sensors and aimed at biomedical applications. In Proceedings of the 13th International Conference on Biomedical Engineering IFMBE, Singapore, 3–6 December 2008; Springer: Berlin/Heidelberg, Germany, 2009; Volume 23. [Google Scholar]
- Phan, M.H.; Peng, H.X. Giant magnetoimpedance materials: Fundamentals and applications. Prog. Mater. Sci. 2008, 53, 323–420. [Google Scholar] [CrossRef]
- Costa Silva, E.; Gusmão, L.A.P.; Hall Barbosa, C.R.; Costa Monteiro, E.; Machado, F.L.A. High sensitivity giant magnetoimpedance (GMI) magnetic transducer: Magnitude versus phase sensing. Meas. Sci. Technol. 2011, 22, 035204. [Google Scholar] [CrossRef]
- Cabrera, L.; Costa Silva, E.; Costa Monteiro, E.; Barbosa, C.R.H. High Sensitivity Pressure Transducer based on the phase characteristics of GMI magnetic sensors. Meas. Sci. Technol. 2018, 29, 12. [Google Scholar]
- Cabrera, L.S.B.; Costa Silva, E.; Costa Monteiro, E. Pressure transducer based on the phase characteristics of GMI effect for measuring the arterial pulse wave. In Proceedings of the XXII World Congress of the International Measurement Confederation (IMEKO), Belfast, UK, 2018, 3–6 September 2018; pp. 1–4. [Google Scholar]
- Hill, R.D.; Smith, R. Examination of the extremities: Pulses, bruits, and phlebitis. In Clinical Methods: The History, Physical, and Laboratory Examinations, 3rd ed.; Walker, H.K., Hall, W.D., Hurst, J.W., Eds.; Butterworths: Boston, MA, USA, 1990. [Google Scholar]
- Drzewiecki, G.M.; Melbin, J.; Noordergraaf, A. Arterial tonometry: Review and analysis. J. Biomech. 1983, 16, 141–152. [Google Scholar] [CrossRef]
- Costa Monteiro, E.; Leon, L.F. Metrological Reliability of Medical Devices. J. Phys. Conf. Ser. 2015, 588, 012032. [Google Scholar] [CrossRef]
- Costa Monteiro, E.; Summers, R. Metrological requirements for biomedical device assessment and their ethical implications. Meas. Sens. 2022, 24, 100574. [Google Scholar] [CrossRef]
- Bramwell, J.C.; Hill, A.V. Velocity of transmission of the pulse-wave and elasticity of arteries. Lancet 1922, 199, 891–892. [Google Scholar] [CrossRef]
- Salvi, P. Pulse Waves: How Vascular Hemodynamics Affects Blood Pressure, 1st ed.; Springer: Milan, Italy, 2012. [Google Scholar]
- Salvi, P.; Magnani, E.; Valbusa, F.; Agnoletti, D.; Alecu, C.; Joly, L.; Benetos, A. Comparative study of methodologies for pulse wave velocity estimation. J. Hum. Hypertens. 2008, 22, 669–677. [Google Scholar] [CrossRef]
- Ribeiro, F.A.; Thoen, R.H.; Köhler, I.; Danzmann, L.C.; Torres, M.A.R. Síndrome metabólica: Complacência arterial e a velocidade de onda de pulso. Rev. Amrigs. 2012, 56, 75–80. [Google Scholar]
- Mitchell, G.F. Arterial stiffness and wave reflection: Biomarkers of cardiovascular risk. Artery Res. 2009, 3, 56–64. [Google Scholar] [CrossRef] [PubMed]
- Elias, M.F.; Robbins, M.A.; Budge, M.M.; Abhayaratna, W.P.; Dore, G.A.; Elias, P.K. Arterial pulse wave velocity and cognition with advancing age. Hypertension 2009, 53, 668–673. [Google Scholar] [CrossRef] [PubMed]
- Jannasz, I.; Sondej, T.; Targowski, T.; Mańczak, M.; Obiała, K.; Dobrowolski, A.P.; Olszewski, R. Relationship between the Central and Regional Pulse Wave Velocity in the Assessment of Arterial Stiffness Depending on Gender in the Geriatric Population. Sensors 2023, 23, 5823. [Google Scholar] [CrossRef] [PubMed]
- Asmar, R.; Benetos, A.; Topouchian, J.; Laurent, P.; Pannier, B.; Brisac, A.M.; Target, R.; Levy, B.I. Assessment of arterial distensibility by automatic pulse wave velocity measurement: Validation and clinical application studies. Hypertension 1995, 26, 485–490. [Google Scholar] [CrossRef]
- Wilkinson, I.B.; Fuchs, S.A.; Jansen, I.M.; Spratt, J.C.; Murray, G.D.; Cockcroft, J.R.; Webb, D.J. Reproducibility of pulse wave velocity and augmentation index measured by pulse wave analysis. J. Hypertens. 1998, 16, 2079–2084. [Google Scholar] [CrossRef]
- Van Bortel, L.M.; Laurent, S.; Boutouyrie, P.; Chowienczyk, P.; Cruickshank, J.K.; De Backer, T.; Filipovsky, J.; Huybrechts, S.; Mattace-Raso, F.U.S.; Protogerou, A.D.; et al. Expert consensus document on the measurement of aortic stiffness in daily practice using carotid-femoral pulse wave velocity. J. Hypertens. 2012, 30, 445–448. [Google Scholar] [CrossRef]
- Townsend, R.R. Arterial Stiffness: Recommendations and Standardization. Pulse 2016, 4, 3–7. [Google Scholar] [CrossRef]
- Horváth, I.G.; Németh, Á.; Lenkey, Z.; Alessandri, N.; Tufano, F.; Kis, P.; Gaszner, B.; Cziráki, A. Invasive validation of a new oscillometric device (Arteriograph) for measuring augmentation index, central blood pressure and aortic pulse wave velocity. J. Hypertens. 2010, 28, 2068–2075. [Google Scholar] [CrossRef]
- De Melis, M.; Morbiducci, U.; Scalise, L.; Tomasini, E.P.; Delbeke, D.; Baets, R.; Van Bortel, L.M.; Segers, P. A preliminary study for the evaluation of large artery stiffness: A non contact approach. Artery Res. 2008, 2, 100–101. [Google Scholar] [CrossRef]
- Pereira, T.; Correia, C.; Cardoso, J. Novel Methods for Pulse Wave Velocity Measurement. Med. Biol. Eng. 2015, 35, 555–565. [Google Scholar] [CrossRef]
- Benavides Mora, J.D.; Costa da Silva, E. Development of an automated system based on the concept of evolutionary hardware to determine the optimal operating point of GMI sensors. J. Phys. Conf. Ser. 2018, 1044, 012021. [Google Scholar] [CrossRef]
- Zheng, G.T.; Liu, Z.H.; Jiang, D.G. GMI effect of FeCoSiB amorphous ribbon. Adv. Mater. Res. 2010, 148–149, 644–648. [Google Scholar] [CrossRef]
- Mohri, K.; Kohzawa, T.; Kawashima, K.; Yoshida, H.; Panina, L.V. Magneto-Inductive effect (MI effect) in amorphous wires. IEEE Trans. Magn. 1992, 28, 3150–3152. [Google Scholar] [CrossRef]
- Yan, J.; Wang, Z.; Guo, R.; Yan, H.; Wang, Y.; Qiu, W. Blood pressure prediction based on multi-sensor information fusion of electrocardiogram, photoplethysmography, and pressure pulse waveform. Measurement 2025, 240, 115446. [Google Scholar] [CrossRef]

| Average | Resolution (nT) (0–1000 Hz) | Resolution (nT) @ 1 Hz | Resolution (nT) (0–30 Hz) | Resolution (nT) (1–30 Hz) |
|---|---|---|---|---|
| 10 | 106.712 | 29.01 | 105.525 | 68.952 |
| 30 | 93.105 | 41.55 | 91.829 | 62.067 |
| Magnetometer 2 | |
|---|---|
| Average GMI sample sensitivity (°/Oe) | 8.48 |
| Average sensitivity (V/Oe) | 16.64 |
| Bandwidth (Hz) | 1000 |
| Resolution (band 0–1000 Hz, avg 10) [nT] | 74.46 |
| Resolution (band 0–1000 Hz, avg 30) [nT] | 64.66 |
| Resolution (1 Hz, avg 10) [nT] | 33.89 |
| Resolution (1 Hz, avg 30) [nT] | 12.05 |
| Resolution (band 0–30 Hz, avg 10) [nT] | 72.31 |
| Resolution (band 0–30 Hz, avg 30) [nT] | 63.98 |
| Resolution (band 1–30 Hz, avg 10) [nT] | 35.39 |
| Resolution (band 1–30 Hz, avg 30) [nT] | 48.78 |
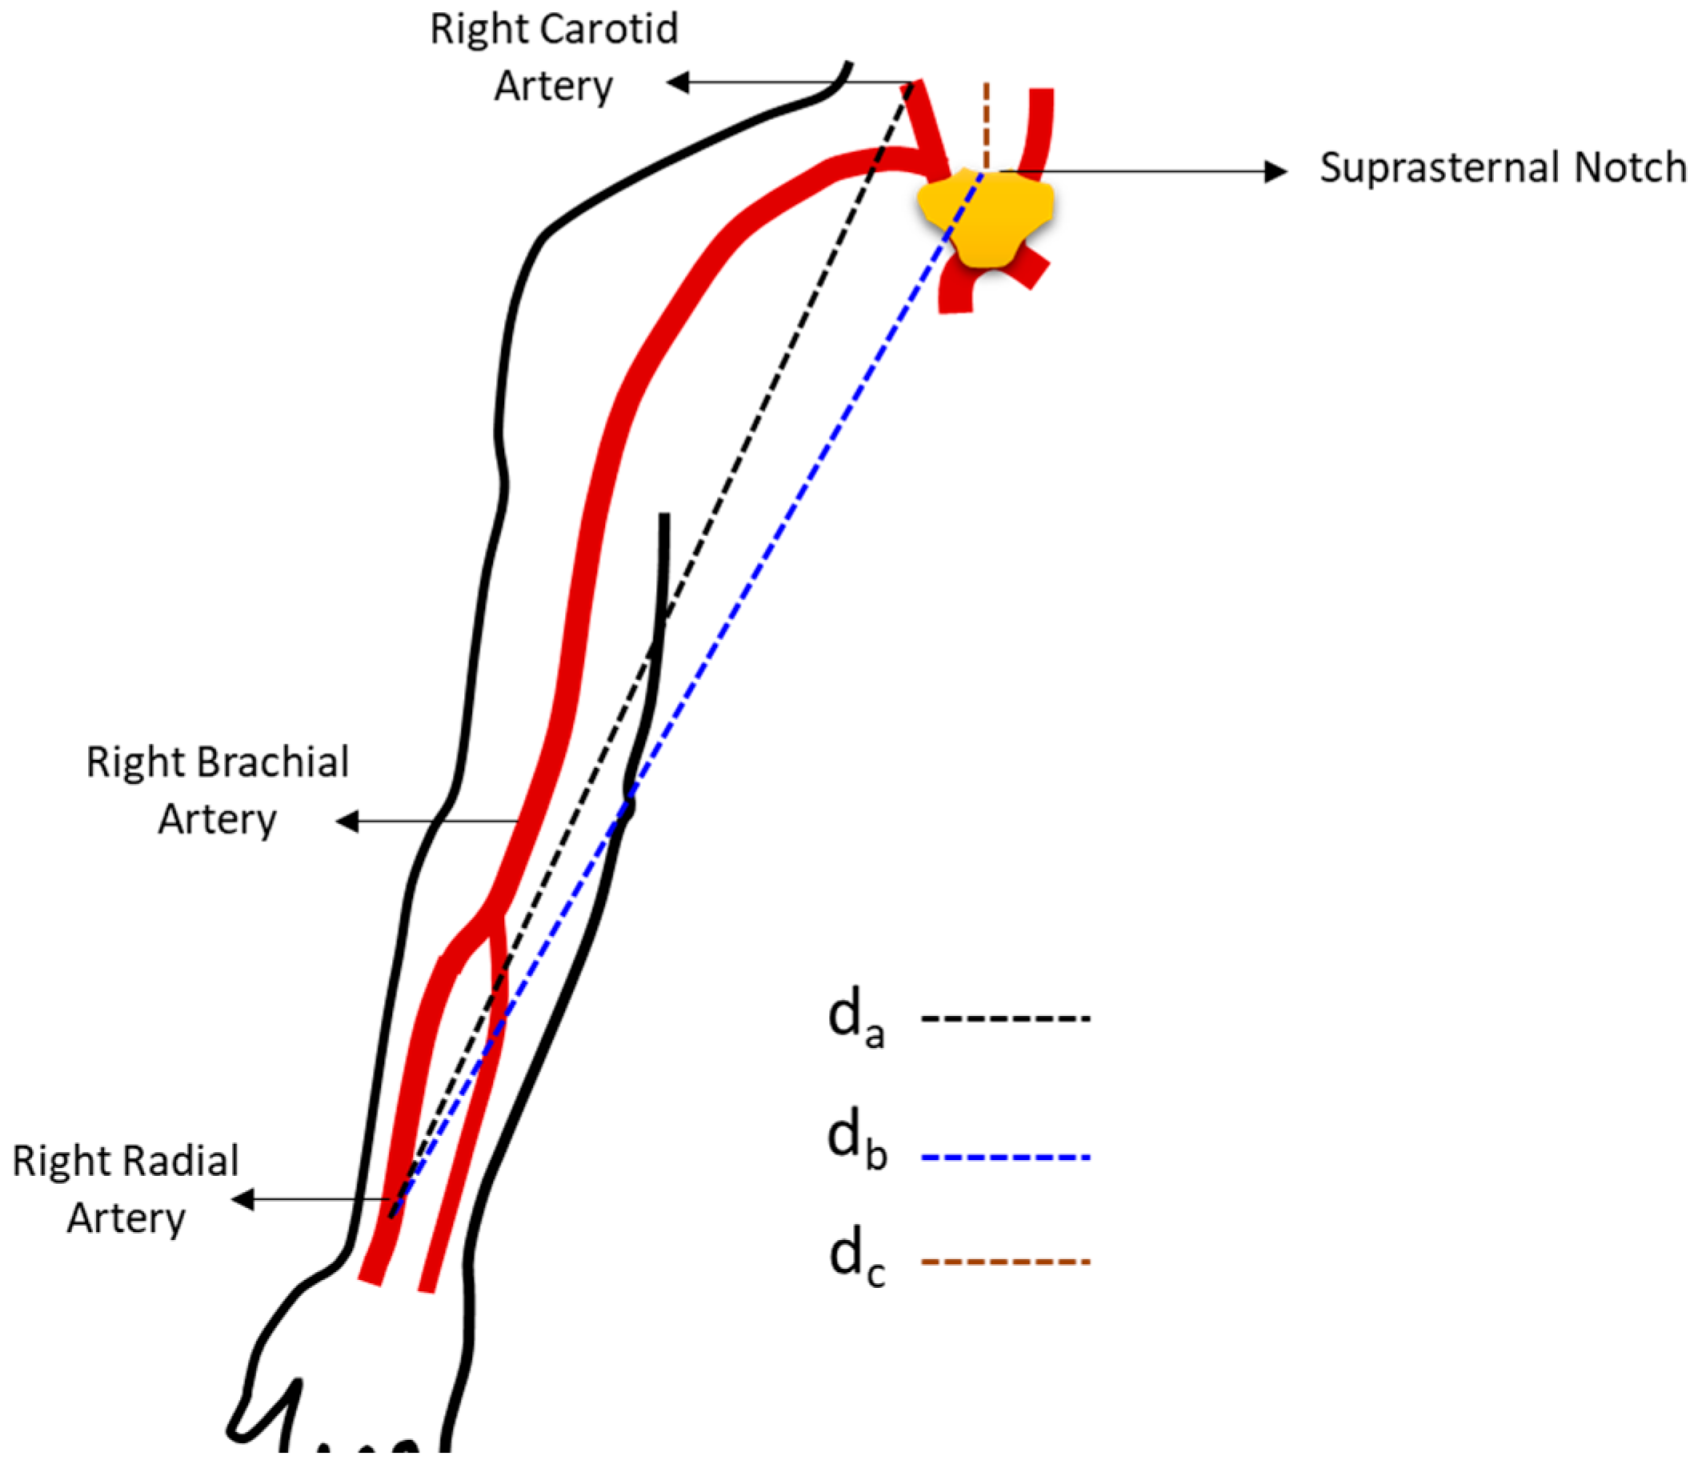
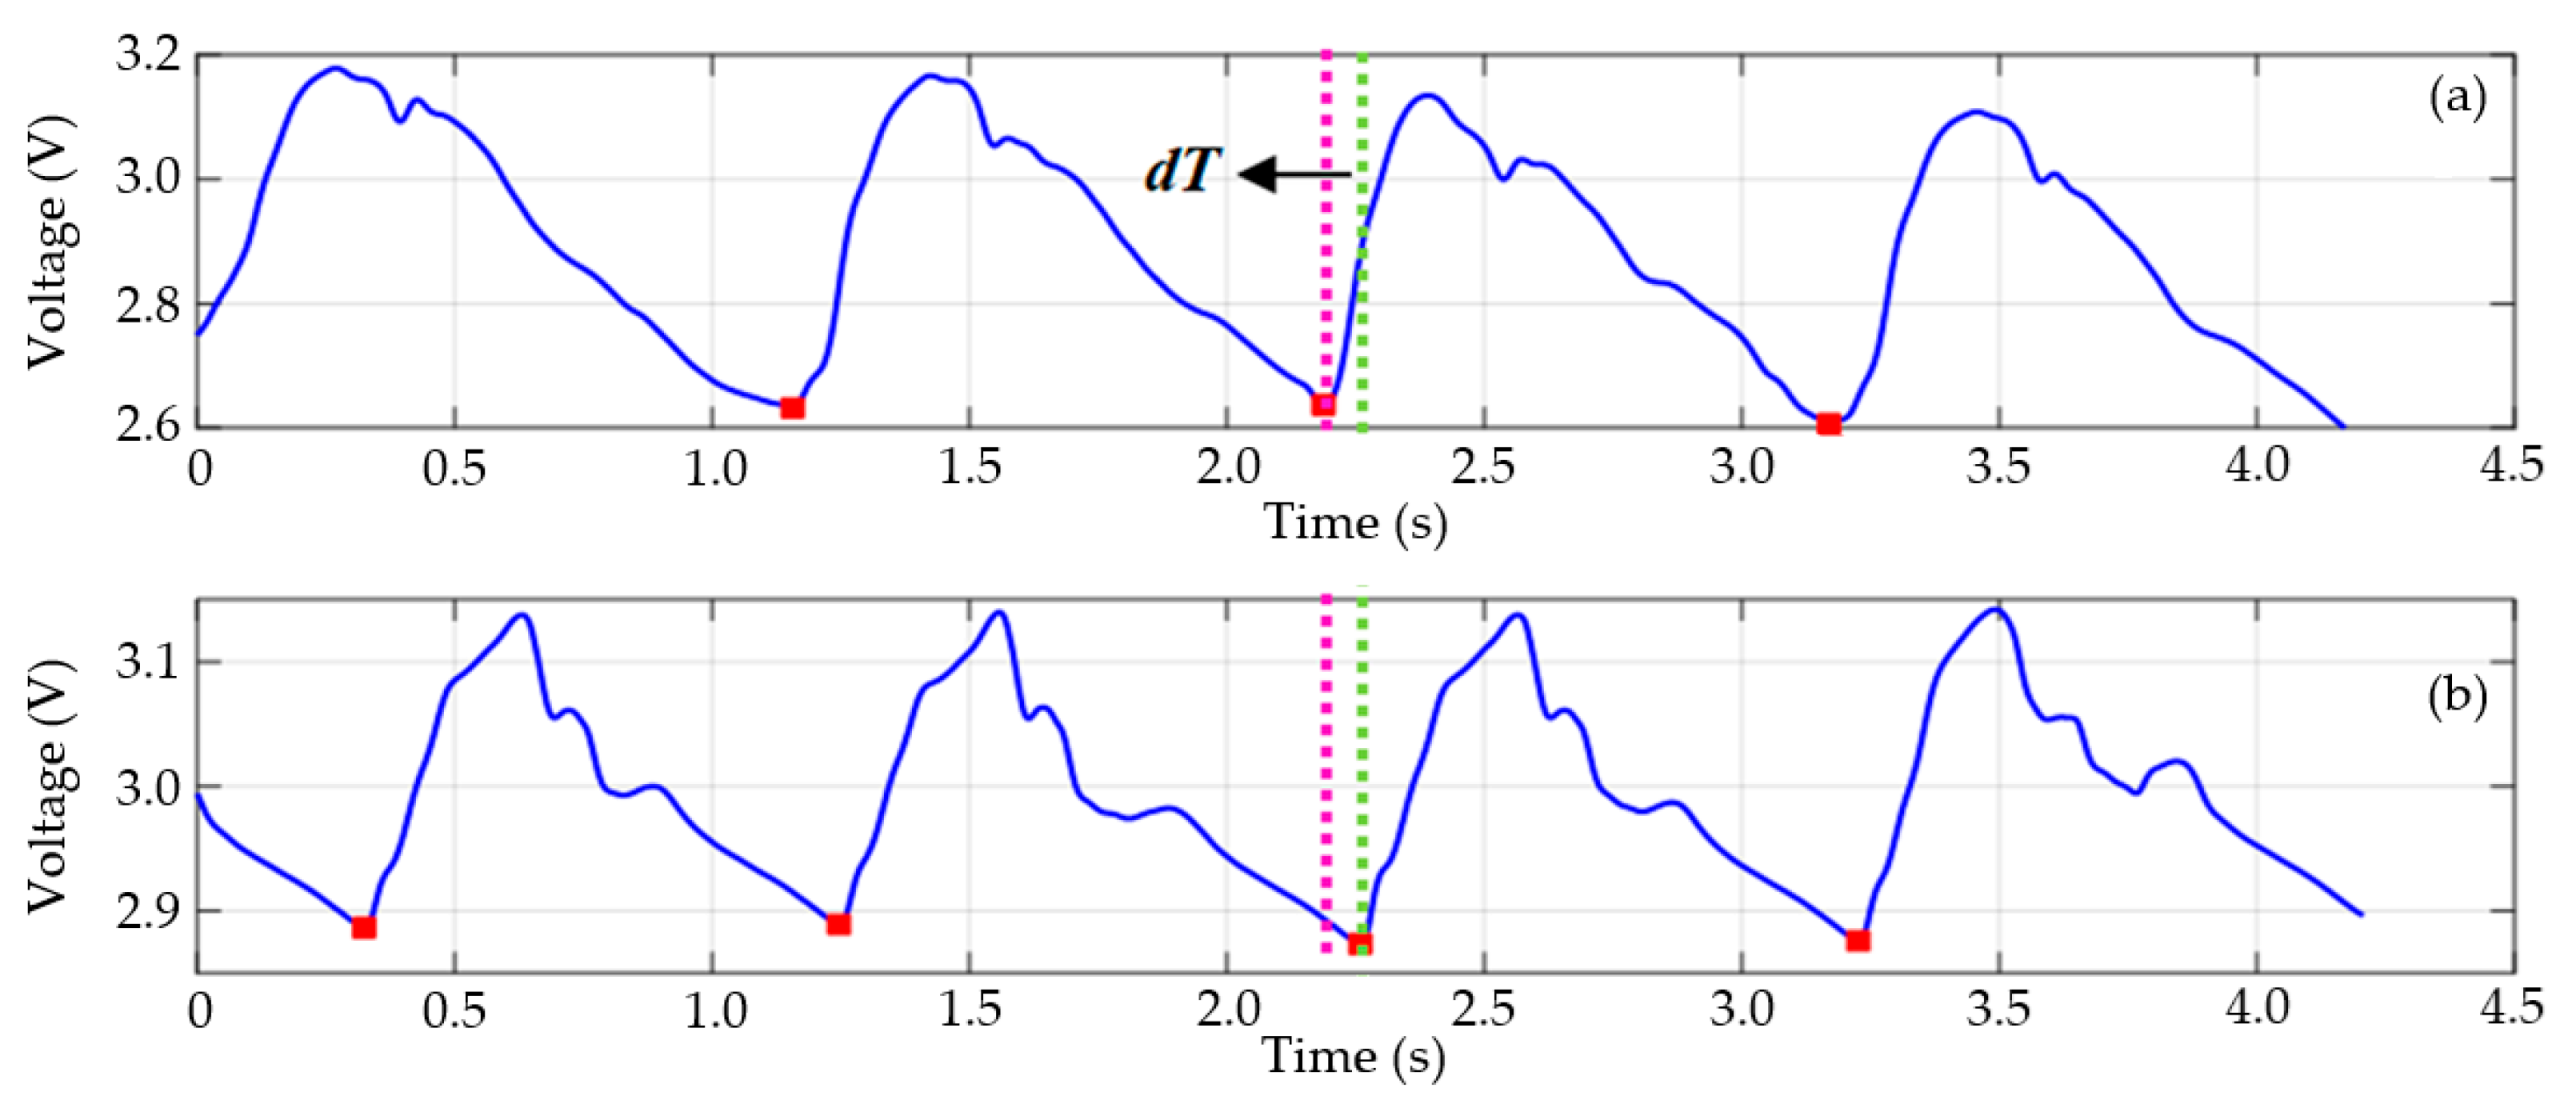
| Distance Measurement Method | Delay Time (s) | Distance (m) | PWV (m/s) |
|---|---|---|---|
| Direct | 0.071 | 0.615 | 8.662 |
| Subtraction | 0.521 | 7.338 |
Disclaimer/Publisher’s Note: The statements, opinions and data contained in all publications are solely those of the individual author(s) and contributor(s) and not of MDPI and/or the editor(s). MDPI and/or the editor(s) disclaim responsibility for any injury to people or property resulting from any ideas, methods, instructions or products referred to in the content. |
© 2025 by the authors. Licensee MDPI, Basel, Switzerland. This article is an open access article distributed under the terms and conditions of the Creative Commons Attribution (CC BY) license (https://creativecommons.org/licenses/by/4.0/).
Share and Cite
Benavides Cabrera, L.S.; Costa da Silva, E.; Monteiro, E.C. Highly Sensitive Pressure Transducer for Measuring Arterial Pulse Wave Velocity Based on Giant Magneto-Impedance Sensors. Sensors 2025, 25, 3188. https://doi.org/10.3390/s25103188
Benavides Cabrera LS, Costa da Silva E, Monteiro EC. Highly Sensitive Pressure Transducer for Measuring Arterial Pulse Wave Velocity Based on Giant Magneto-Impedance Sensors. Sensors. 2025; 25(10):3188. https://doi.org/10.3390/s25103188
Chicago/Turabian StyleBenavides Cabrera, Lizeth Stefanía, Eduardo Costa da Silva, and Elisabeth Costa Monteiro. 2025. "Highly Sensitive Pressure Transducer for Measuring Arterial Pulse Wave Velocity Based on Giant Magneto-Impedance Sensors" Sensors 25, no. 10: 3188. https://doi.org/10.3390/s25103188
APA StyleBenavides Cabrera, L. S., Costa da Silva, E., & Monteiro, E. C. (2025). Highly Sensitive Pressure Transducer for Measuring Arterial Pulse Wave Velocity Based on Giant Magneto-Impedance Sensors. Sensors, 25(10), 3188. https://doi.org/10.3390/s25103188