
Implementation of a Remote Monitoring Station for Measuring UV Radiation Levels from Solarimeters Using LoRaWAN Technology

 ,
,  and
and 
Abstract
1. Introduction
2. Problem Description and Methodology
Selection and Identification of the Optimal Solution
3. Design and Implementation of the UV Monitoring Station
3.1. Design of the Solution
3.1.1. UV Sensor Characteristics and Power Requirements
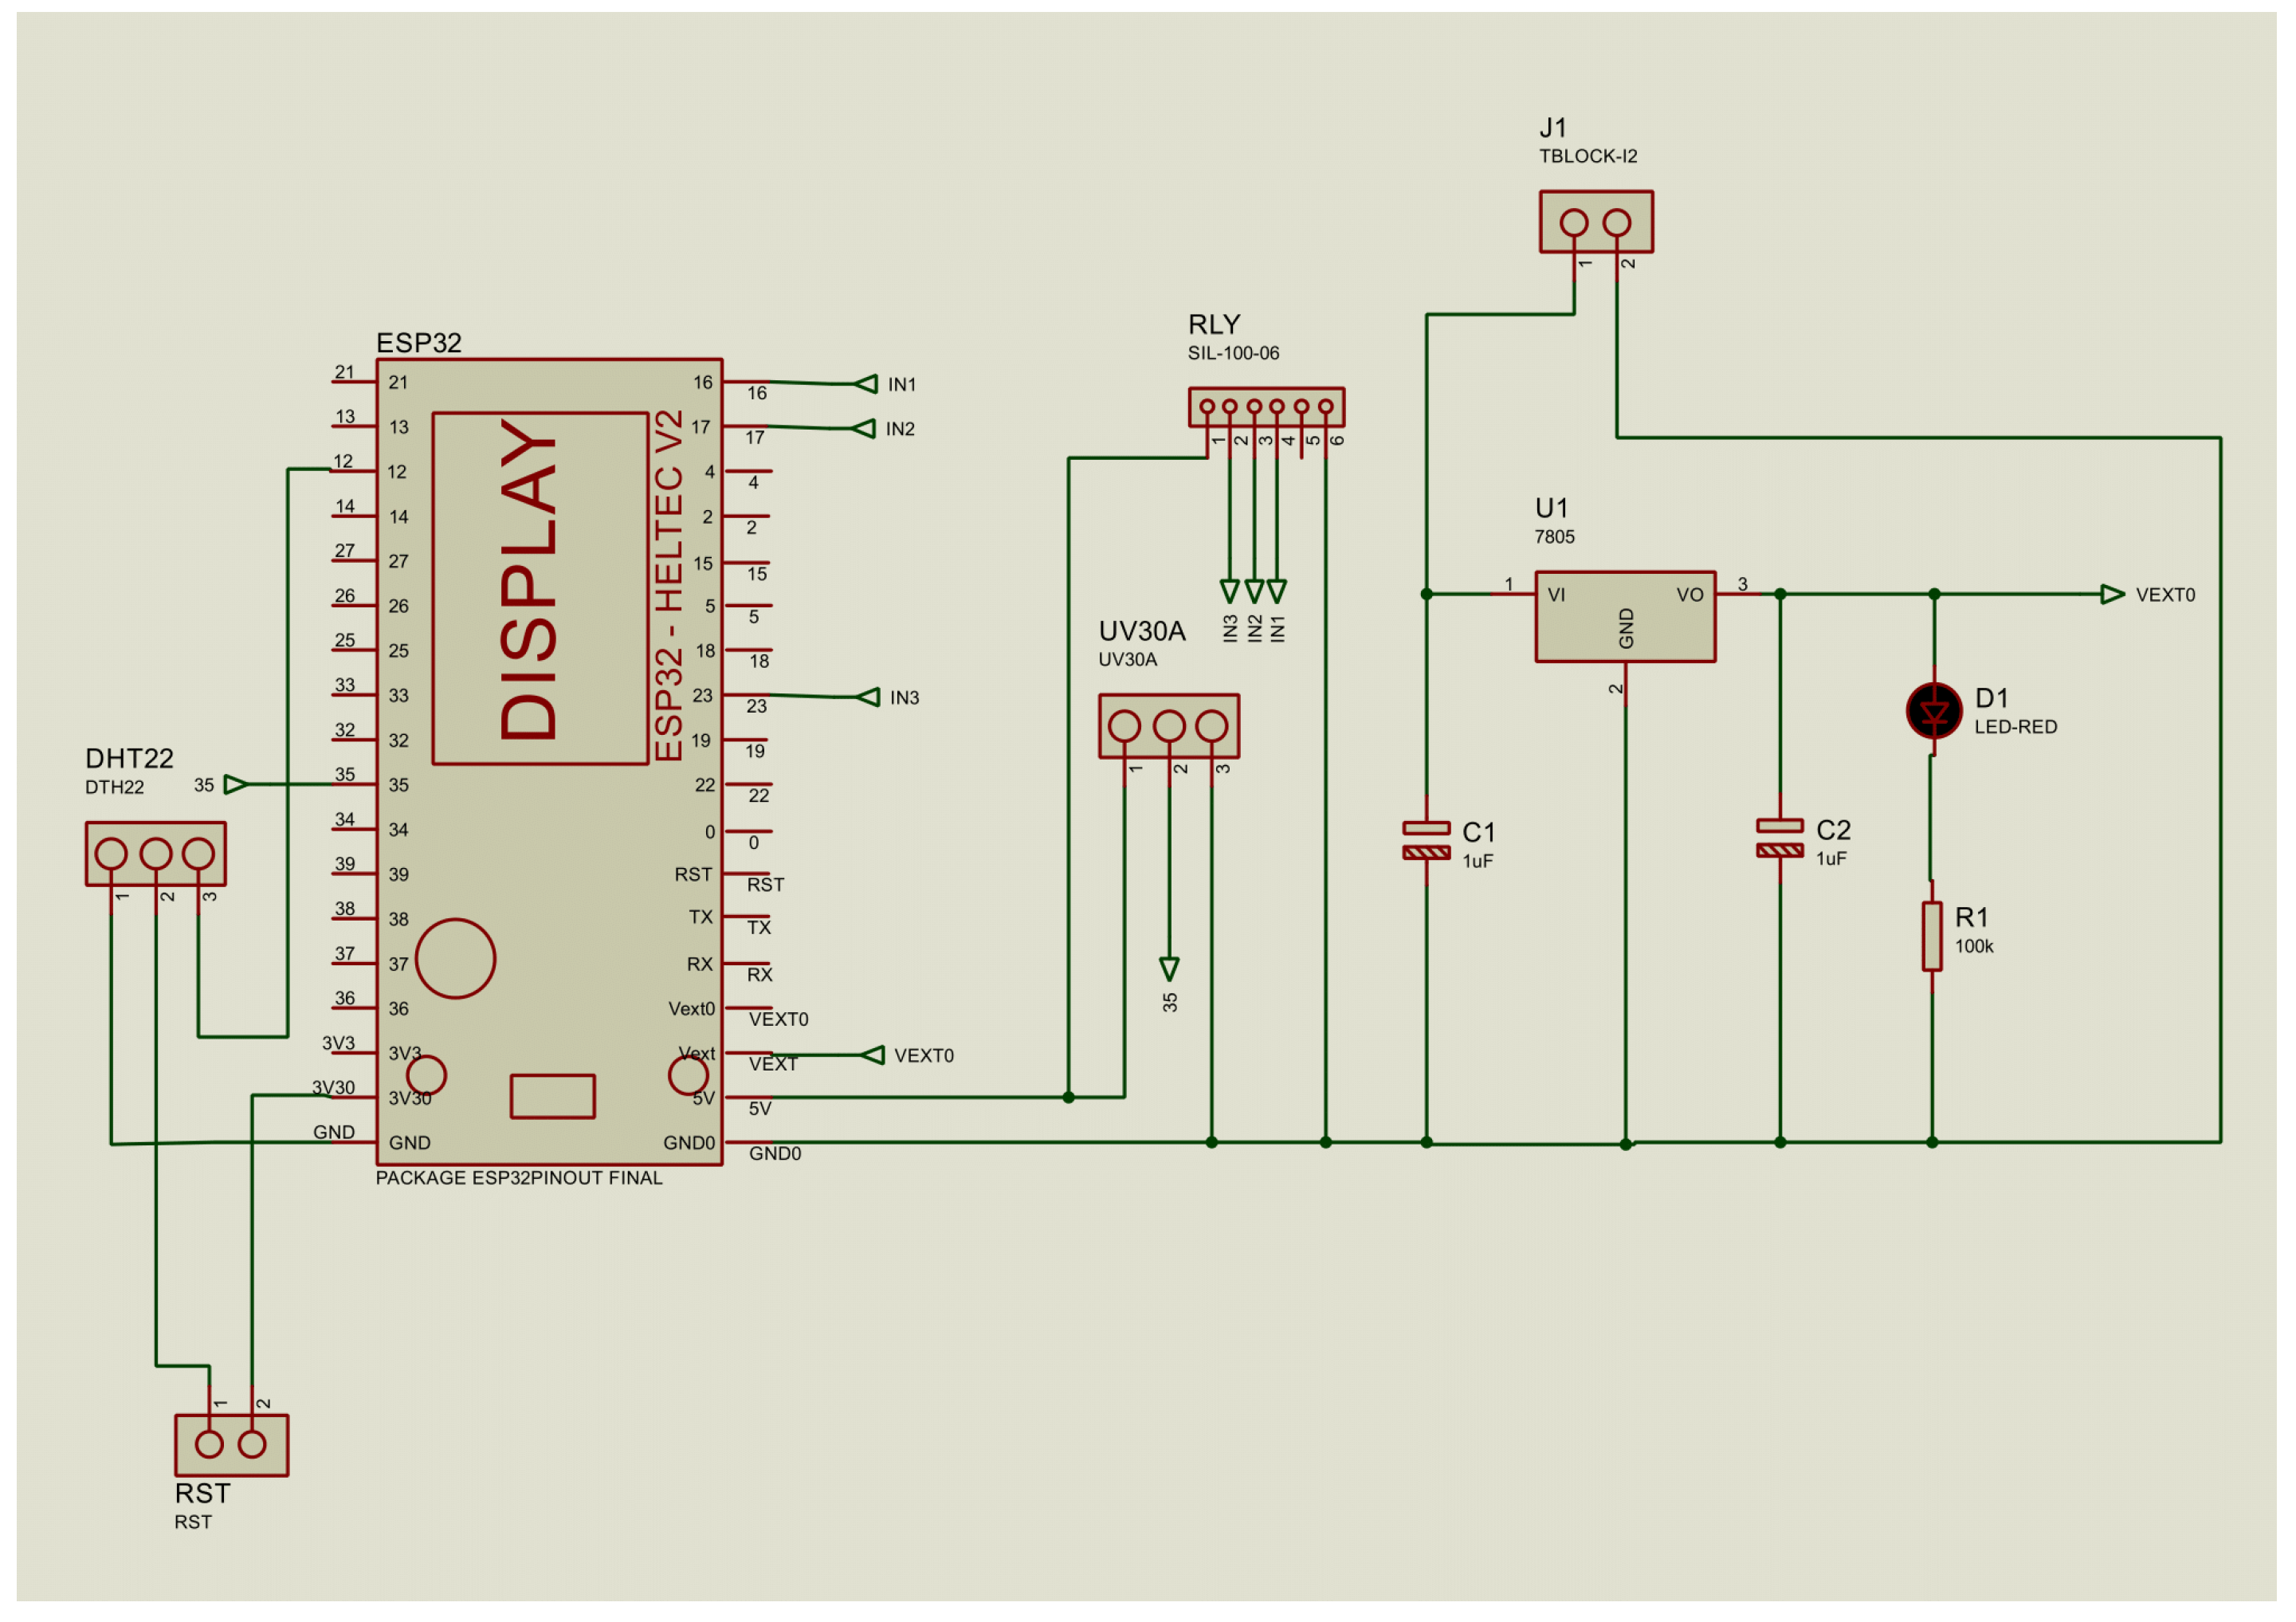
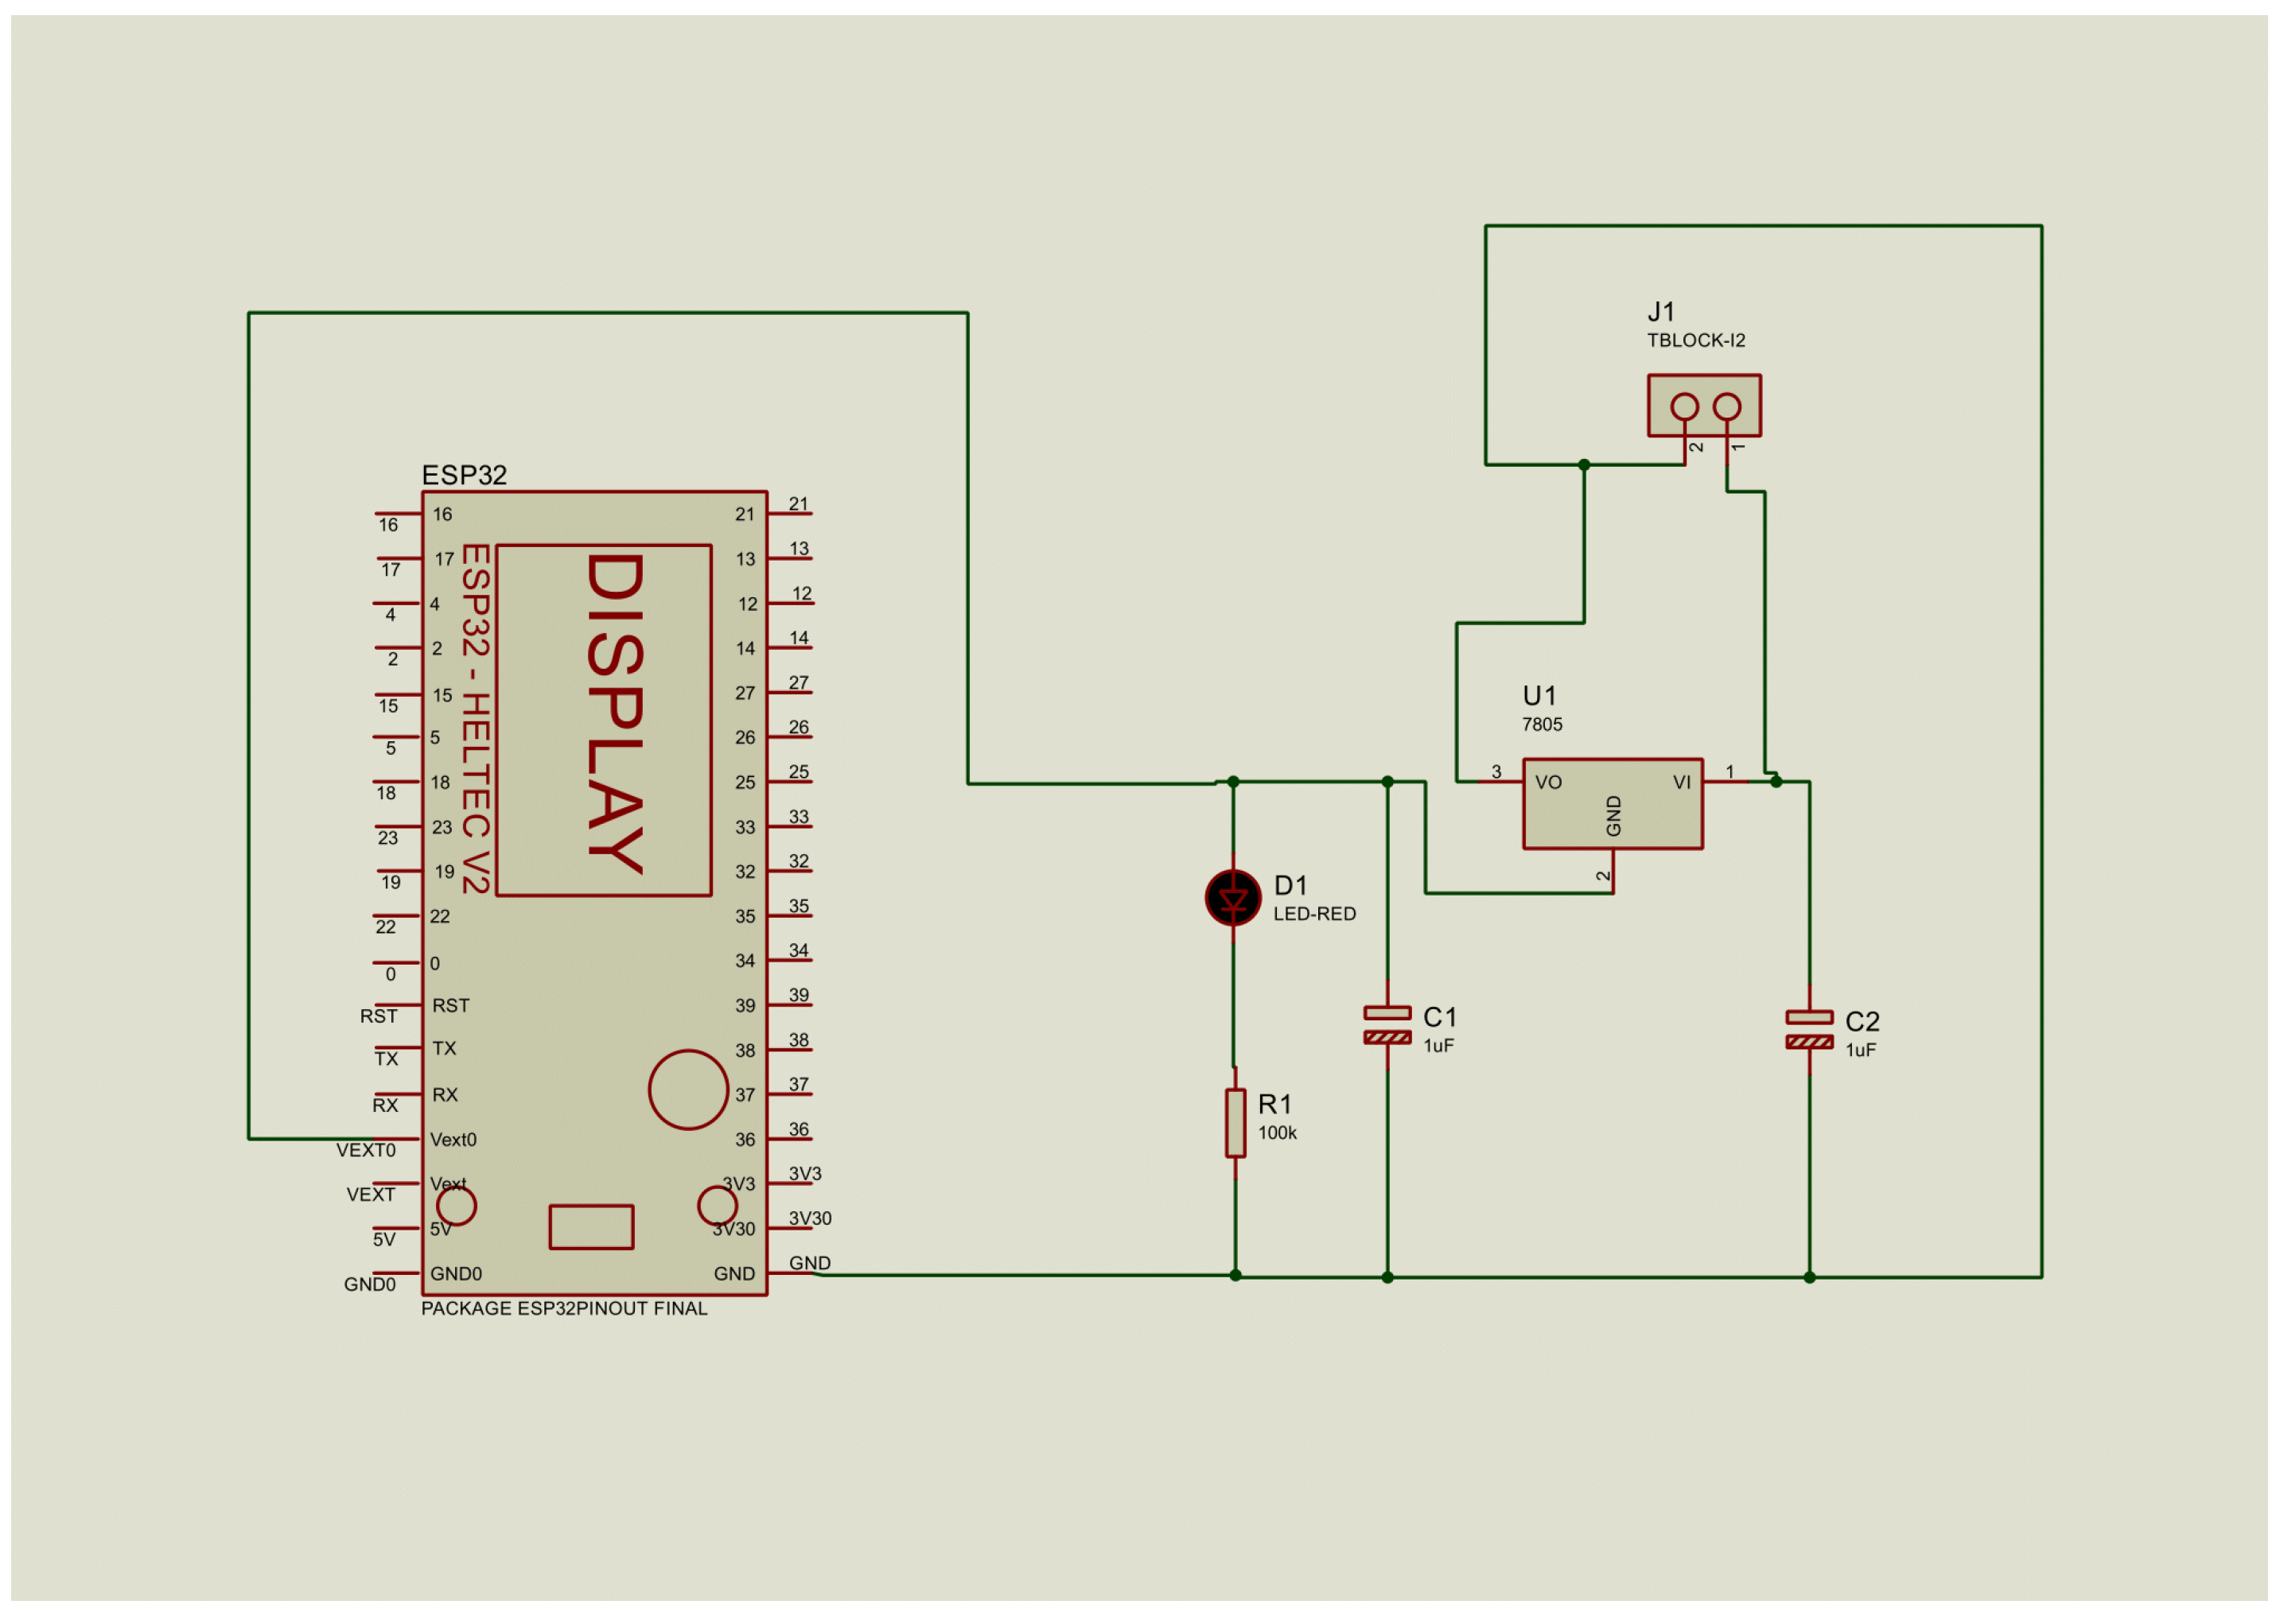
3.1.2. UV Measurement Transmitter Circuit
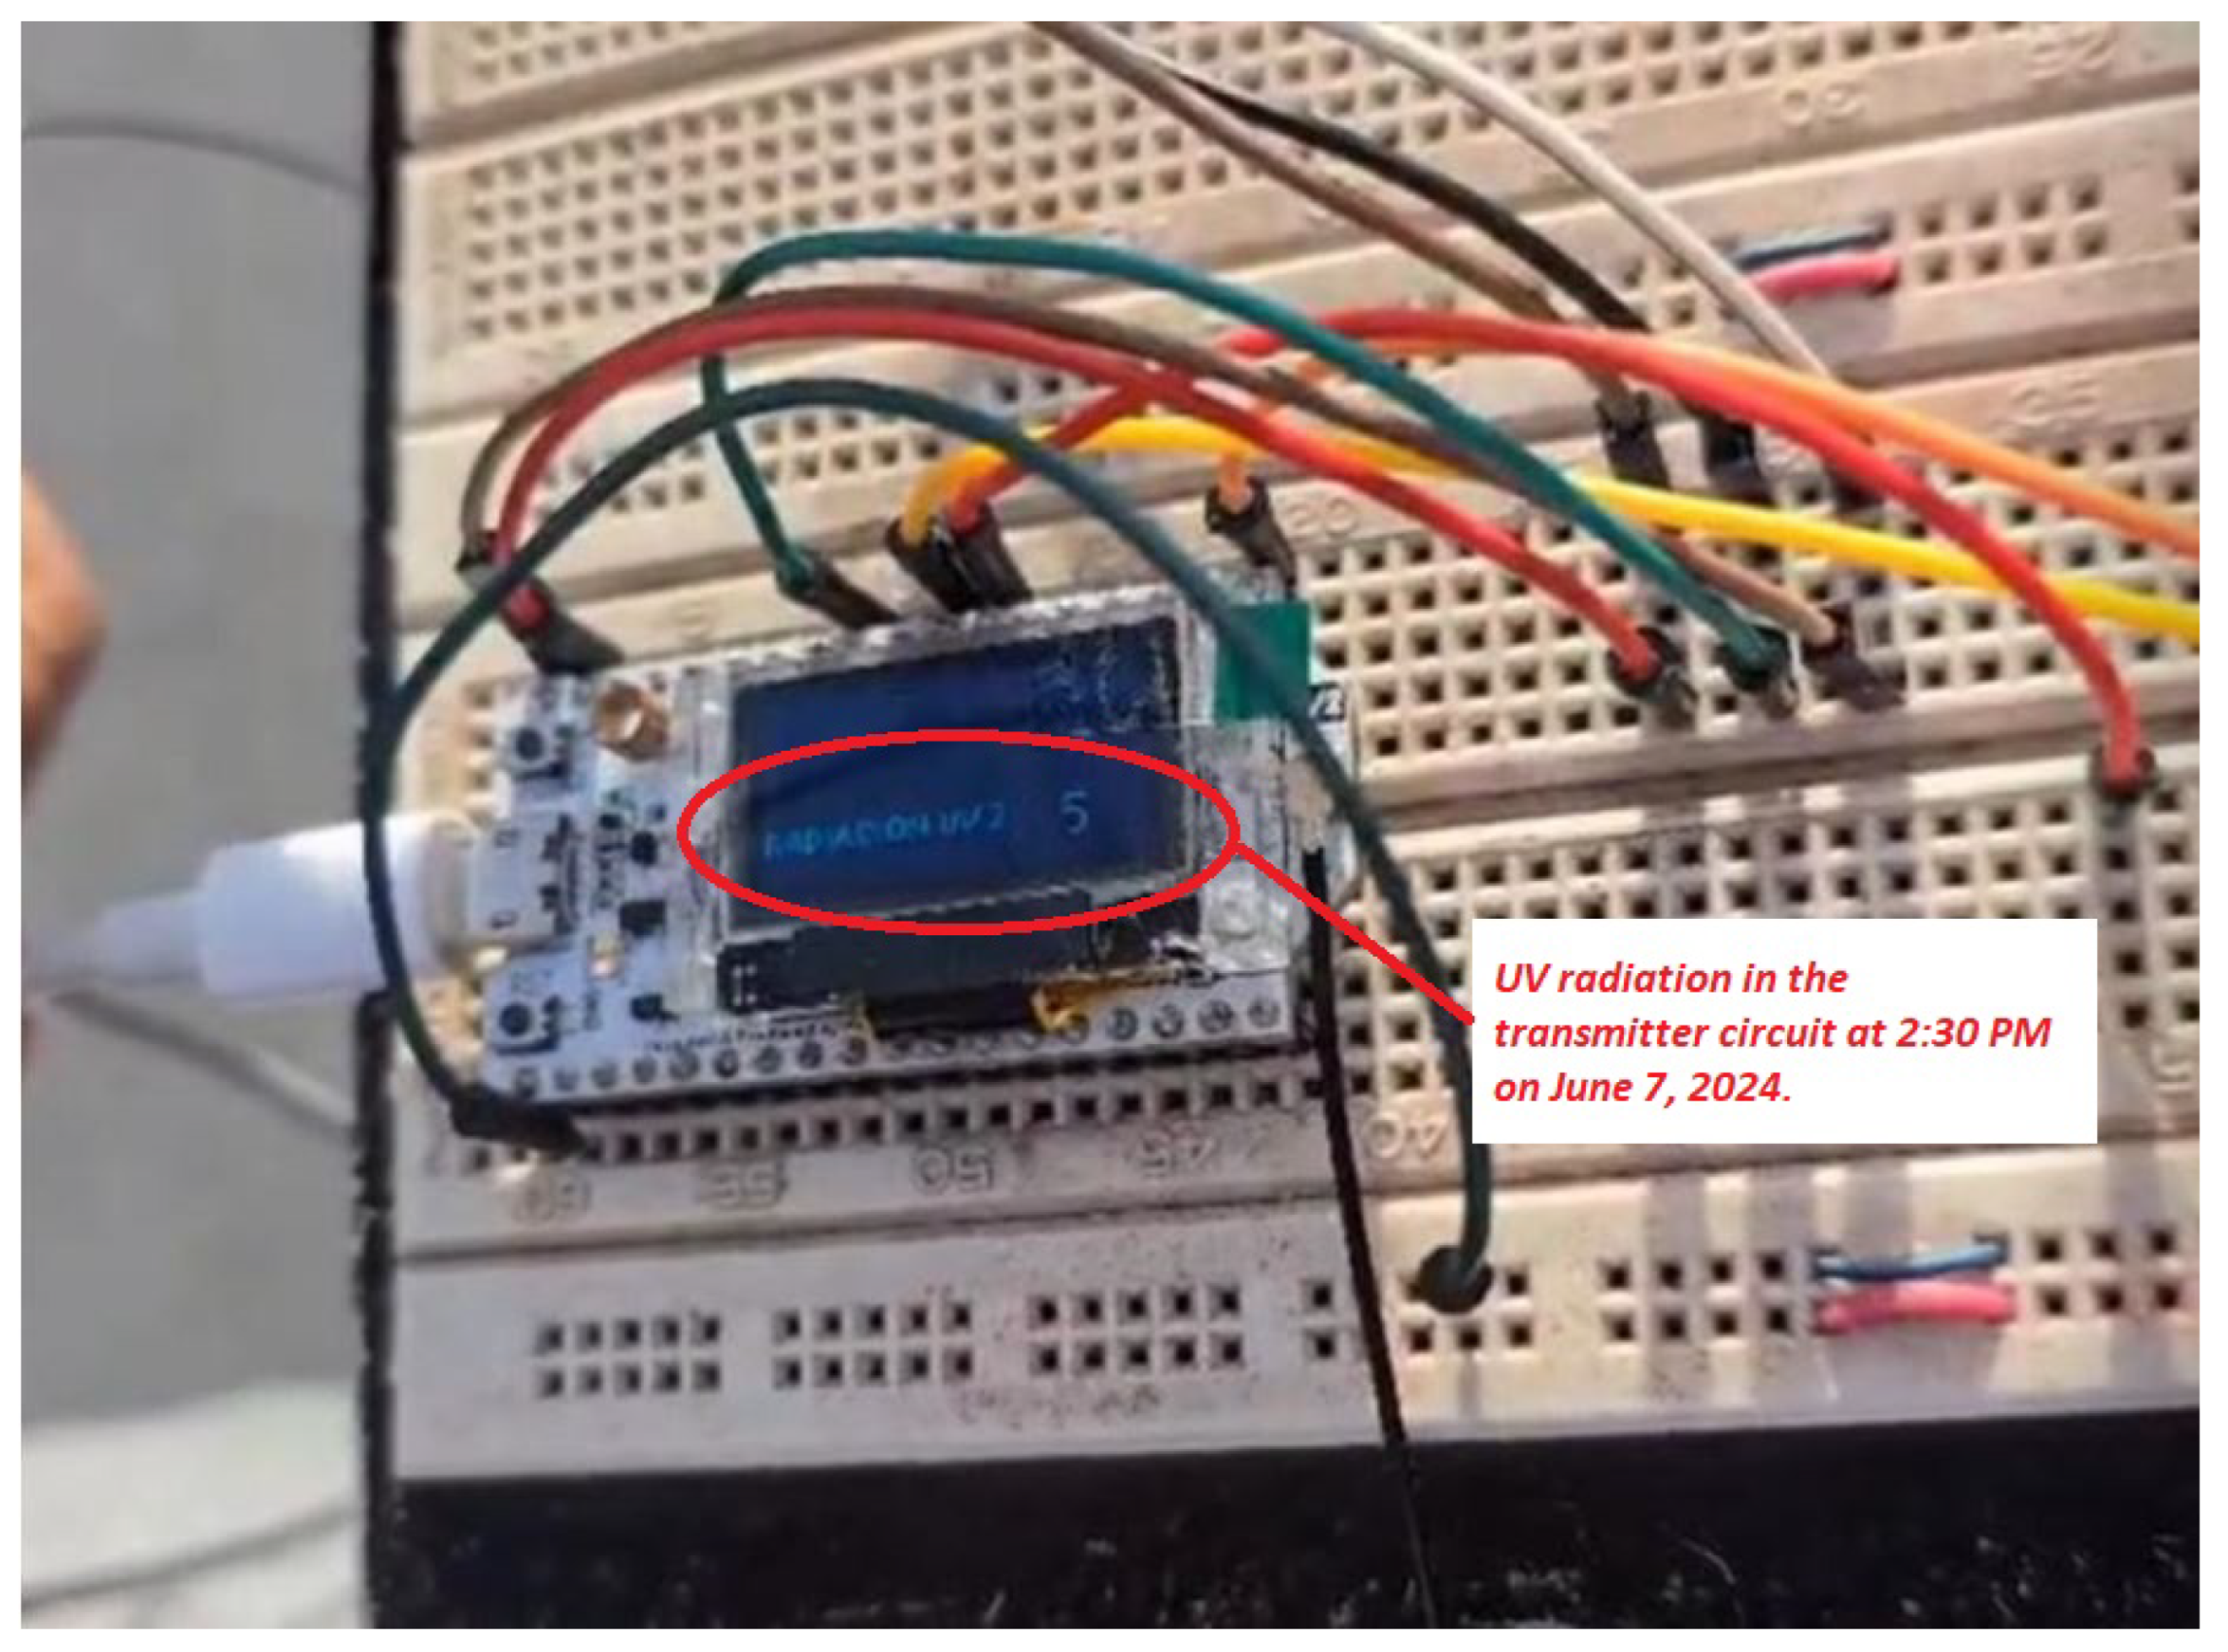
- The UVM-30A sensor, known for its accuracy, provides an analog output connected to the ESP32’s ADC, converting a 606 mV signal into a digital value of 752, corresponding to a level 6 solar radiation, using a 12-bit ADC (4096 levels).
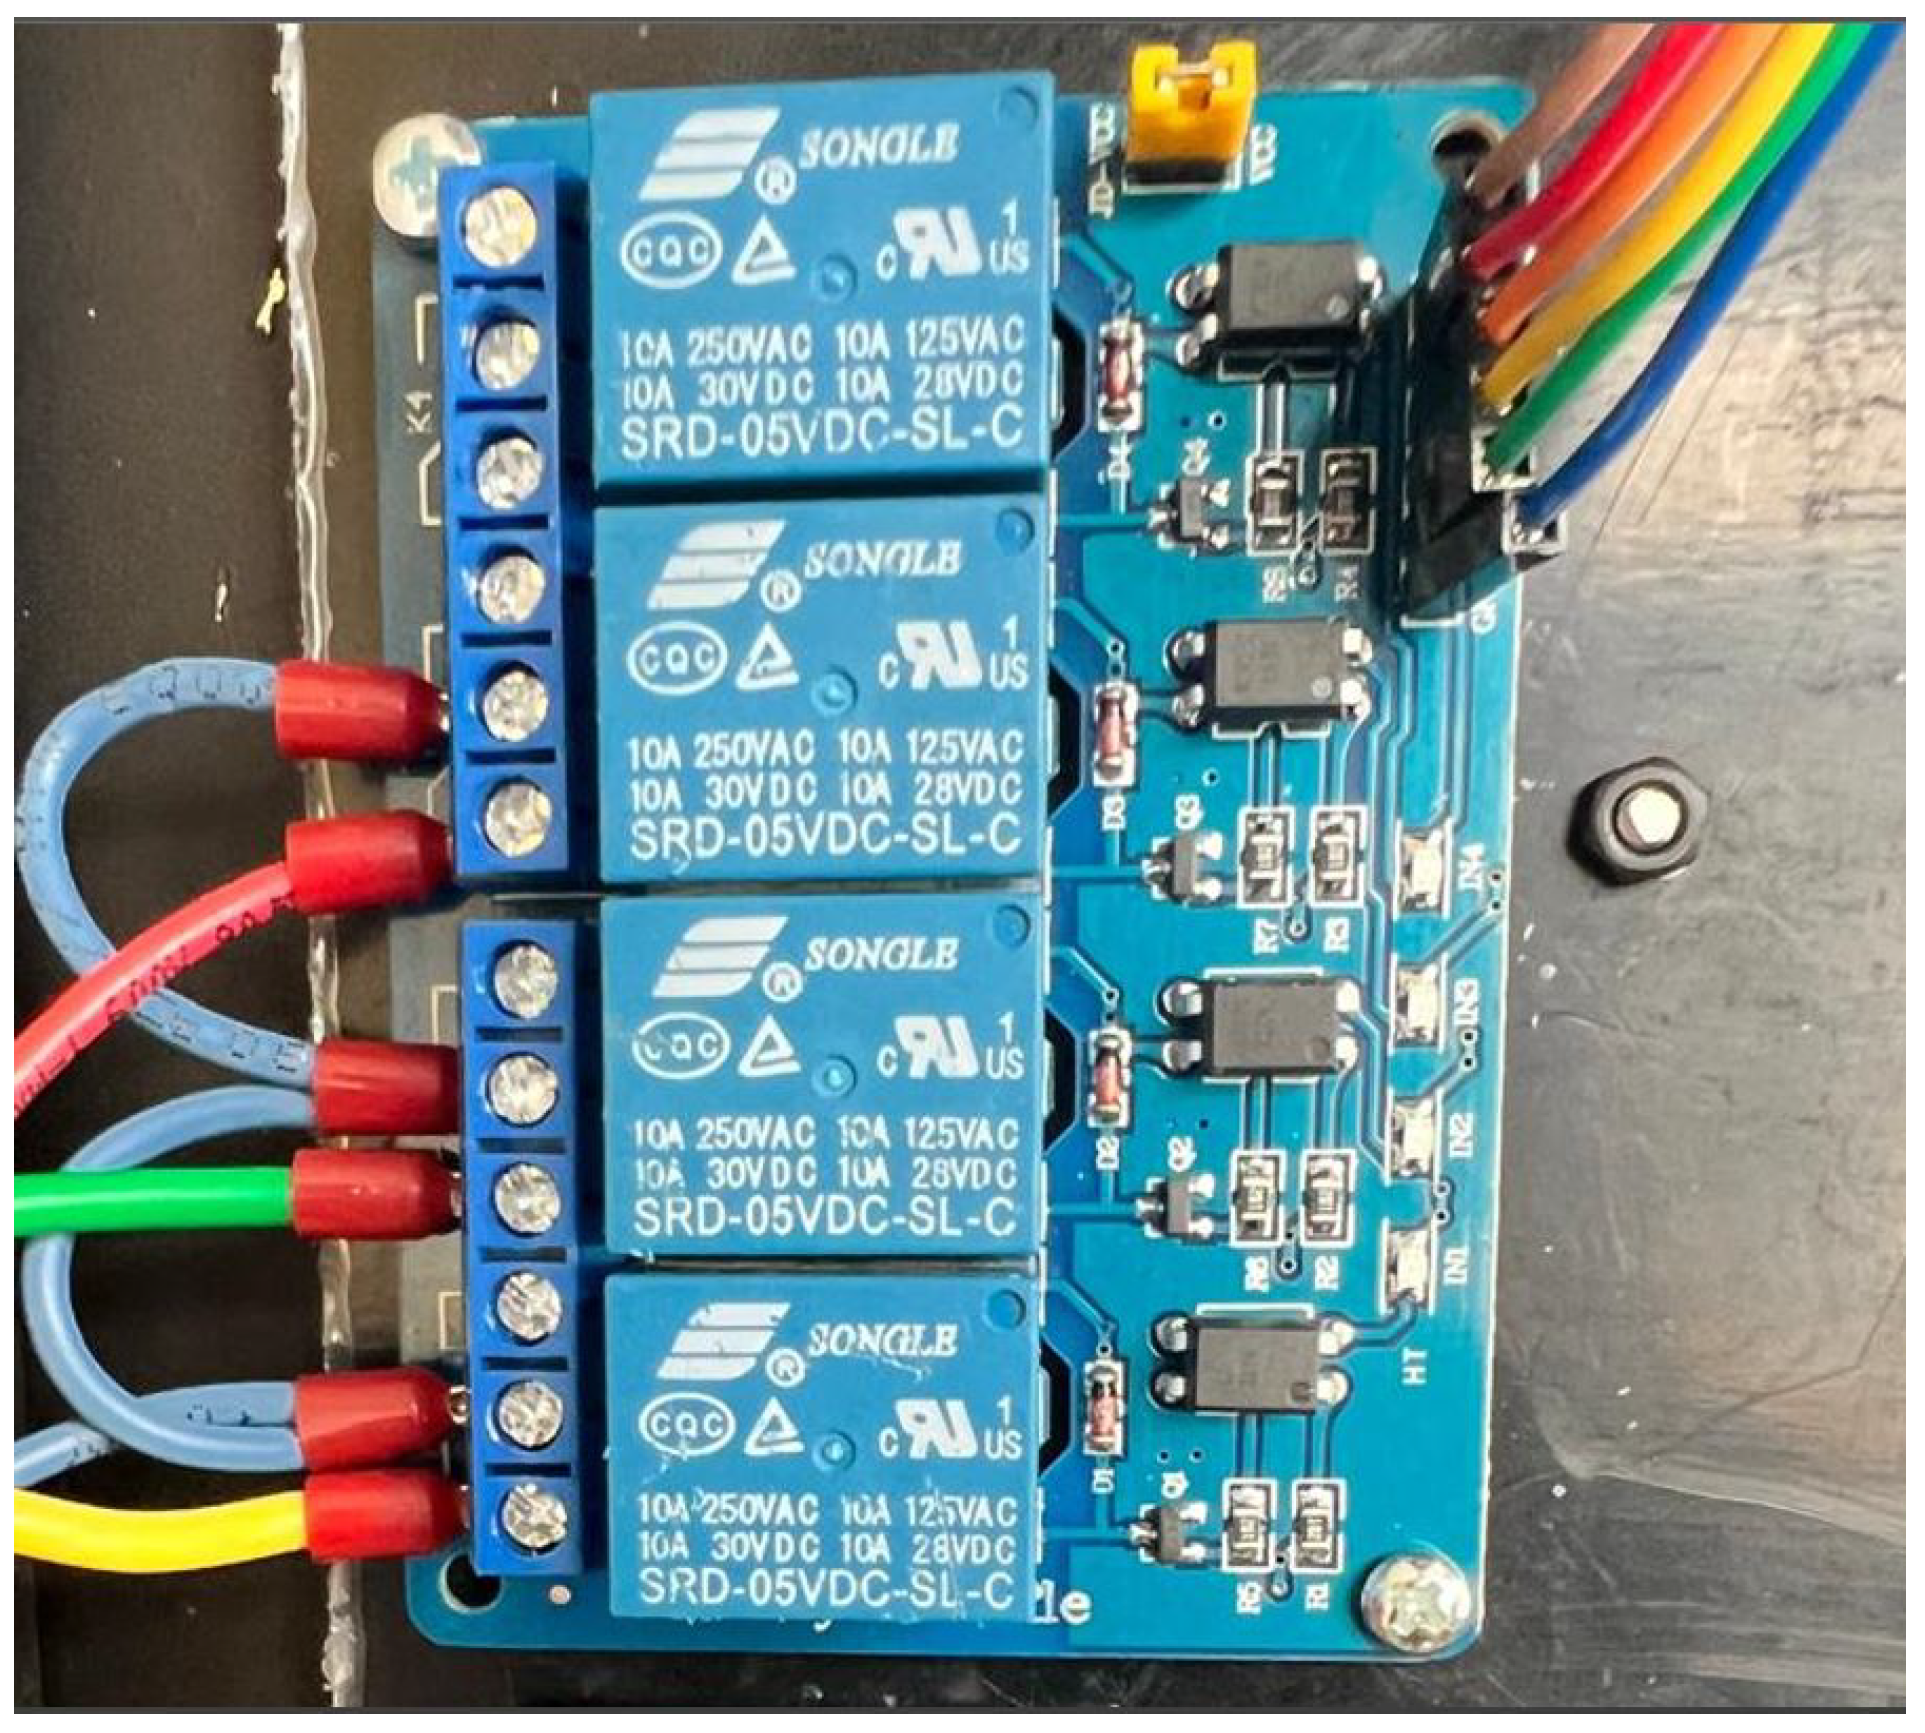
- To enhance the visualization of UV radiation data, we integrated LEDs with differentiated colors to represent various levels of radiation, acting as a visual indicator similar to a traffic light. These LEDs, controlled by SONGLE SRD-05VDC-SL-C relays from the ESP32, provide a clear and visible representation, even in daylight conditions.
- To ensure a stable power supply, a 7805 voltage regulator was used, which converts a 12V input into a constant 5V output, complemented by capacitors and an indicator LED to guarantee the correct operation of the circuit.
3.1.3. UV Measurement Receiver Circuit
3.1.4. Calibration, Energy Management, and Node Deployment Strategy
3.2. Implementation of the Solution
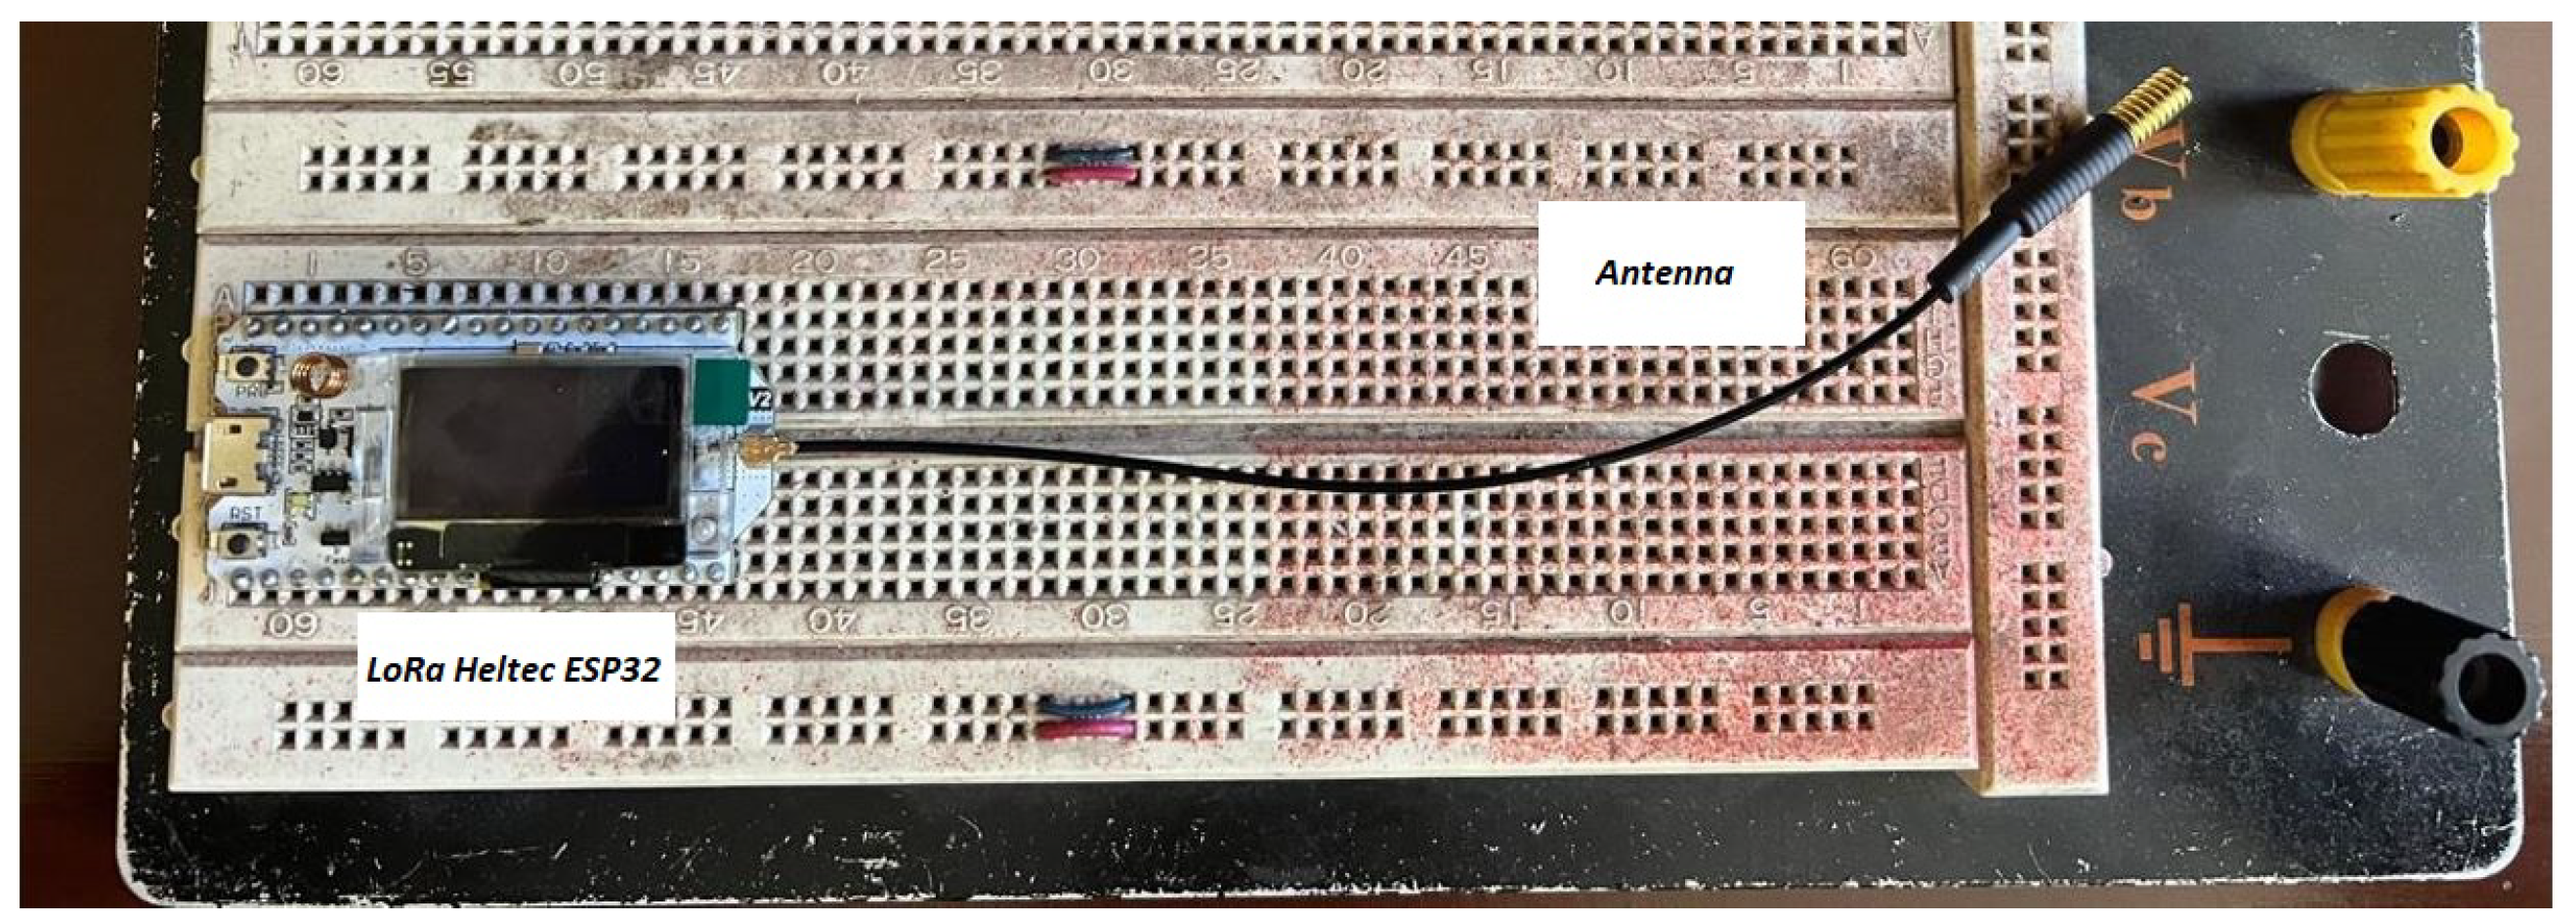
3.2.1. Development of Transmitters on Protoboards
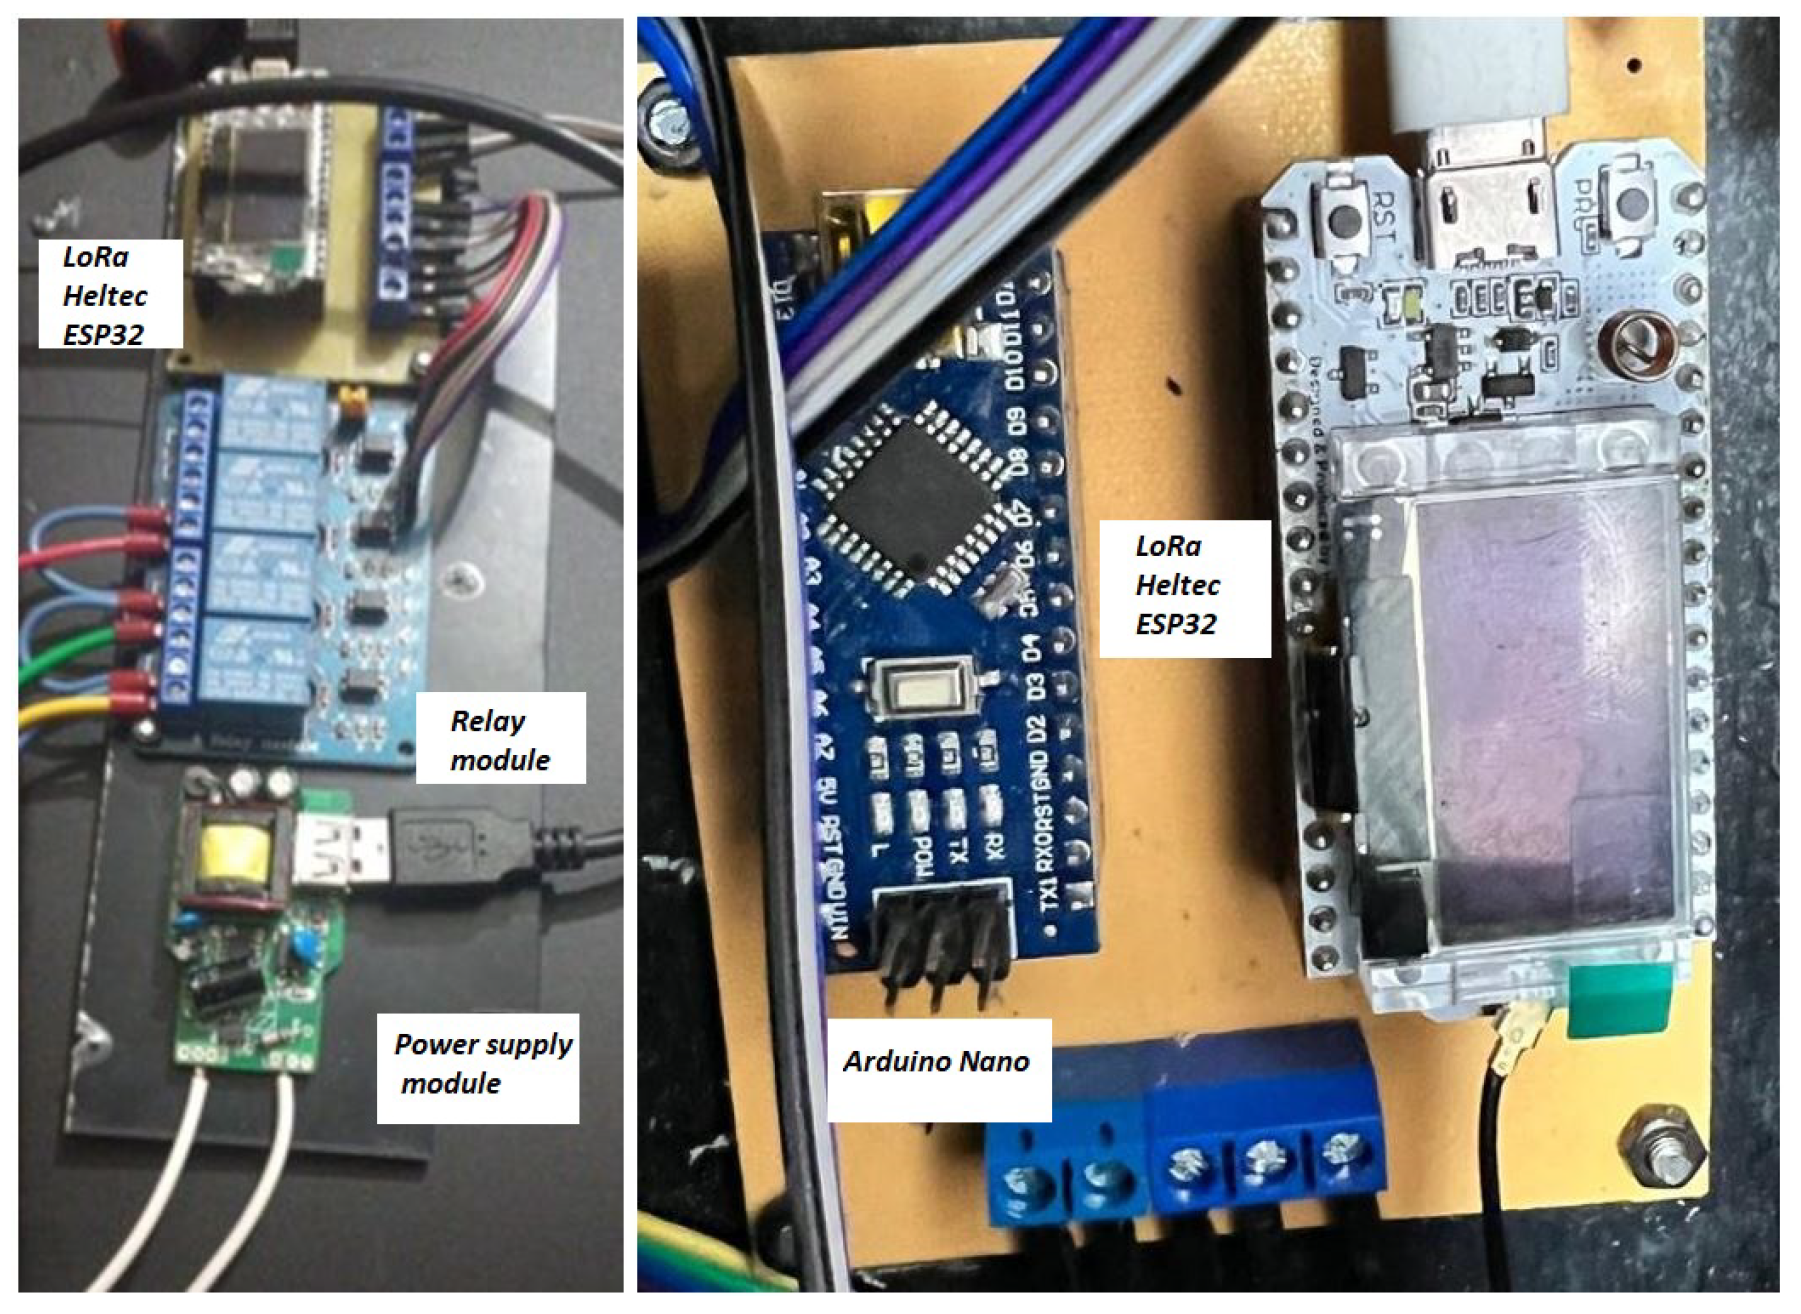
3.2.2. Development of the Receiver (Gateway)
3.2.3. Migration to PCBs
3.2.4. Additional Elements
3.3. Testing and Evaluation of the Prototype
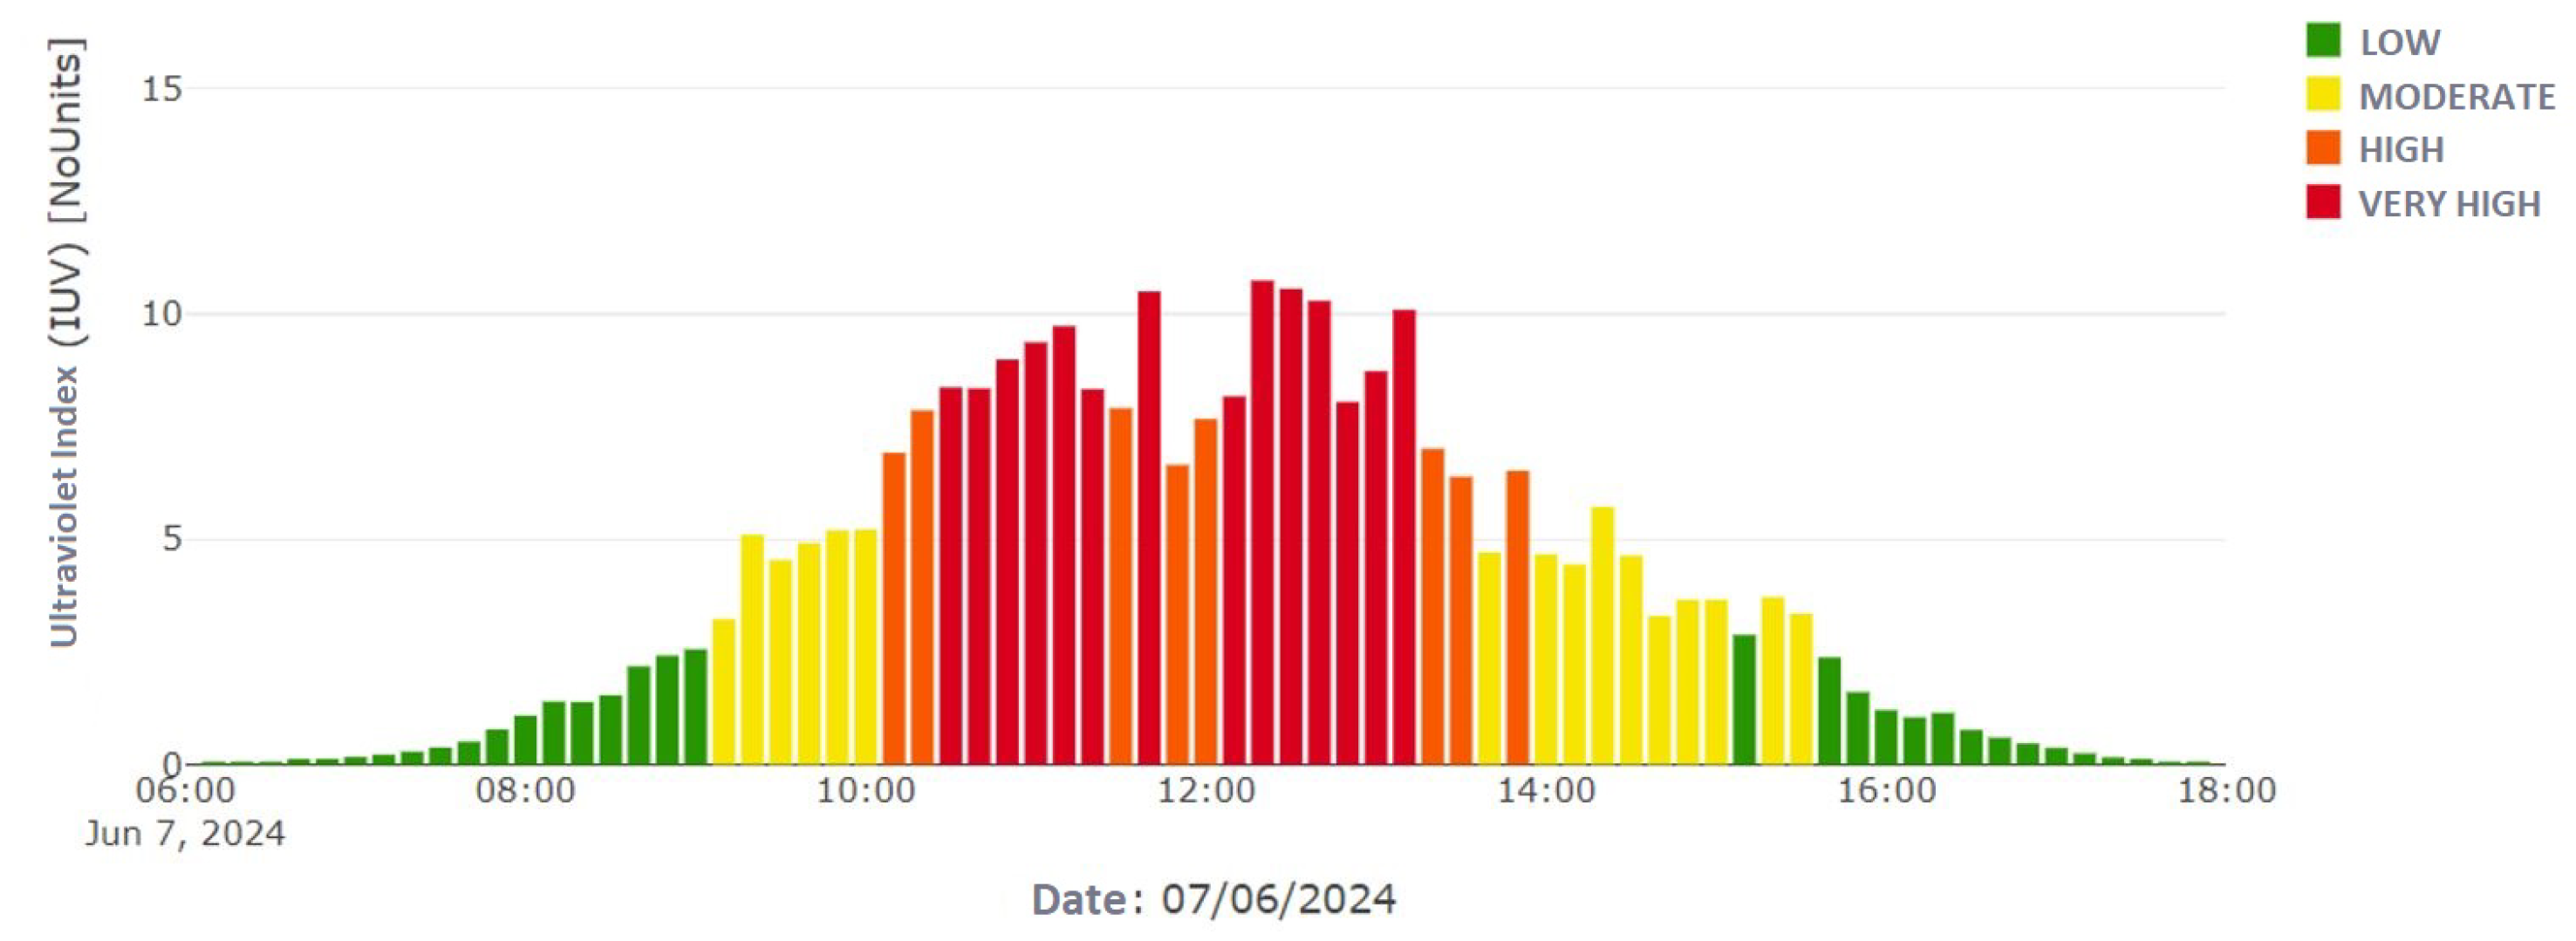
3.3.1. UV Radiation Tests
3.3.2. Distance Tests with Heltec LoRa Modules
3.3.3. Radio Propagation Modeling and Simulation
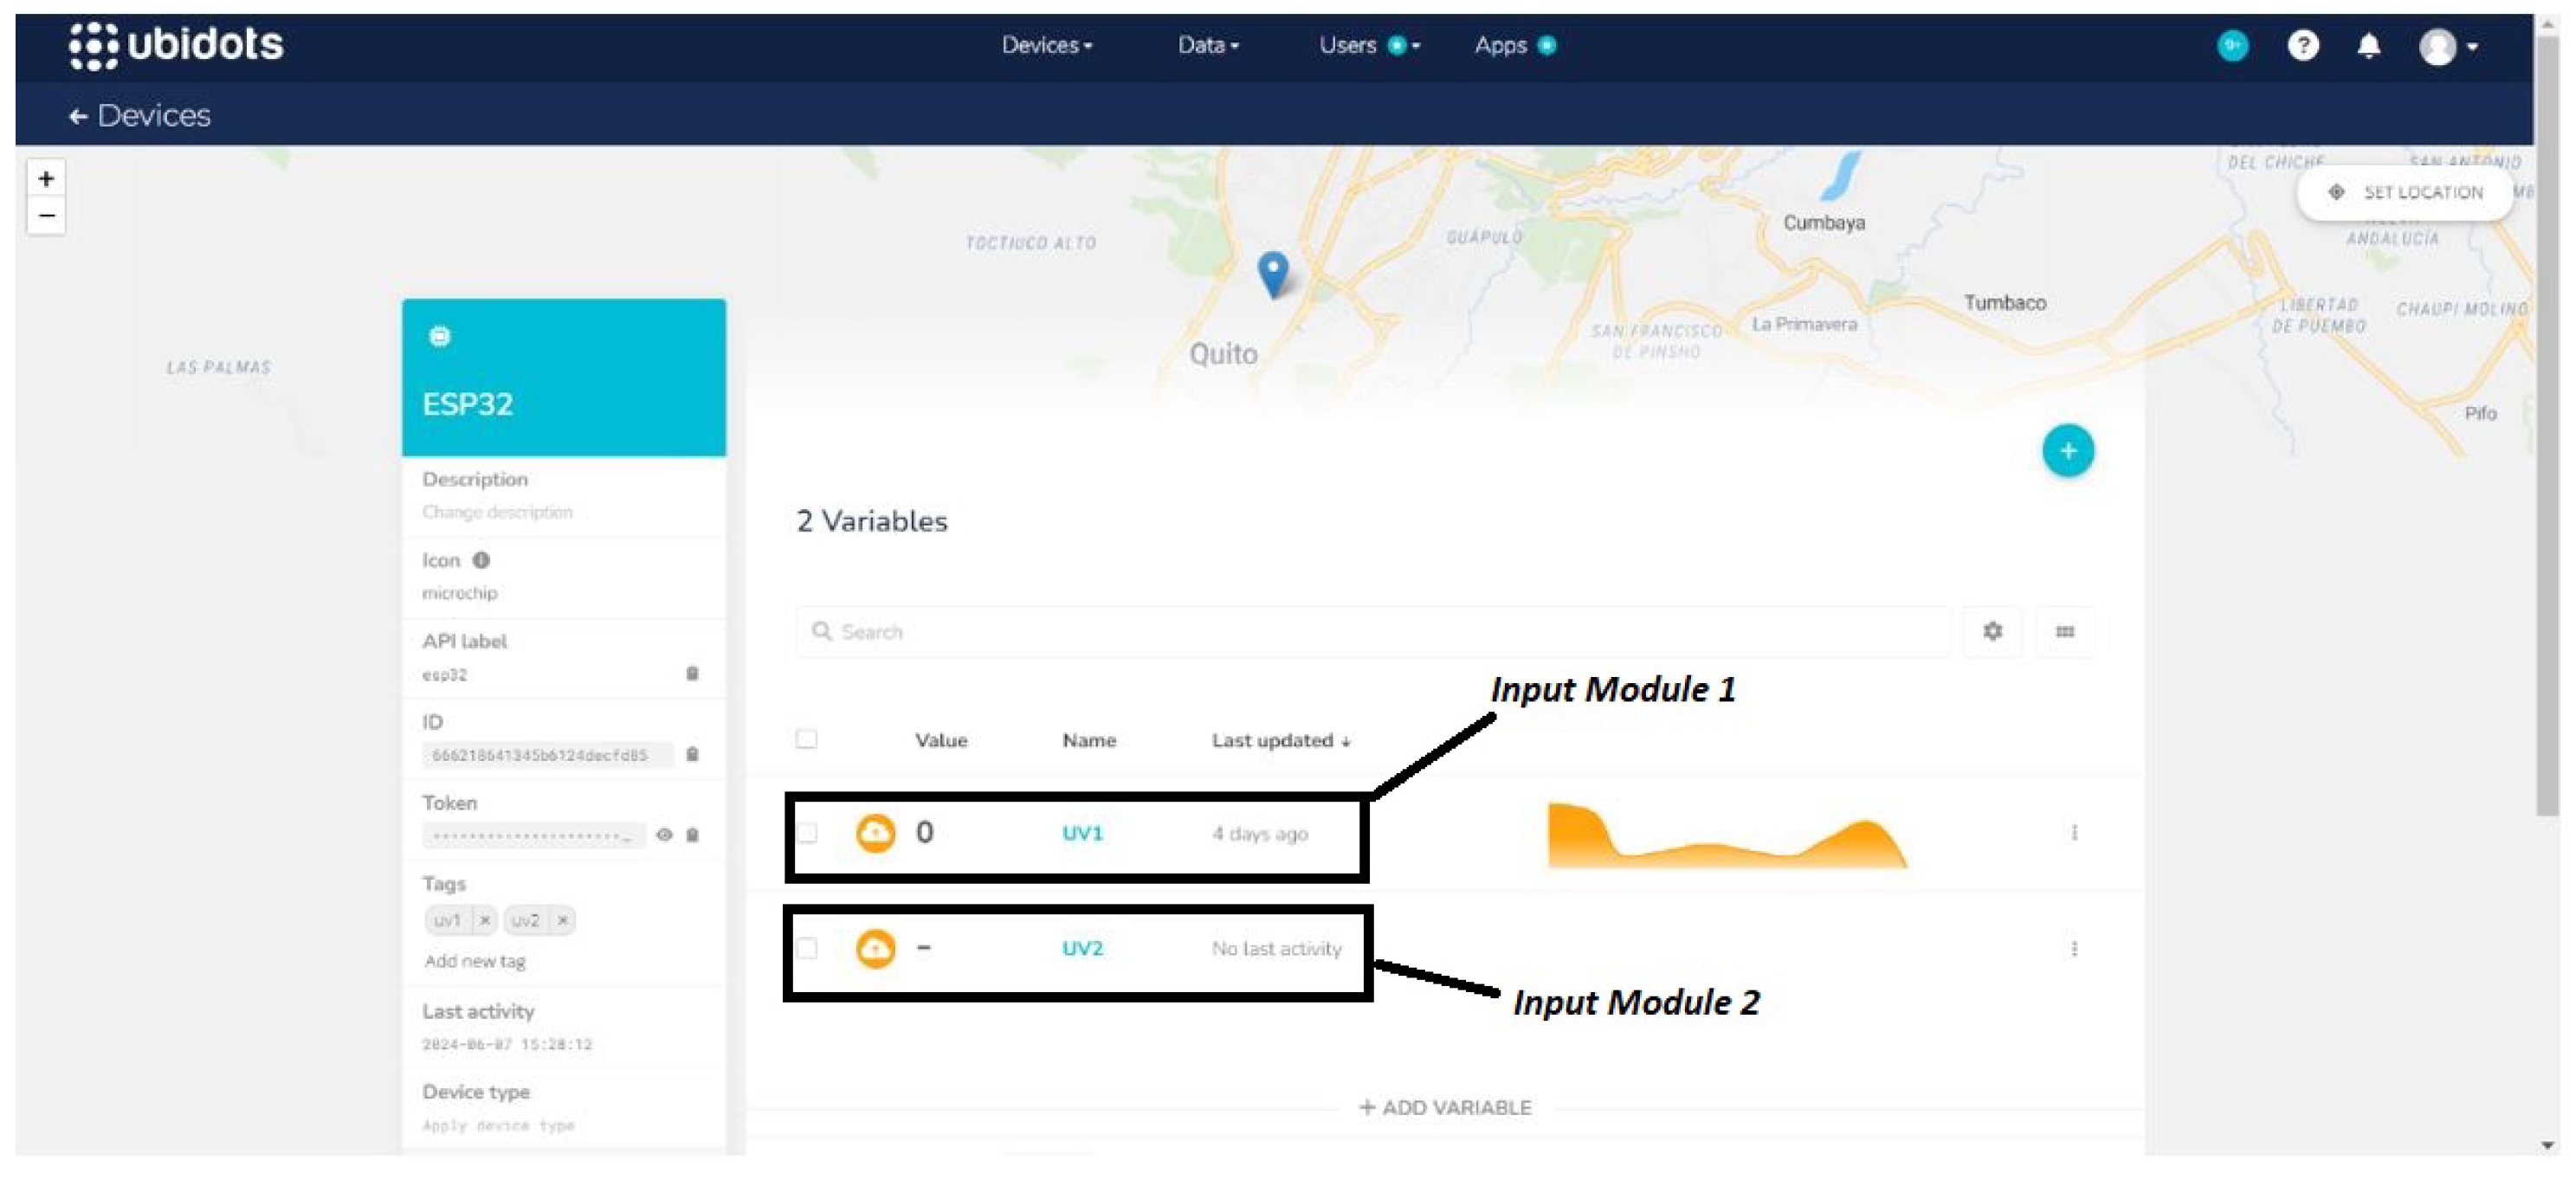
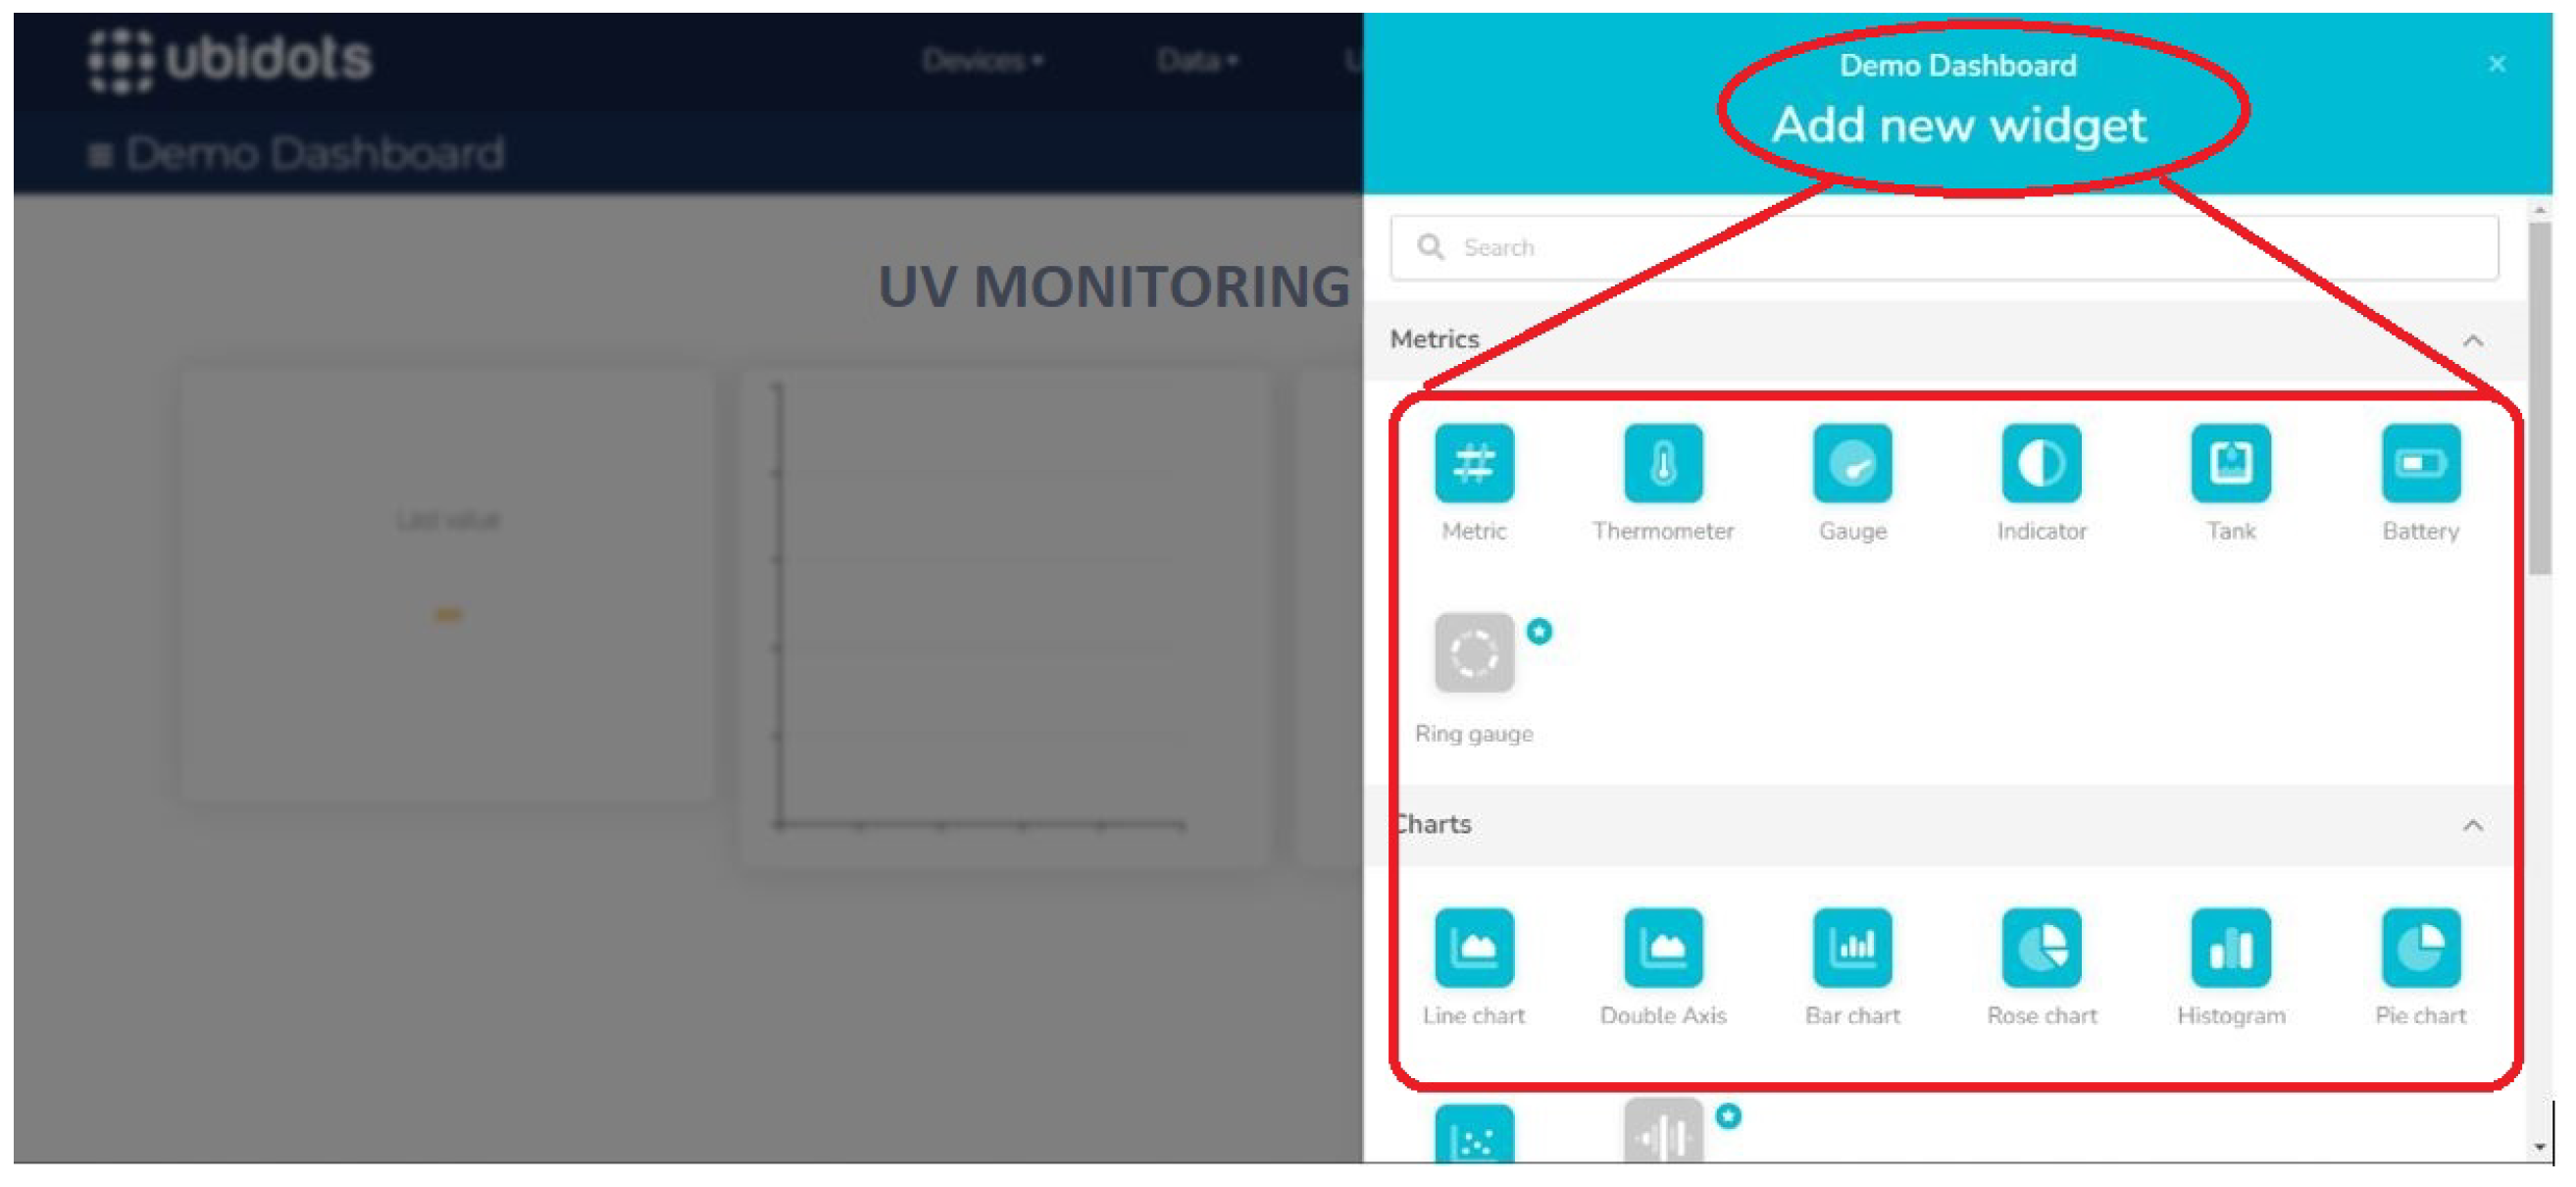
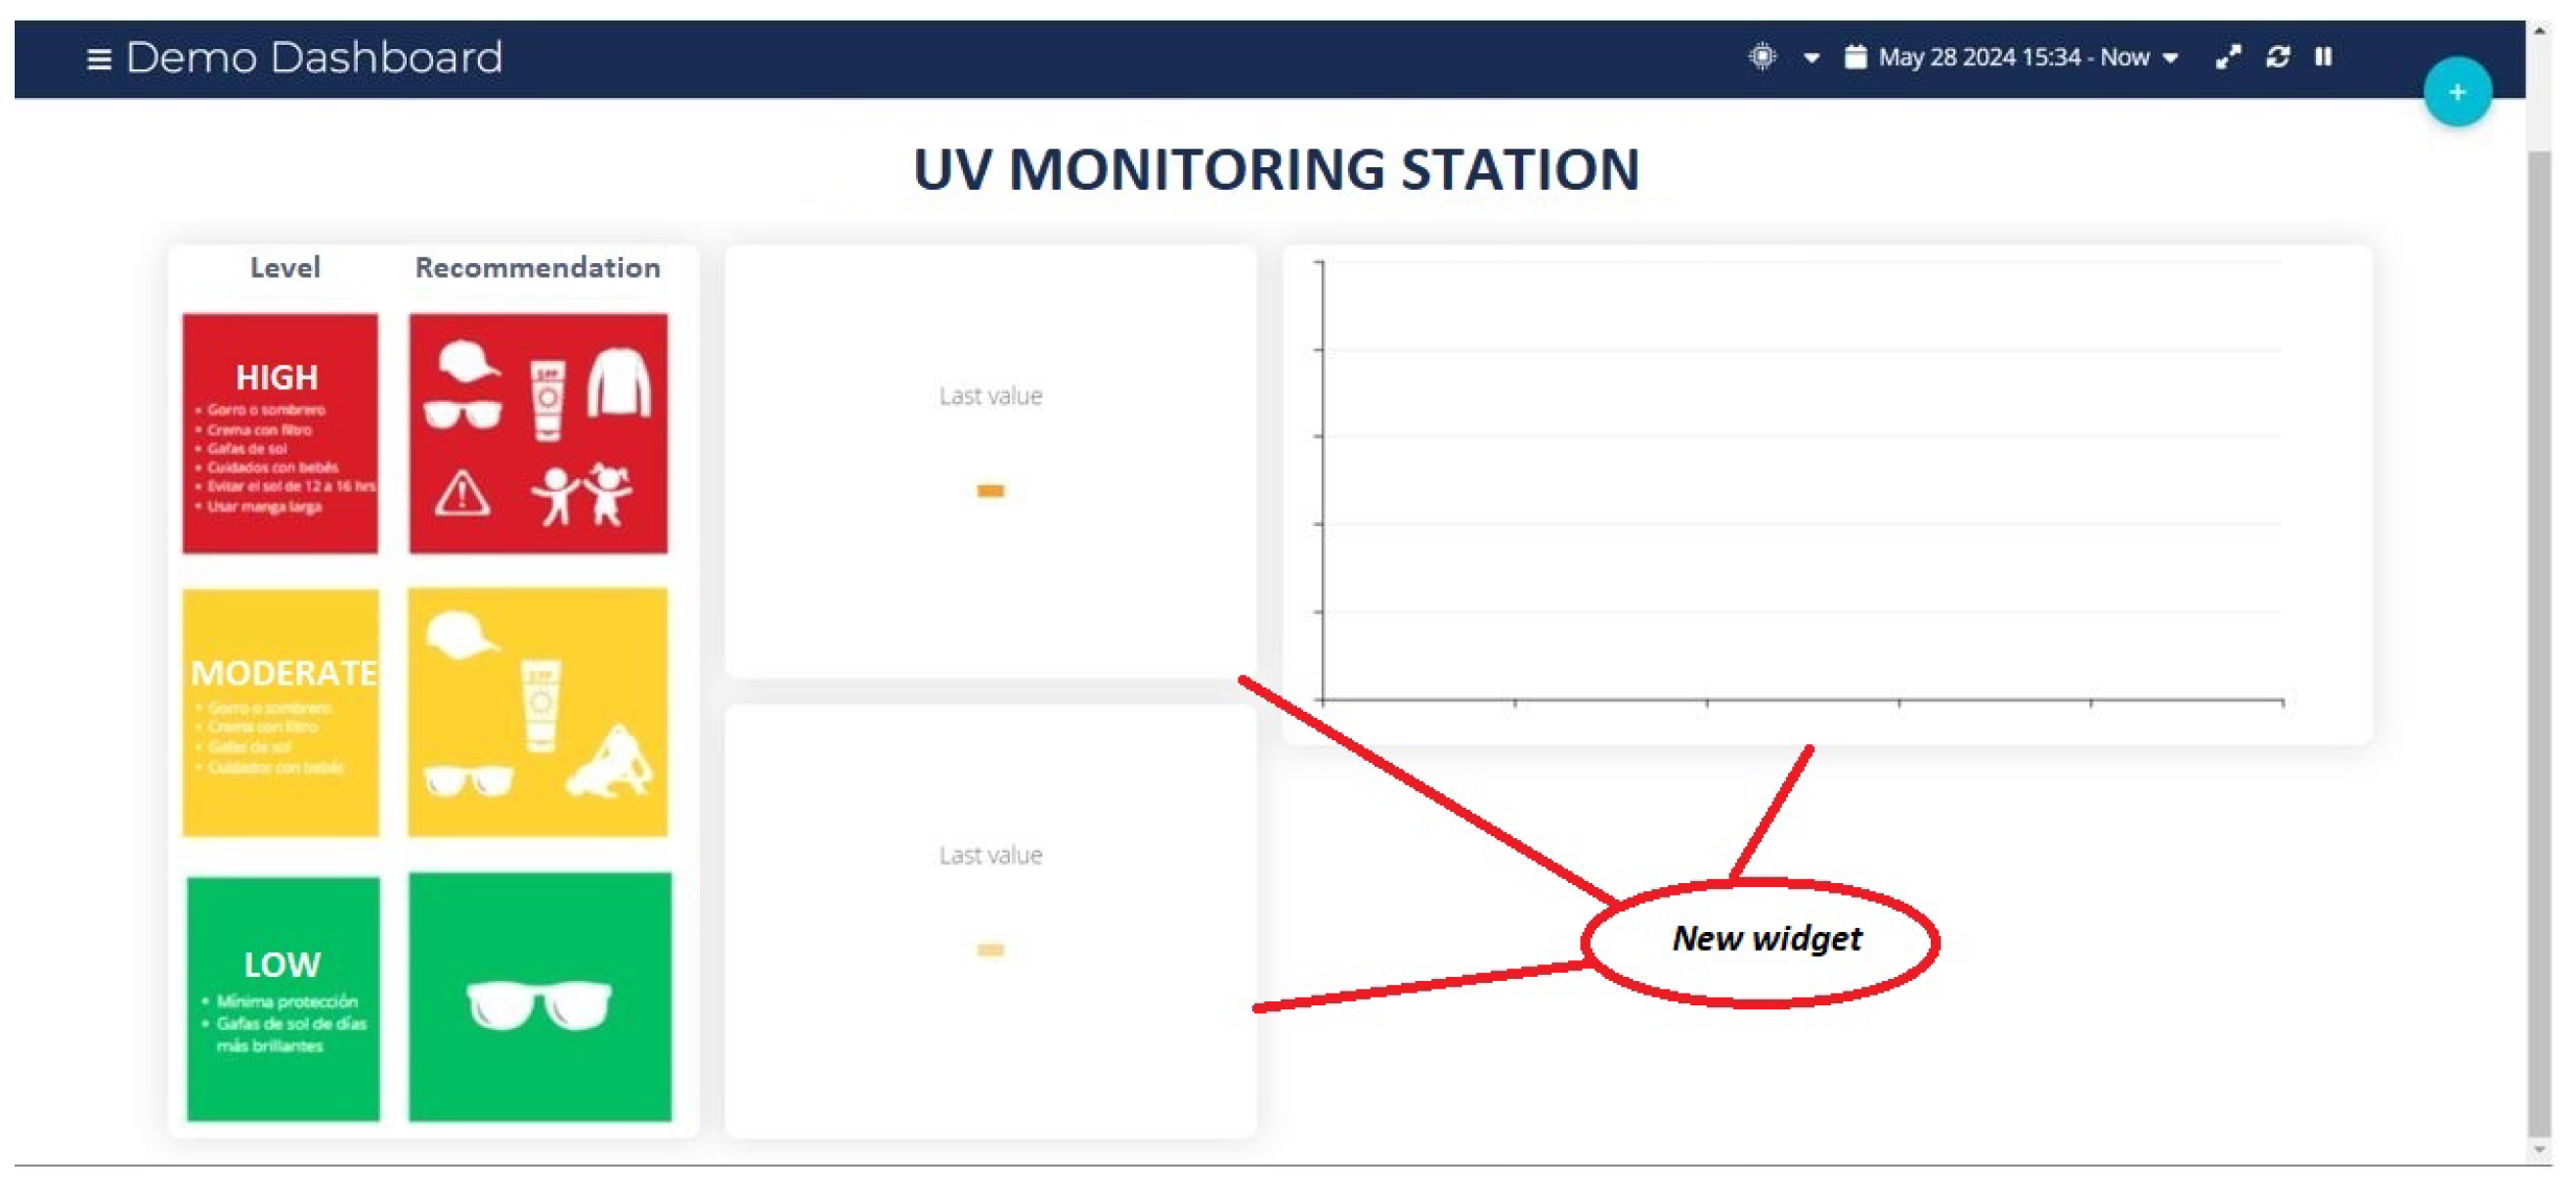
3.3.4. Tests with the Ubidots Platform
3.3.5. Estimated Duty Cycle Calculation
- Transmission frequency: 6 times per hour.
- Approximate duration of each packet: 100 ms (conservative estimate based on the initial LoRa configuration).
3.4. Results and Discussion
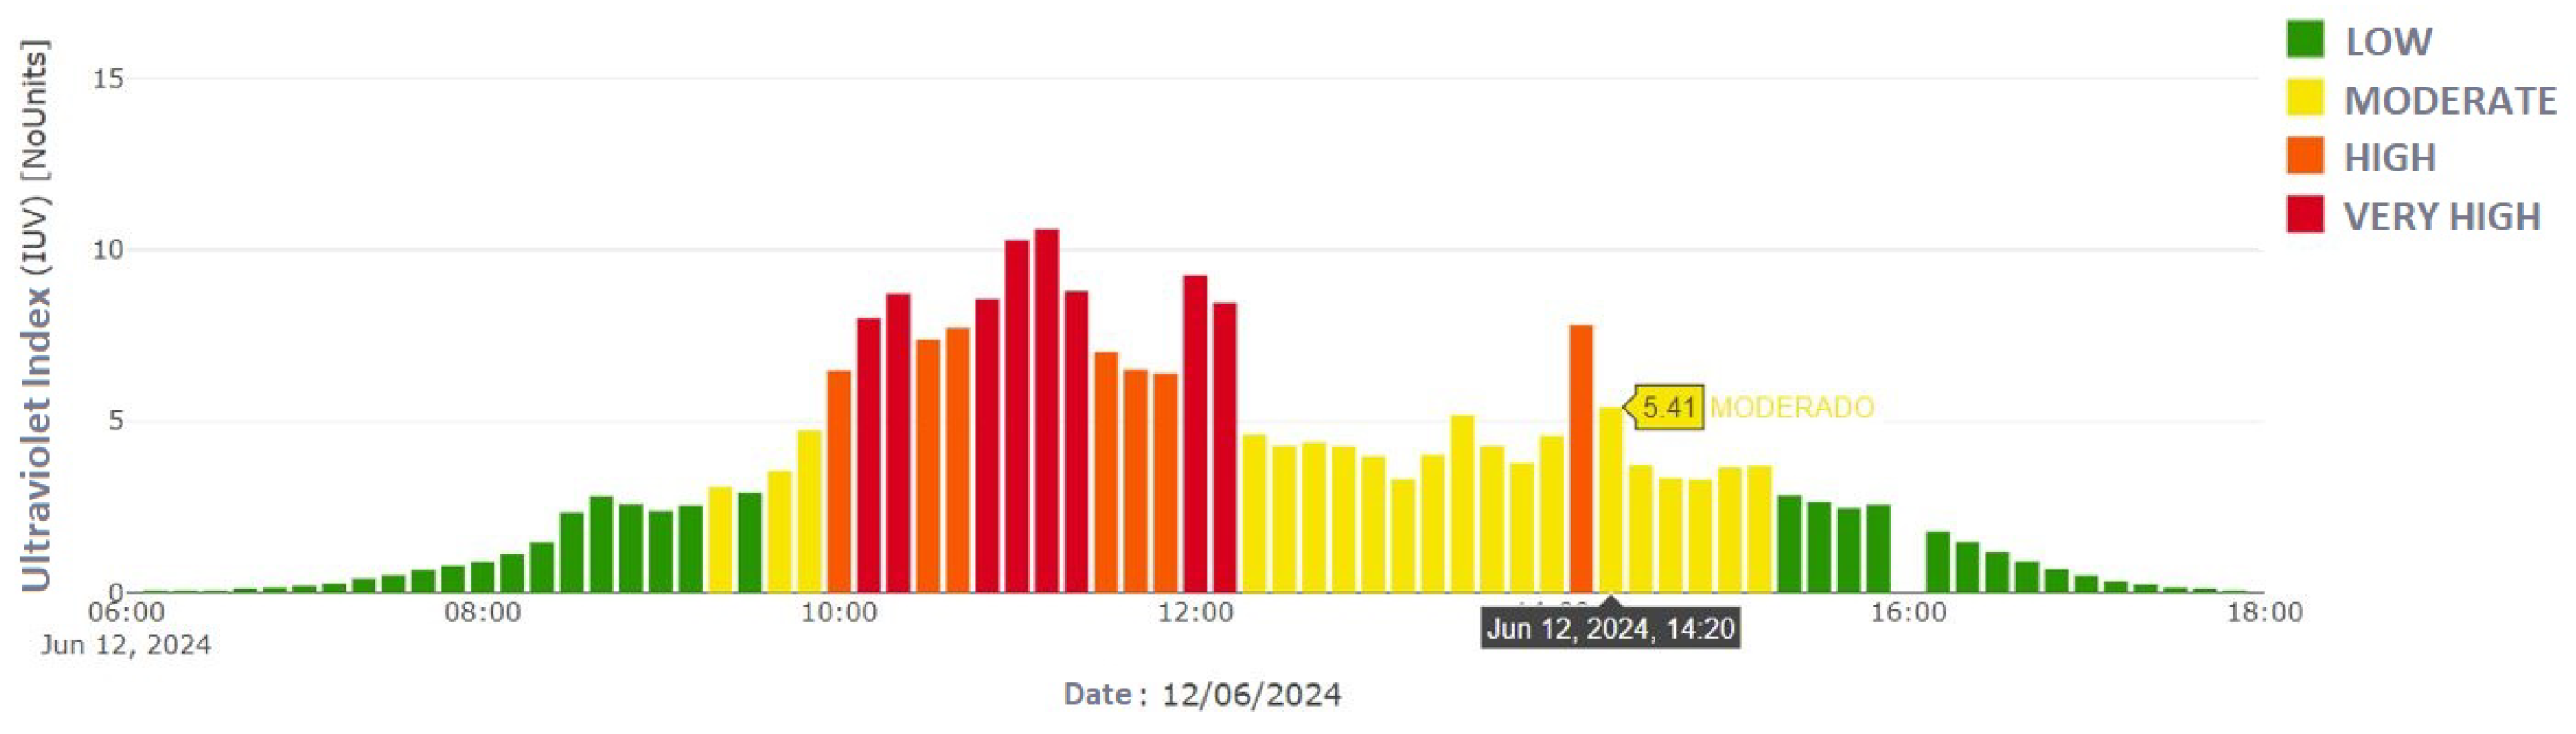
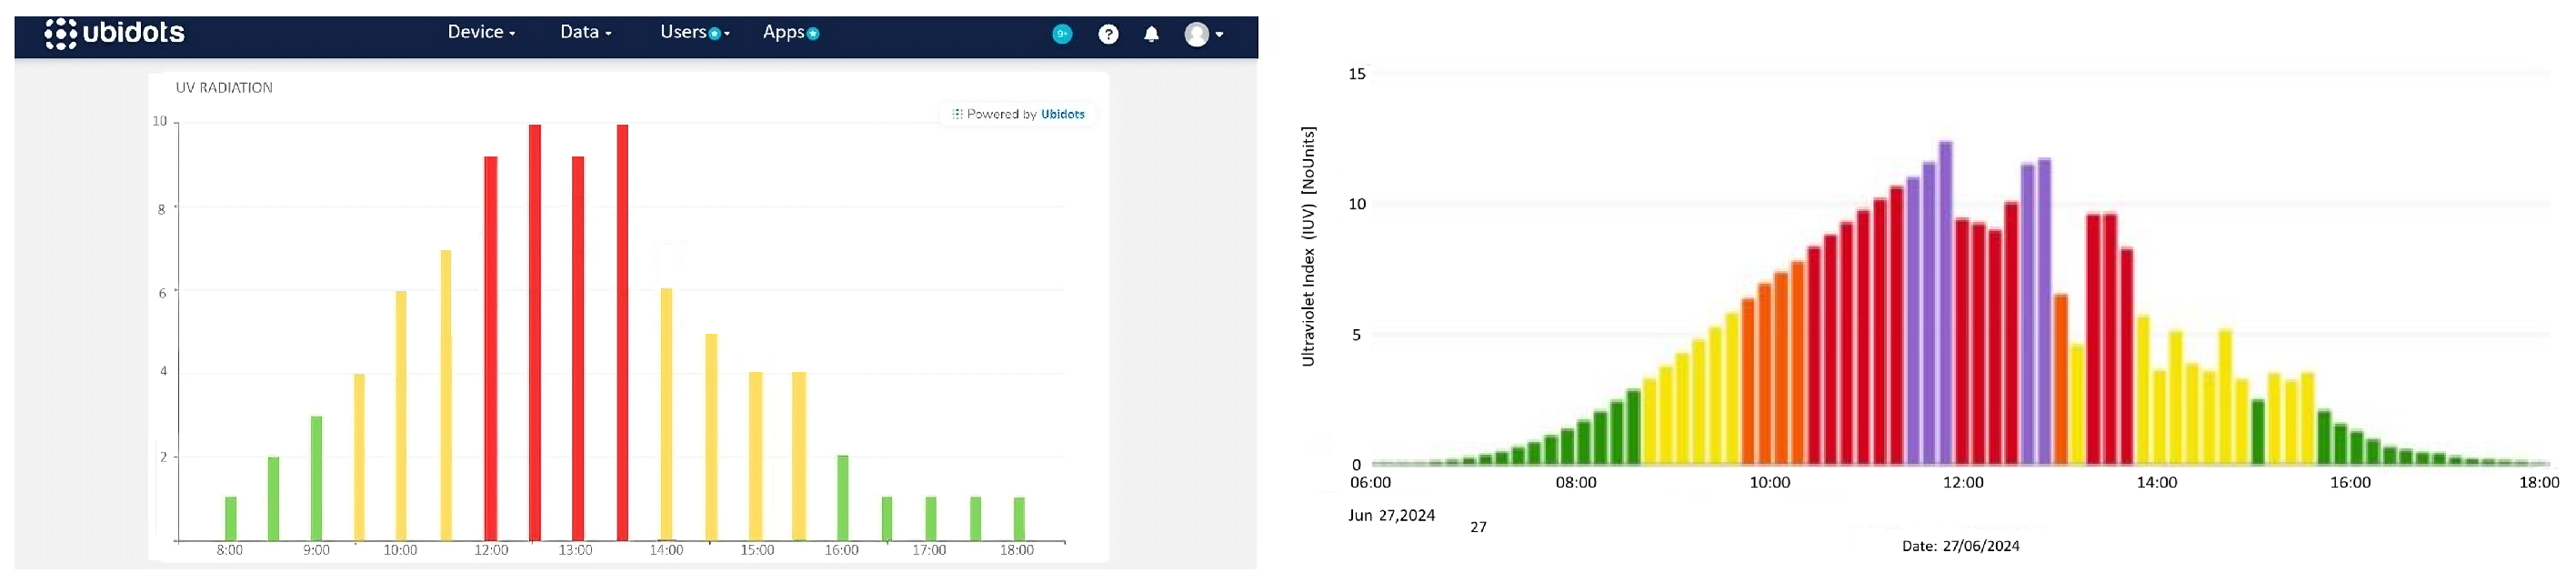
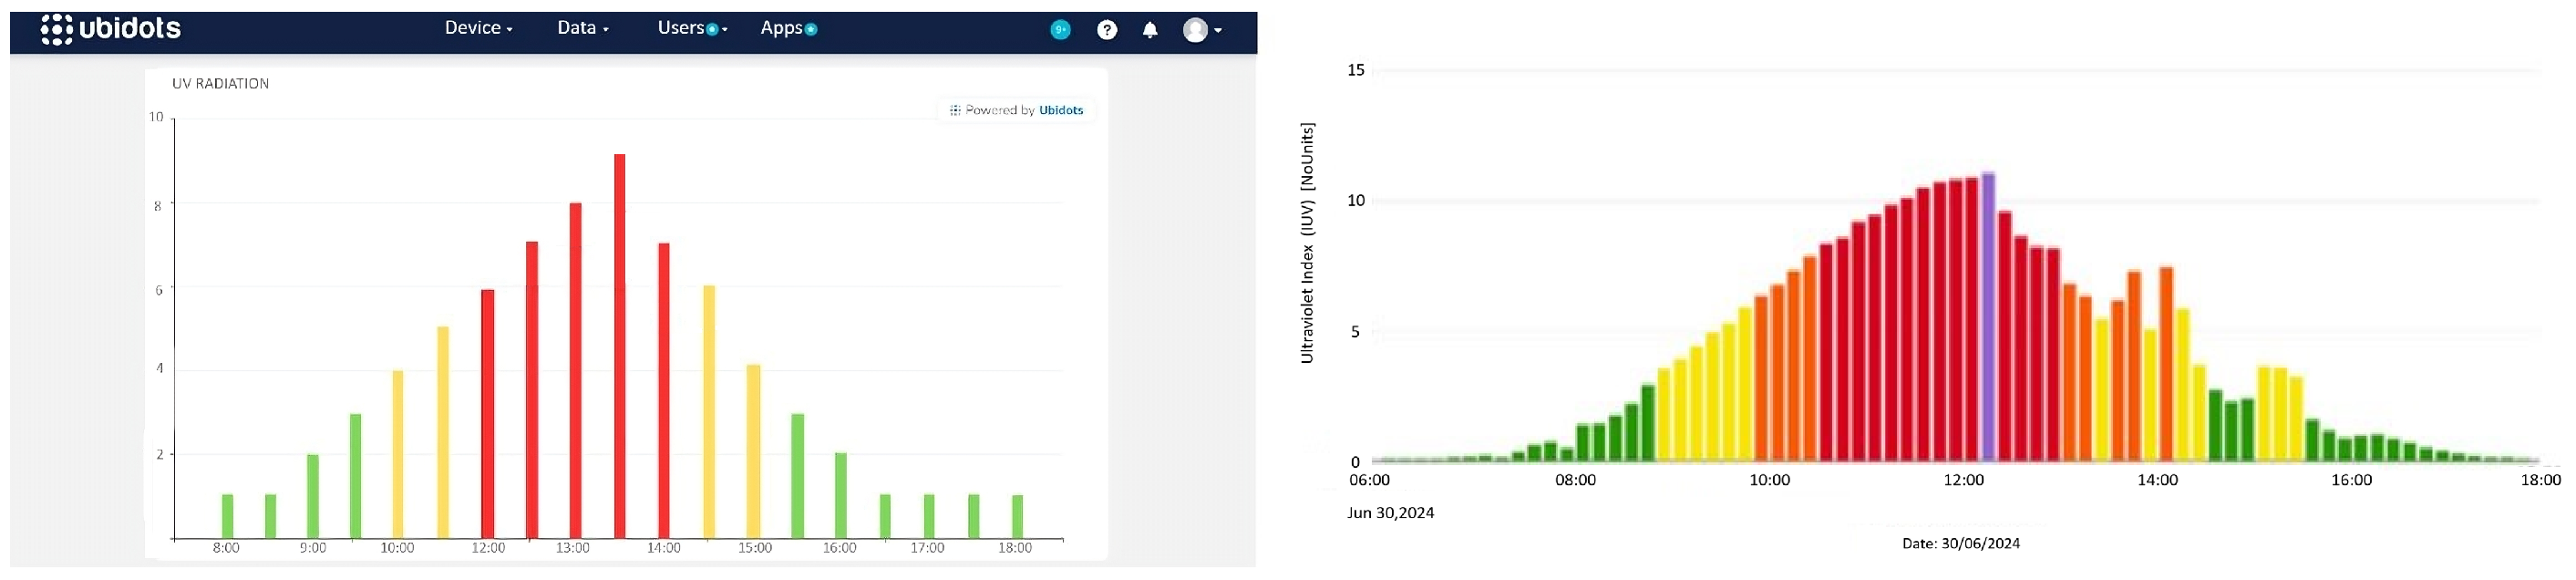
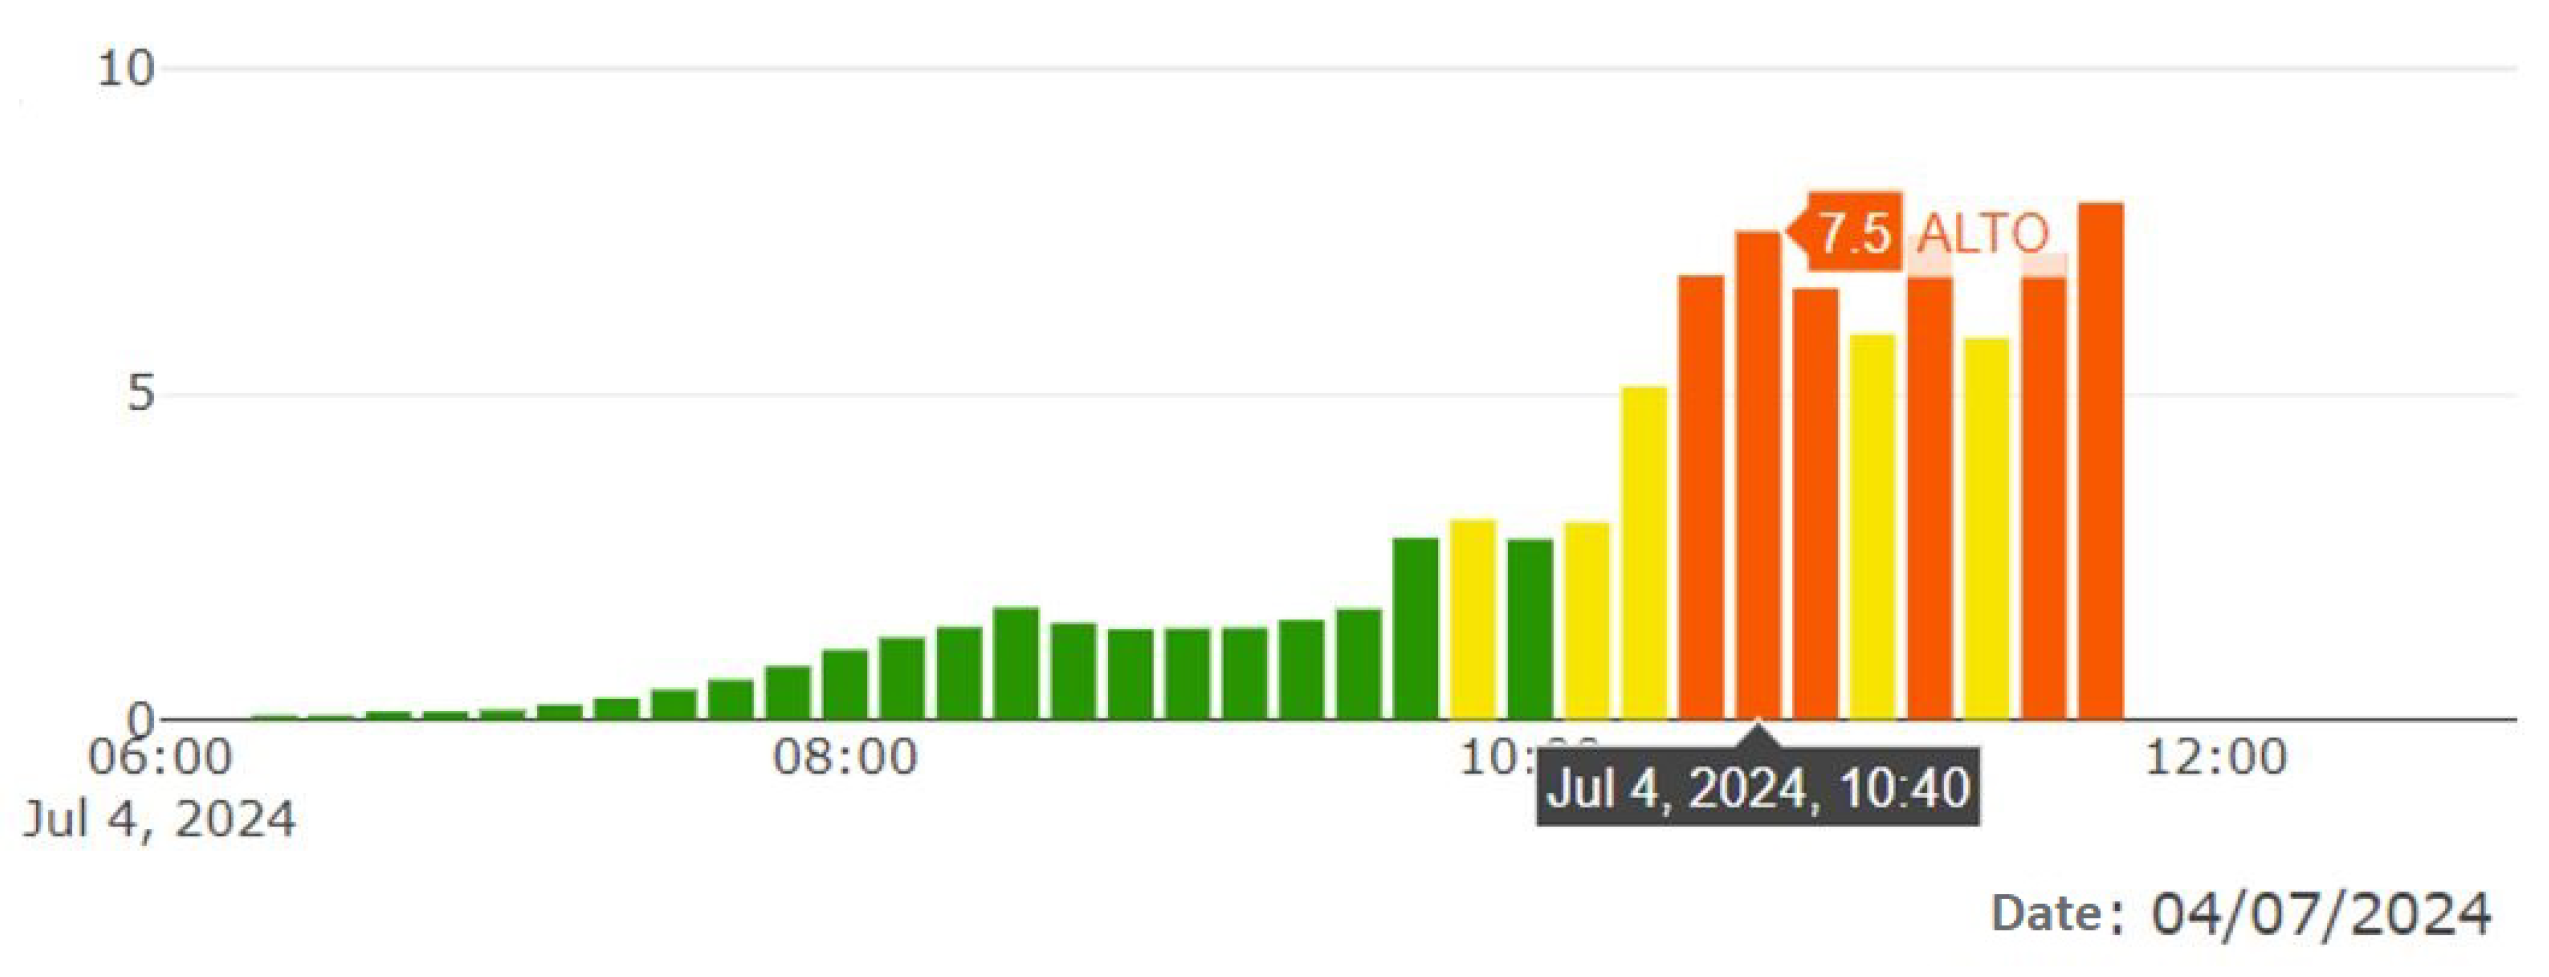
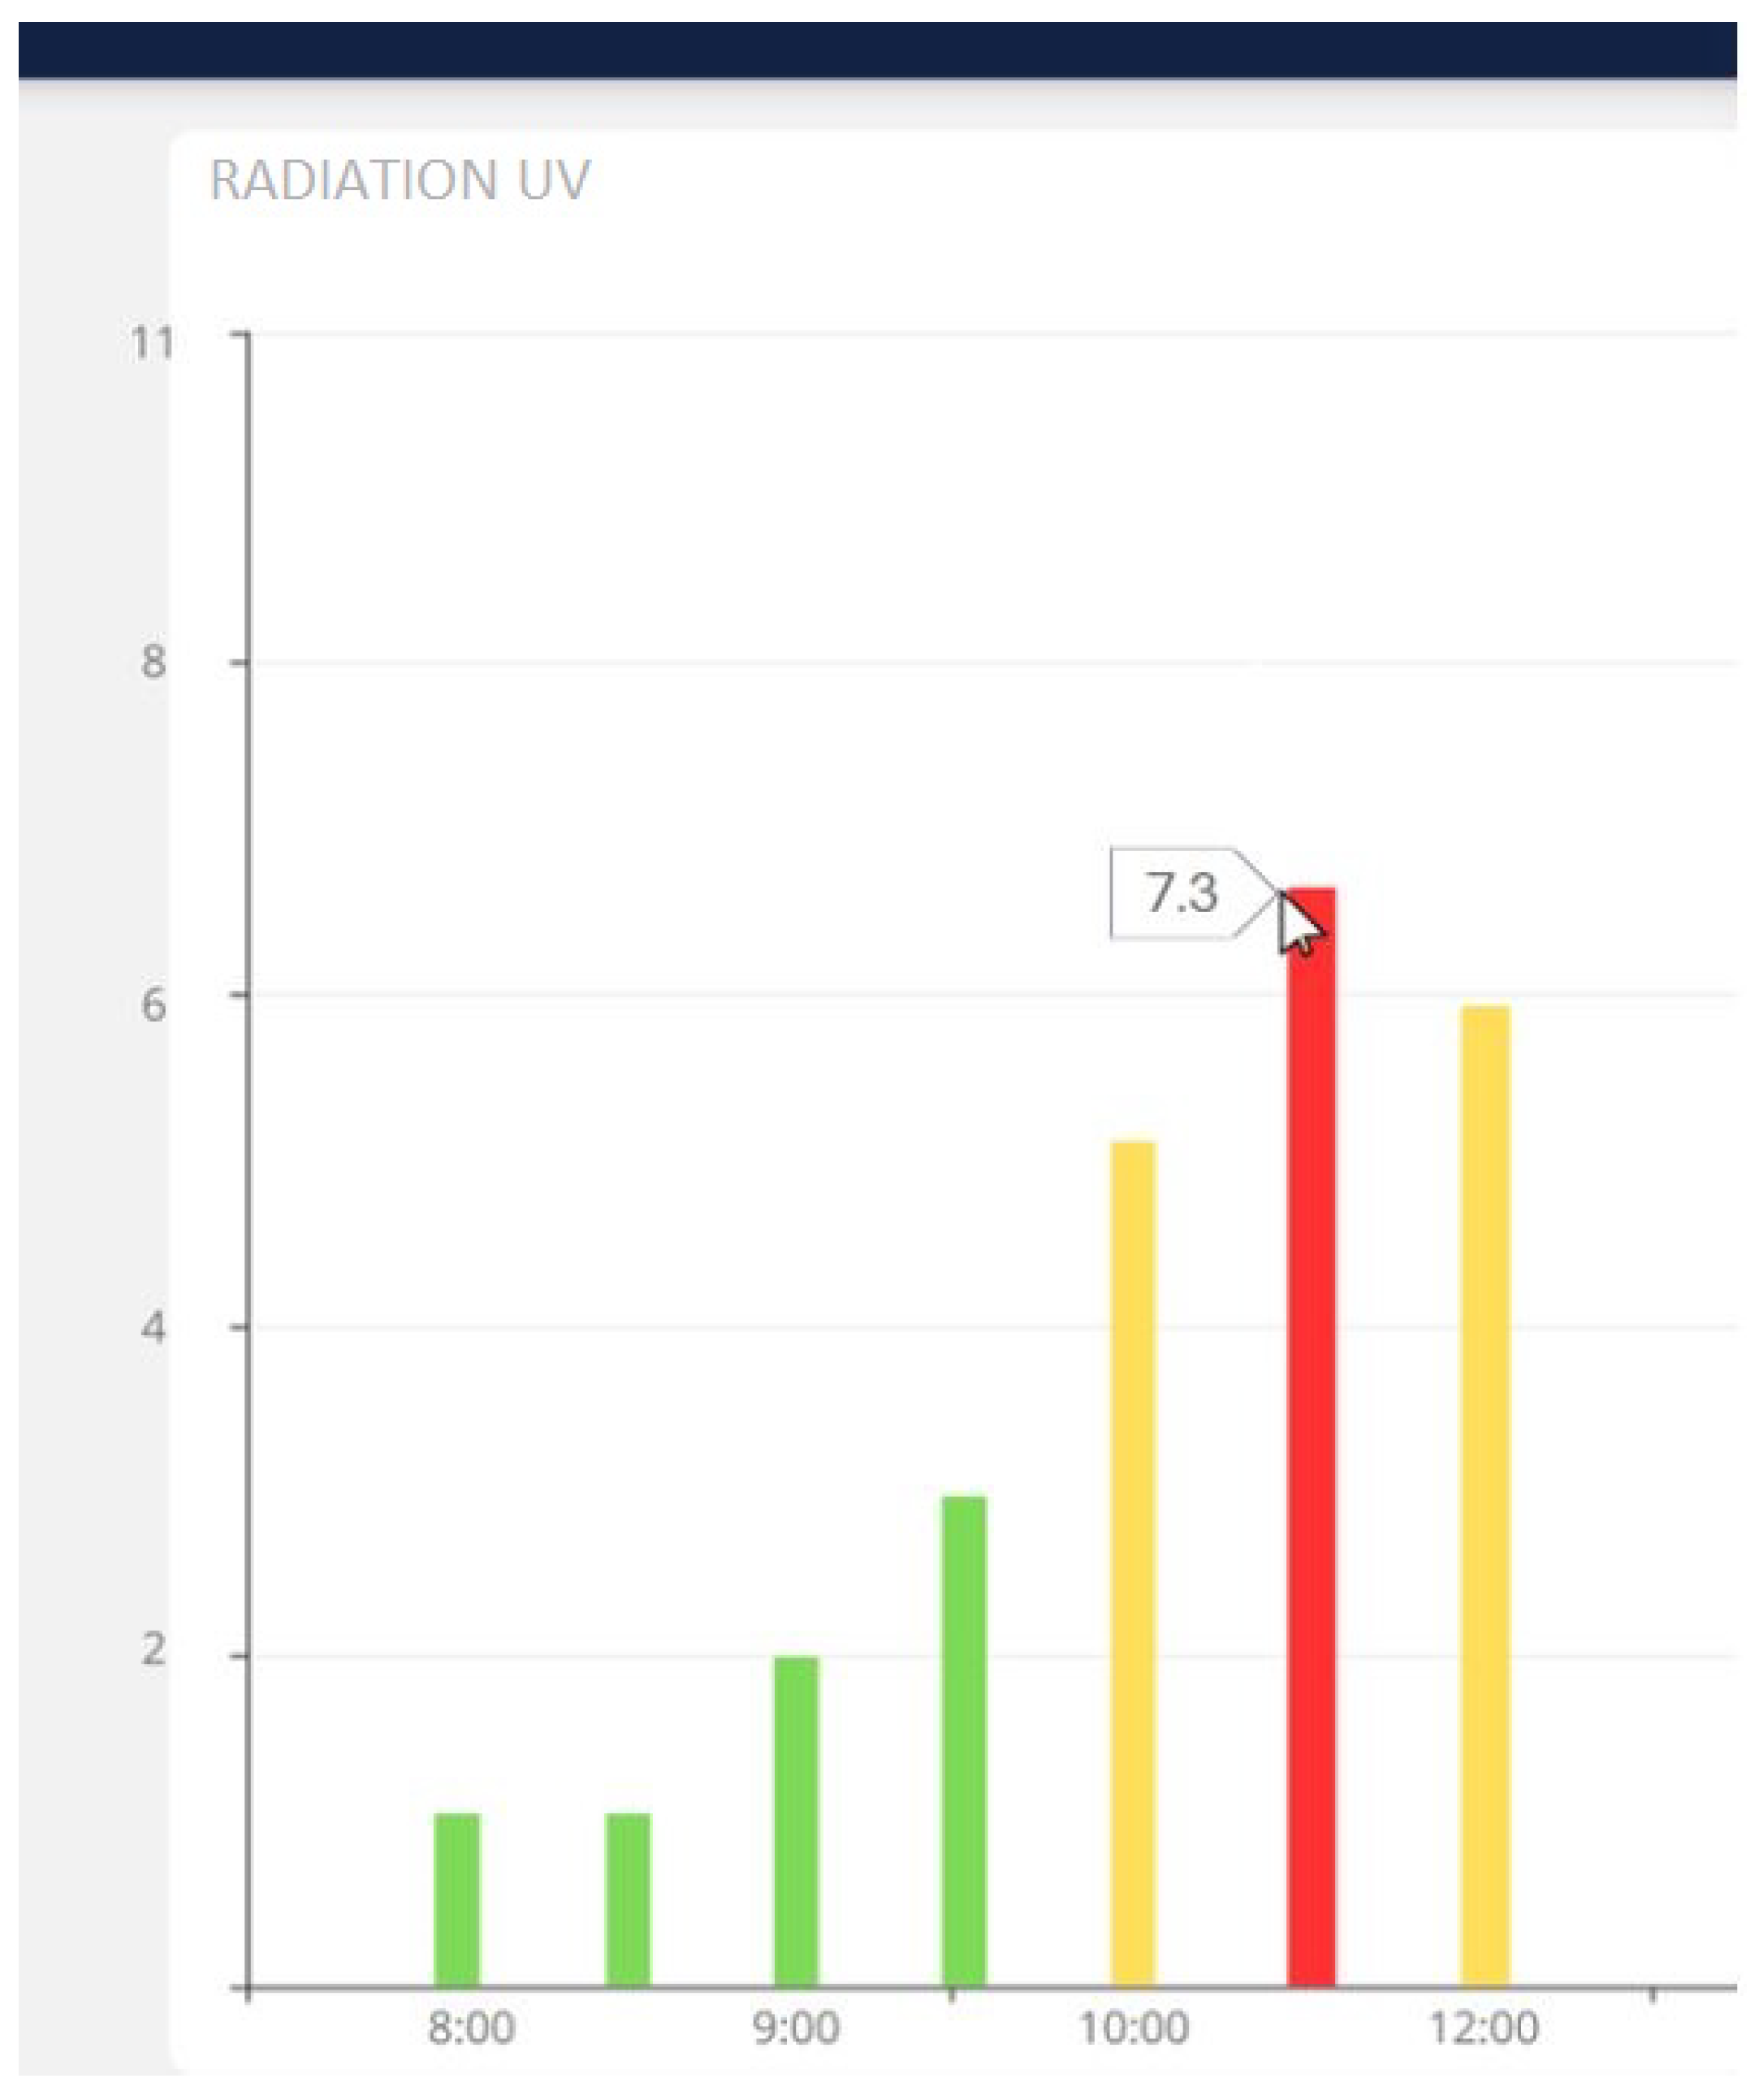
3.4.1. Comparison of UV Radiation Recorded by Each Individual Solarimeter
3.4.2. Data Collection and Analysis
3.4.3. Prototype Accuracy Compared to Other Professional UV Radiation Meters
4. Conclusions
Author Contributions
Funding
Institutional Review Board Statement
Informed Consent Statement
Data Availability Statement
Conflicts of Interest
References
- WHO. Ultraviolet Radiation and Health Risks. 2022. Available online: https://saudijournals.com/media/articles/SJEAT_710_533-541.pdf (accessed on 14 October 2024).
- UN Environment Programm; World Meteorological Organization. Environmental Effects of Ozone Depletion and Climate Change: 2018 Assessment; UN Environment Programme: Nairobi, Kenya, 2018. [Google Scholar]
- Bustamante, D.; Mercado, M. Radiación UV en Ecuador: Factores de Riesgo y Monitoreo. Rev. Climatol. 2016, 12, 45–57. [Google Scholar]
- Figueroa, C.; Hanania, E.; Gámez Espinosa, E.J.; Deya, M.C. Estudio de la acción de la luz UVC sobre pinturas. Rev. Cienc. Tecnol. 2023, 10, 25–26. [Google Scholar]
- Quest, A. Safeguarding Your Vehicle: Effective Strategies for Protecting Against UV Damage. 2023. Available online: https://automotivequest.com/protecting-against-uv-damage/ (accessed on 14 October 2024).
- Curbelo, F.; Leonard, D.D.; Cruz, Y.B.; Rodríguez, A.E.S. Cáncer de piel no melanoma y radiaciones ultravioletas. Rev. Cuba. Med. Gen. Integral 2020, 36, 152–160. [Google Scholar]
- Bankov, D.; Khorov, E.; Lyakhov, A. On the Limits of LoRaWAN Channel Access. IEEE Wirel. Commun. Lett. 2018, 7, 76–79. [Google Scholar] [CrossRef]
- Marín-García, E.J.; Alzate-Plaza, S.L.; Serna-Ruiz, A.F. Estación de medición de rayos ultravioleta alimentada por sistemas fotovoltaicos. Nr. J. Rev. 2020, 16, 163–179. [Google Scholar]
- Jaramillo, O.; Rodrigo, K.; Mendieta, O.; José, Á. Diseño e implementación de una red de sensores para el monitoreo de los niveles de radiación solar en la ciudad de Loja. Nr. J. Rev. 2019, 10, 44–55. [Google Scholar] [CrossRef]
- Moan, J.; Grigalavicius, M.; Baturaite, Z.; Dahlback, A.; Juzeniene, A. The relationship between UV exposure and incidence of skin cancer. J. Skin Health 2015, 31, 26–35. [Google Scholar] [CrossRef] [PubMed]
- Mehic, M.; Duliman, M.; Selimovic, N.; Voznak, M. LoRaWAN End Nodes: Security and Energy Efficiency Analysis. Alex. Eng. J. 2022, 61, 8997–9009. [Google Scholar] [CrossRef]
- Kanellis, V.G. Ultraviolet radiation sensors: A review. Biophys. Rev. 2019, 11, 895–899. [Google Scholar] [CrossRef] [PubMed]
- Okpara, C.R.; Idigo, V.E.; Oguchienti, S.M. Wireless Sensor Networks for Environmental Monitoring: A Review. IJETT J. 2020, 68, 68–71. [Google Scholar] [CrossRef]
- Seckmeyer, G.; Zittermann, A.; McKenzie, R.; Greinert, R. Solar Radiation and Human Health. In Environmental Toxicology; Springer: New York, NY, USA, 2013; pp. 529–564. [Google Scholar] [CrossRef]
- Monfort, I.O. Estudio de la Arquitectura y el Nivel de Desarrollo de la Red LoRaWAN y de los Dispositivos LoRa. Master’s Thesis, Universitat Politècnica de València, Valencia, Spain, 2017. [Google Scholar]
- Frequency Plans by Country. The Things Network. 2024. Available online: https://www.thethingsnetwork.org/docs/lorawan/frequencies-by-country/ (accessed on 25 June 2024).
- Bohórquez, L.; Alexander, J. Nano-satélite Recuperable Para Estudios de los Efectos de la Radiación Cósmica en una Carga Biológica Expuesta en la Estratósfera: Fase II. 2019. Available online: https://repositorio.unbosque.edu.co/items/deba3c65-1b3a-4007-b5e5-3d88911b6e4b (accessed on 28 June 2024).
- Guerrero, C. Implementación de un Sistema de Control y Monitoreo para la Radiación Ultravioleta en la Universidad Técnica de Cotopaxi en el Periodo Marzo 2019—Agosto 2019. 2019. Available online: https://repositorio.utc.edu.ec/items/87f850c6-e59d-4b18-93a9-d0a0bd00d700 (accessed on 28 June 2024).
- Industries, A. GUVA-S12SD Analog UV Light Sensor Breakout. 2011. Available online: https://cdn-shop.adafruit.com/datasheets/1918guva.pdf (accessed on 25 April 2025).
- DNK Power Co., Ltd. DNK505573 3.7V 2500mAh LiPo Battery Pack with PCM–Specification Sheet. 2023. Available online: https://www.dnkpower.com/wp-content/uploads/2023/11/DNK505573-3.7V-2500mAh-Lipo-Battery-Specification.pdf (accessed on 25 April 2025).
- LoRa Node Development Kit. Heltec Automation. 2022. Available online: https://heltec.org/project/lora-kit-151/ (accessed on 25 April 2025).
- SEMTECH Corporation. SX1262 Long Range, Low Power, Sub-GHz RF Transceiver Datasheet. 2018. Available online: https://www.semtech.com/products/wireless-rf/lora-connect/sx1262 (accessed on 25 April 2025).
- Heltec Automation. LoRa Node Development Kit Datasheet. 2022. Available online: https://heltec.org/project/lora-node-151/ (accessed on 25 October 2023).
- Municipio de Quito. Estaciones de Índice Ultravioleta (IUV). 2024. Available online: https://iuv.quito.gob.ec/ (accessed on 4 June 2024).
- ETSI EN 300 220-2 V2.1.2; Electromagnetic compatibility and Radio spectrum Matters (ERM); Short Range Devices (SRD); Radio Equipment to be Used in the 25 MHz to 1,000 MHz Frequency Range with Power Levels Ranging up to 500 mW; Part 2: Harmonized EN Covering the Essential Requirements of Article 3.2 of Directive 2014/53/EU. European Telecommunications Standards Institute: Sophia Antipolis, France, 2018.


| Proposal | Strengths | Weaknesses | Opportunities and Threats |
|---|---|---|---|
| Nanosatellite-based Monitoring | - High-precision data - Extensive coverage - Scientific value | - High cost and complexity - Launch and control limitations | Opportunities: International collaboration, high-impact research Threats: Launch failure, obsolescence, funding limitations |
| UV Radiometers with Traditional Telemetry | - Reliable and accurate data - Suitable for benchmark use | - Expensive equipment - Requires skilled maintenance | Opportunities: Use in industry or research labs Threats: Poor scalability, limited integration with LPWAN |
| Solarimeters with LoRaWAN (Selected) | - Cost-effective - Easy to deploy - Wireless long-range communication | - Lower precision than radiometers - Dependent on local gateways | Opportunities: Scalable for urban and rural networks, educational use Threats: Environmental interference, requires calibration |
| Parameter | Description |
|---|---|
| Master Chip | ESP32-S3FN8 (Xtensa®32-bit lx7 dual-core processor) |
| LoRa Chipset | SX1262 |
| USB-to-Serial Chip | CP2102 |
| Frequency | 470~510 MHz, 863~928 MHz |
| Max. TX Power | 21 ± 1 dBm |
| Max. Receiving sensitivity | −134 dBm |
| Wi-Fi | 802.11 b/g/n, up to 150 Mbps |
| Bluetooth | Bluetooth LE: Bluetooth 5, Bluetooth mesh |
| Aspect | Description |
|---|---|
| Sensor sensitivity | Calibrated UV sensors with a typical sensitivity of ±1 µW/cm2 |
| Measurement range | 0 to 15 mW/cm2 |
| Accuracy | Validated in the laboratory by comparing against a certified professional radiometer from the Quito Environmental Monitoring Network |
| Power supply | A 3.7 V LiPo battery with a 2500 mAh capacity, combined with a 5 V–500 mA solar panel for energy autonomy |
| Average energy consumption | 75 mA during active mode (lasting 2–3 s per cycle); below 10 µA in deep sleep mode |
| Energy-saving strategies | Deep sleep mode of the ESP32 microcontroller, cyclic measurement every 10 min, short LoRa transmission duration (100 ms) |
| Calibration process | Calibration was conducted by comparing the sensor’s readings with certified equipment from the municipal UV monitoring network; a correction function was applied in the firmware |
| Node placement criteria | Nodes were placed along an ecological trail on the university campus, considering (a) direct sunlight exposure; (b) verified LoRaWAN coverage from a strategically located gateway; and (c) physical safety and accessibility for periodic maintenance |
| Scenario | Brief Description | Distance (m) | Tx/Rx Height (m) | Environmental Characteristics |
|---|---|---|---|---|
| 1 | 4° slope profile, LoS evaluation | 336 | 2 / 1 | Sloped terrain, no major obstructions |
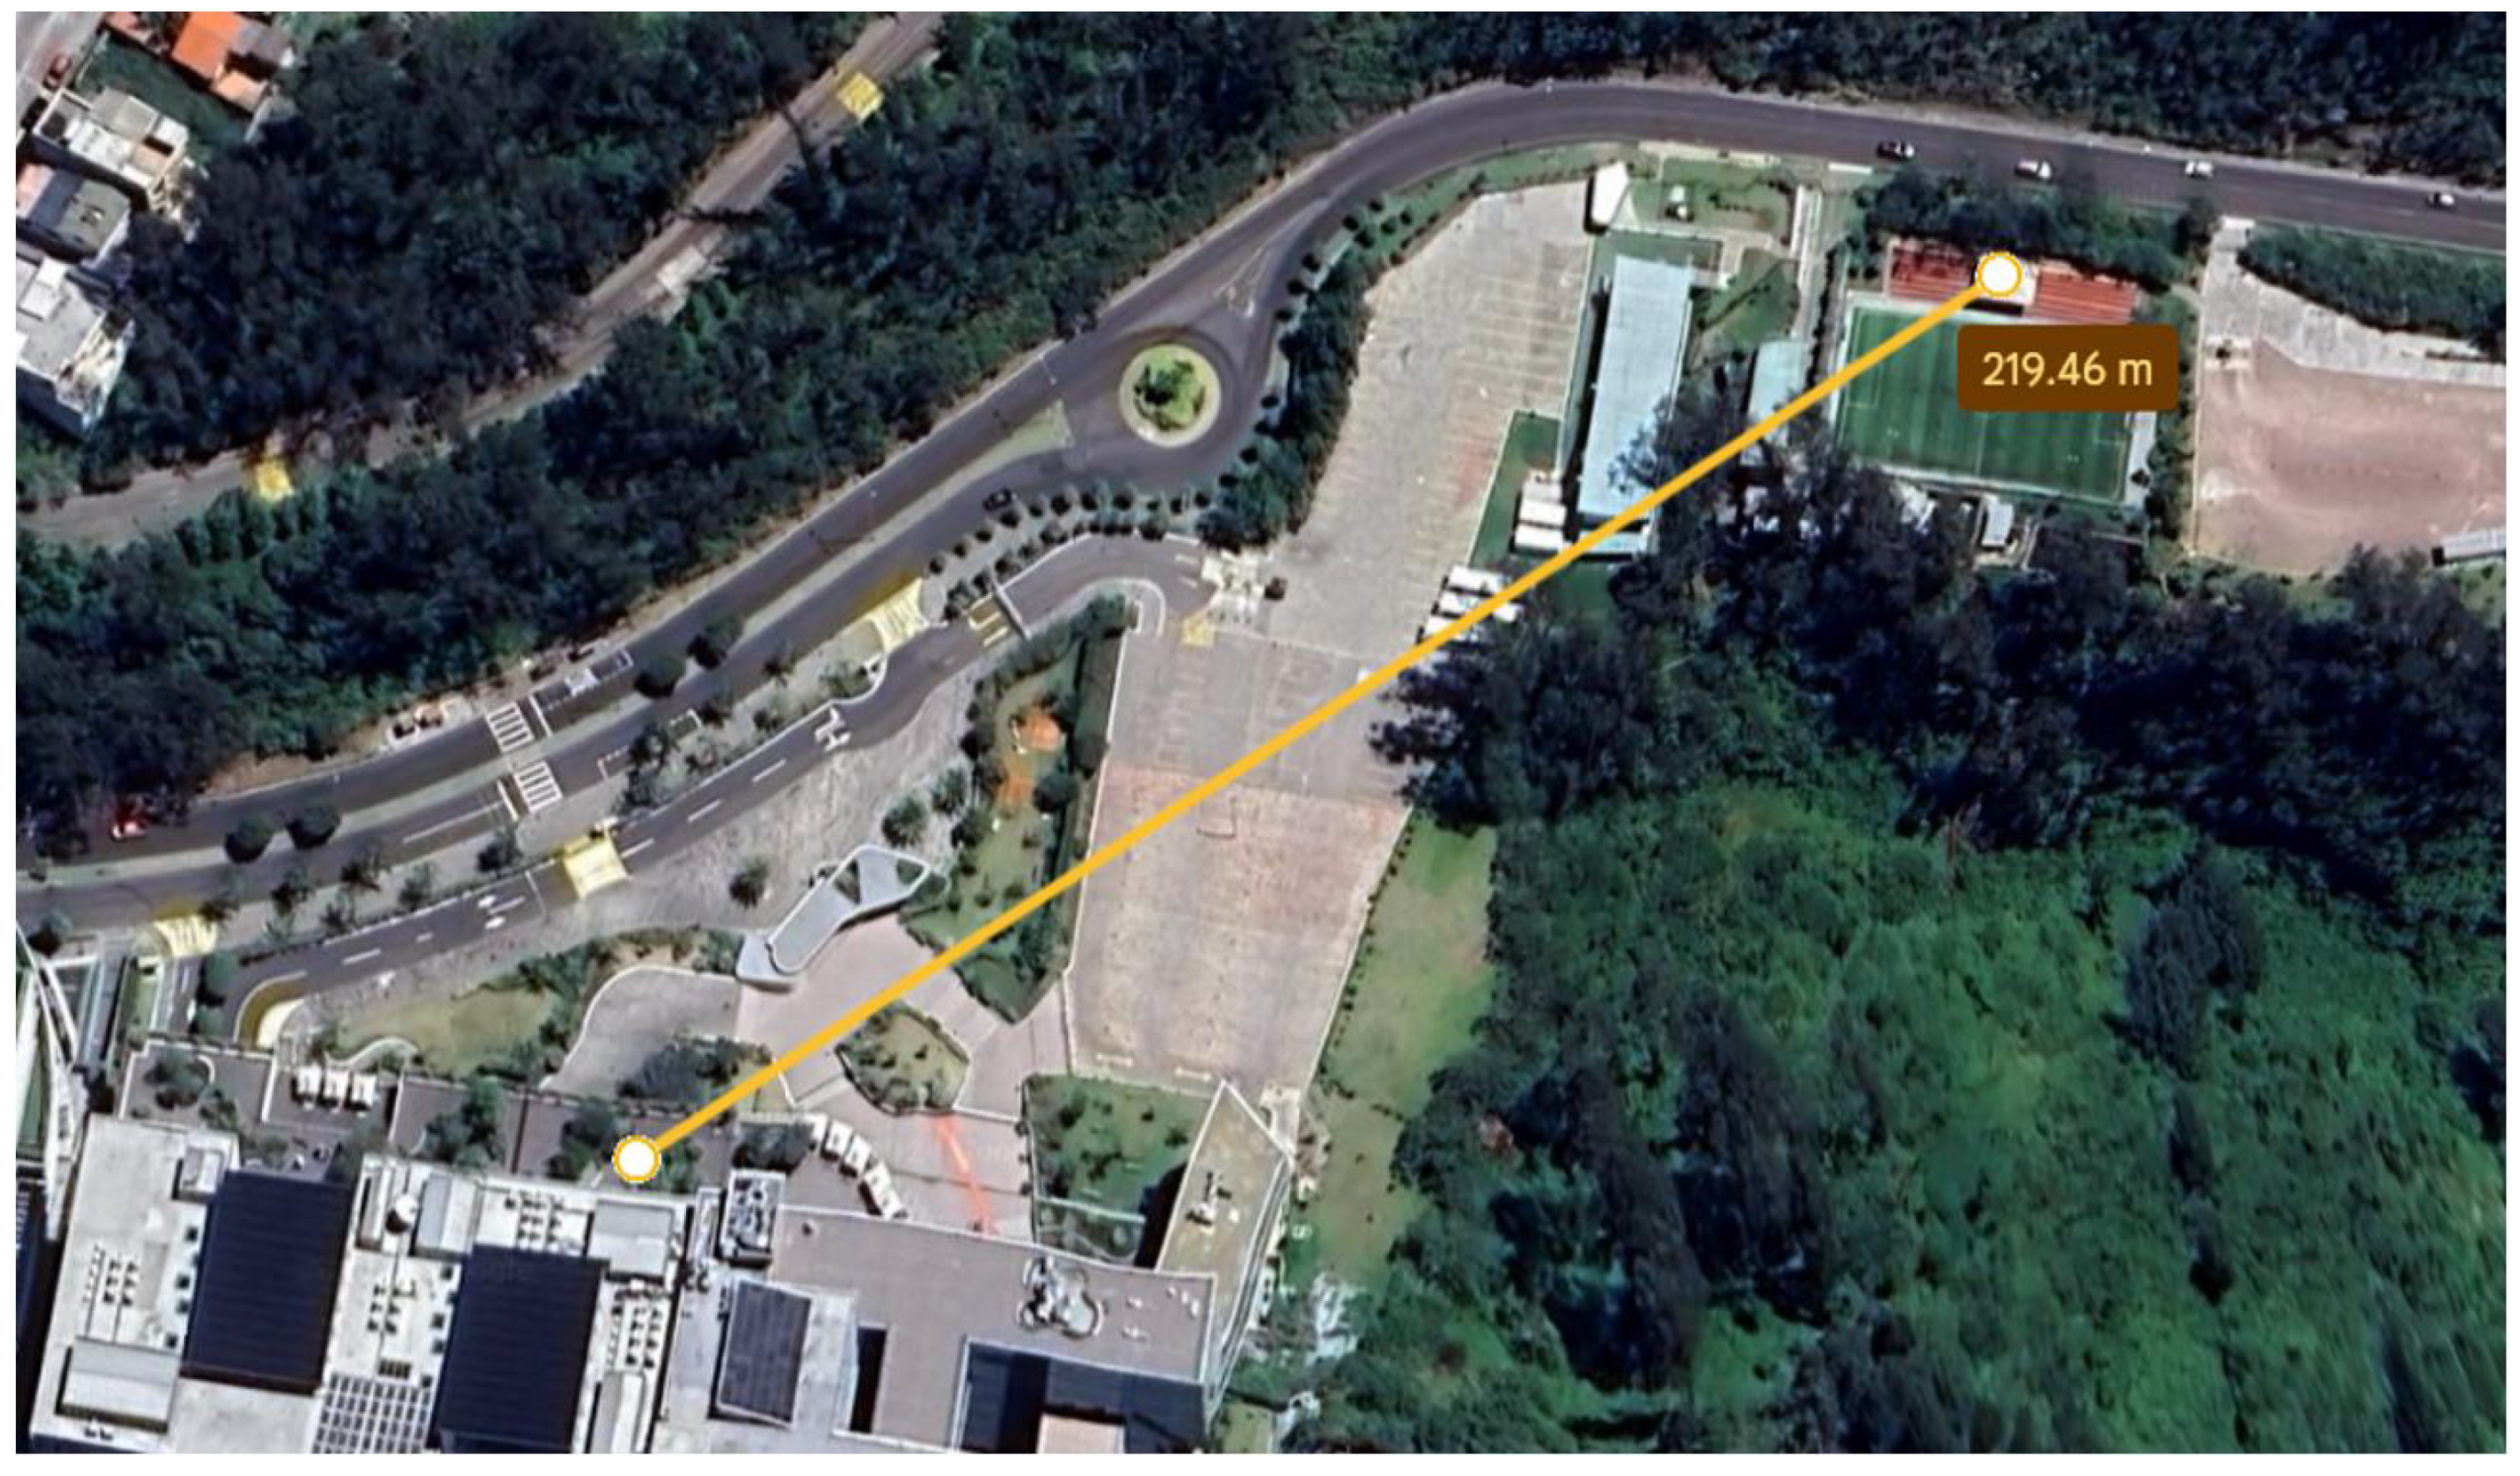
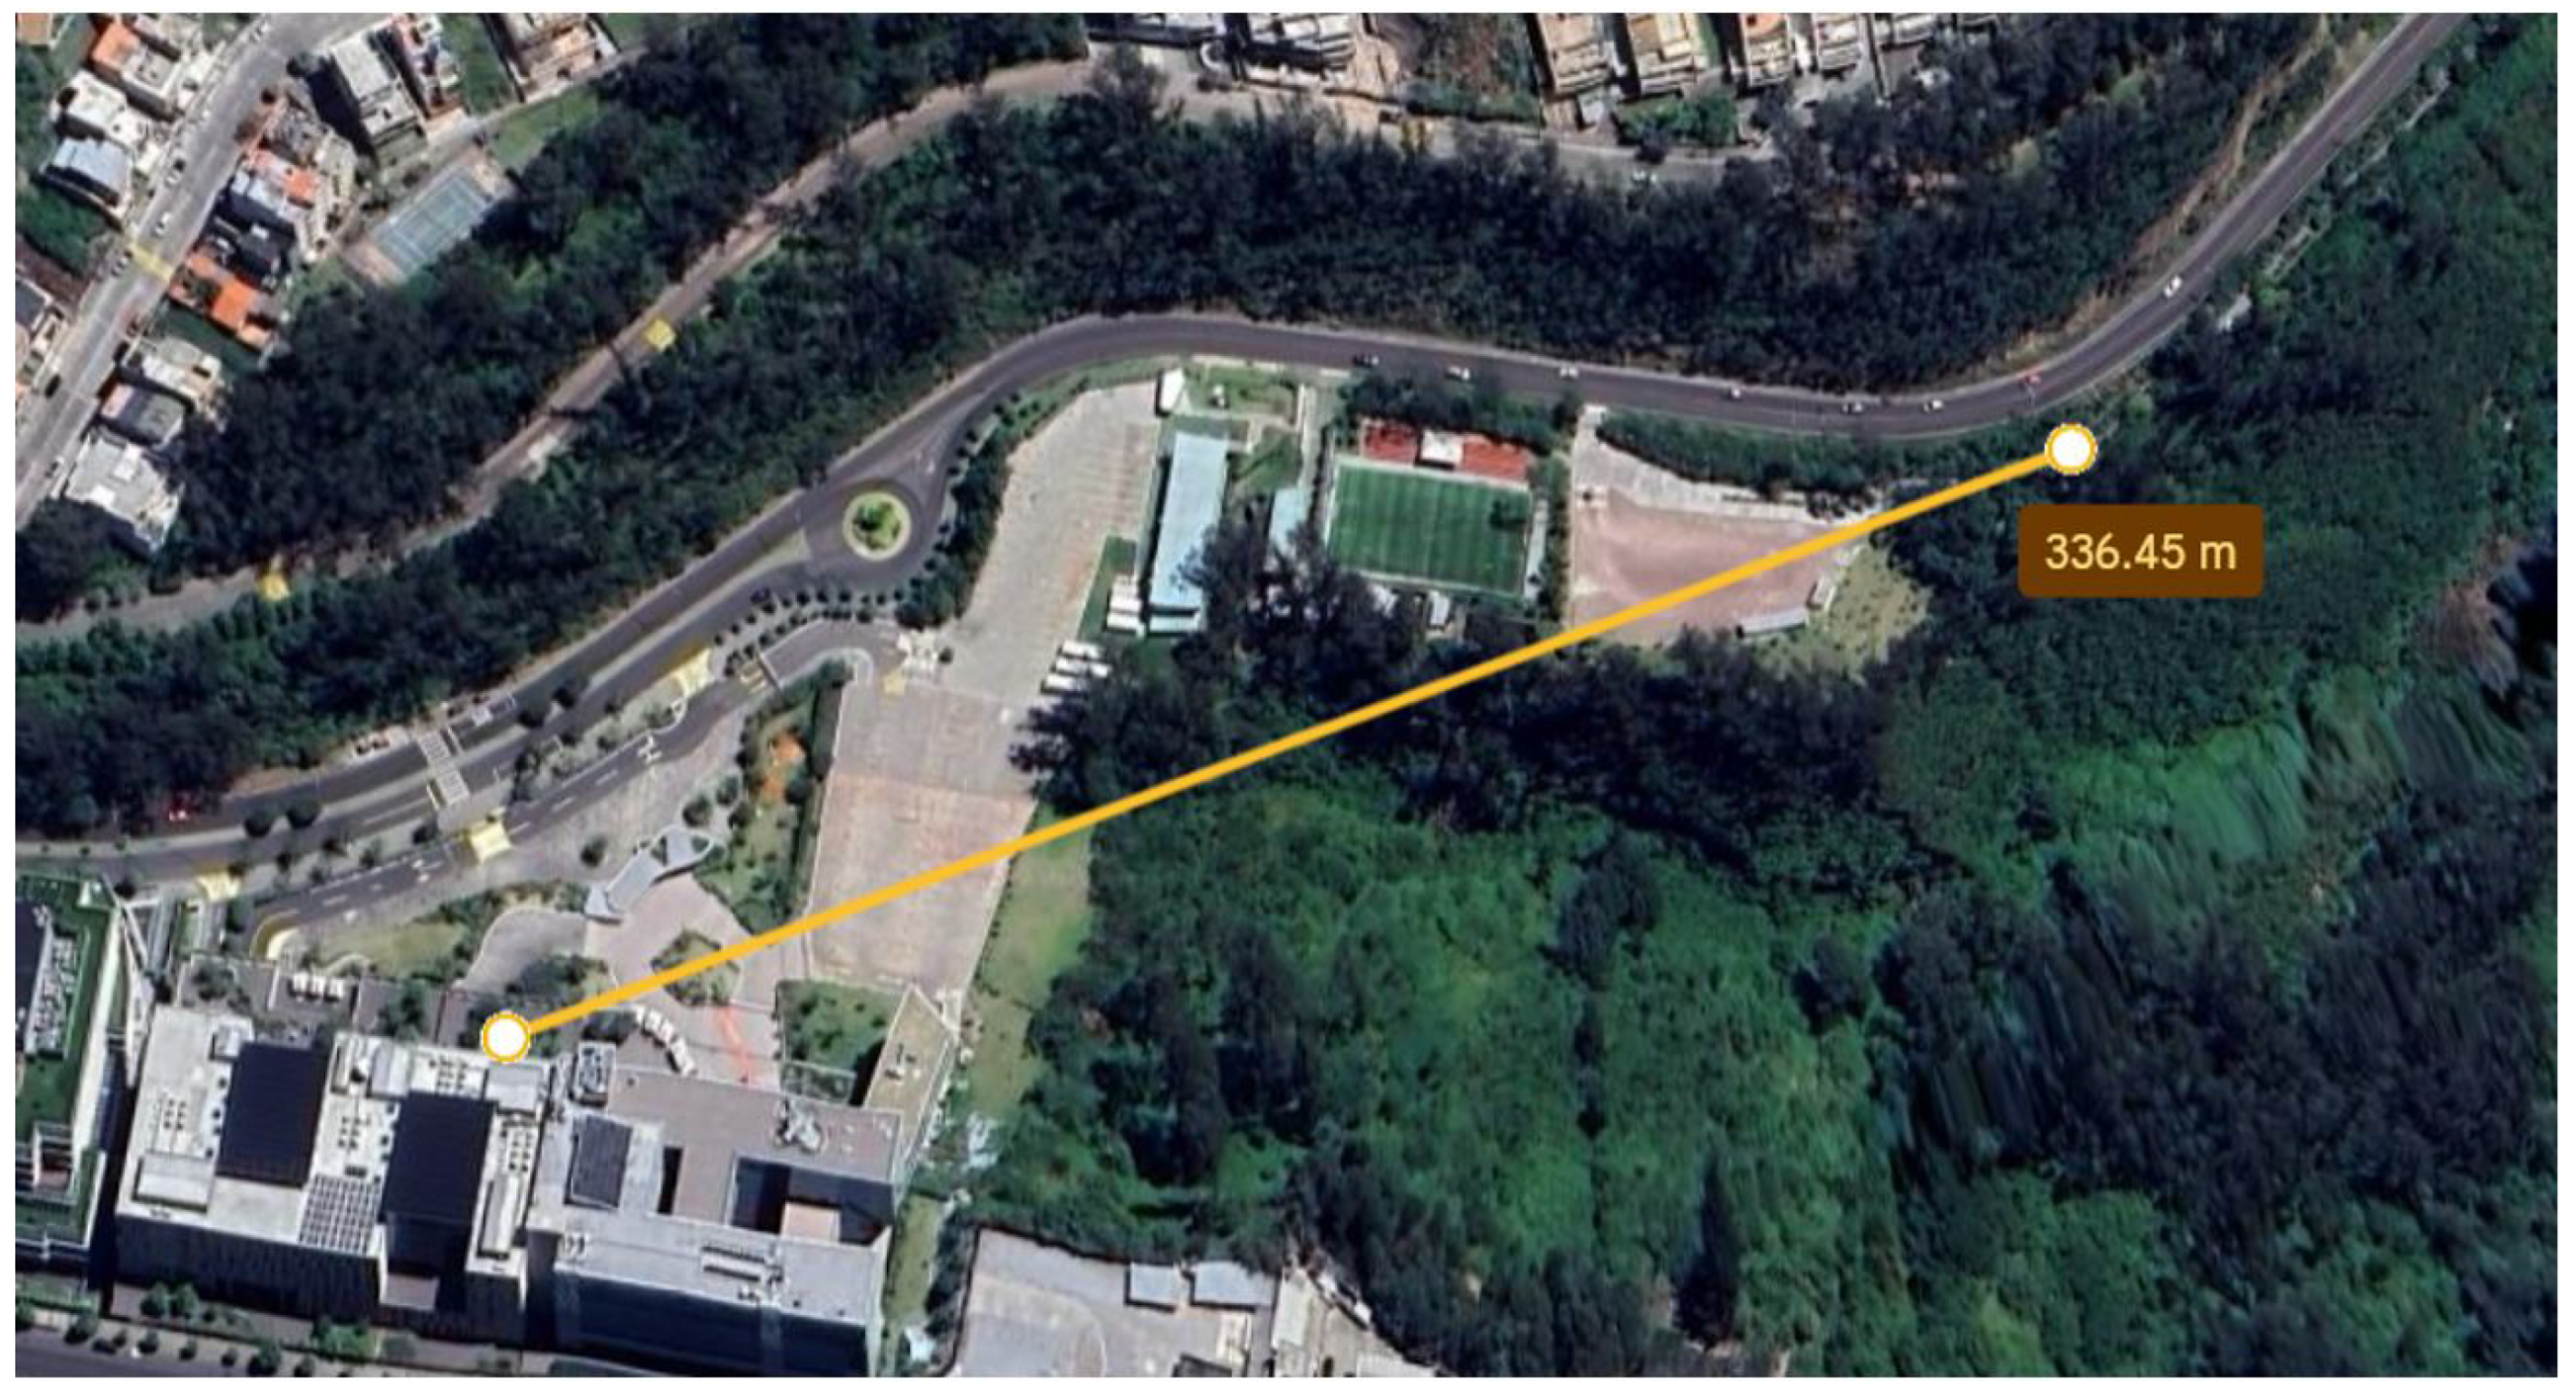
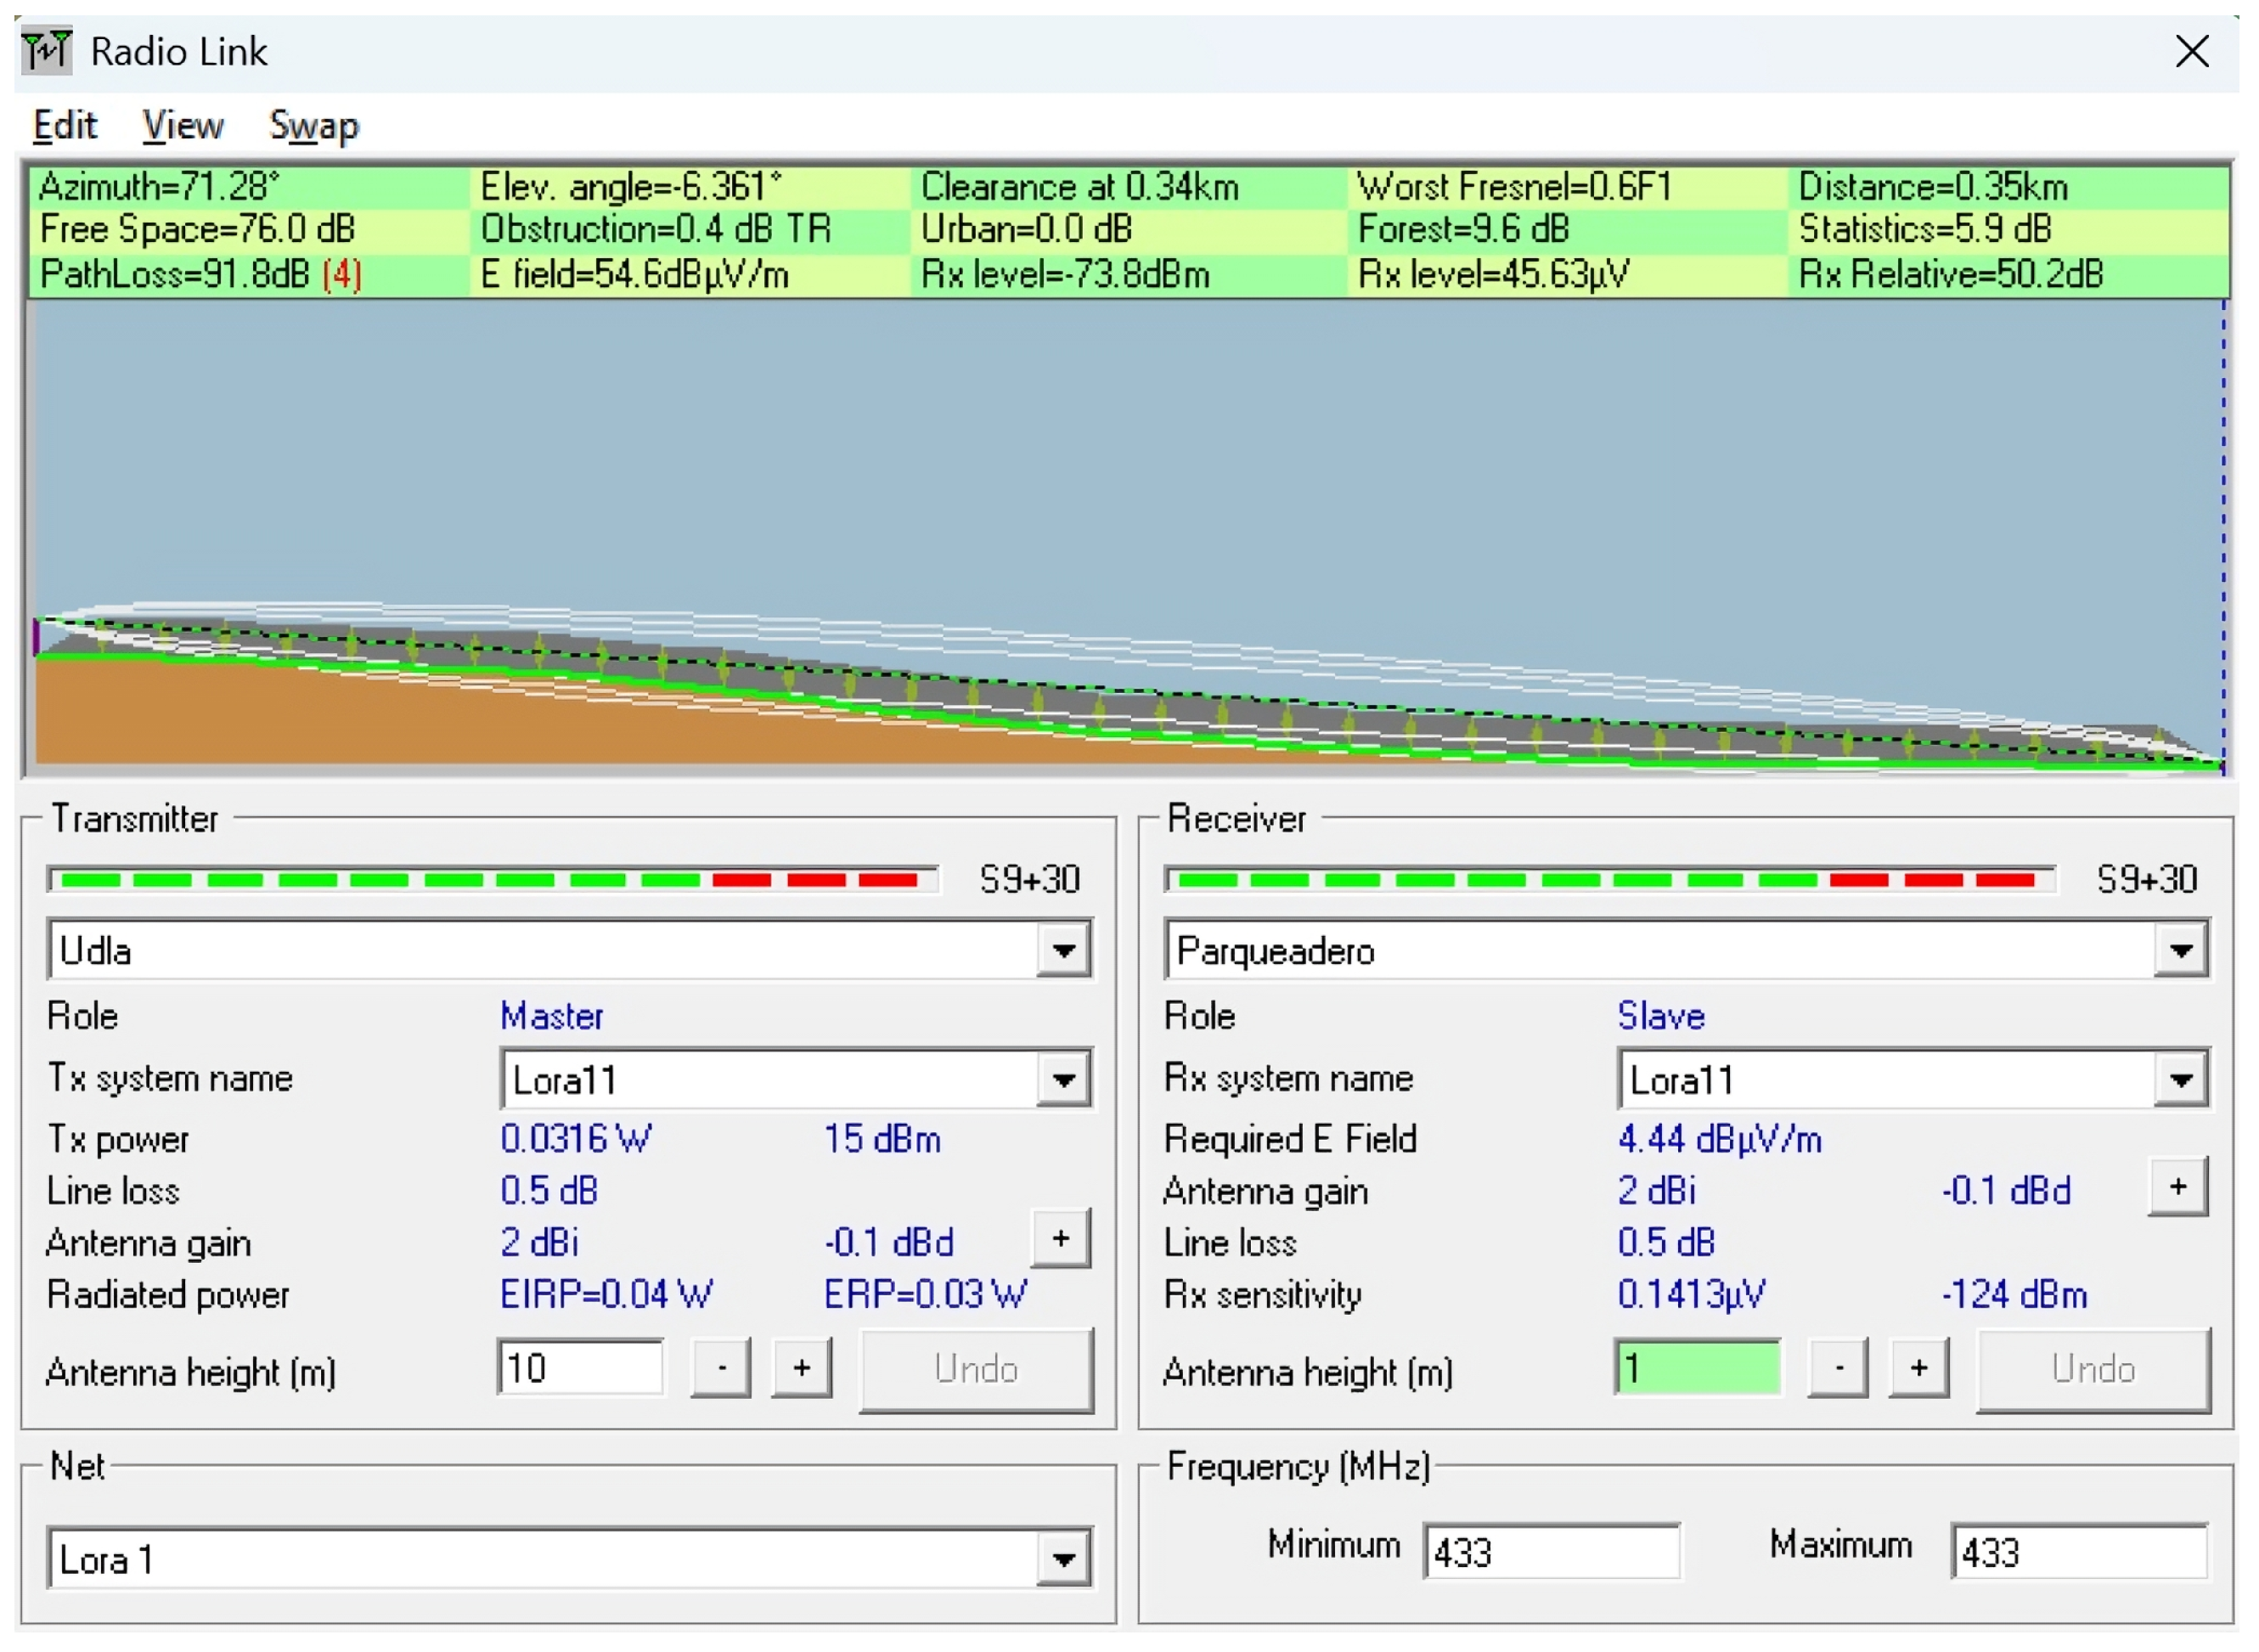
| 2 | Real case with observed loss at 336 m | 336 | 10 / 1 | Moderate vegetation, link failure despite sufficient power |
| 3 | Communication across a ravine | 370 | 10 / 1 | Rx in lower areas, dense vegetation, vertical obstruction |
| 4 | Open area (control) | 490 | 10 / 1 | Clear terrain, good alignment with transmitter |
| 5 | Forested section | 490 | 10 / 1 | Dense vegetation, same profile as Scenario 4 for comparison |
| 6 | Extended path with vegetation | 560 | 10 / 1 | Similar elevation to Tx, light vegetation, most distant point |
| S | Latitude (Rx) | Longitude (Rx) | TxH (m) | RxH (m) | D (m) | OD (m) | Path Loss (dB) | Rx Power (dBm) | Observation |
|---|---|---|---|---|---|---|---|---|---|
| 1 | −0.161931 | −78.456219 | 2 | 1 | 336 | 90 | 102.6 | −84.6 | Simulated with identical Tx and Rx height. |
| 2 | −0.161931 | −78.456219 | 10 | 1 | 336 | 320 | 91.8 | −73.8 | Real case, data loss observed at 91.58 dB. |
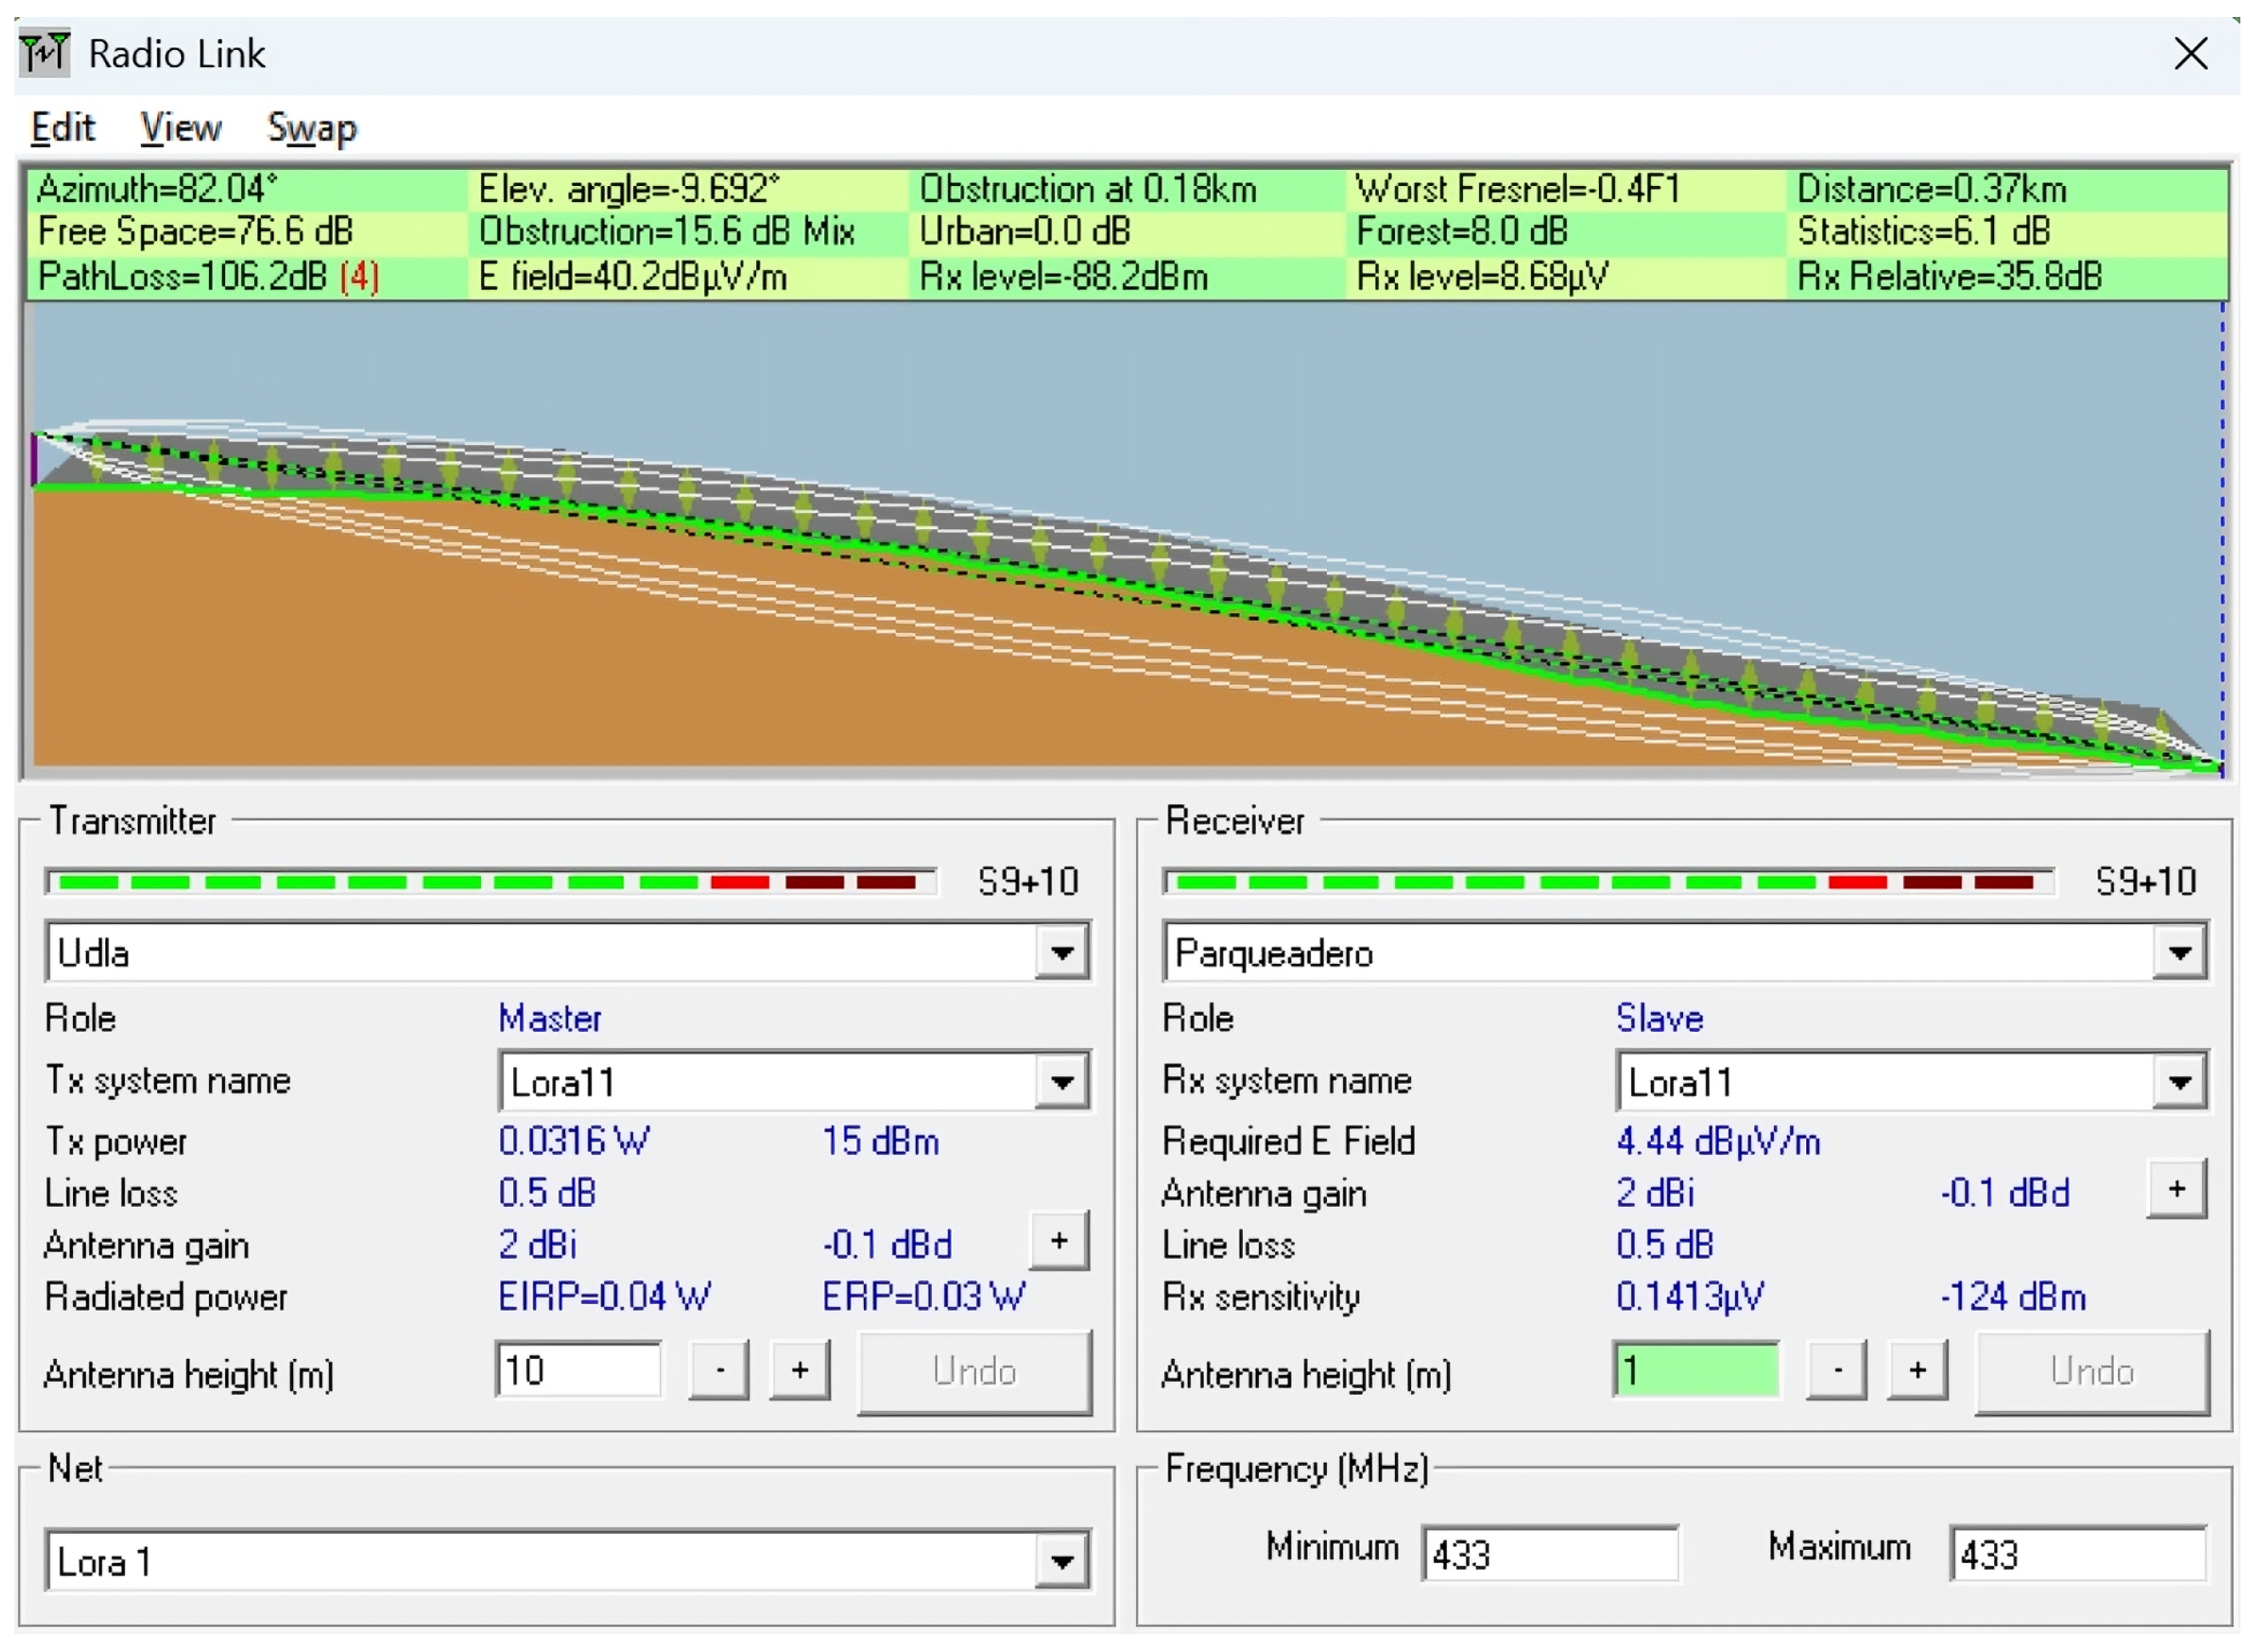
| 3 | −0.162470 | −78.455889 | 10 | 1 | 370 | 90 | 106.2 | −88.2 | Receiver located deeper within the ecological trail near the ravine (Simulated). |
| 4 | −0.163669 | −78.454818 | 10 | 1 | 490 | 480 | 88.7 | −70.7 | Receiver positioned above the trail, near Tx height, with vegetation (Simulated). |
| 5 | −0.163669 | −78.454818 | 10 | 1 | 490 | 480 | 88.7 | −70.7 | Same location as scenario 4, without vegetation (Simulated). |
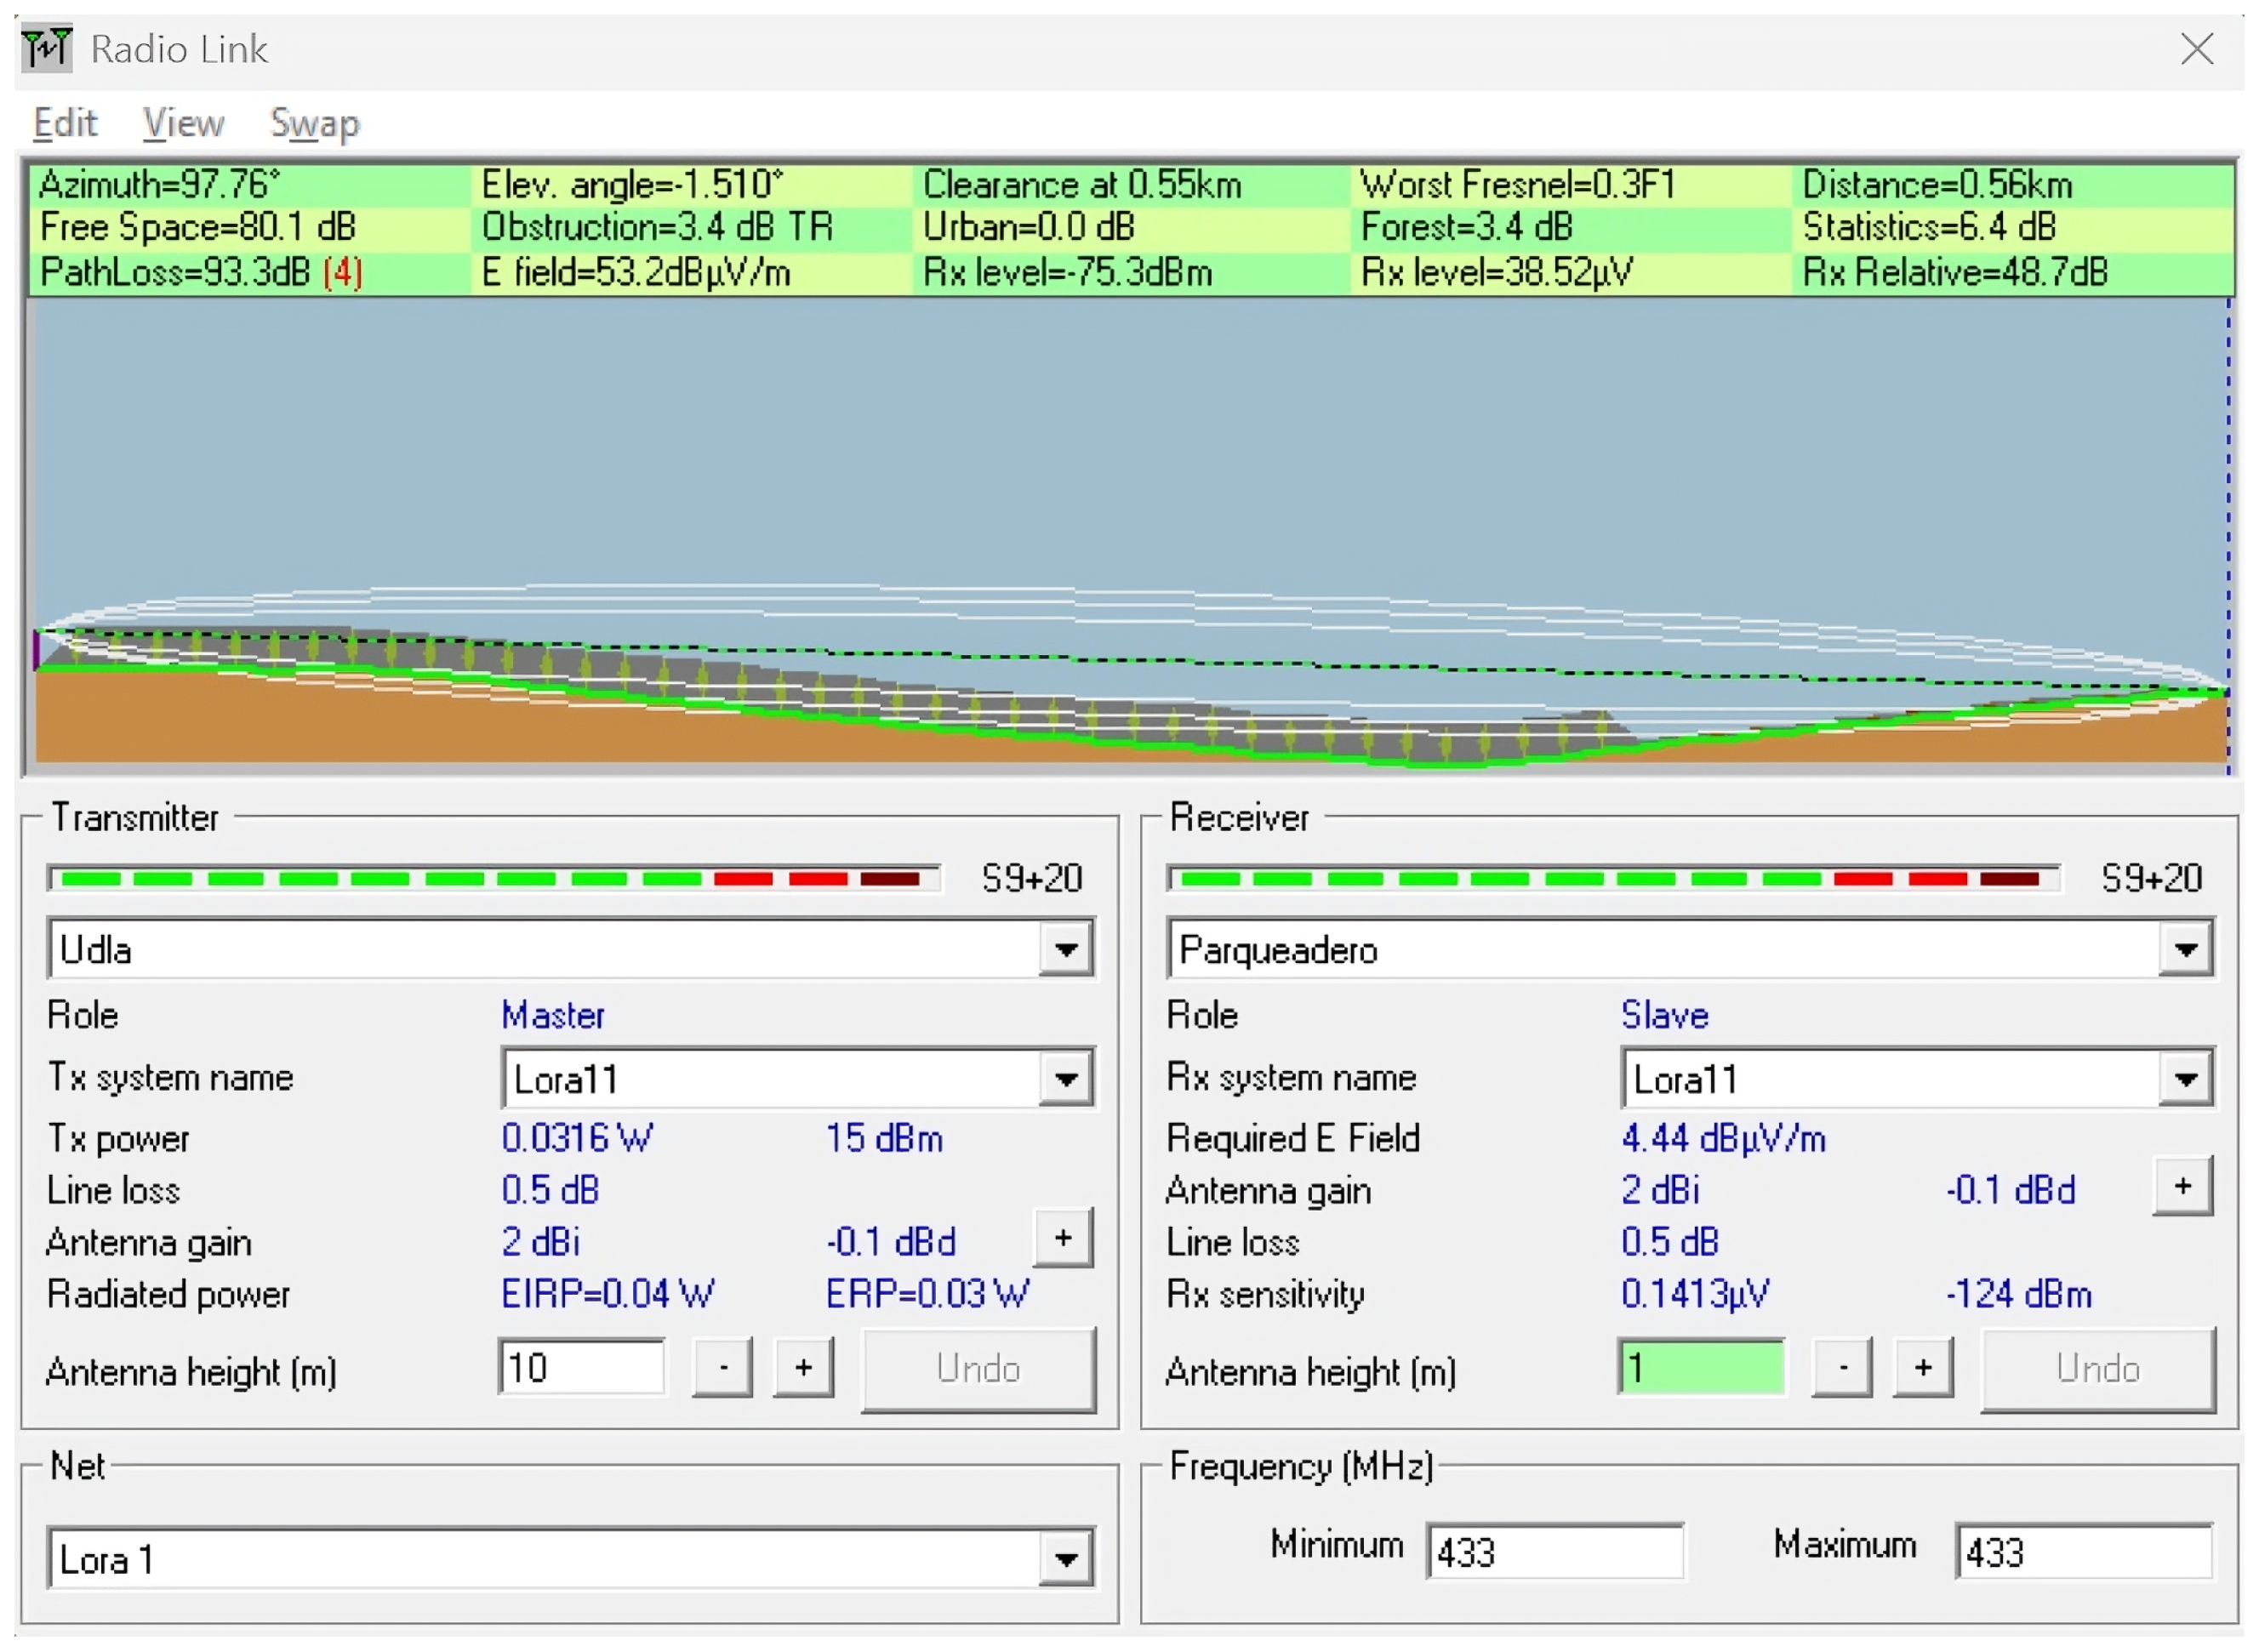
| 6 | −0.163611 | −78.454160 | 10 | 1 | 560 | 570 | 93.3 | −75.3 | Farthest point, aligned with Tx height, with vegetation (Simulated). |
Disclaimer/Publisher’s Note: The statements, opinions and data contained in all publications are solely those of the individual author(s) and contributor(s) and not of MDPI and/or the editor(s). MDPI and/or the editor(s) disclaim responsibility for any injury to people or property resulting from any ideas, methods, instructions or products referred to in the content. |
© 2025 by the authors. Licensee MDPI, Basel, Switzerland. This article is an open access article distributed under the terms and conditions of the Creative Commons Attribution (CC BY) license (https://creativecommons.org/licenses/by/4.0/).
Share and Cite
Sánchez, I.; Guamialama, C.; Padilla, A.; Játiva, P.P.; Mosquera, A.N. Implementation of a Remote Monitoring Station for Measuring UV Radiation Levels from Solarimeters Using LoRaWAN Technology. Sensors 2025, 25, 3110. https://doi.org/10.3390/s25103110
Sánchez I, Guamialama C, Padilla A, Játiva PP, Mosquera AN. Implementation of a Remote Monitoring Station for Measuring UV Radiation Levels from Solarimeters Using LoRaWAN Technology. Sensors. 2025; 25(10):3110. https://doi.org/10.3390/s25103110
Chicago/Turabian StyleSánchez, Iván, Cristian Guamialama, Alexis Padilla, Pablo Palacios Játiva, and Andre Nicolás Mosquera. 2025. "Implementation of a Remote Monitoring Station for Measuring UV Radiation Levels from Solarimeters Using LoRaWAN Technology" Sensors 25, no. 10: 3110. https://doi.org/10.3390/s25103110
APA StyleSánchez, I., Guamialama, C., Padilla, A., Játiva, P. P., & Mosquera, A. N. (2025). Implementation of a Remote Monitoring Station for Measuring UV Radiation Levels from Solarimeters Using LoRaWAN Technology. Sensors, 25(10), 3110. https://doi.org/10.3390/s25103110