4.4.1. Functional Testing Results
The API endpoints were functionally tested to guarantee that they consistently returned correct responses and status codes. The major purpose was to validate the API’s functionality rather than evaluate its performance under high demand. The findings are summarized in
Table 13.
All endpoints accomplished a 100% success rate, showing that the API processes requests consistently and delivers the desired results. This high-reliability level attests to the implemented functionality’s correctness and robustness. The /login endpoint was tested using POST requests to check user authentication. The successful handling of all samples confirmed that the authentication mechanism functions properly and regularly delivers valid responses.
The /dynamic endpoints were tested for various activities, including GET, PUT, POST, and Delete. Each action delivered correct data or successfully implemented the intended changes, confirming the functions’ correctness and stability. The /dynamic/interface/ endpoints were tested, and both POST and GET methods successfully added and retrieved data as expected.
The functional testing results confirm that all API endpoints are correctly implemented, consistently returning the appropriate responses and status codes. The system meets its functional requirements, ensuring a reliable experience
4.4.2. Response Time Results
Response time testing of API endpoints was performed to assess the API’s performance in processing and responding to various requests. This testing calculated the average response time for each endpoint across several samples, offering insights into the API’s performance characteristics under different load scenarios.
Table 14 provides an extensive summary of the results.
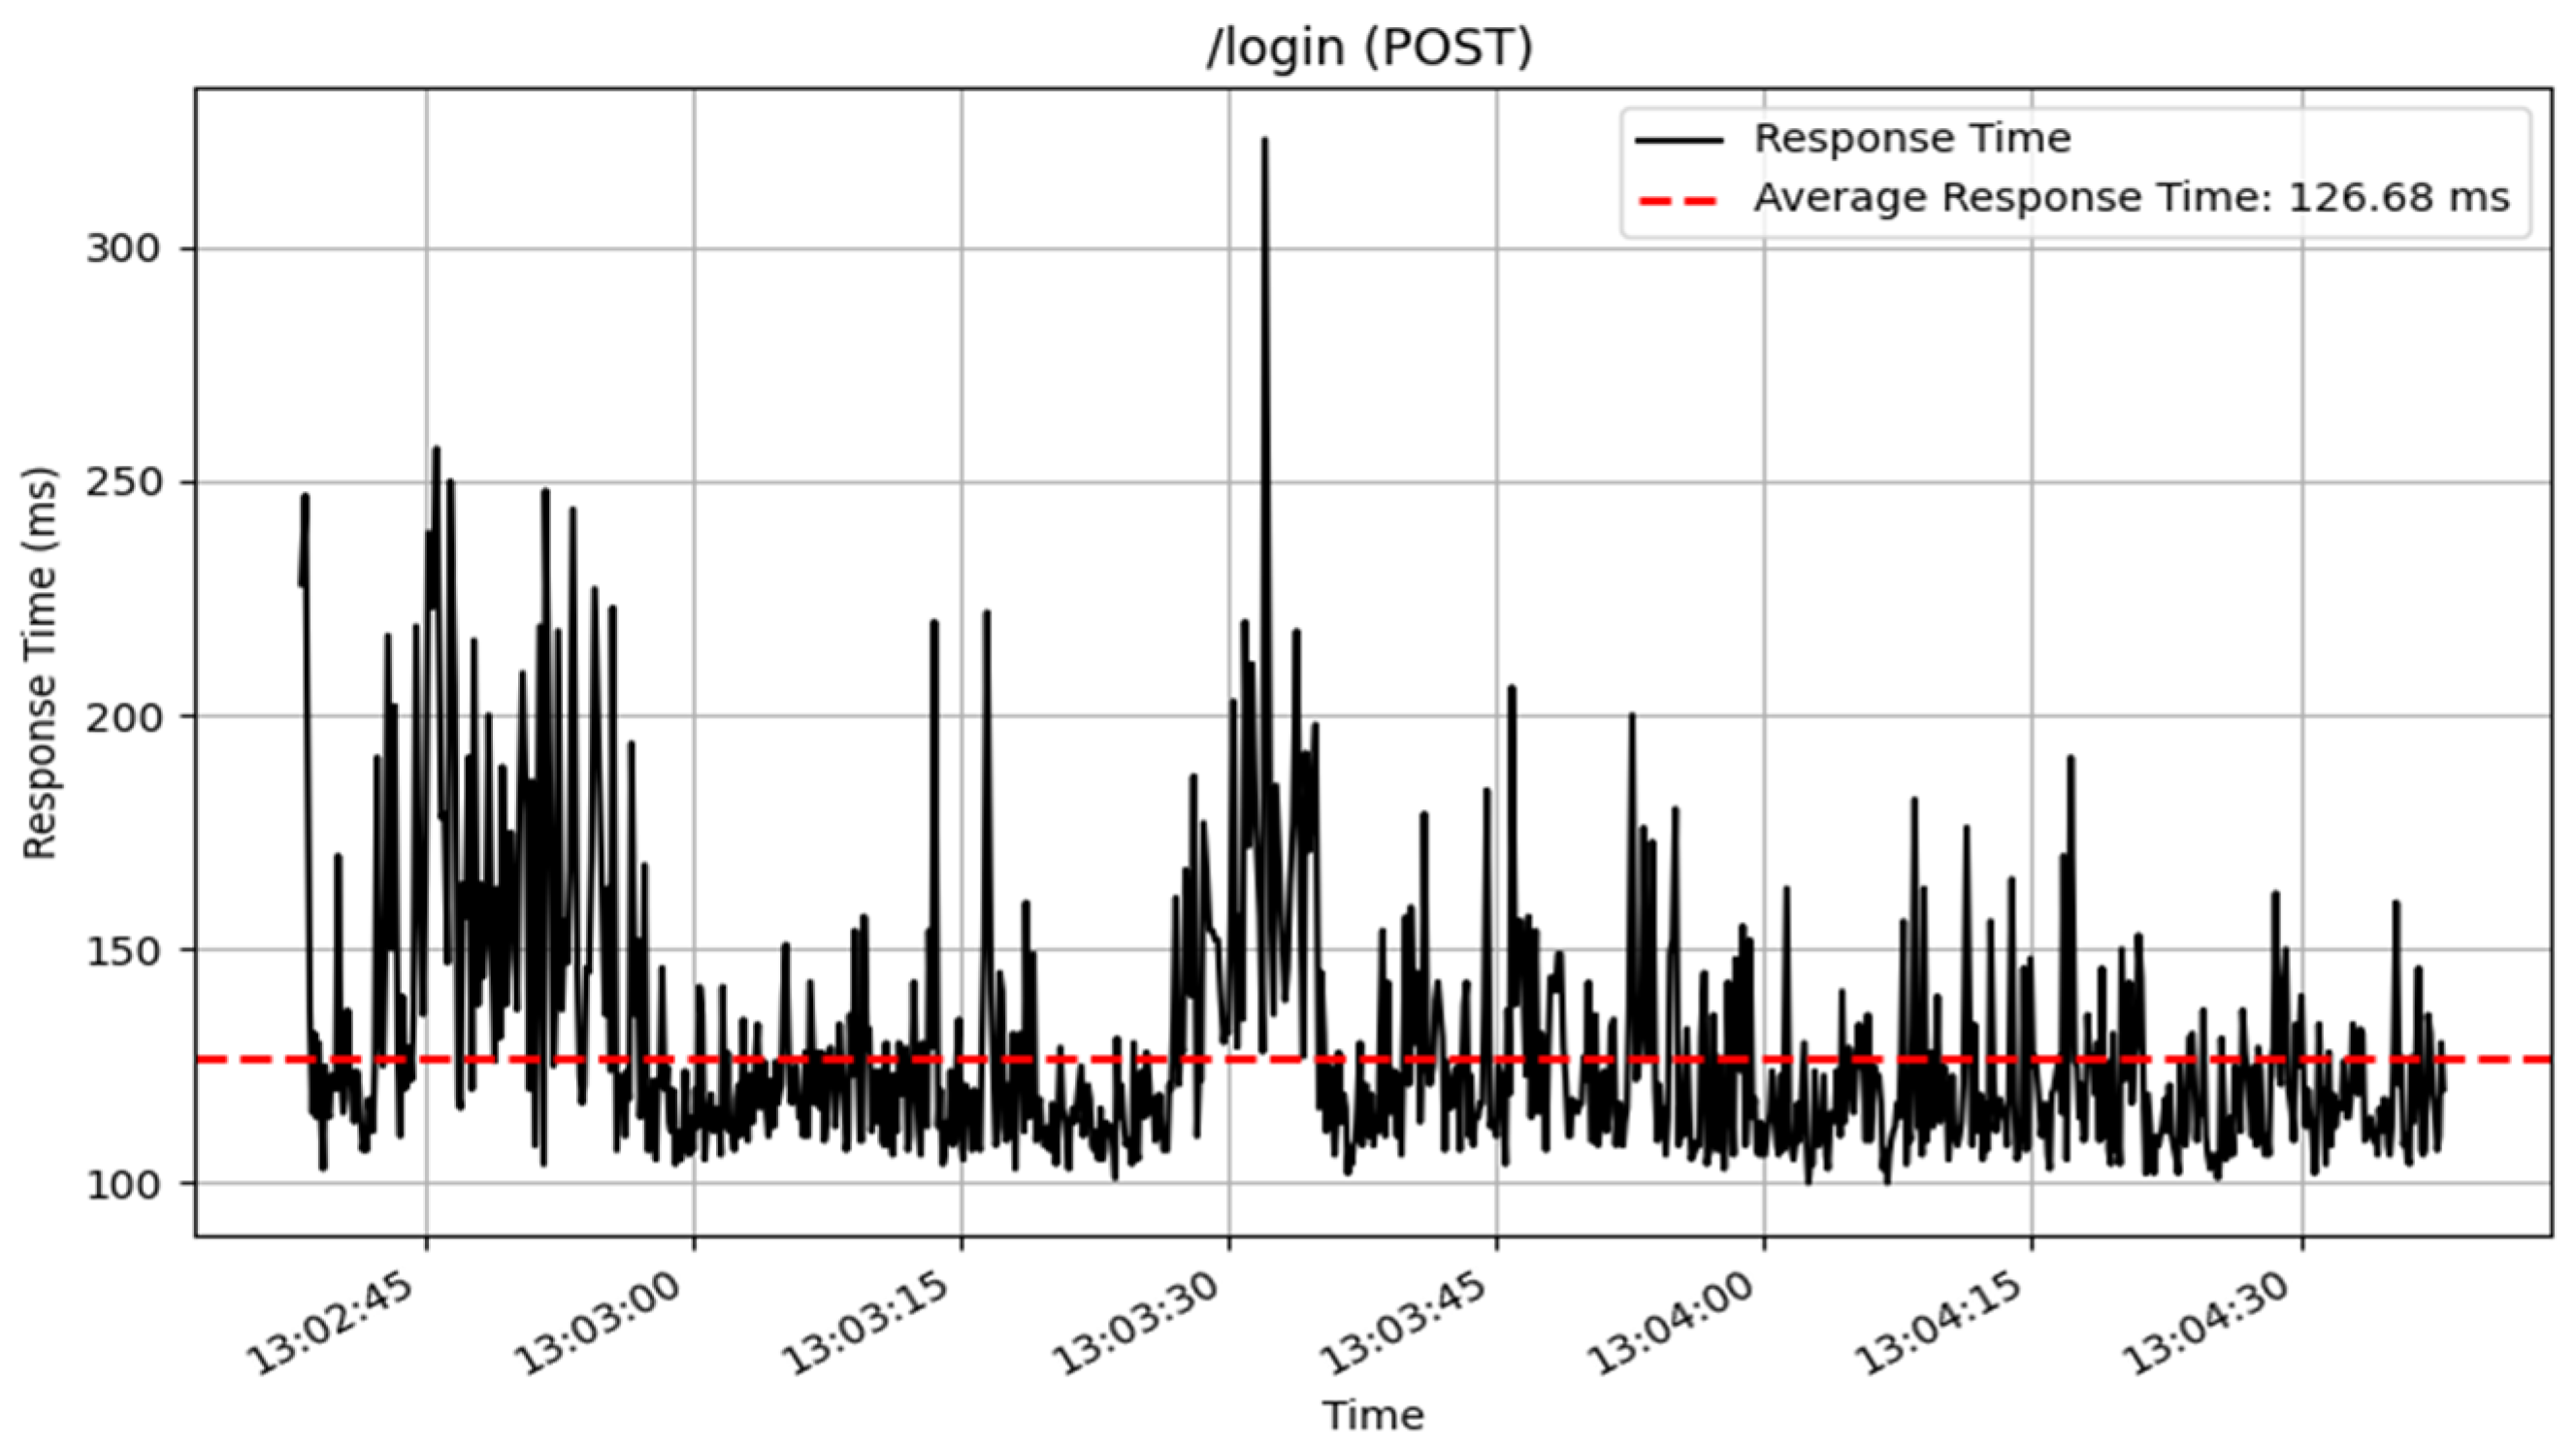
The /login endpoint, which handles user authentication via POST requests, processed 908 samples, with an average response time of 127 milliseconds. The response times are represented in
Figure 13. This result suggests that, while the login mechanism is reliable, there is room for further optimization to increase responsiveness.
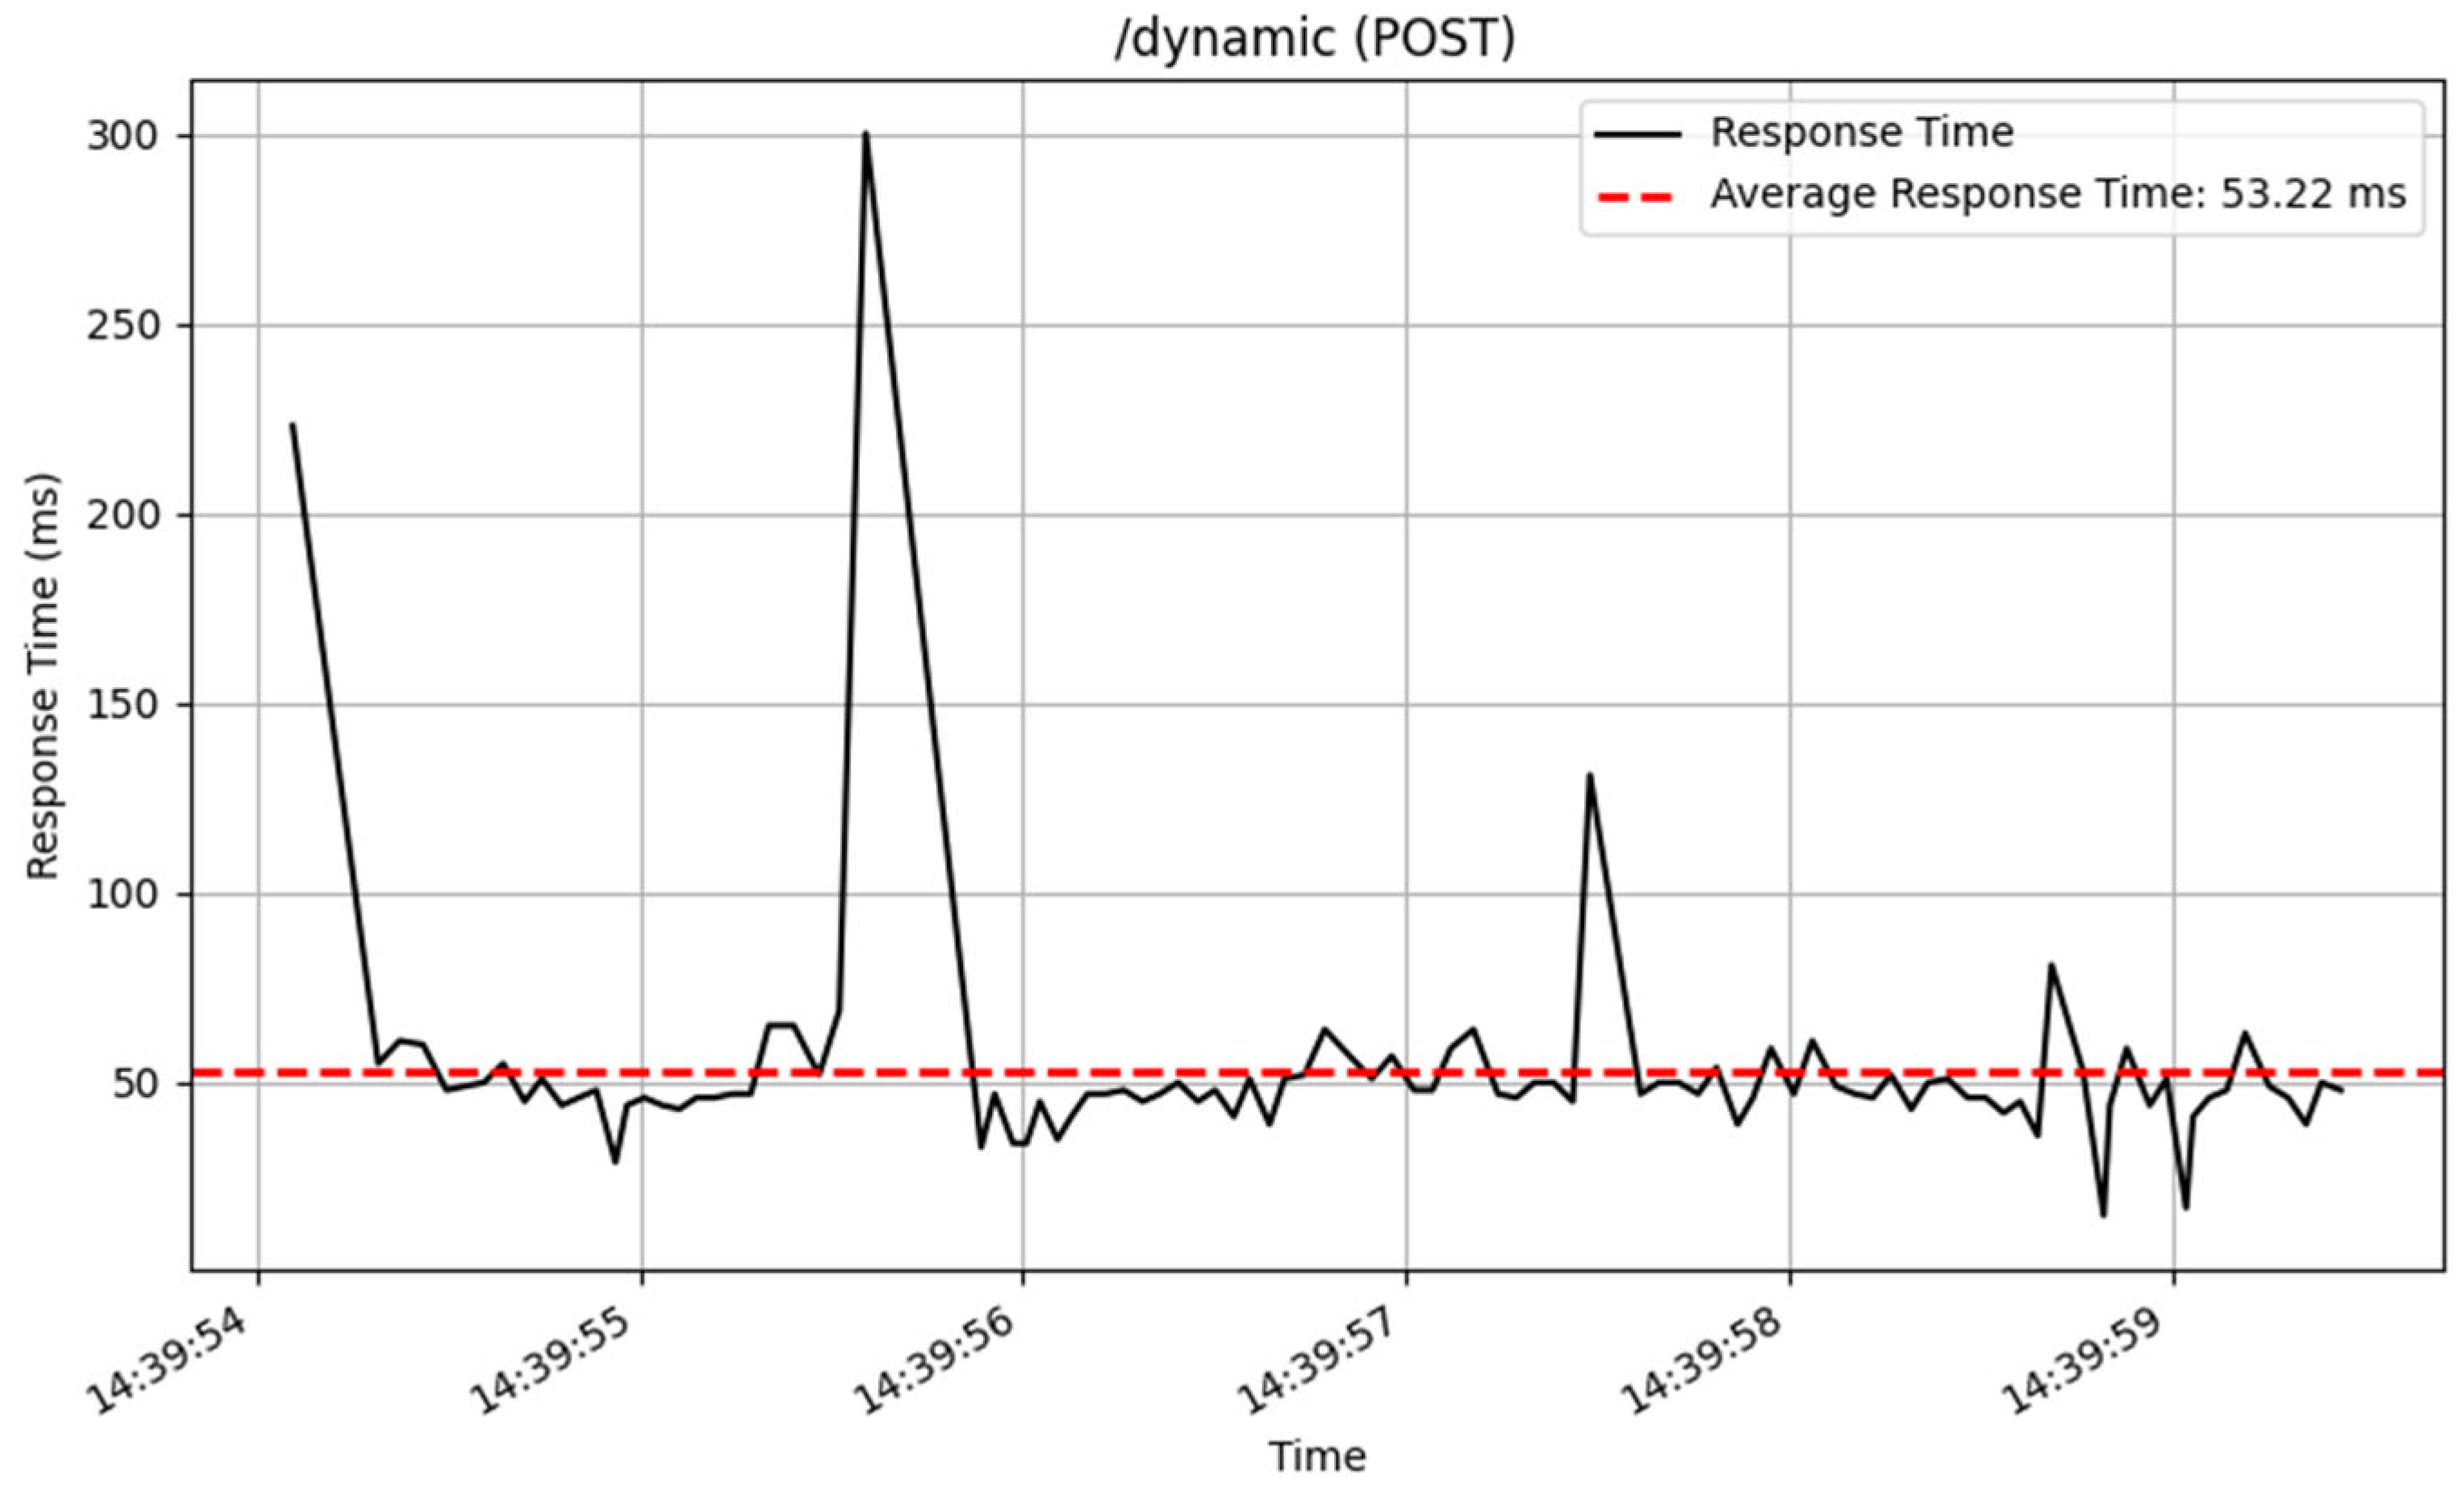
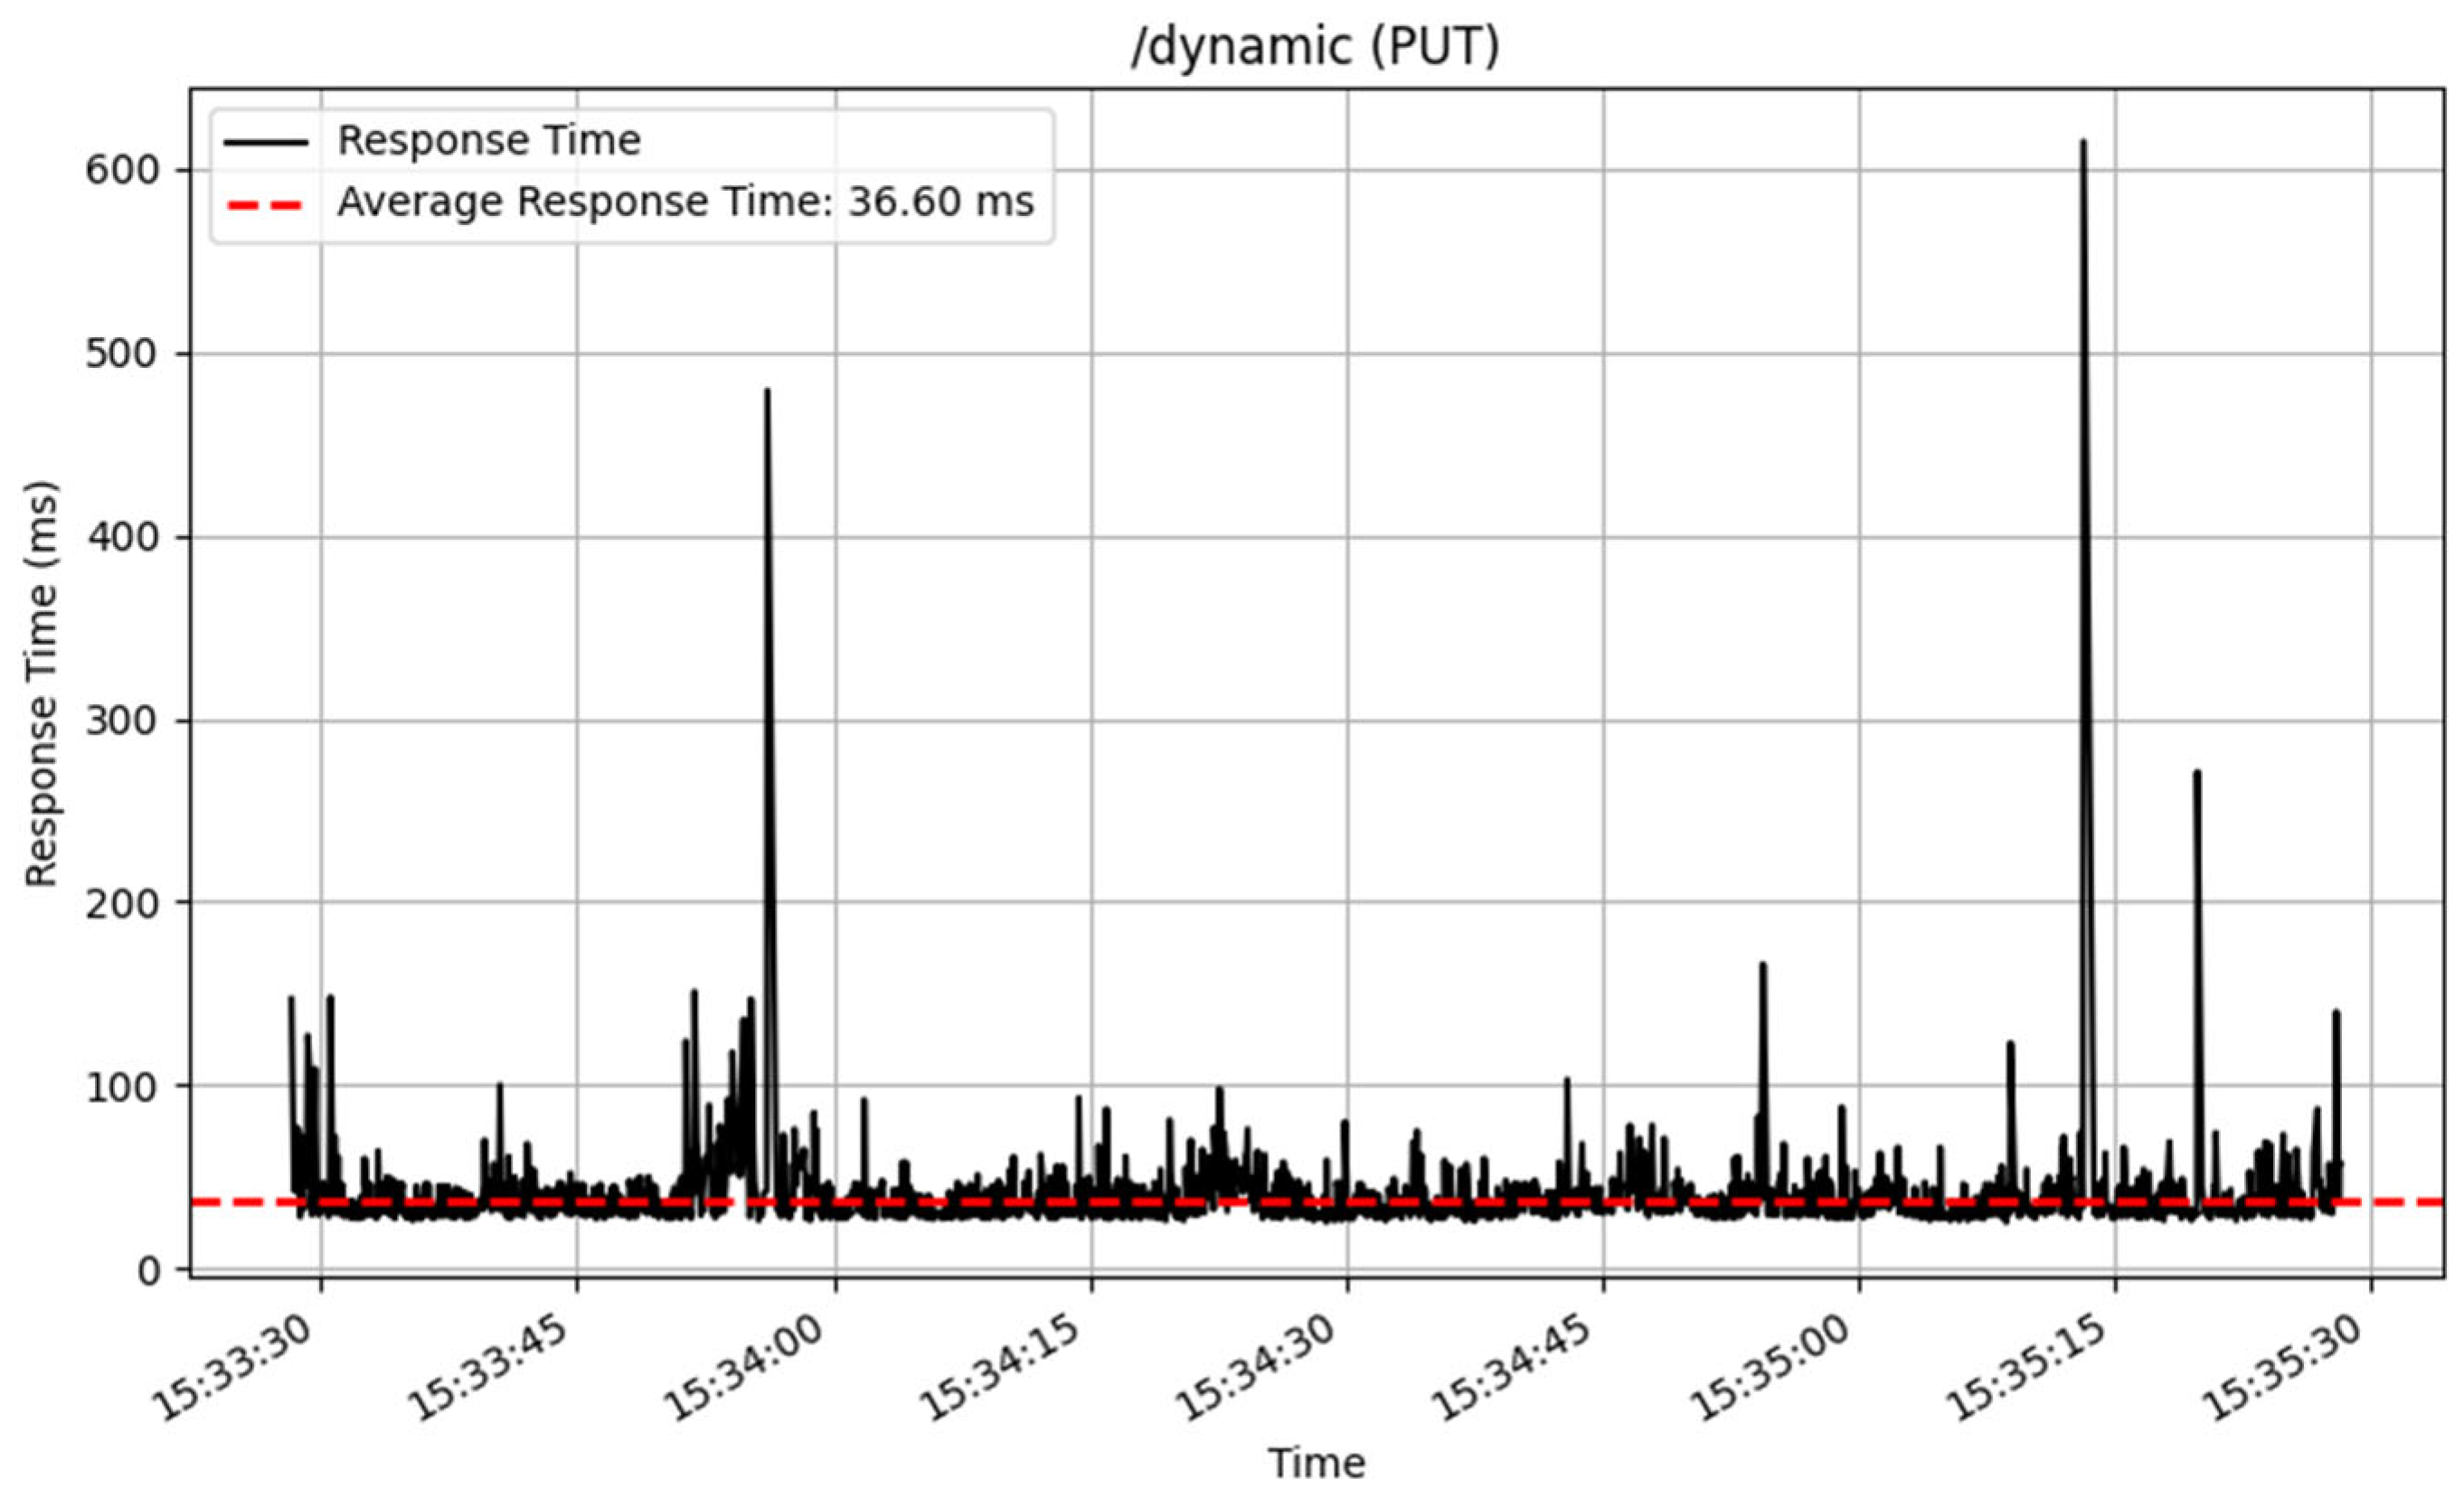
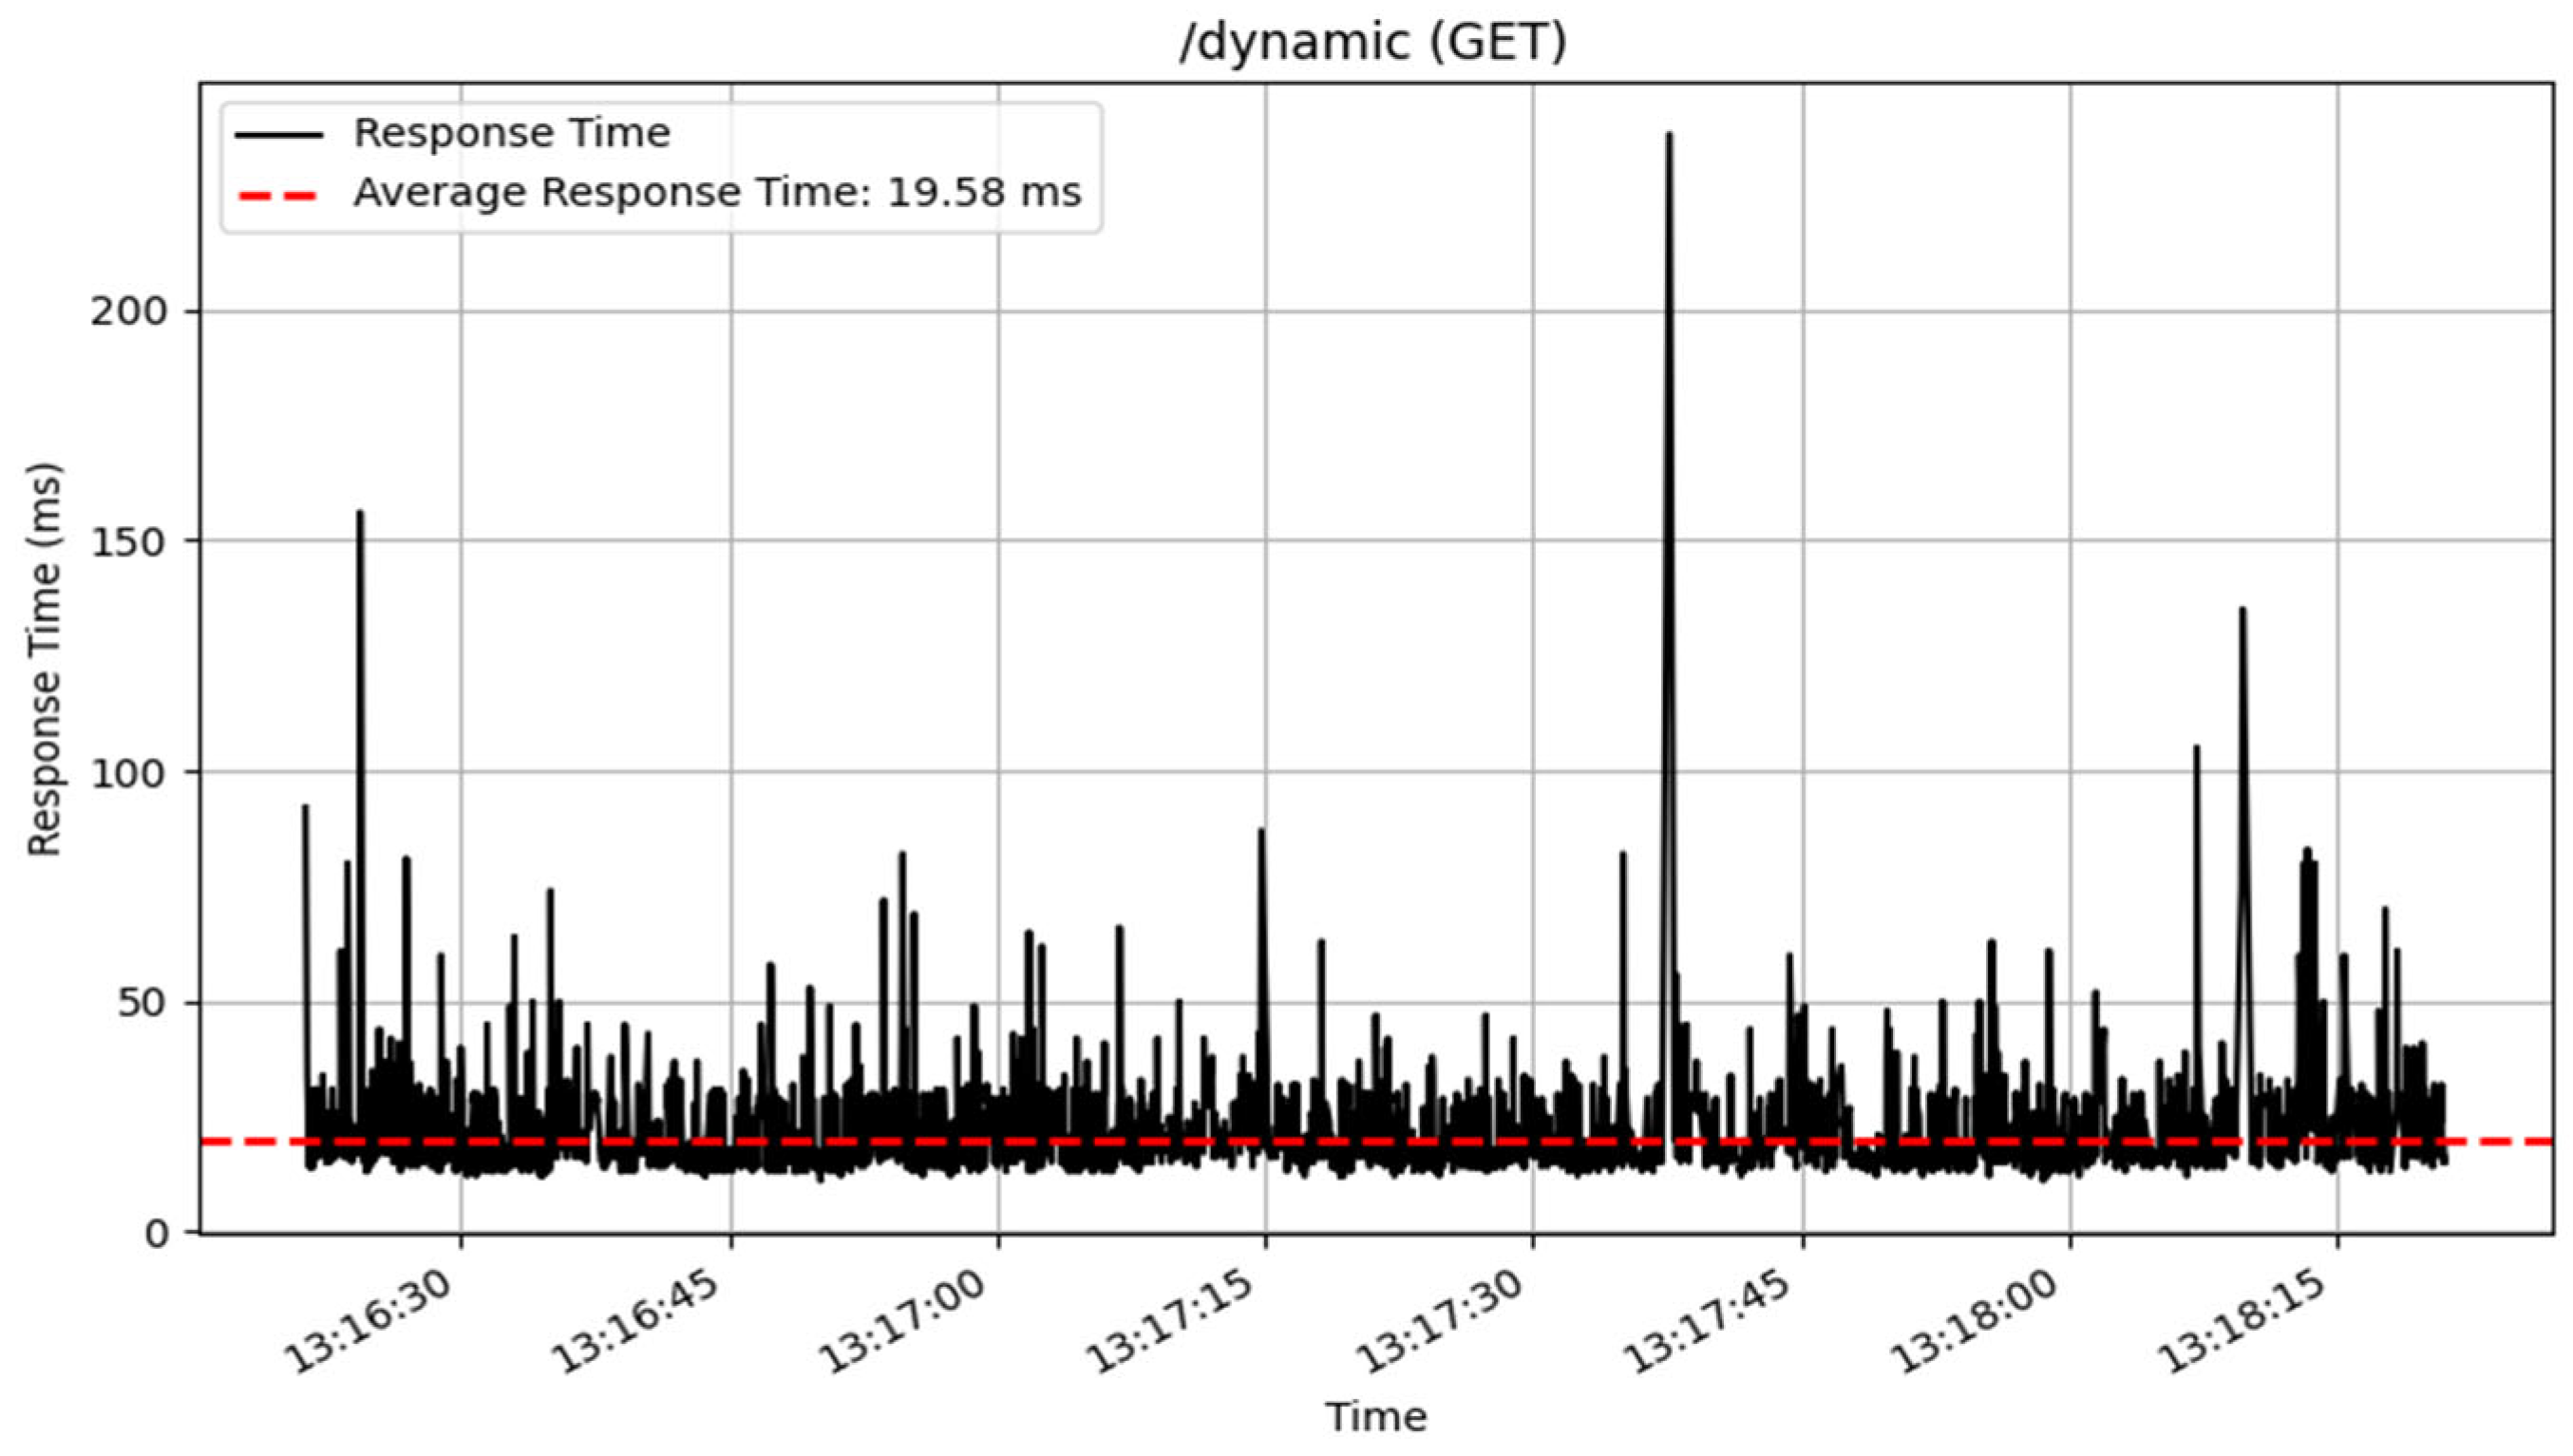
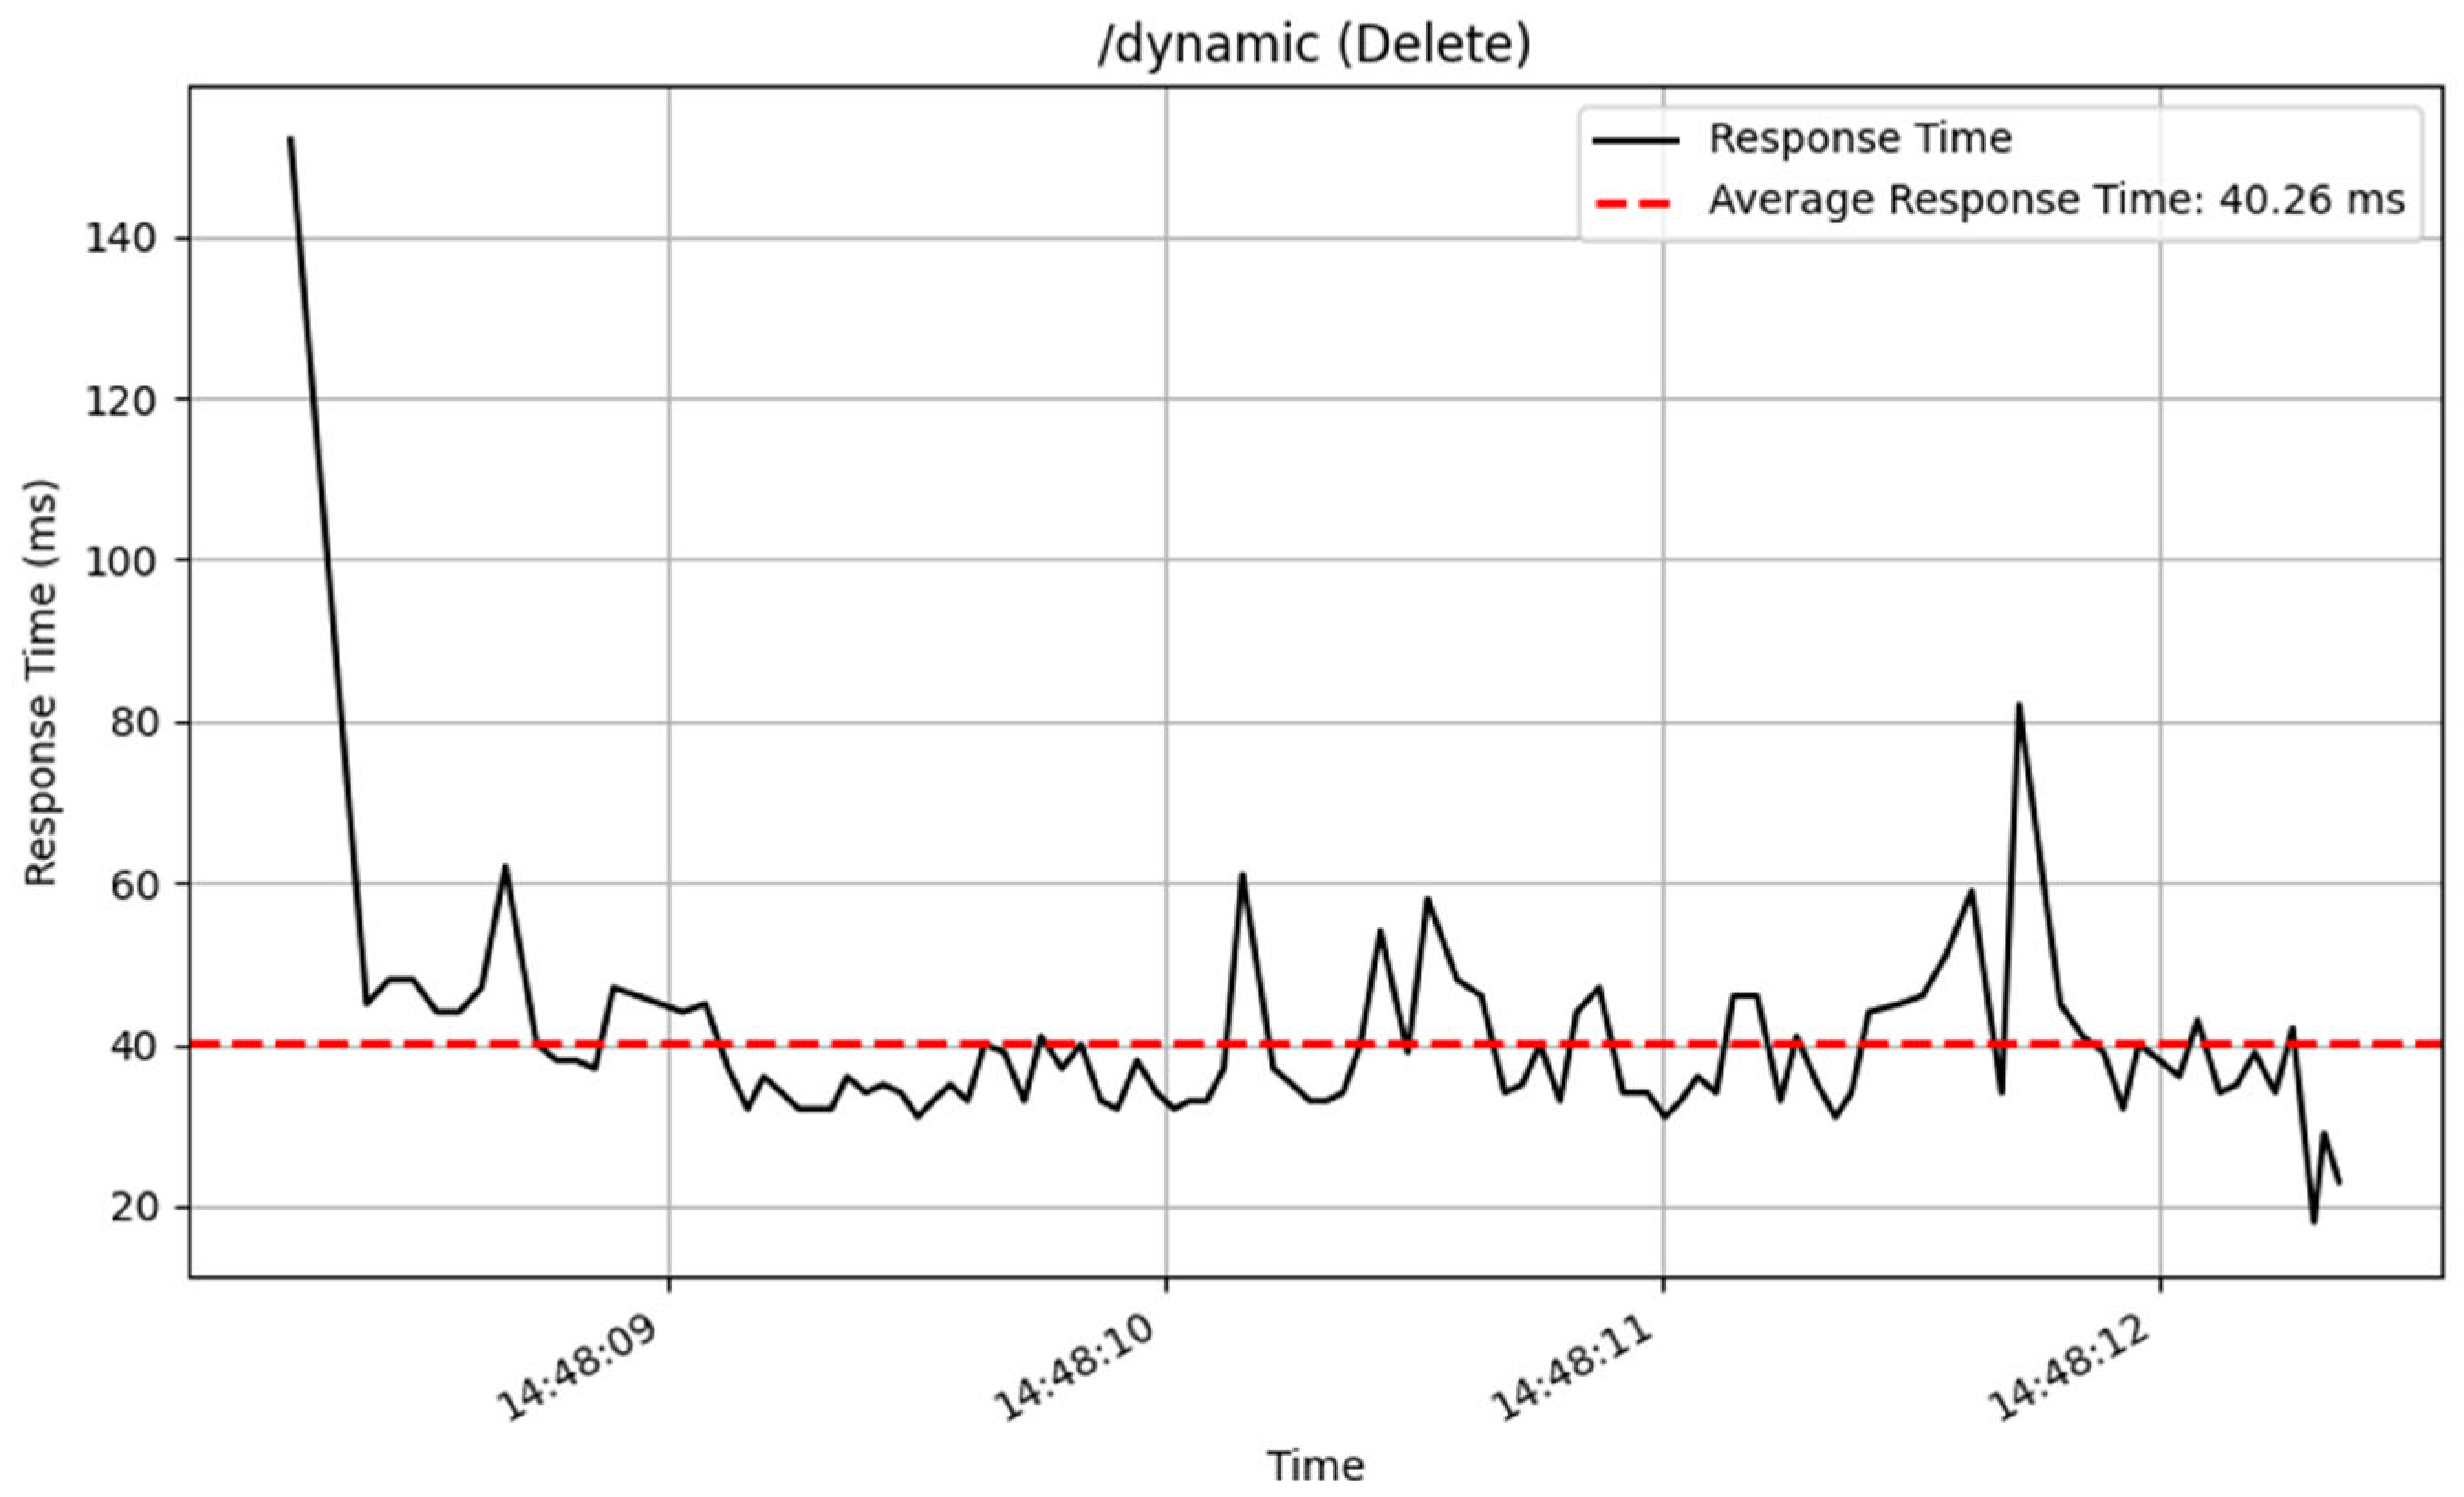
The /dynamic endpoint performed differently depending on the method used. The GET method performed well, with an average response time of 19 milliseconds over 3872 samples, showing excellent speed in fetching dynamic content. The PUT method, which was used to update data, similarly performed well, with an average response time of 36 milliseconds for 2605 samples. The POST and DELETE methods performed consistently, processing a total of 100 samples with an average response time of 53 milliseconds. The response time of these CRUD method are illustrated in
Figure 14,
Figure 15,
Figure 16 and
Figure 17.
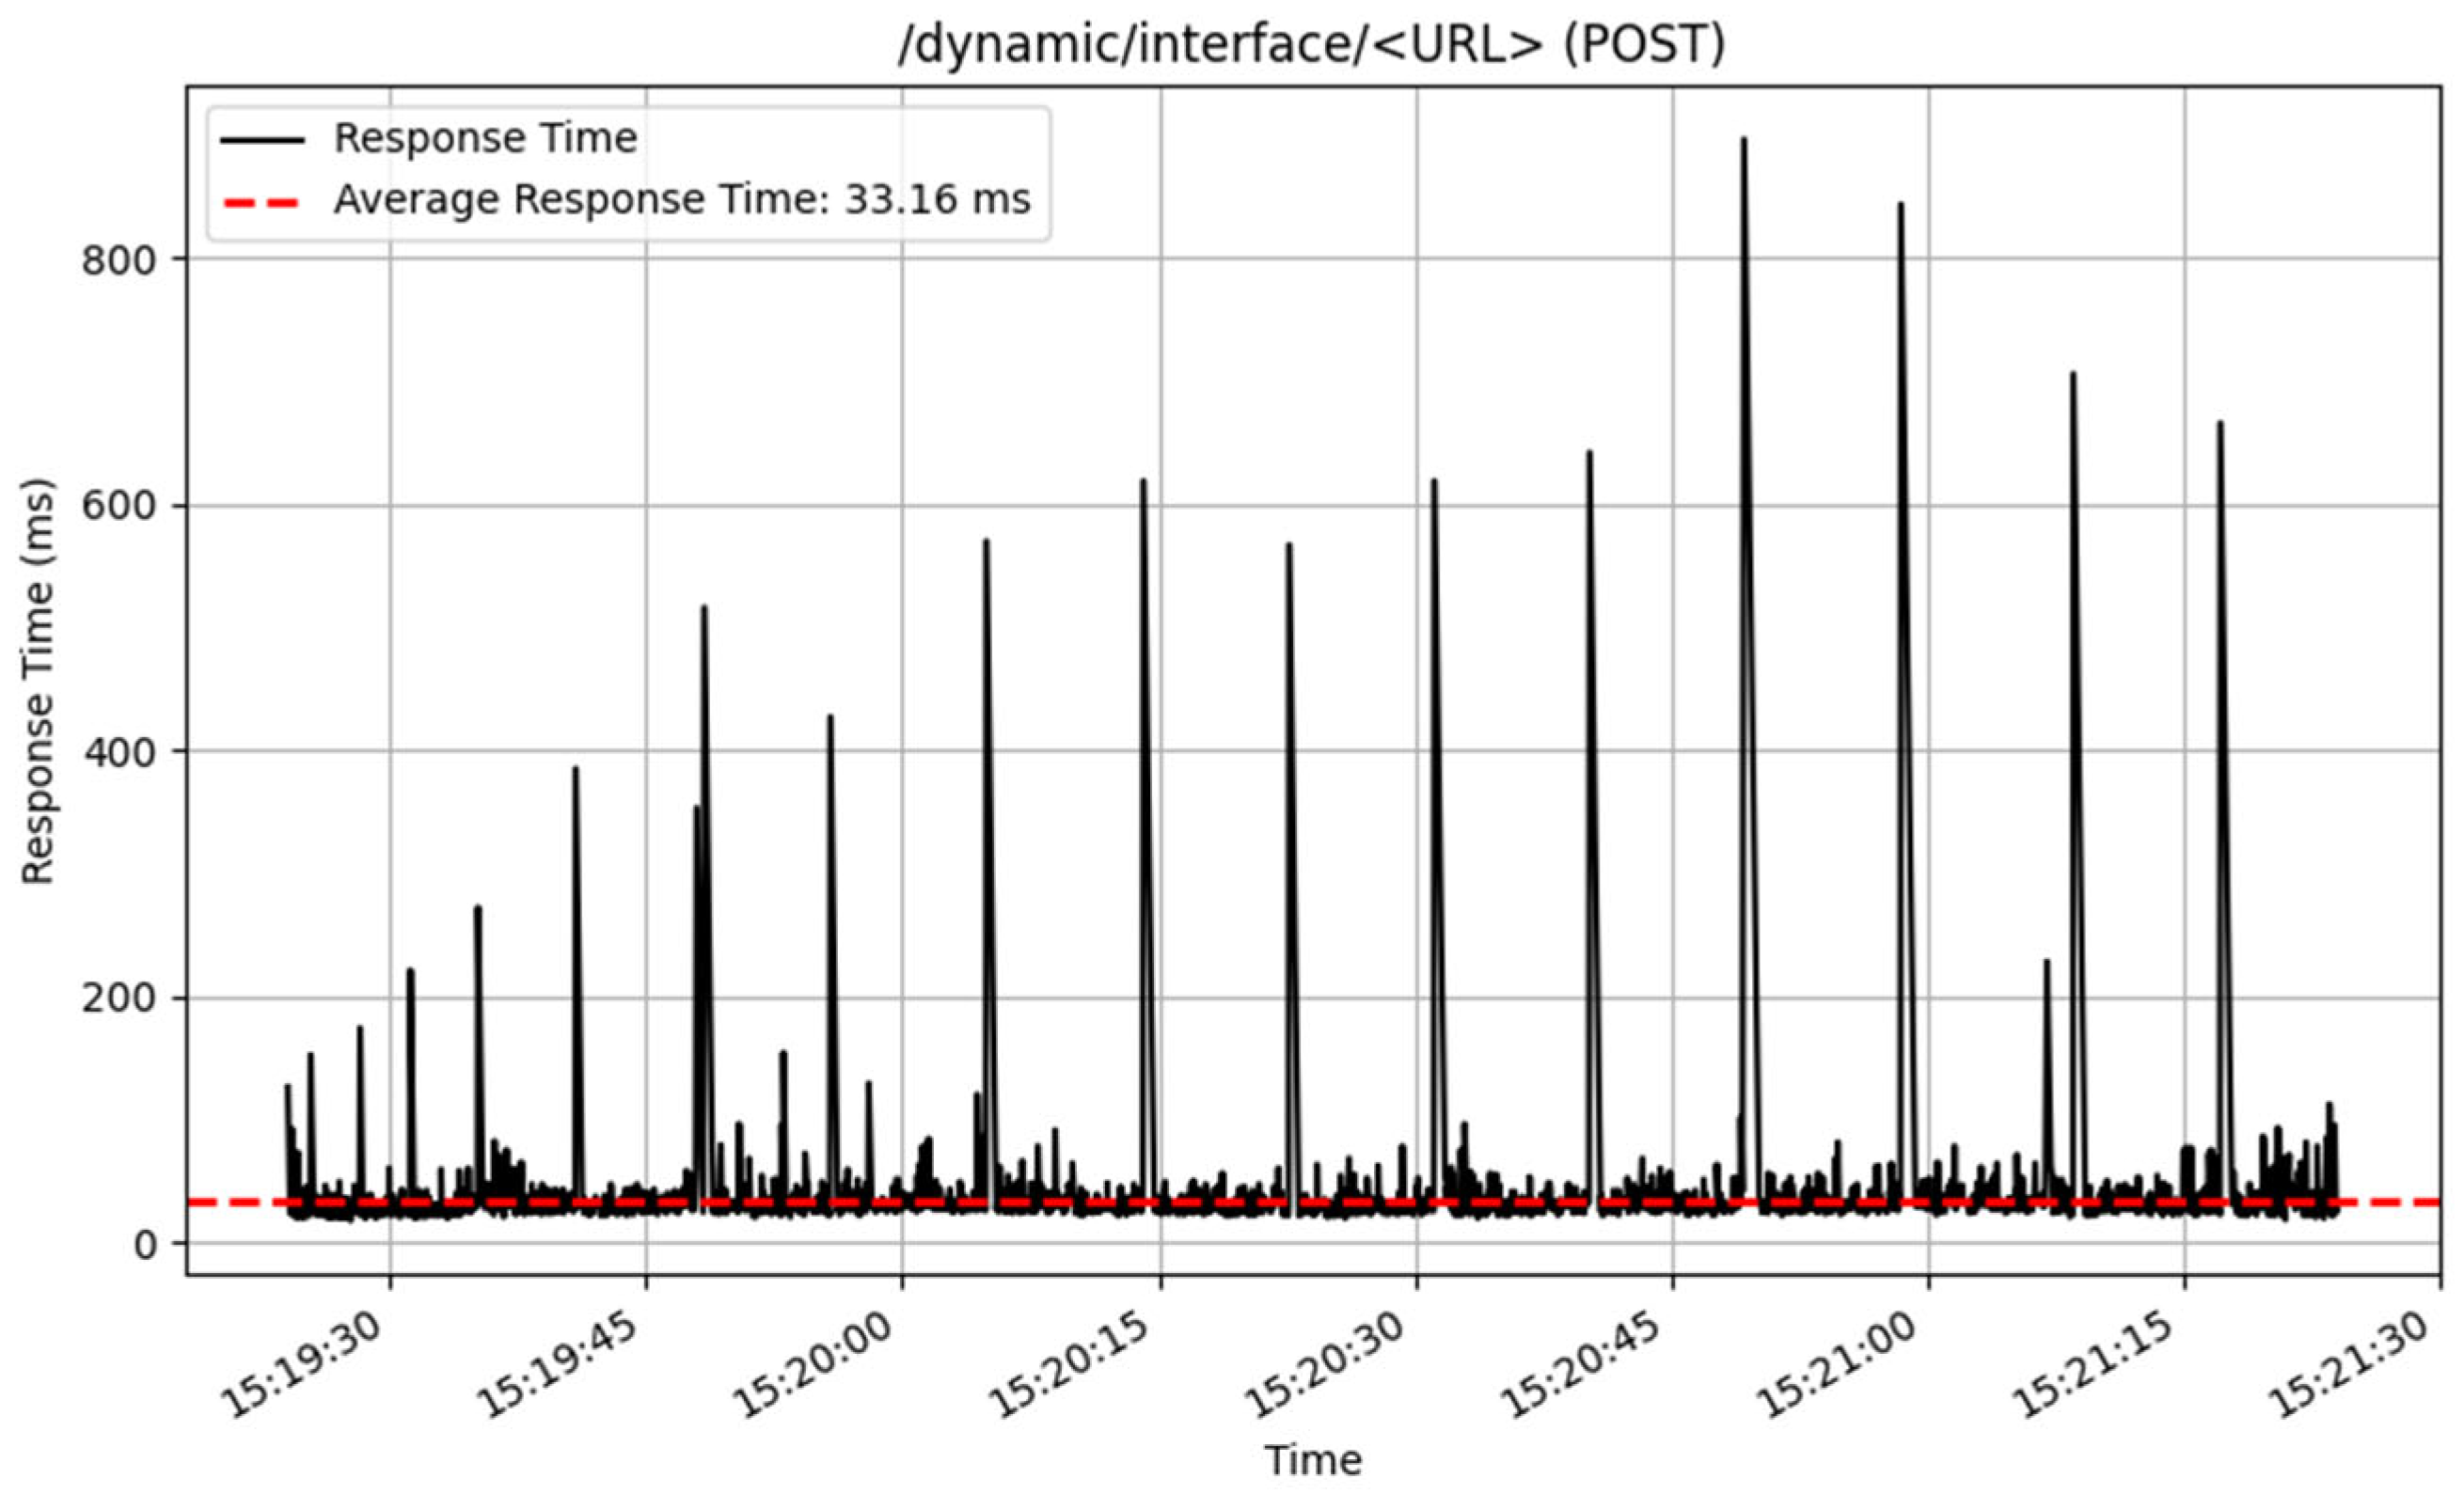
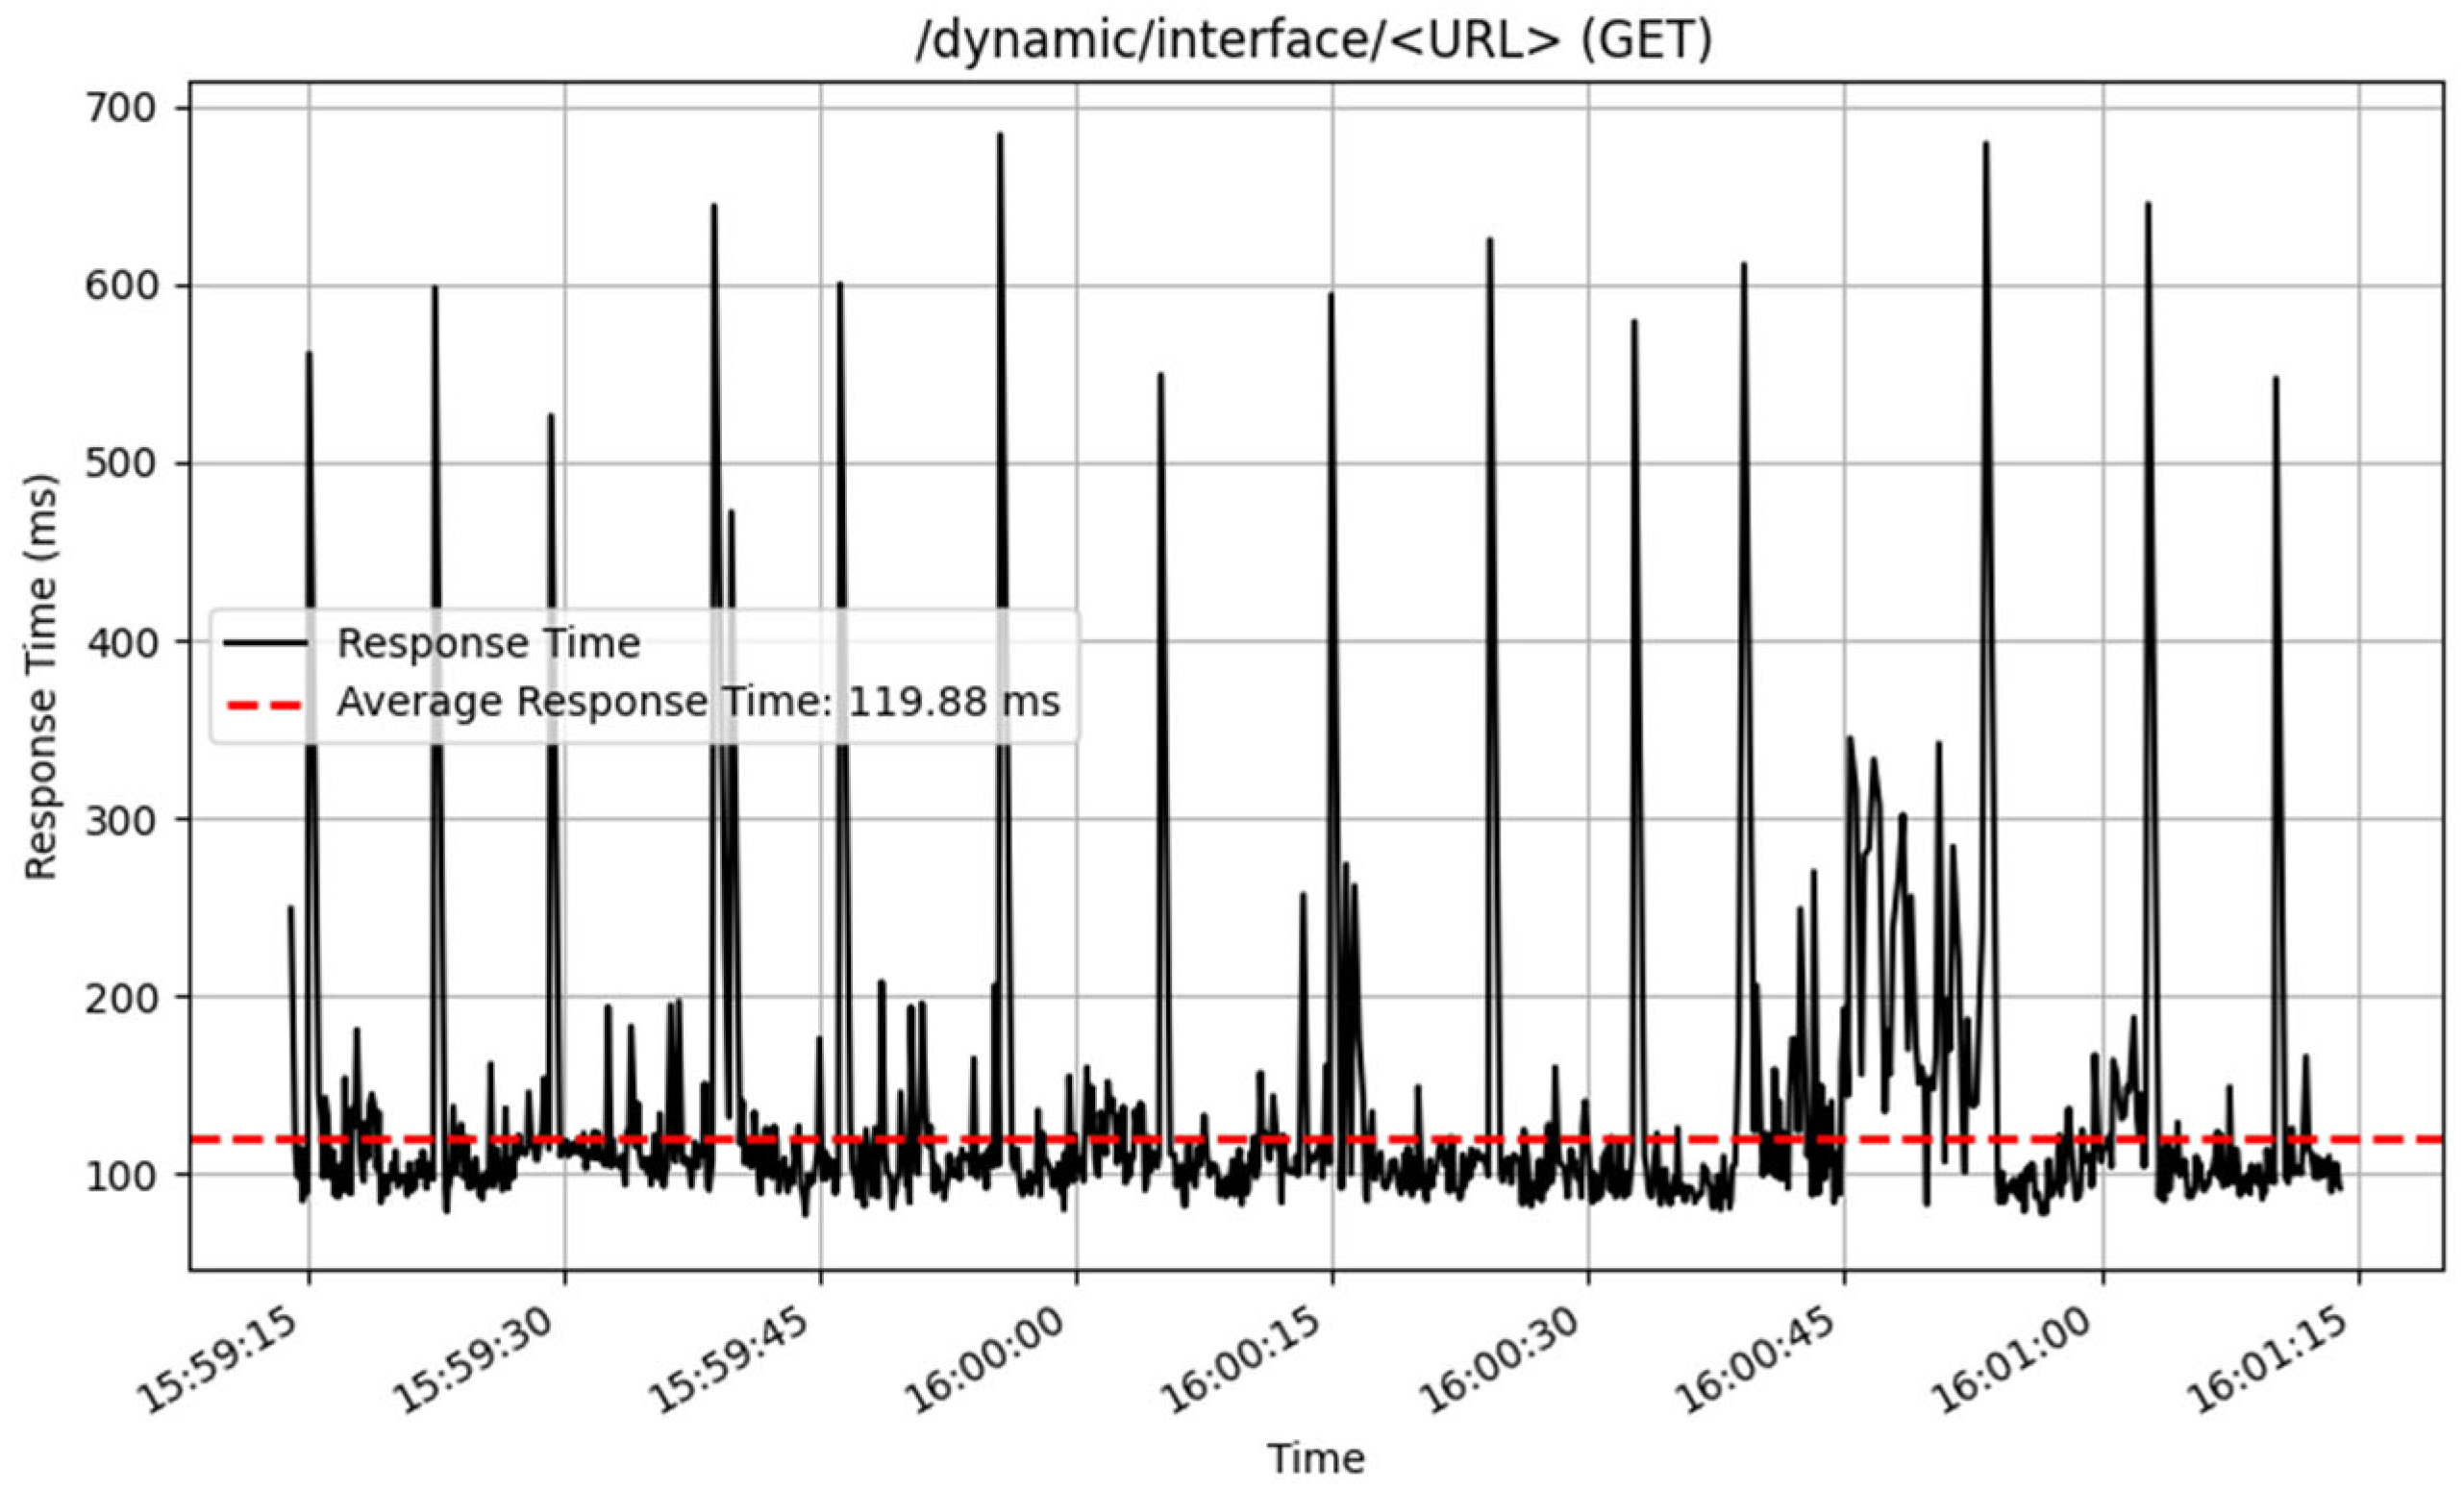
The performance of the /dynamic/interface/ endpoints was also assessed, and the results are illustrated in
Figure 18 and
Figure 19. The POST method performed well, processing 3212 samples, with an average response time of 33 milliseconds. This proposes an effective handling of interface adding of endpoint history. In contrast, the GET technique for retrieving history data from dynamic interfaces returned an average response time of 119 milliseconds across 923 samples.
The response time testing confirms that the API endpoints are working as anticipated, with consistent and efficient performance over a wide range of requests. The results show that the system can handle various operations efficiently, contributing to a great user experience.
4.4.3. Status Code Verification
During the status code verification process, the API endpoints were checked to ensure correct request and response handling. The /login (POST) endpoint gave response codes 200 for successful logins, 401 for unauthorized access, 404 for not found, and 422 for validation issues. The /dynamic endpoint (POST) gave response codes 200 for successful creation, 400 for bad requests, and 422 for validation errors, yet the /dynamic (GET) endpoint constantly returned 200 for successful retrieval.
The /dynamic (PUT) and /dynamic (DELETE) endpoints both returned 200 for successful updates and deletions, 400 for invalid requests, and 422 for validation errors. The /dynamic/interface/<URL> (POST) endpoint returned 200 for successful data insertion and 400 for invalid requests, whereas /dynamic/interface/<URL> (GET) returned 200 for successful data retrieval. These findings demonstrate that the API handled queries correctly across a variety of contexts.
Table 15 summarizes the verified status codes for all the endpoints.
4.4.4. Load Testing Results
The load test was executed over a duration of 141 s, during which 4732 requests were generated using a single thread with consistent API key authentication. To obtain accurate application performance results, the Nginx rate limit of 10 requests per second was bypassed, as evidenced by the initial throughput exceeding this limit, allowing the test to stress the API beyond the configured threshold and evaluate its underlying behavior under high load.
Analysis of the raw data revealed key metrics across the 4732 samples. A total of 4585 requests succeeded (96.89%), while 147 failed, resulting in a 3.11% error rate, all attributed to 404 “Not Found” errors. Response times ranged from a minimum of 5 ms to a maximum of 760 ms, averaging 88.69 ms, indicating generally efficient performance with some variability. The overall throughput was 9.83 requests/s, slightly below the target rate of 10 requests/s, but the per-minute analysis revealed periods of significantly higher throughput due to the rate limit bypass.
To examine performance trends, the data were aggregated into 1 min intervals, yielding three bins over the 141 s duration. The first minute recorded 4026 samples, with an average response time of 90 ms (estimated based on the overall average and distribution), 125 errors (3.1% of this bin), and a throughput of 67.1 requests/sec, far exceeding the configured rate limit of 10 requests/s due to the intentional bypass. The second minute included 690 samples, with an average response time of 85 ms, 21 errors (3.04%), and a throughput of 11.5 requests/s, closer to the target rate. The final 20 s, forming the third bin, had 16 samples, an average response time of 82 ms, 1 error (6.25%), and a throughput of 0.8 requests/s. The high initial throughput confirms that bypassing the rate limit allowed JMeter to generate a burst of requests, which later stabilized as the test progressed, though it did not sustain the load consistently.
Response times averaged 88.69 ms, which is highly efficient for an API, but the maximum of 760 ms highlights significant outliers, likely corresponding to the 404 errors or server-side delays under the excessive load enabled by the rate limit bypass. The minimum response time of 5 ms aligns with the rapid responses observed for failed requests, suggesting the server quickly identified unavailable resources. The error rate of 3.11%, driven by 147 instances of 404 errors, showed clustering, with 125 errors in the first minute, possibly due to server-side issues exacerbated by the initial high request volume of 67.1 requests/sec.
The overall average throughput of 9.83 requests/s demonstrates that the server maintained a rate close to the target on average, but the per-minute analysis reveals an initial peak of 67.1 requests/s, dropping to 11.5 requests/s and then 0.8 requests/s. This pattern indicates that bypassing the rate limit allowed an early surge in requests, stressing the application beyond its normal operational limits. The decline in throughput toward the end of the test suggests that the load was not sustained consistently, potentially due to the test’s short duration or a lack of throttling in the JMeter setup.
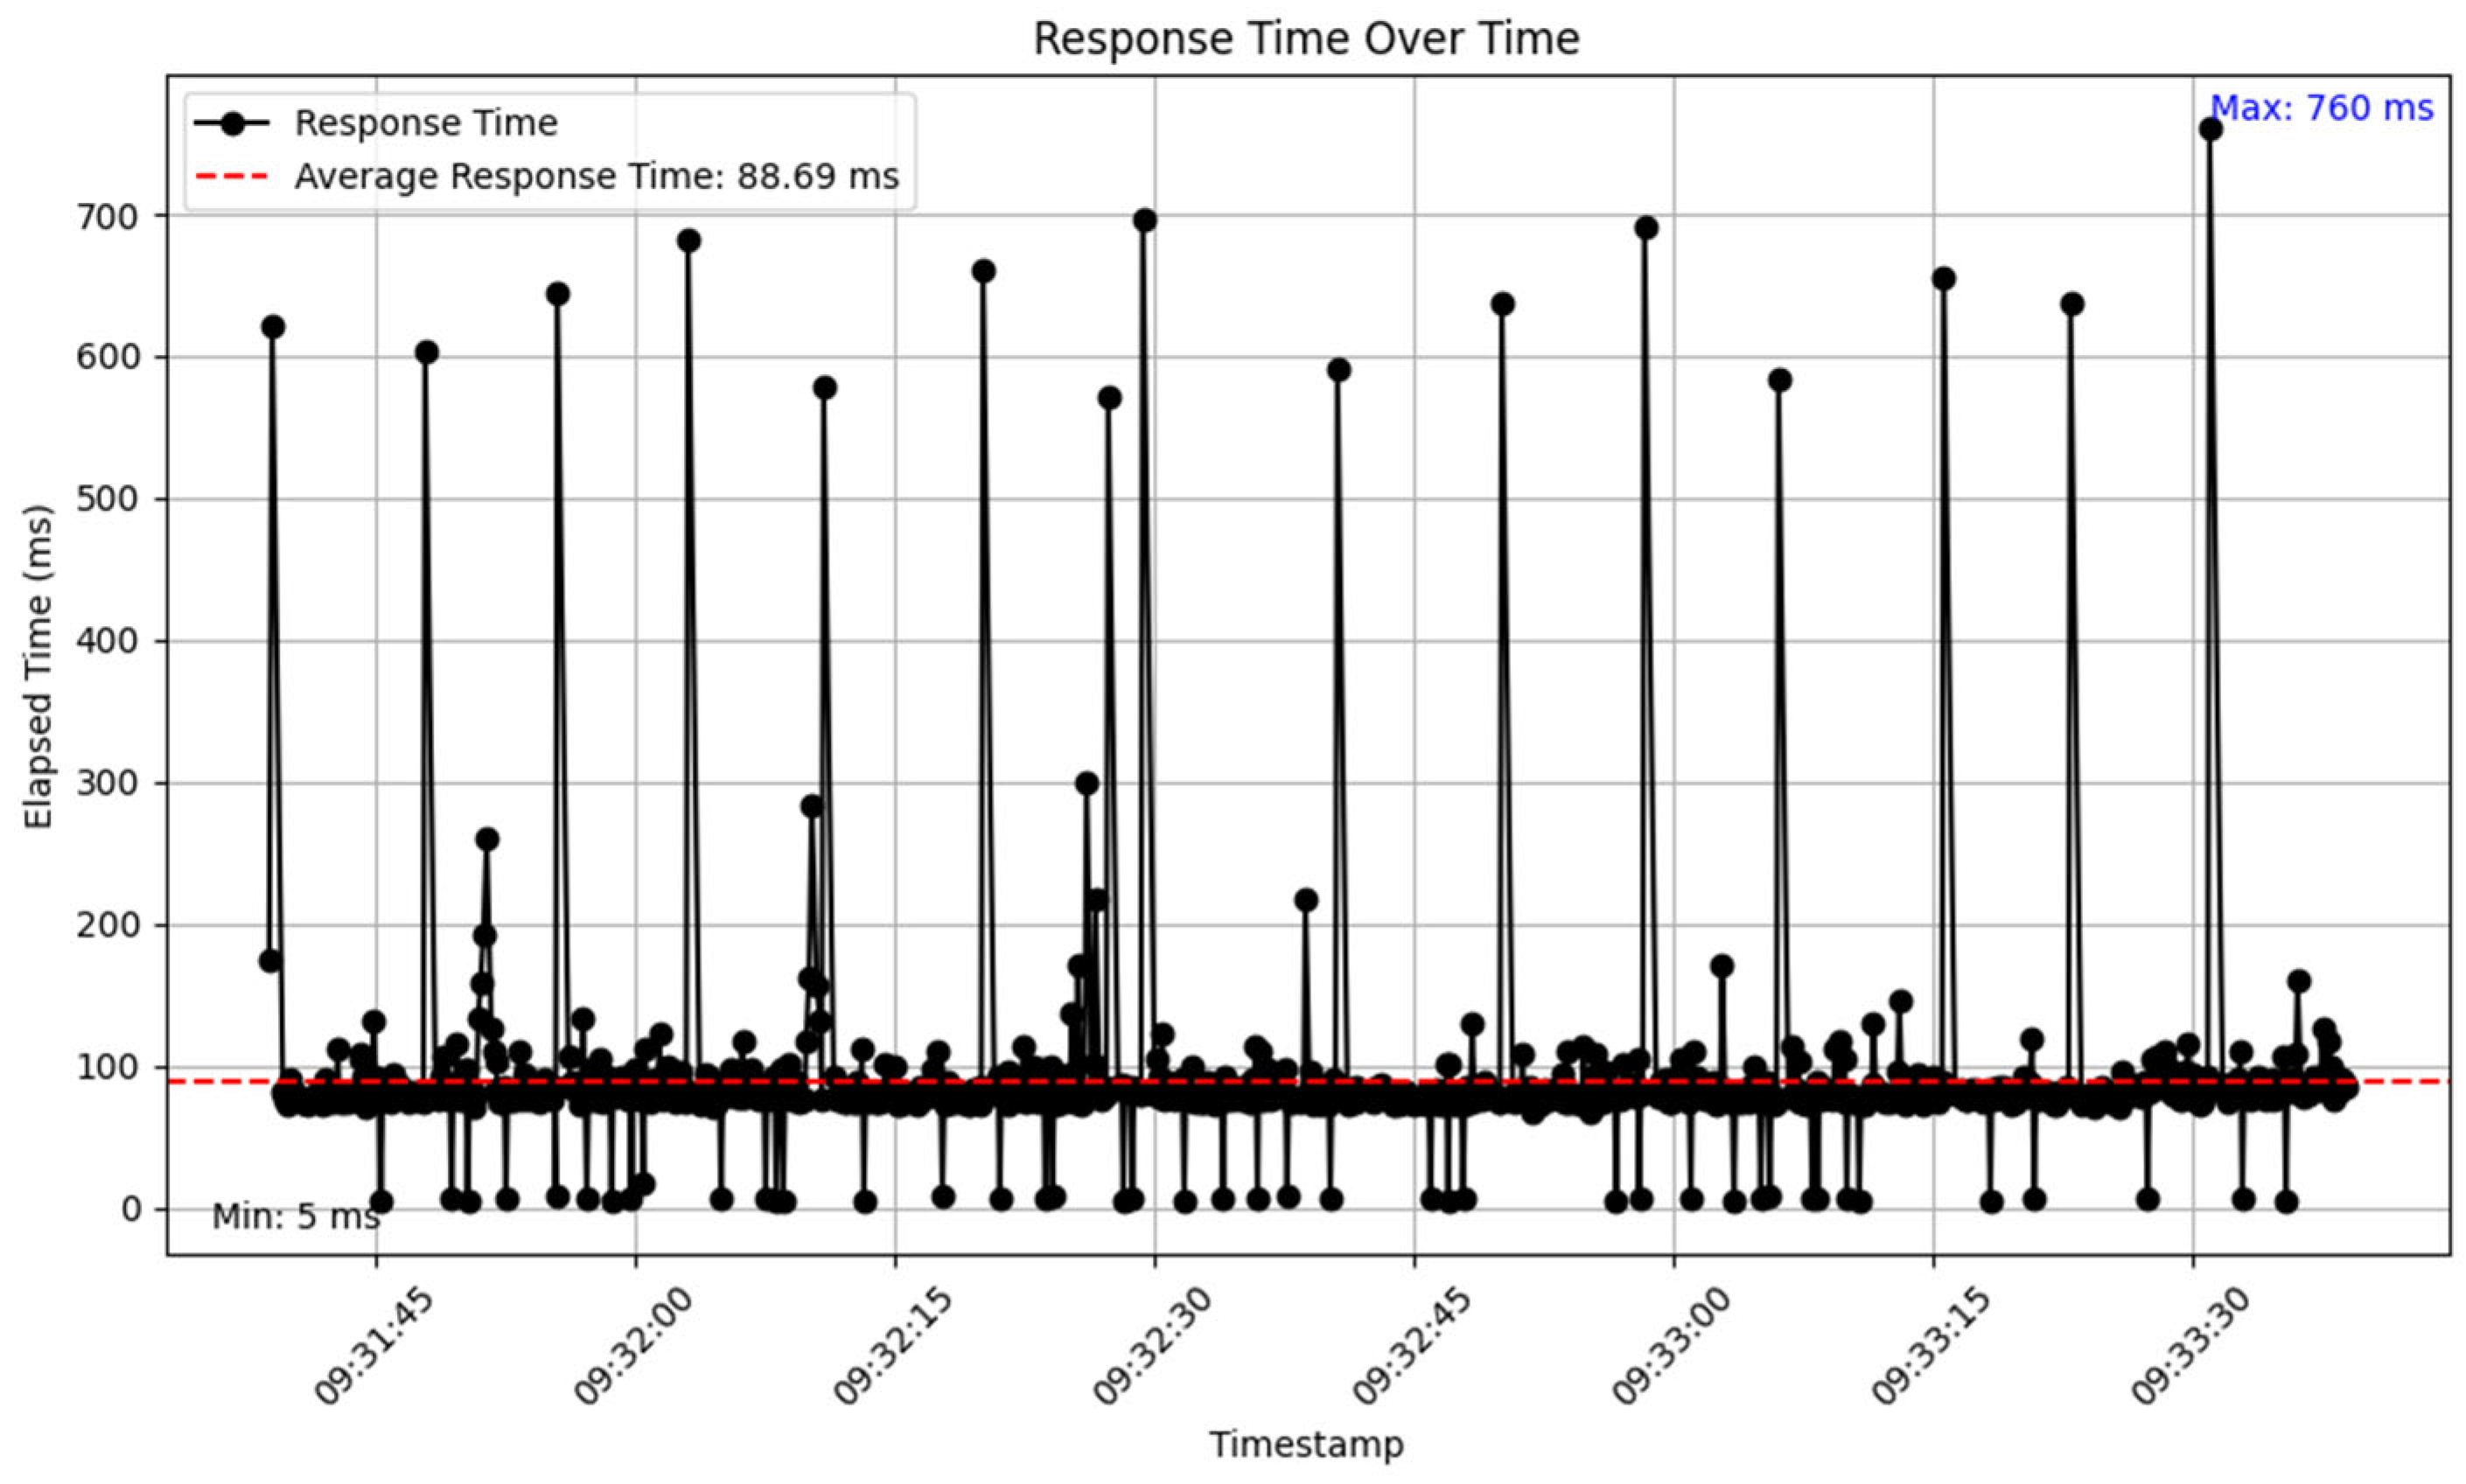
Bypassing the rate limit, as confirmed by the first minute’s throughput of 67.1 requests/s, allowed the test to reveal the API’s performance under stress, highlighting the server’s capacity to handle bursts of traffic. However, this also exposed vulnerabilities, as the 3.11% error rate, driven by 404 errors, coincided with response time spikes, such as the maximum of 760 ms, indicating server-side issues like resource unavailability under high load. The efficient average response time of 88.69 ms demonstrates the API’s capability to handle requests quickly, but the variability in response times points to potential bottlenecks that need addressing. The test’s inability to sustain a steady load throughout highlights a design limitation in the JMeter configuration, likely due to inadequate throttling or loop control, leading to an initial burst and subsequent decline in request rate over the 141 s duration. The performance metrics captured during the test are illustrated in
Table 16 and
Figure 20:


