
Towards the Real-World Analysis of Lumbar Spine Standing Posture in Individuals with Low Back Pain: A Cross-Sectional Observational Study

 , , , , and
Abstract
1. Introduction
2. Materials and Methods
2.1. Design, Setting, and Participants
2.2. Sensor Placement and Data Processing
2.3. Data Analysis
3. Results
4. Discussion
Author Contributions
Funding
Institutional Review Board Statement
Informed Consent Statement
Data Availability Statement
Conflicts of Interest
Abbreviations
| APDF | Amplitude probability distribution function |
| IMUs | Inertial measurement units |
| LBP | Low back pain |
| NPDs | Non-pain developers |
| PDs | Pain developers |
| VAS | Visual Analog Scale |
References
- Hartvigsen, J.; Hancock, M.J.; Kongsted, A.; Louw, Q.; Ferreira, M.L.; Genevay, S.; Hoy, D.; Karppinen, J.; Pransky, G.; Sieper, J.; et al. What low back pain is and why we need to pay attention. Lancet 2018, 391, 2356–2367. [Google Scholar] [CrossRef] [PubMed]
- Ferreira, M.L.; de Luca, K.; Haile, L.M.; Steinmetz, J.D.; Culbreth, G.T.; Cross, M.; Kopec, J.A.; Ferreira, P.H.; Blyth, F.M.; Buchbinder, R.; et al. Global, regional, and national burden of low back pain, 1990–2020, its attributable risk factors, and projections to 2050: A systematic analysis of the Global Burden of Disease Study 2021. Lancet Rheumatol. 2023, 5, e316–e329. [Google Scholar] [CrossRef]
- Hanna, F.; Daas, R.N.; El-Shareif, T.J.; Al-Marridi, H.H.; Al-Rojoub, Z.M.; Adegboye, O.A. The relationship between sedentary behavior, back pain, and psychosocial correlates among university employees. Front. Public Health 2019, 7, 80. [Google Scholar] [CrossRef]
- Tinitali, S.; Bowles, K.-A.; Keating, J.L.; Haines, T. Sitting Posture During Occupational Driving Causes Low Back Pain; Evidence-Based Position or Dogma? A Systematic Review. Hum. Factors 2021, 63, 111–123. [Google Scholar] [CrossRef] [PubMed]
- Dzakpasu, F.Q.S.; Carver, A.; Brakenridge, C.J.; Cicuttini, F.; Urquhart, D.M.; Owen, N.; Dunstan, D.W. Musculoskeletal pain and sedentary behaviour in occupational and non-occupational settings: A systematic review with meta-analysis. Int. J. Behav. Nutr. Phys. Act. 2021, 18, 159. [Google Scholar] [CrossRef]
- Baradaran Mahdavi, S.; Riahi, R.; Vahdatpour, B.; Kelishadi, R. Association between sedentary behavior and low back pain; A systematic review and meta-analysis. Health Promot. Perspect. 2021, 11, 393–410. [Google Scholar] [CrossRef]
- Waongenngarm, P.; Areerak, K.; Janwantanakul, P. The effects of breaks on low back pain, discomfort, and work productivity in office workers: A systematic review of randomized and non-randomized controlled trials. Appl. Ergon. 2018, 68, 230–239. [Google Scholar] [CrossRef]
- De Carvalho, D.; Callaghan, J.P. Does a break from sitting change biomechanical outcome measures or transient pain? A laboratory-based experimental study. Work 2023, 75, 553–566. [Google Scholar] [CrossRef]
- Plotnikoff, R.; Karunamuni, N. Reducing sitting time: The new workplace health priority. Arch. Environ. Occup. Health 2012, 67, 125–127. [Google Scholar] [CrossRef]
- Owen, N.; Sugiyama, T.; Eakin, E.E.; Gardiner, P.A.; Tremblay, M.S.; Sallis, J.F. Adults’ sedentary behavior determinants and interventions. Am. J. Prev. Med. 2011, 41, 189–196. [Google Scholar] [CrossRef]
- Coenen, P.; Willenberg, L.; Parry, S.; Shi, J.W.; Romero, L.; Blackwood, D.M.; Maher, C.G.; Healy, G.N.; Dunstan, D.W.; Straker, L.M. Associations of occupational standing with musculoskeletal symptoms: A systematic review with meta-analysis. Br. J. Sports Med. 2018, 52, 176–183. [Google Scholar] [CrossRef]
- Cetin, H.; Bilgin, S.; Köse, N. A comparison of occupational groups using different working postures in terms of their low back and neck health status. J. Back. Musculoskelet. Rehabil. 2018, 31, 475–480. [Google Scholar] [CrossRef] [PubMed]
- De Carvalho, D.; Greene, R.; Swab, M.; Godwin, M. Does objectively measured prolonged standing for desk work result in lower ratings of perceived low back pain than sitting? A systematic review and meta-analysis. Work. 2020, 67, 431–440. [Google Scholar] [CrossRef] [PubMed]
- Christie, H.J.; Kumar, S.; Warren, S.A. Postural aberrations in low back pain. Arch. Phys. Med. Rehabil. 1995, 76, 218–224. [Google Scholar] [CrossRef] [PubMed]
- Hultman, G.; Nordin, M.; Saraste, H.; Ohlsèn, H. Body composition, endurance, strength, cross-sectional area, and density of MM erector spinae in men with and without low back pain. J. Spinal Disord. 1993, 6, 114–123. [Google Scholar] [CrossRef]
- Laird, R.A.; Kent, P.; Keating, J.L. How consistent are lordosis, range of movement and lumbo-pelvic rhythm in people with and without back pain? BMC Musculoskelet. Disord. 2016, 17, 403. [Google Scholar] [CrossRef]
- Chun, S.-W.; Lim, C.-Y.; Kim, K.; Hwang, J.; Chung, S.G. The relationships between low back pain and lumbar lordosis: A systematic review and meta-analysis. Spine J. 2017, 17, 1180–1191. [Google Scholar] [CrossRef]
- McClintock, F.A.; Callaway, A.J.; Clark, C.J.; Alqhtani, R.S.; Williams, J.M. Lumbar sitting behavior of individuals with low back pain: A preliminary study using extended real-world data. Sensors 2024, 24, 6751. [Google Scholar] [CrossRef]
- Misir, A.; Kizkapan, T.B.; Tas, S.K.; Yildiz, K.I.; Ozcamdalli, M.; Yetis, M. Lumbar spine posture and spinopelvic parameters change in various standing and sitting postures. Eur. Spine J. 2019, 28, 1072–1081. [Google Scholar] [CrossRef]
- Viggiani, D.; Gallagher, K.M.; Sehl, M.; Callaghan, J.P. The distribution of lumbar intervertebral angles in upright standing and extension is related to low back pain developed during standing. Clin. Biomech. 2017, 49, 85–90. [Google Scholar] [CrossRef]
- Sorensen, C.J.; Norton, B.J.; Callaghan, J.P.; Hwang, C.-T.; Van Dillen, L.R. Is lumbar lordosis related to low back pain development during prolonged standing? Man. Ther. 2015, 20, 553–557. [Google Scholar] [CrossRef] [PubMed]
- Khoshroo, F.; Seidi, F.; Bayattork, M.; Moghadas-Tabrizi, Y.; Nelson-Wong, E. Distinctive characteristics of prolonged standing low back pain developers’ and the associated risk factors: Systematic review and meta-analysis. Sci. Rep. 2023, 13, 6392. [Google Scholar] [CrossRef] [PubMed]
- Orakifar, N.; Salehi, R.; Shaterzadeh Yazdi, M.J.; Mehravar, M.; Najarzadeh, Z. Comparison of proprioceptive postural control strategies between prolonged standing induced low back pain developers and non-low back pain developers. Physiother. Theory Pract. 2023, 39, 300–309. [Google Scholar] [CrossRef]
- Fewster, K.M.; Gallagher, K.M.; Howarth, S.H.; Callaghan, J.P. Low back pain development differentially influences centre of pressure regularity following prolonged standing. Gait Posture 2020, 78, e1–e6. [Google Scholar] [CrossRef] [PubMed]
- Alghadir, A.H.; Anwer, S.; Iqbal, A.; Iqbal, Z.A. Test-retest reliability, validity, and minimum detectable change of visual analog, numerical rating, and verbal rating scales for measurement of osteoarthritic knee pain. J. Pain. Res. 2018, 11, 851–856. [Google Scholar] [CrossRef]
- Waddell, G.; Newton, M.; Henderson, I.; Somerville, D.; Main, C.J. A Fear-Avoidance Beliefs Questionnaire (FABQ) and the role of fear-avoidance beliefs in chronic low back pain and disability. Pain 1993, 52, 157–168. [Google Scholar] [CrossRef]
- Roland, M.; Fairbank, J. The Roland-Morris Disability Questionnaire and the Oswestry Disability Questionnaire. Spine 2000, 25, 3115–3124. [Google Scholar] [CrossRef]
- McClintock, F.A.; Callaway, A.J.; Clark, C.J.; Williams, J.M. Assessing the impact of sensor orientation on accelerometer-derived angles: A systematic analysis and proposed error reduction. Appl. Sci. 2024, 14, 842. [Google Scholar] [CrossRef]
- Williams, J.M.; Frey, M.; Breen, A.; De Carvalho, D. Systematic analysis of different low-pass filter cut-off frequencies on lumbar spine kinematics data and the impact on the agreement between accelerometers and an optoelectronic system. J. Biomech. 2022, 145, 111395. [Google Scholar] [CrossRef]
- Dunk, N.M.; Callaghan, J.P. Lumbar spine movement patterns during prolonged sitting differentiate low back pain developers from matched asymptomatic controls. Work 2010, 35, 3–14. [Google Scholar] [CrossRef]
- Radtke, T.; Rodriguez, M.; Braun, J.; Dressel, H. Criterion validity of the ActiGraph and activPAL in classifying posture and motion in office-based workers: A cross-sectional laboratory study. PLoS ONE 2021, 16, e0252659. [Google Scholar] [CrossRef] [PubMed]
- Gombatto, S.P.; Bailey, B.; Bari, M.; Bouchekara, J.; Holmes, A.; Lenz, S.; Simmonds, K.; Vonarb, A.; Whelehon, K.; Batalla, C.R.; et al. Identifying Clinical Phenotypes in People Who Are Hispanic/Latino With Chronic Low Back Pain: Use of Sensor-Based Measures of Posture and Movement, Pain, and Psychological Factors. Phys. Ther. 2024, 104, pzad185. [Google Scholar] [CrossRef]
- Hong, K.-R.; Hwang, I.-W.; Kim, H.-J.; Yang, S.-H.; Lee, J.-M. Apple Watch 6 vs. Galaxy Watch 4: A validity study of step-count estimation in daily activities. Sensors 2024, 24, 4658. [Google Scholar] [CrossRef] [PubMed]
- Park, J.; Nguyen, V.Q.; Ho, R.L.M.; Coombes, S.A. The effect of chronic low back pain on postural control during quiet standing: A meta-analysis. Sci. Rep. 2023, 13, 7928. [Google Scholar] [CrossRef] [PubMed]
- Davidson, J.M.; Zehr, J.D.; Dominelli, P.B.; Callaghan, J.P. Traditional versus dynamic sitting: Lumbar spine kinematics and pain during computer work and activity guided tasks. Appl. Ergon. 2024, 119, 104310. [Google Scholar] [CrossRef]
- McMaster, H.; Battis, A.; Alano, C.; Beaudette, S.M. The role of diurnal variation in development of musculoskeletal pain during prolonged standing. Gait Posture 2024, 114, 119–126. [Google Scholar] [CrossRef]
- Gallagher, K.M.; Sehl, M.; Callaghan, J.P. A radiographic assessment of lumbar spine posture in four different upright standing positions. Clin. Biomech. 2016, 37, 131–136. [Google Scholar] [CrossRef]
- Gregory, D.E.; Callaghan, J.P. Prolonged standing as a precursor for the development of low back discomfort: An investigation of possible mechanisms. Gait Posture 2008, 28, 86–92. [Google Scholar] [CrossRef]
- Adams, M.A.; Hutton, W.C. The effect of posture on the lumbar spine. J. Bone Jt. Surg. Br. Vol. 1985, 67, 625–629. [Google Scholar] [CrossRef]
- Stefanakis, M.; Luo, J.; Pollintine, P.; Dolan, P.; Adams, M.A. ISSLS Prize Winner: Mechanical influences in progressive intervertebral disc degeneration. Spine 2014, 39, 1365. [Google Scholar] [CrossRef]
- Punnett, L.; Fine, L.J.; Keyserling, W.M.; Herrin, G.D.; Chaffin, D.B. Back disorders and nonneutral trunk postures of automobile assembly workers. Scand. J. Work Environ. Health 1991, 17, 337–346. [Google Scholar] [CrossRef] [PubMed]
- Deodato, M.; Saponaro, S.; Šimunič, B.; Martini, M.; Murena, L.; Buoite Stella, A. Trunk muscles’ characteristics in adolescent gymnasts with low back pain: A pilot study on the effects of a physiotherapy intervention including a postural reeducation program. J. Man. Manip. Ther. 2024, 32, 310–324. [Google Scholar] [CrossRef] [PubMed]
- Kim, M.; Yoo, W.; Choi, B. Differences between two subgroups of low back pain patients in lumbopelvic rotation and symmetry in the erector spinae and hamstring muscles during trunk flexion when standing. J. Electromyogr. Kinesiol. 2013, 23, 387–393. [Google Scholar] [CrossRef] [PubMed]

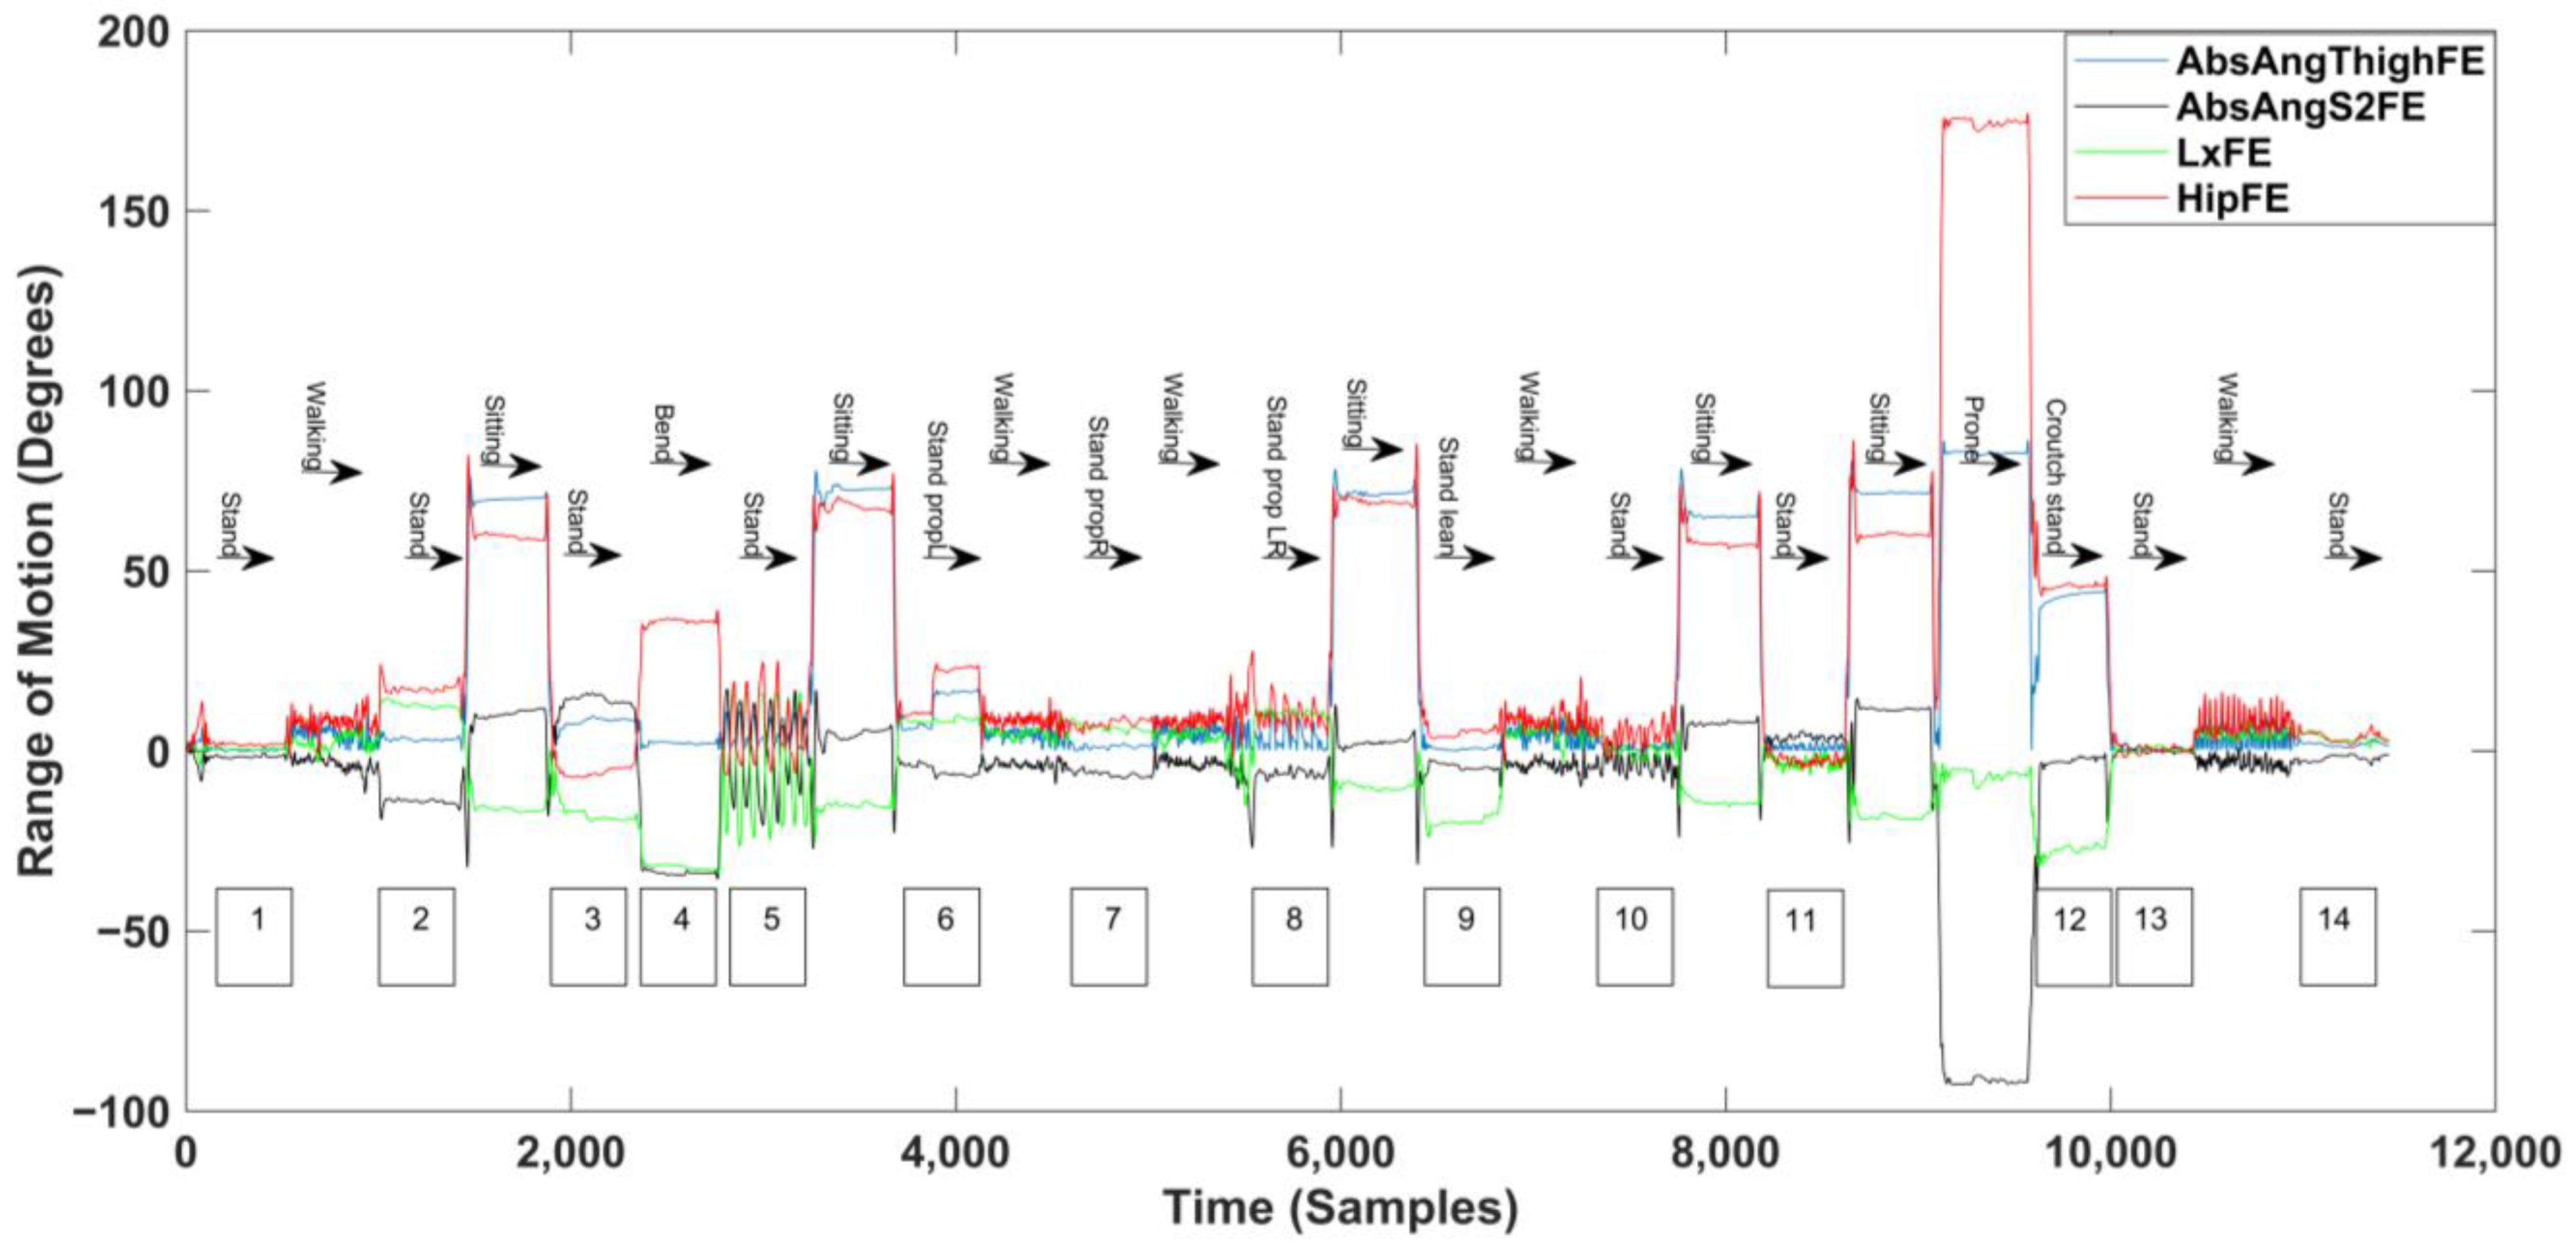
| Approximate Time (s) | Activity | Period of Standing |
|---|---|---|
| 0–30 | Normal standing | 1 |
| 30–60 | Walking | |
| 60–90 | Lordotic standing | 2 |
| 90–120 | Sitting | |
| 120–150 | Flat back standing | 3 |
| 150–180 | Sustained forward bending | 4 |
| 180–210 | Flat back to lordotic (Sagittally variable posture) | 5 |
| 210–240 | Sitting | |
| 240–270 | Prop standing on Left leg | 6 |
| 270–300 | Walking | |
| 300–320 | Prop standing on Right leg | 7 |
| 320–350 | Walking | |
| 350–380 | Prop standing left to right (Frontally variable posture) | 8 |
| 380–410 | Sitting | |
| 410–440 | Sustained half flexion | 9 |
| 440–470 | Walking | |
| 470–500 | Standing with bilateral arm raises | 10 |
| 500–530 | Sitting | |
| 530–560 | Standing twisting to left and right (transverse variable posture) | 11 |
| 560–590 | Sitting | |
| 590–620 | Prone lying | |
| 620–650 | Crouched standing | 12 |
| 650–680 | Normal standing | 13 |
| 680–710 | Slow walking | |
| 710–740 | Normal standing | 14 |
| Variable | Description |
|---|---|
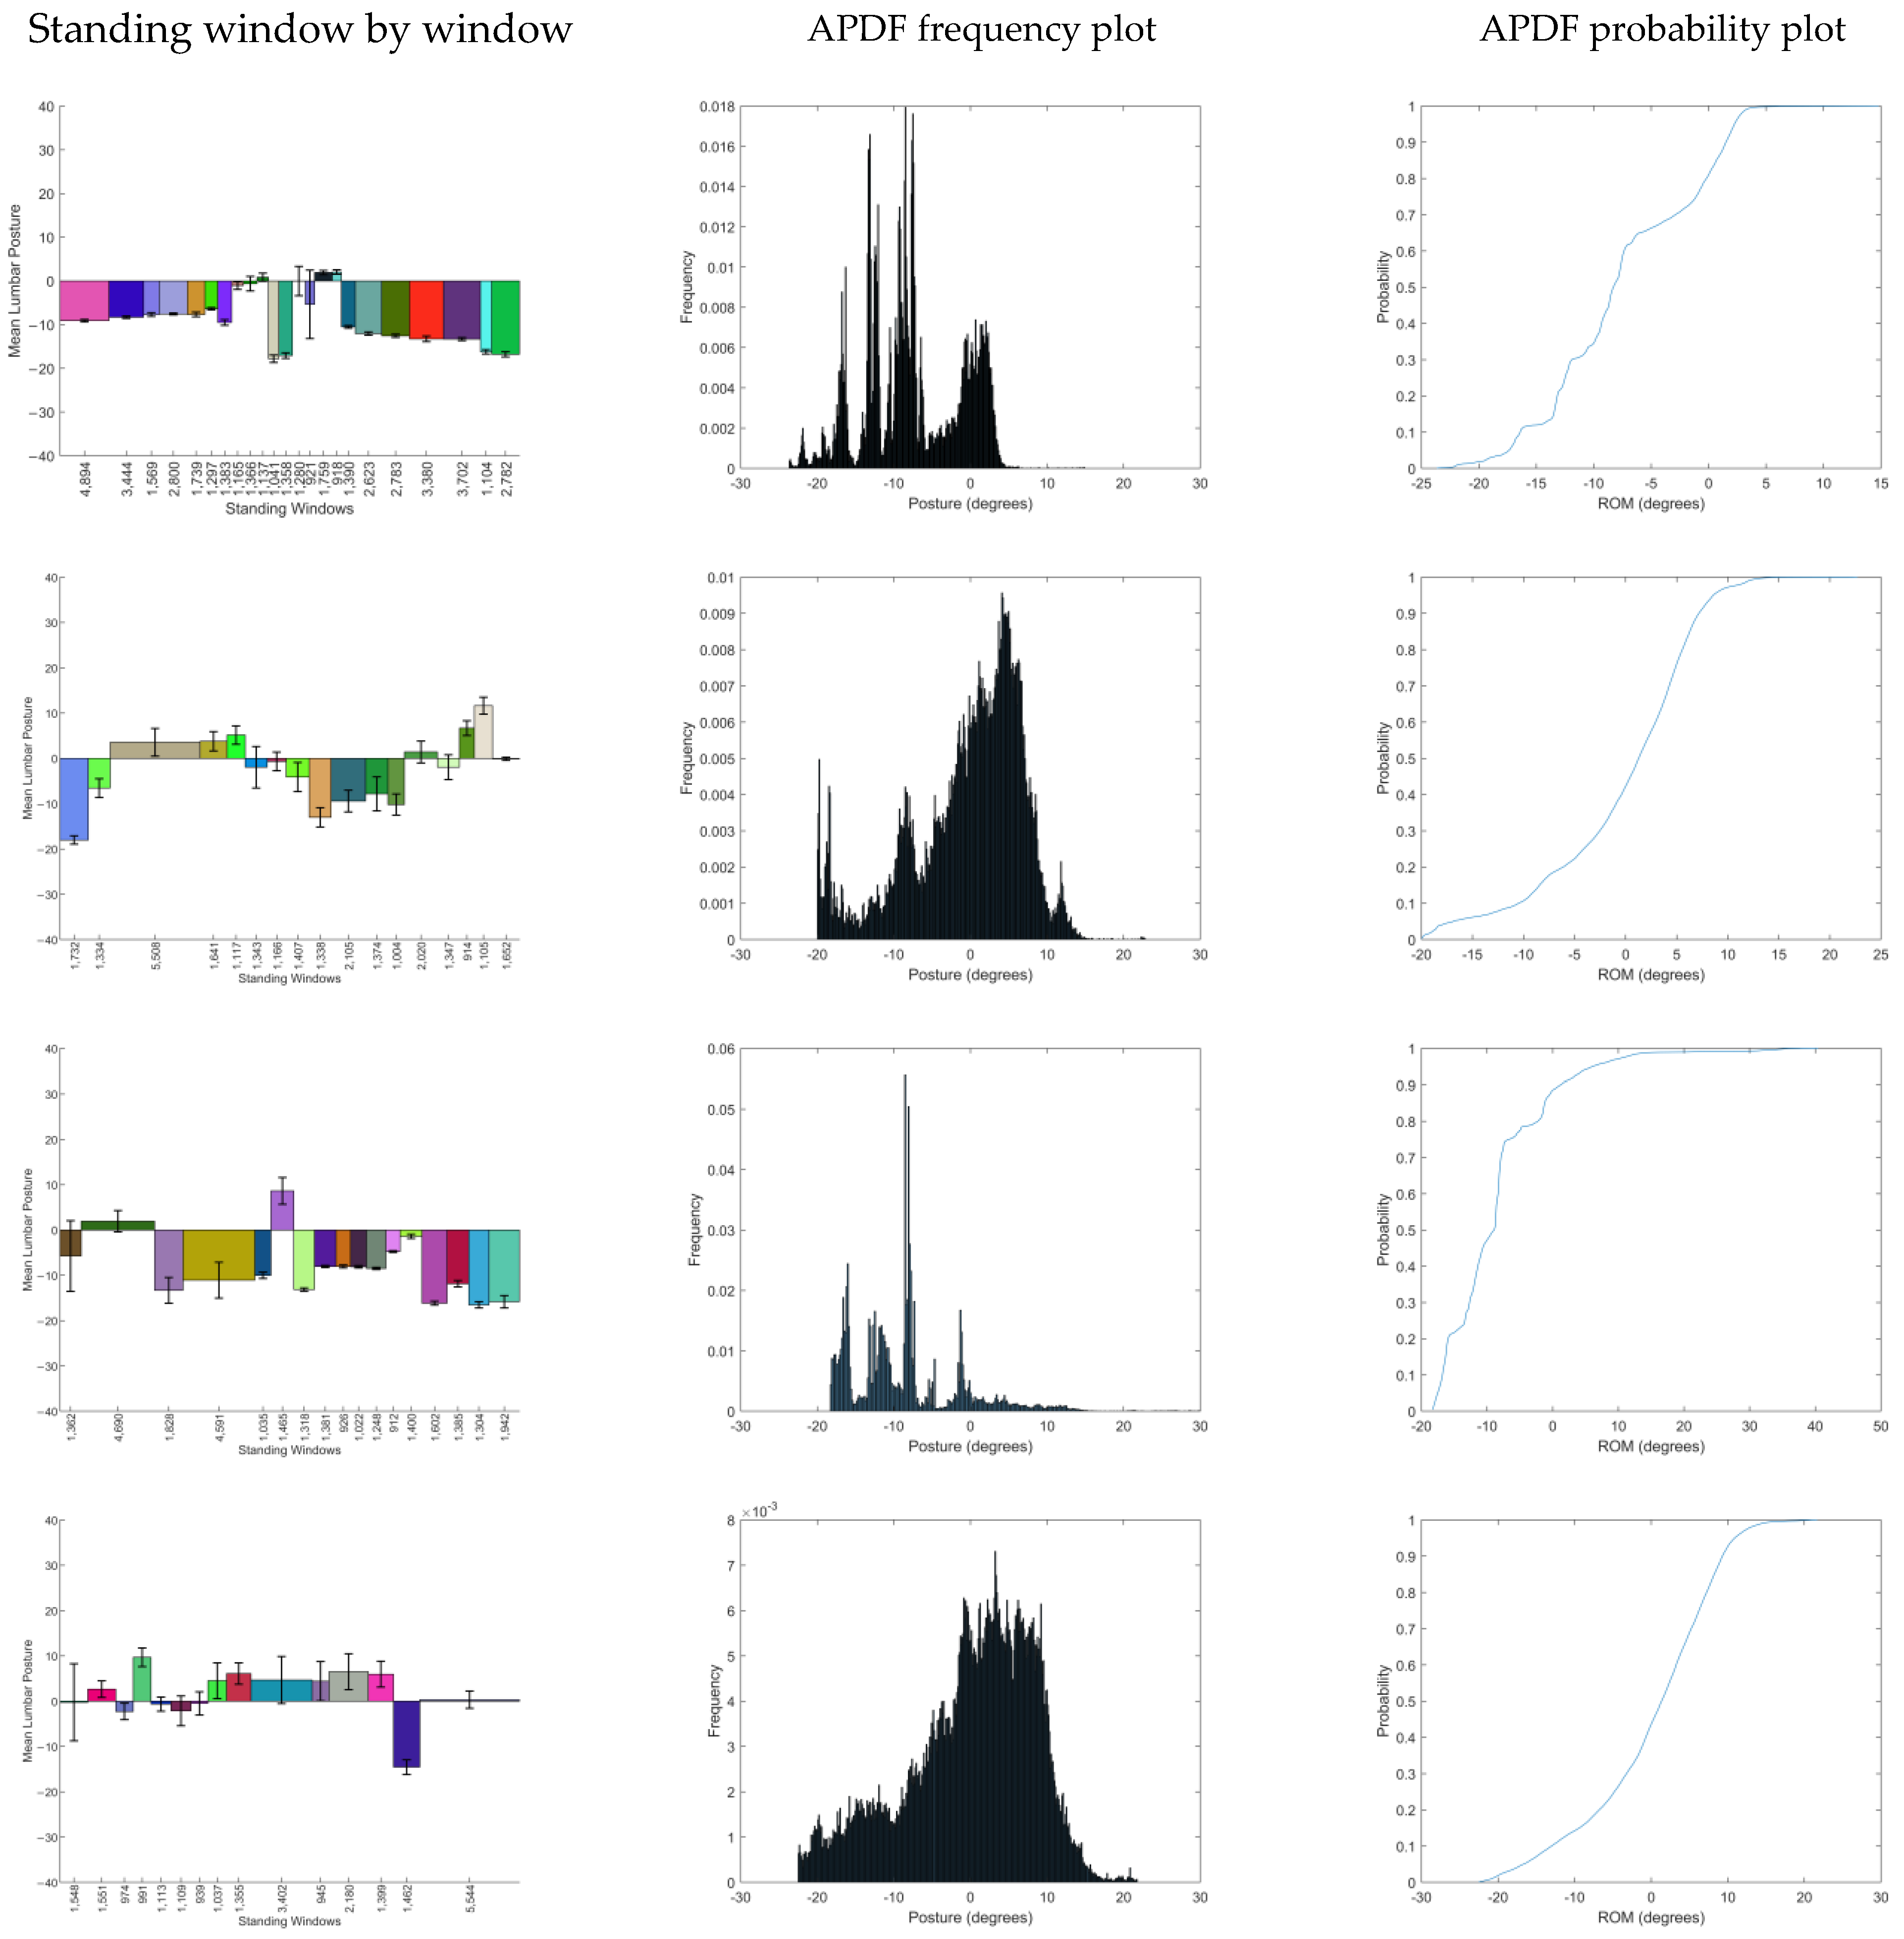
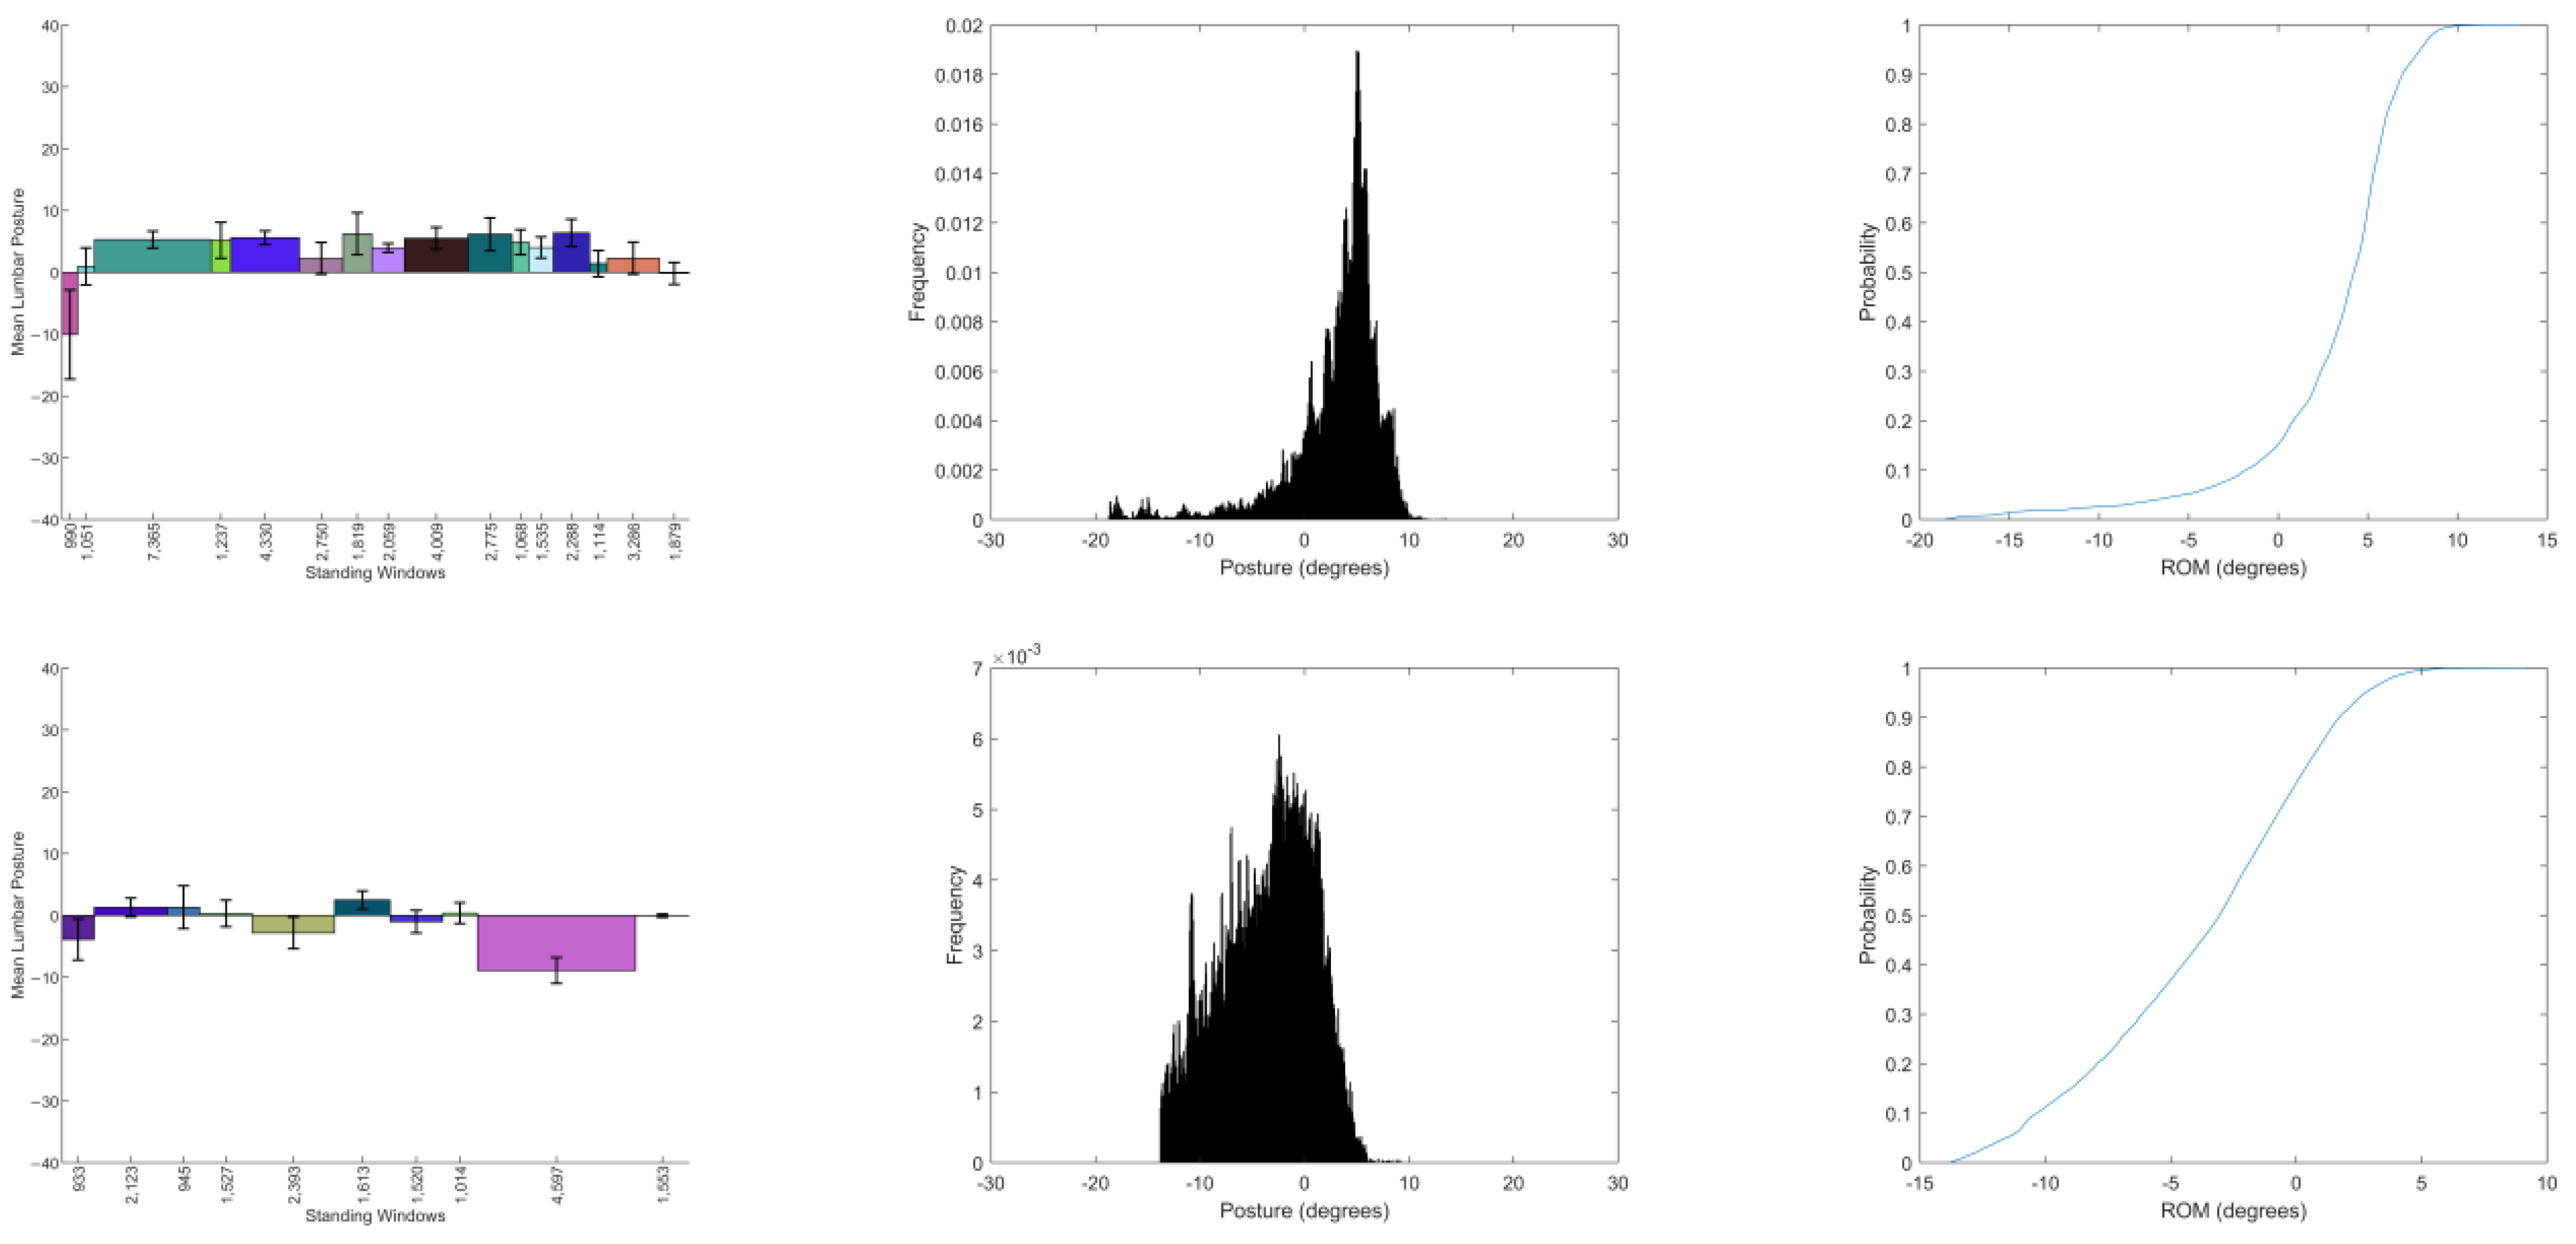
| Average standing posture for the day | Derived from the unweighted mean of all the standing windows |
| Weighted average standing posture for the day | Derived from the weighted mean of all the standing windows |
| Variability of standing posture across the day | Determined from the standard deviation of the mean posture from each standing period |
| Average ‘fidgeting’ in standing | Derived from the mean of the standard deviations of the standing windows |
| Standing Region | Duration (s) | Mean Lumbar Posture (°) (Extension Positive) | Standard Deviation (°) | Known Standing Position | Standing Identified by Algorithm |
|---|---|---|---|---|---|
| 1 | 33 | 0.6 | 1.0 | Normal standing | Y |
| 2 | 25 | 12.2 | 1.0 | Lordotic standing | Y |
| 3 | 28 | −18.0 | 1.6 | Flat back standing | Y |
| 4 | 26 | −30.0 | 7.9 | Sustained flexion | Y |
| 5 | 28 | −3.2 | 14.6 | Flat back to lordotic (Sagittally variable posture) | Y |
| 6 | 25 | 8.4 | 0.7 | Prop standing on Left leg | Y |
| 7 | 23 | 6.3 | 0.8 | Prop standing on Right leg | Y |
| 8 | 23 | 10.4 | 1.1 | Prop standing left to right (Frontally variable posture) | Y |
| 9 | 25 | −19.5 | 1.5 | Sustained half flexion | Y |
| 10 | 24 | 0.3 | 1.8 | Standing with bilateral arm raises | Y |
| 11 | 21 | 3.2 | 1.6 | Standing twisting to left and right (transverse variable posture) | Y |
| 12 | 21 | −27.3 | 1.8 | Crouched standing | Y |
| 13 | 28 | 0.4 | 0.8 | Normal standing | Y |
| 14 | 33 | 3.6 | 1.0 | Normal standing | Y |
| P | No. of Standing Windows | Average Standing Window Duration (s) (SD) | Weighted Average Standing Posture (°) | Unweighted Average Standing Posture (°) | Variability of Standing Posture (°) | Average Fidget When Standing (°) |
|---|---|---|---|---|---|---|
| 1 | 23 | 132.9 (72.34) | −9.2 | −8.2 | 6.3 | 1.0 |
| 2 | 21 | 110.2 (69.8) | −2.0 | −2.4 | 7.7 | 2.3 |
| 3 | 13 | 115.3 (75.4) | −7.7 | −8.3 | 6.7 | 1.5 |
| 4 | 15 | 113.6 (82.7) | 1.7 | 1.6 | 5.7 | 3.2 |
| 5 | 16 | 164.8 (111.6) | 4.1 | 3.1 | 4.1 | 2.4 |
| 6 | 10 | 121.5 (72.4) | −2.4 | −1.1 | 3.4 | 2.0 |
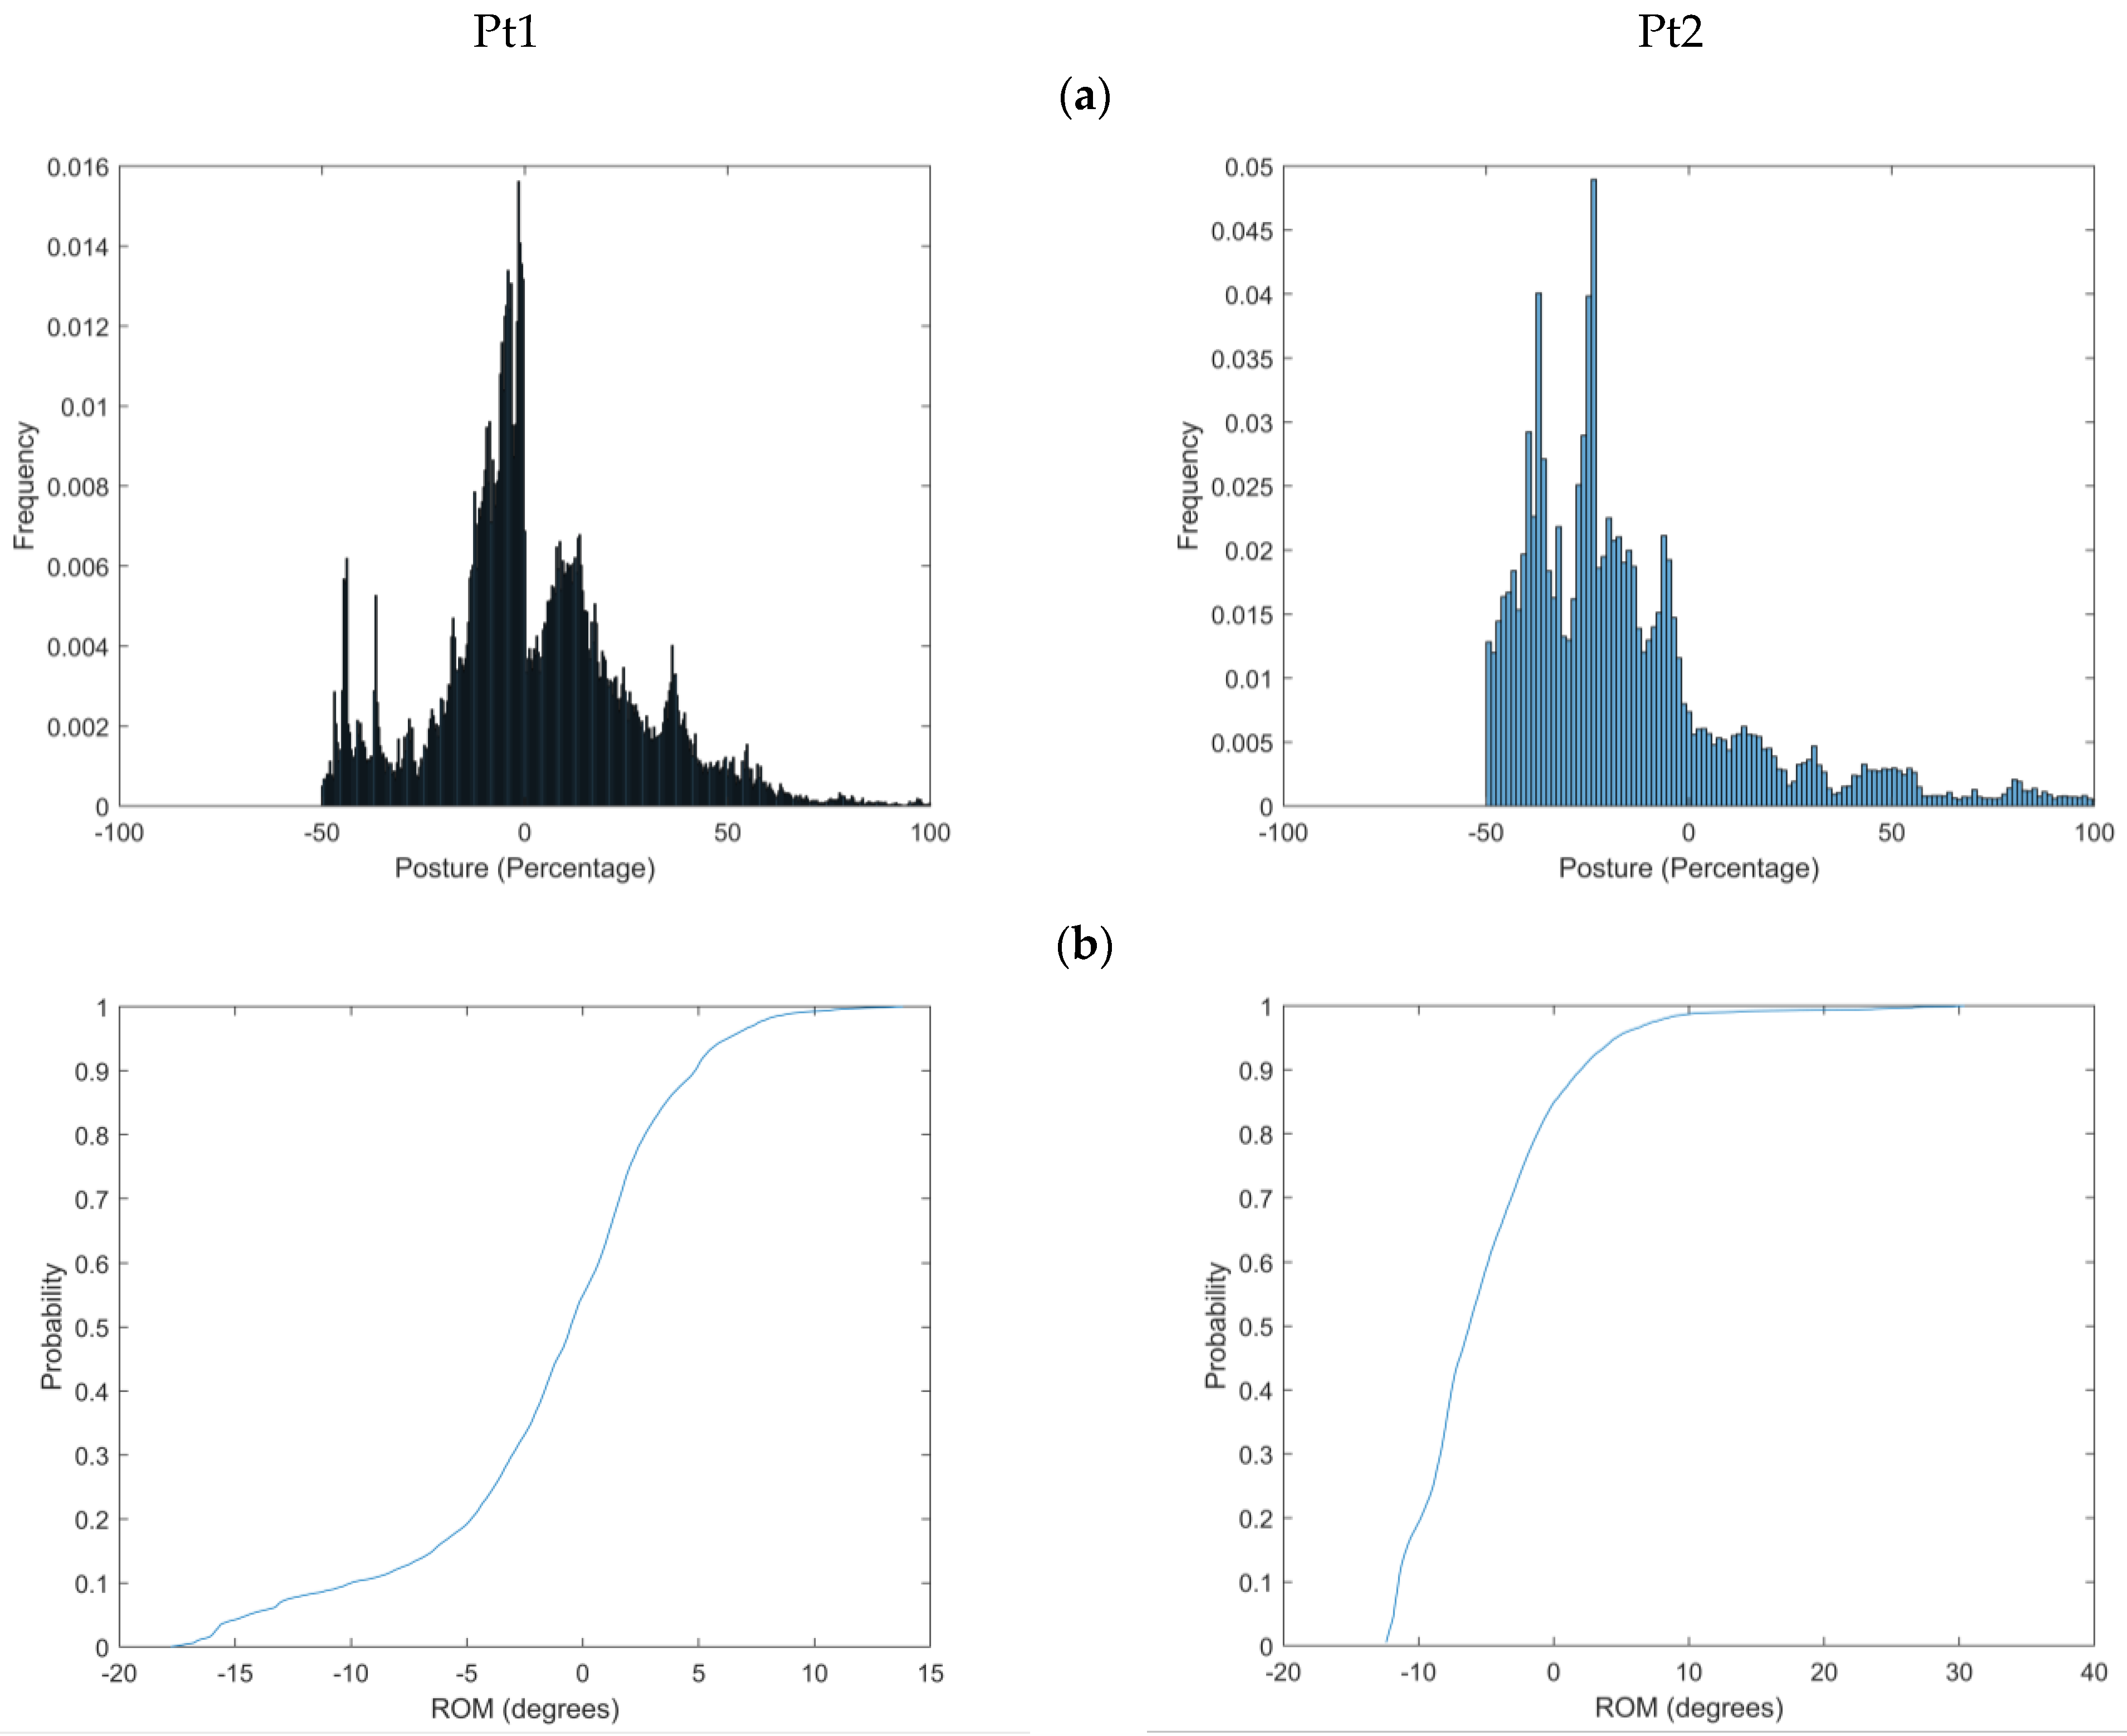
| Pt1 | Pt2 | |
|---|---|---|
| Sex | F | F |
| Age (years) | 42 | 40 |
| Height (cm) | 1.7 | 1.6 |
| Weight (kg) | 70 | 83 |
| BMI (kg/cm2) | 25.4 | 32.4 |
| Duration of LBP (months) | 7 | 156 |
| Average pain (VAS) | 2.9 | 3.8 |
| Worst pain (VAS) | 4.5 | 4.2 |
| FABQ Physical activity subscale | 3 | 13 |
| FABQ Work subscale | 10 | 19 |
| RMDQ | 6 | 13 |
| P | No. of Standing Windows | Mean Standing Window Duration (s) (SD) | Weighted Mean Standing Posture (°) | Unweighted Mean Standing Posture (°) | Variability of Posture (°) | Average Fidget (°) |
|---|---|---|---|---|---|---|
| Pt1 | 23 | 193.13 (196.39) | −0.7 | −2.0 | 5.0 | 2.4 |
| Pt2 | 7 | 179.34 (147.65) | −1.8 | −3.2 | 5.2 | 2.5 |
Disclaimer/Publisher’s Note: The statements, opinions and data contained in all publications are solely those of the individual author(s) and contributor(s) and not of MDPI and/or the editor(s). MDPI and/or the editor(s) disclaim responsibility for any injury to people or property resulting from any ideas, methods, instructions or products referred to in the content. |
© 2025 by the authors. Licensee MDPI, Basel, Switzerland. This article is an open access article distributed under the terms and conditions of the Creative Commons Attribution (CC BY) license (https://creativecommons.org/licenses/by/4.0/).
Share and Cite
Muñoz-Gómez, E.; McClintock, F.; Callaway, A.; Clark, C.; Alqhtani, R.; Williams, J. Towards the Real-World Analysis of Lumbar Spine Standing Posture in Individuals with Low Back Pain: A Cross-Sectional Observational Study. Sensors 2025, 25, 2983. https://doi.org/10.3390/s25102983
Muñoz-Gómez E, McClintock F, Callaway A, Clark C, Alqhtani R, Williams J. Towards the Real-World Analysis of Lumbar Spine Standing Posture in Individuals with Low Back Pain: A Cross-Sectional Observational Study. Sensors. 2025; 25(10):2983. https://doi.org/10.3390/s25102983
Chicago/Turabian StyleMuñoz-Gómez, Elena, Frederick McClintock, Andrew Callaway, Carol Clark, Raee Alqhtani, and Jonathan Williams. 2025. "Towards the Real-World Analysis of Lumbar Spine Standing Posture in Individuals with Low Back Pain: A Cross-Sectional Observational Study" Sensors 25, no. 10: 2983. https://doi.org/10.3390/s25102983
APA StyleMuñoz-Gómez, E., McClintock, F., Callaway, A., Clark, C., Alqhtani, R., & Williams, J. (2025). Towards the Real-World Analysis of Lumbar Spine Standing Posture in Individuals with Low Back Pain: A Cross-Sectional Observational Study. Sensors, 25(10), 2983. https://doi.org/10.3390/s25102983