
A Systematic Review of Sensor-Based Methods for Measurement of Eating Behavior

 ,
, 
 ,
, 
Abstract
1. Introduction
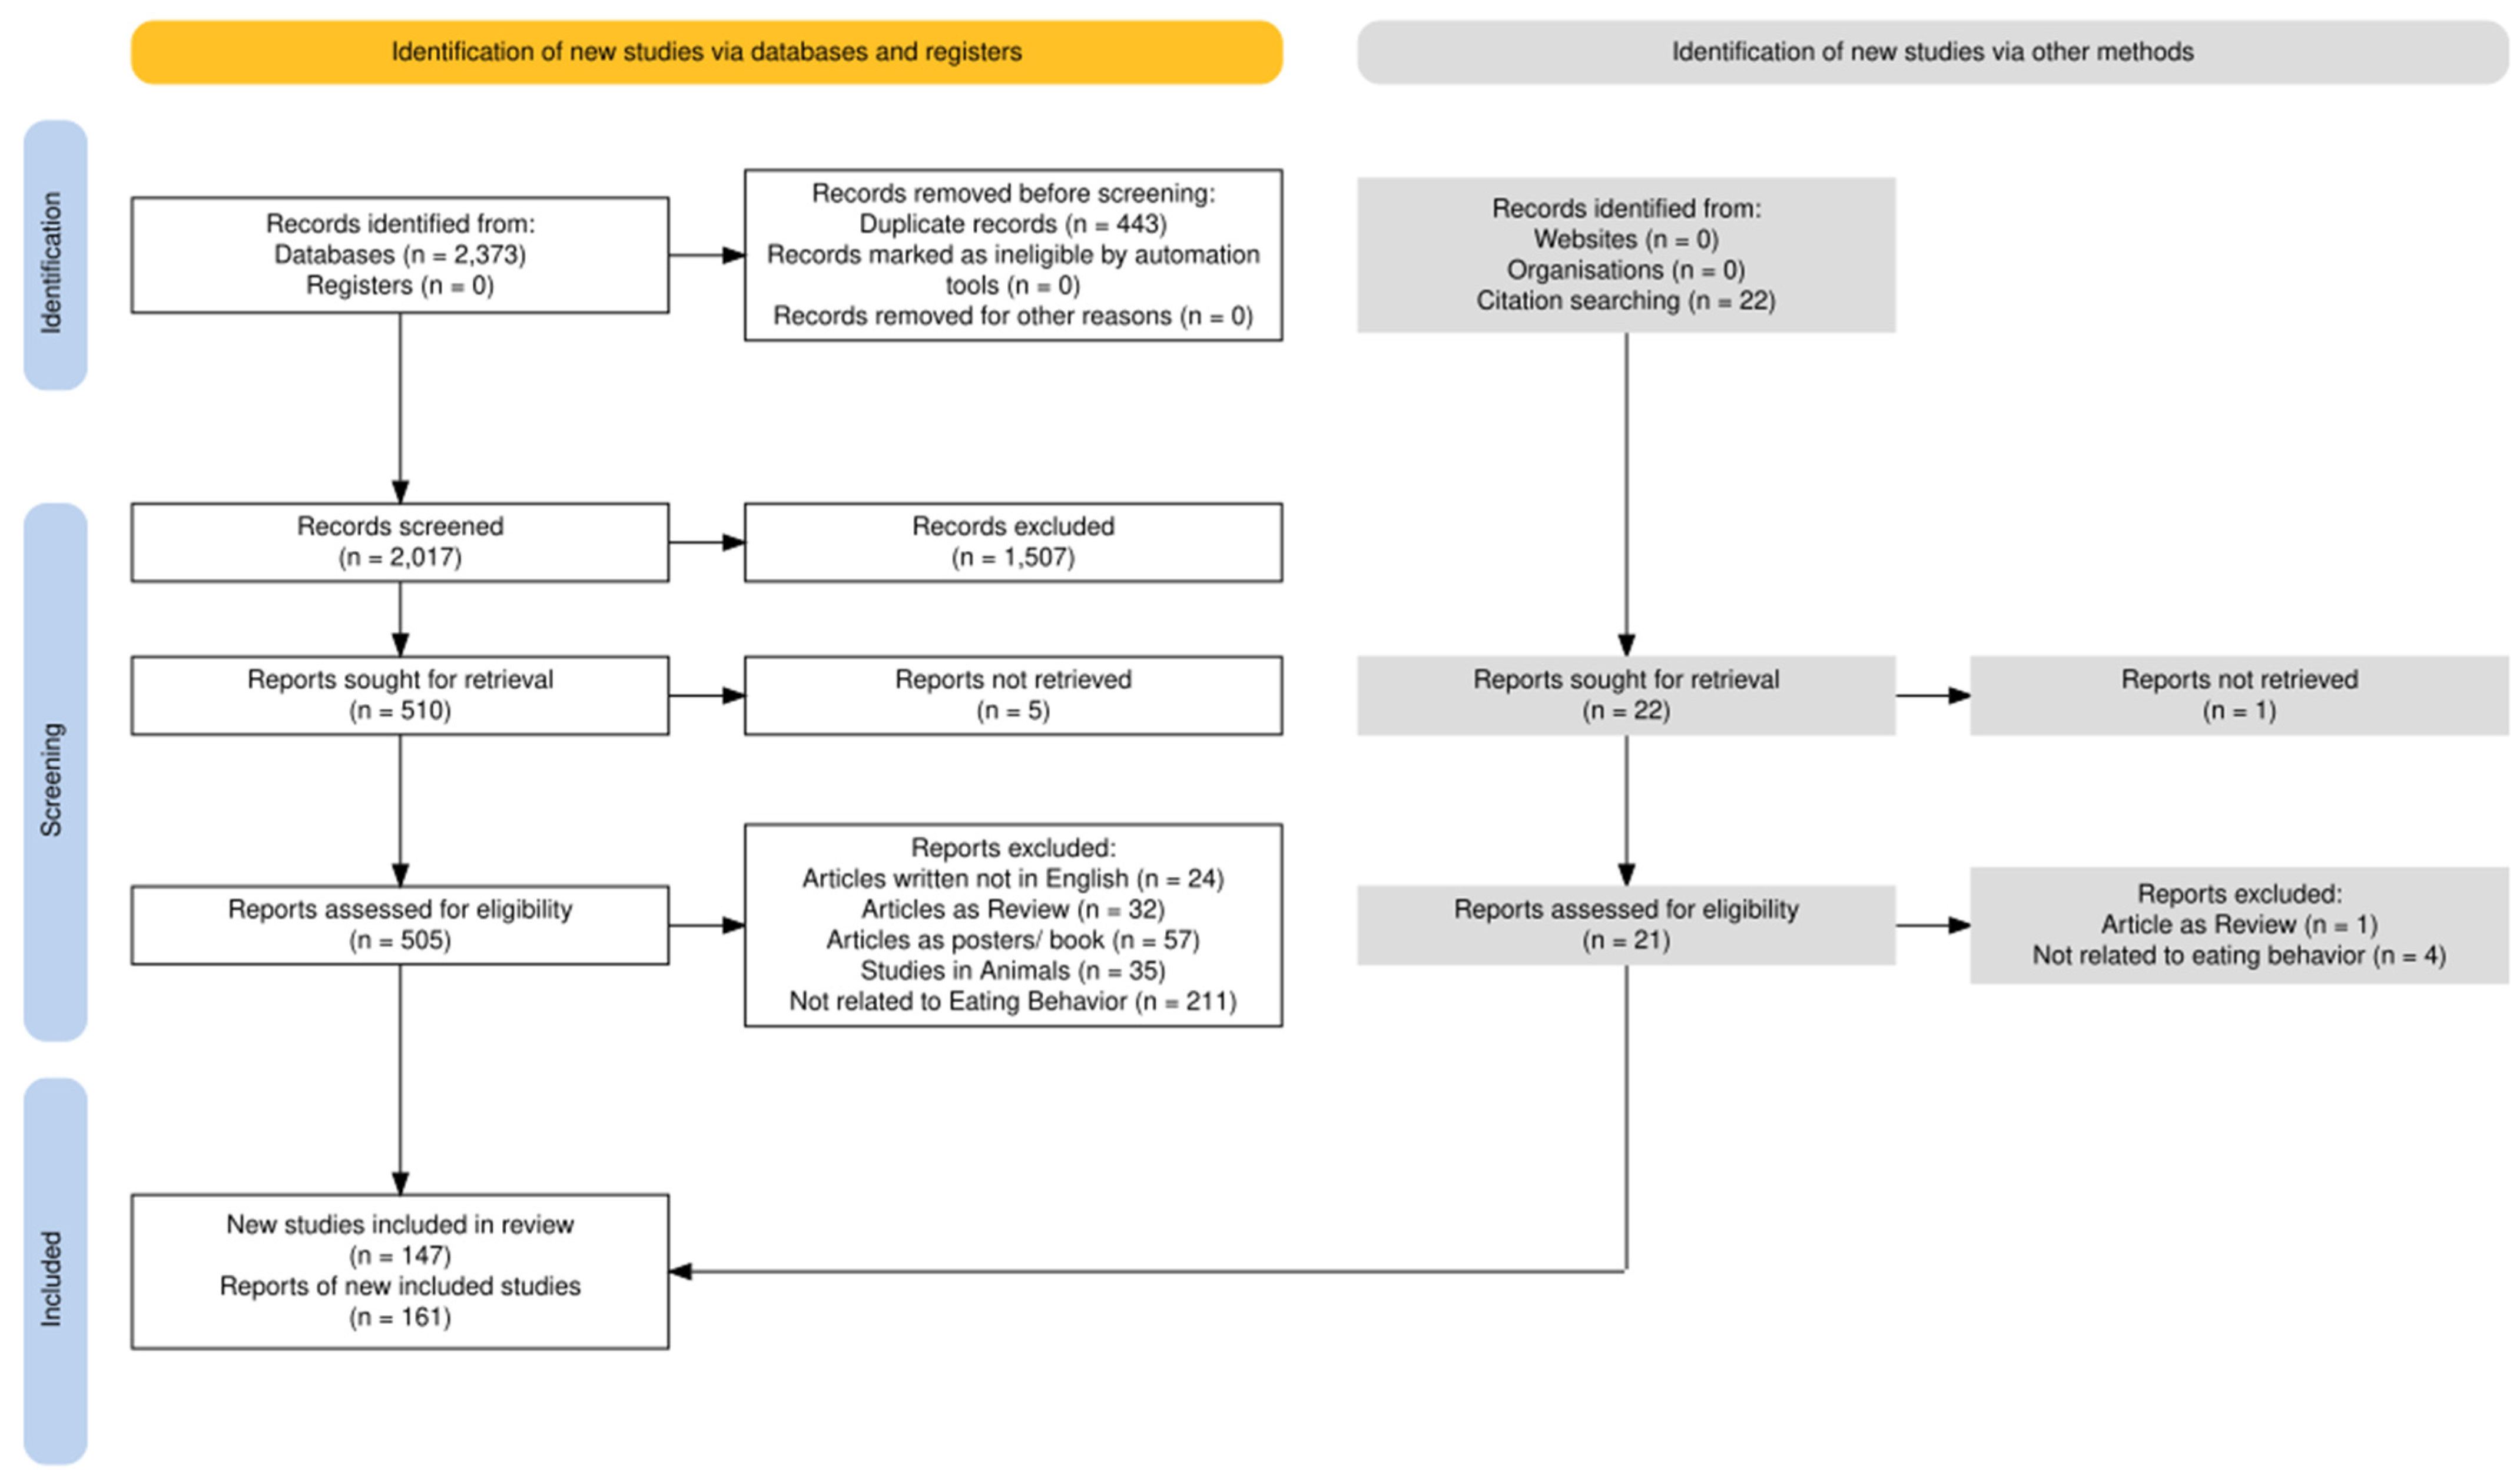
2. Review Methodology
2.1. Research Questions Identification
2.2. Databases
2.3. Search Strategy
- (chewing OR biting OR swallowing OR food items OR eating environment OR portion size) AND (sensor OR device OR technology)
- (chewing rate OR chewing frequency OR bite rate OR bite frequency OR swallowing rate OR swallowing frequency) AND (sensor OR device OR technology)
- (mealtime OR meal duration OR eating duration OR eating rate OR eating speed) AND (sensor OR device OR technology)
2.4. Inclusion and Exclusion Criteria
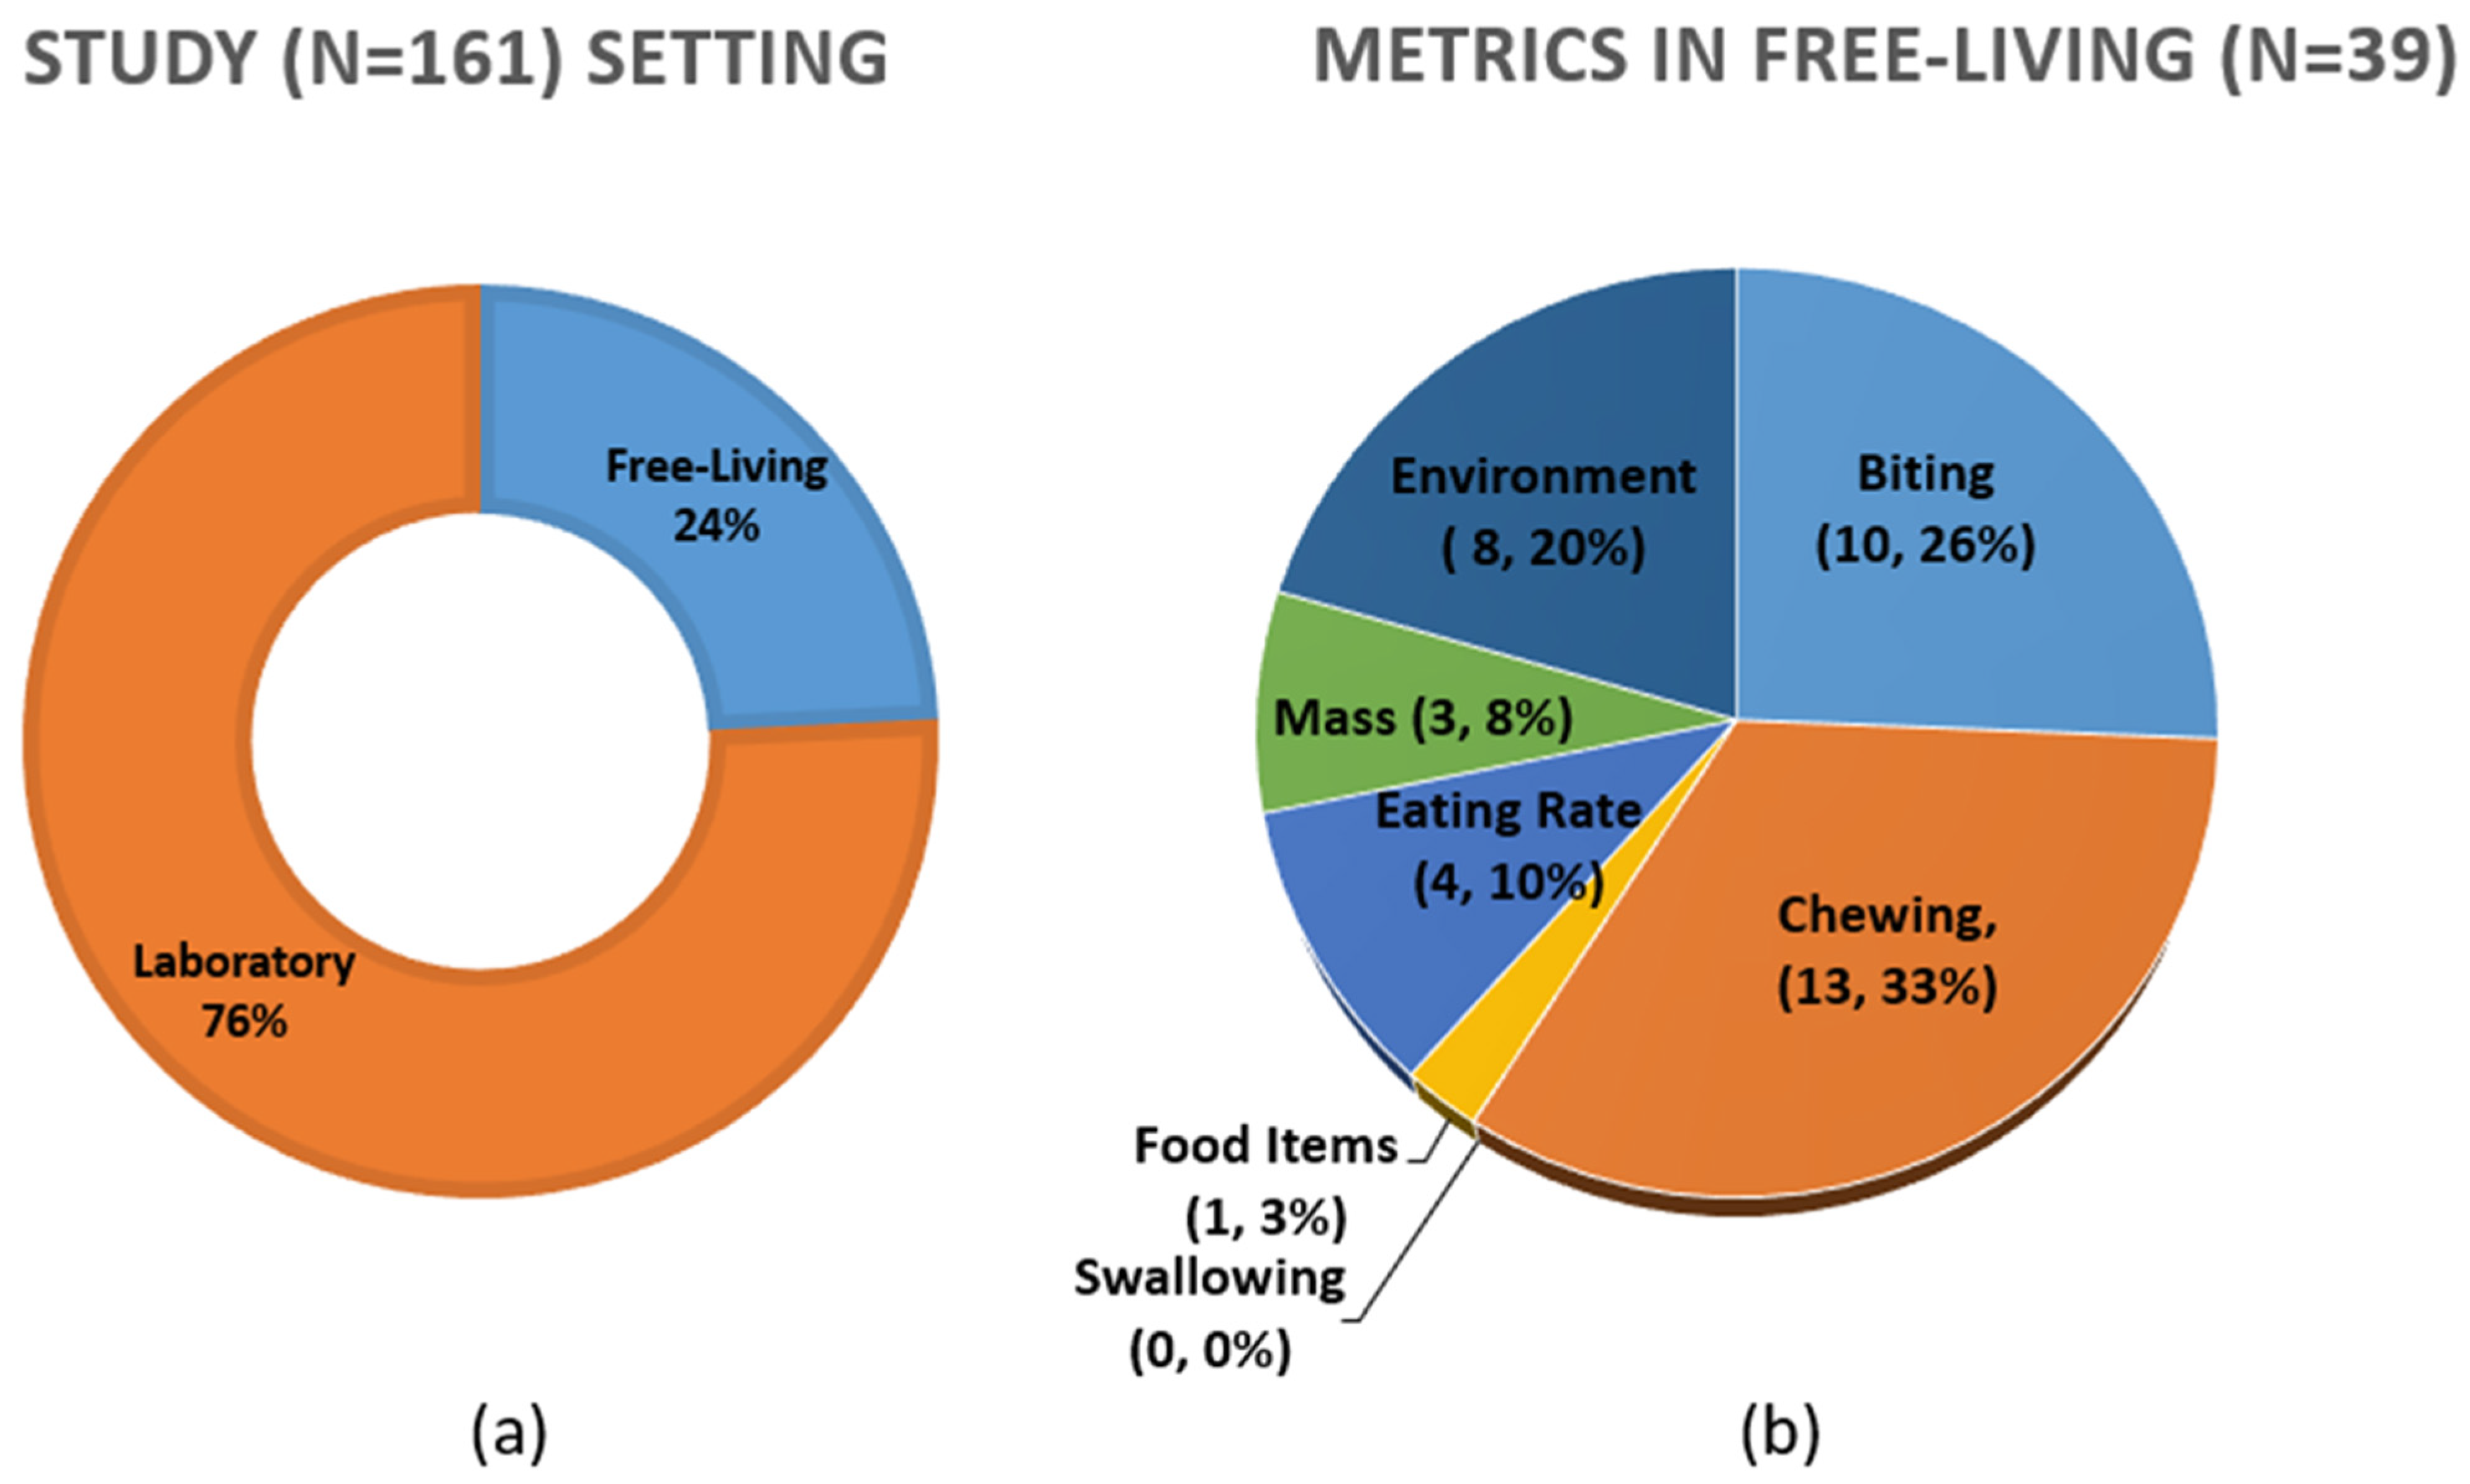
2.5. Results
3. Review Findings
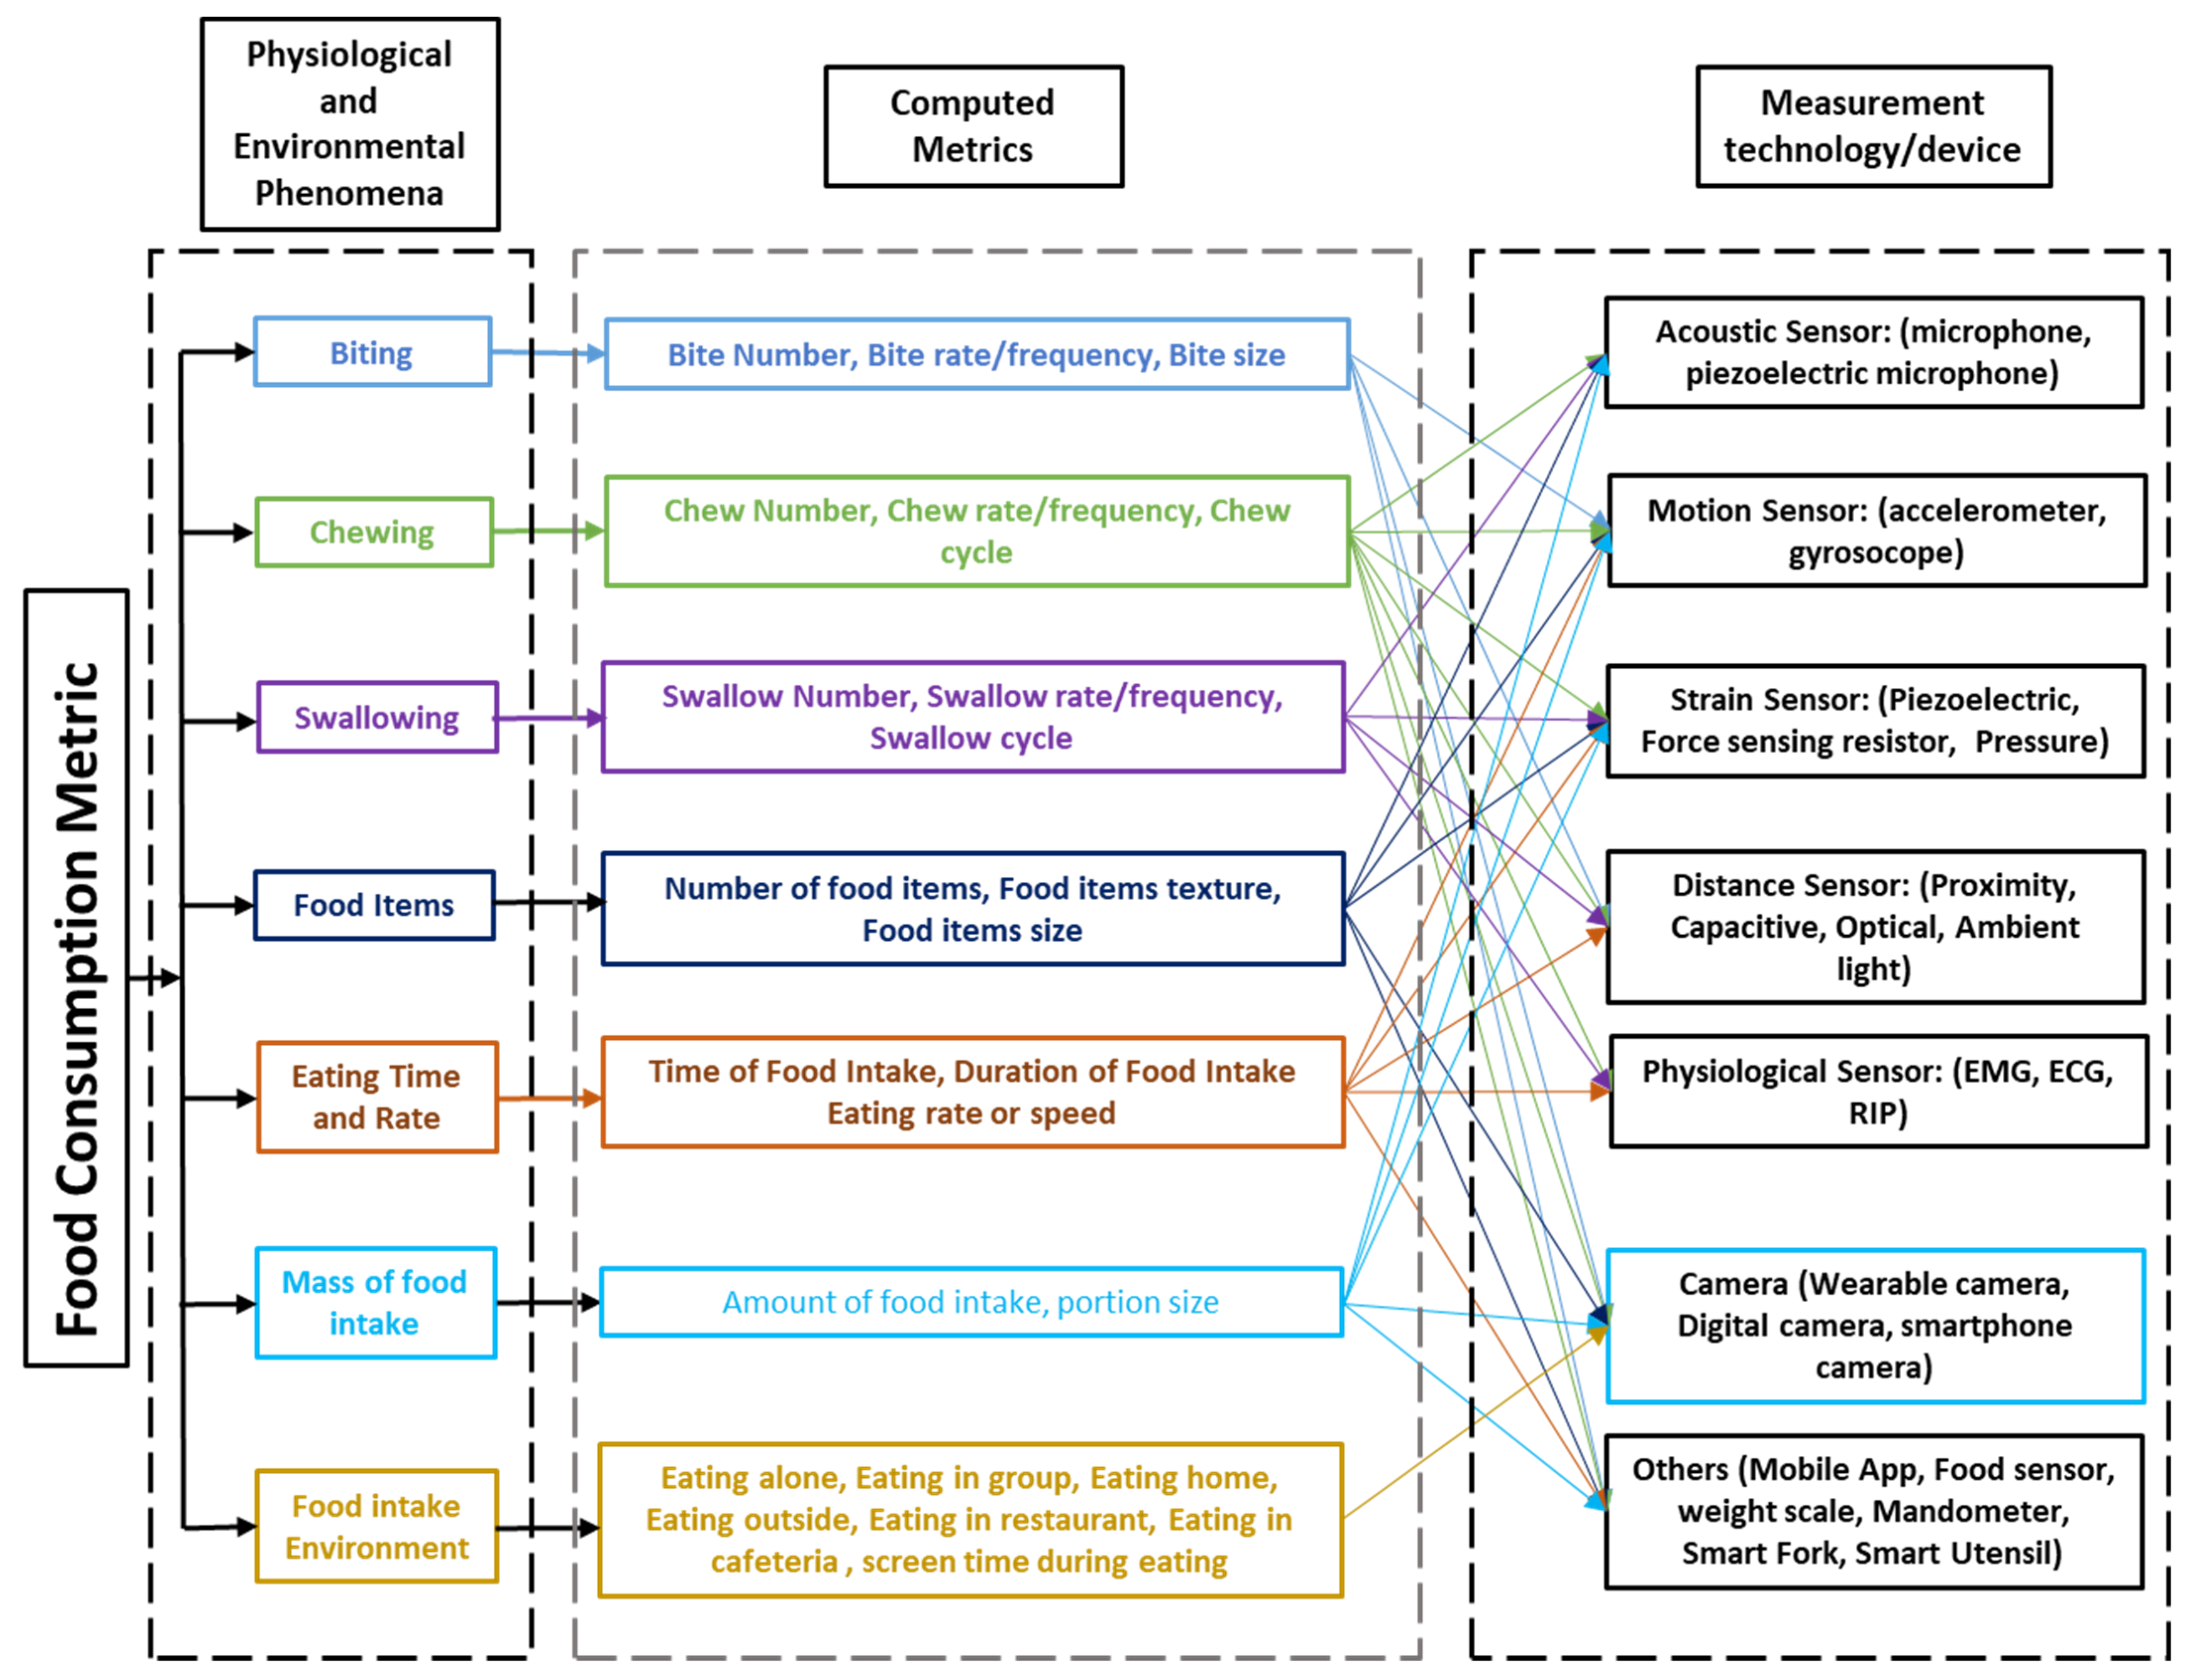
3.1. Taxonomy
3.2. Physiological/Environmental Phenomena and Computed Metrics
3.2.1. Metrics Related to Biting
3.2.2. Metrics Related to Chewing
3.2.3. Metrics Related to Swallowing
3.2.4. Metrics Related to Food Items
3.2.5. Metrics Related to Eating Time and Rate
3.2.6. Metrics Related to the Mass of Food Intake
3.2.7. Metrics Related to the Environment of Food Intake
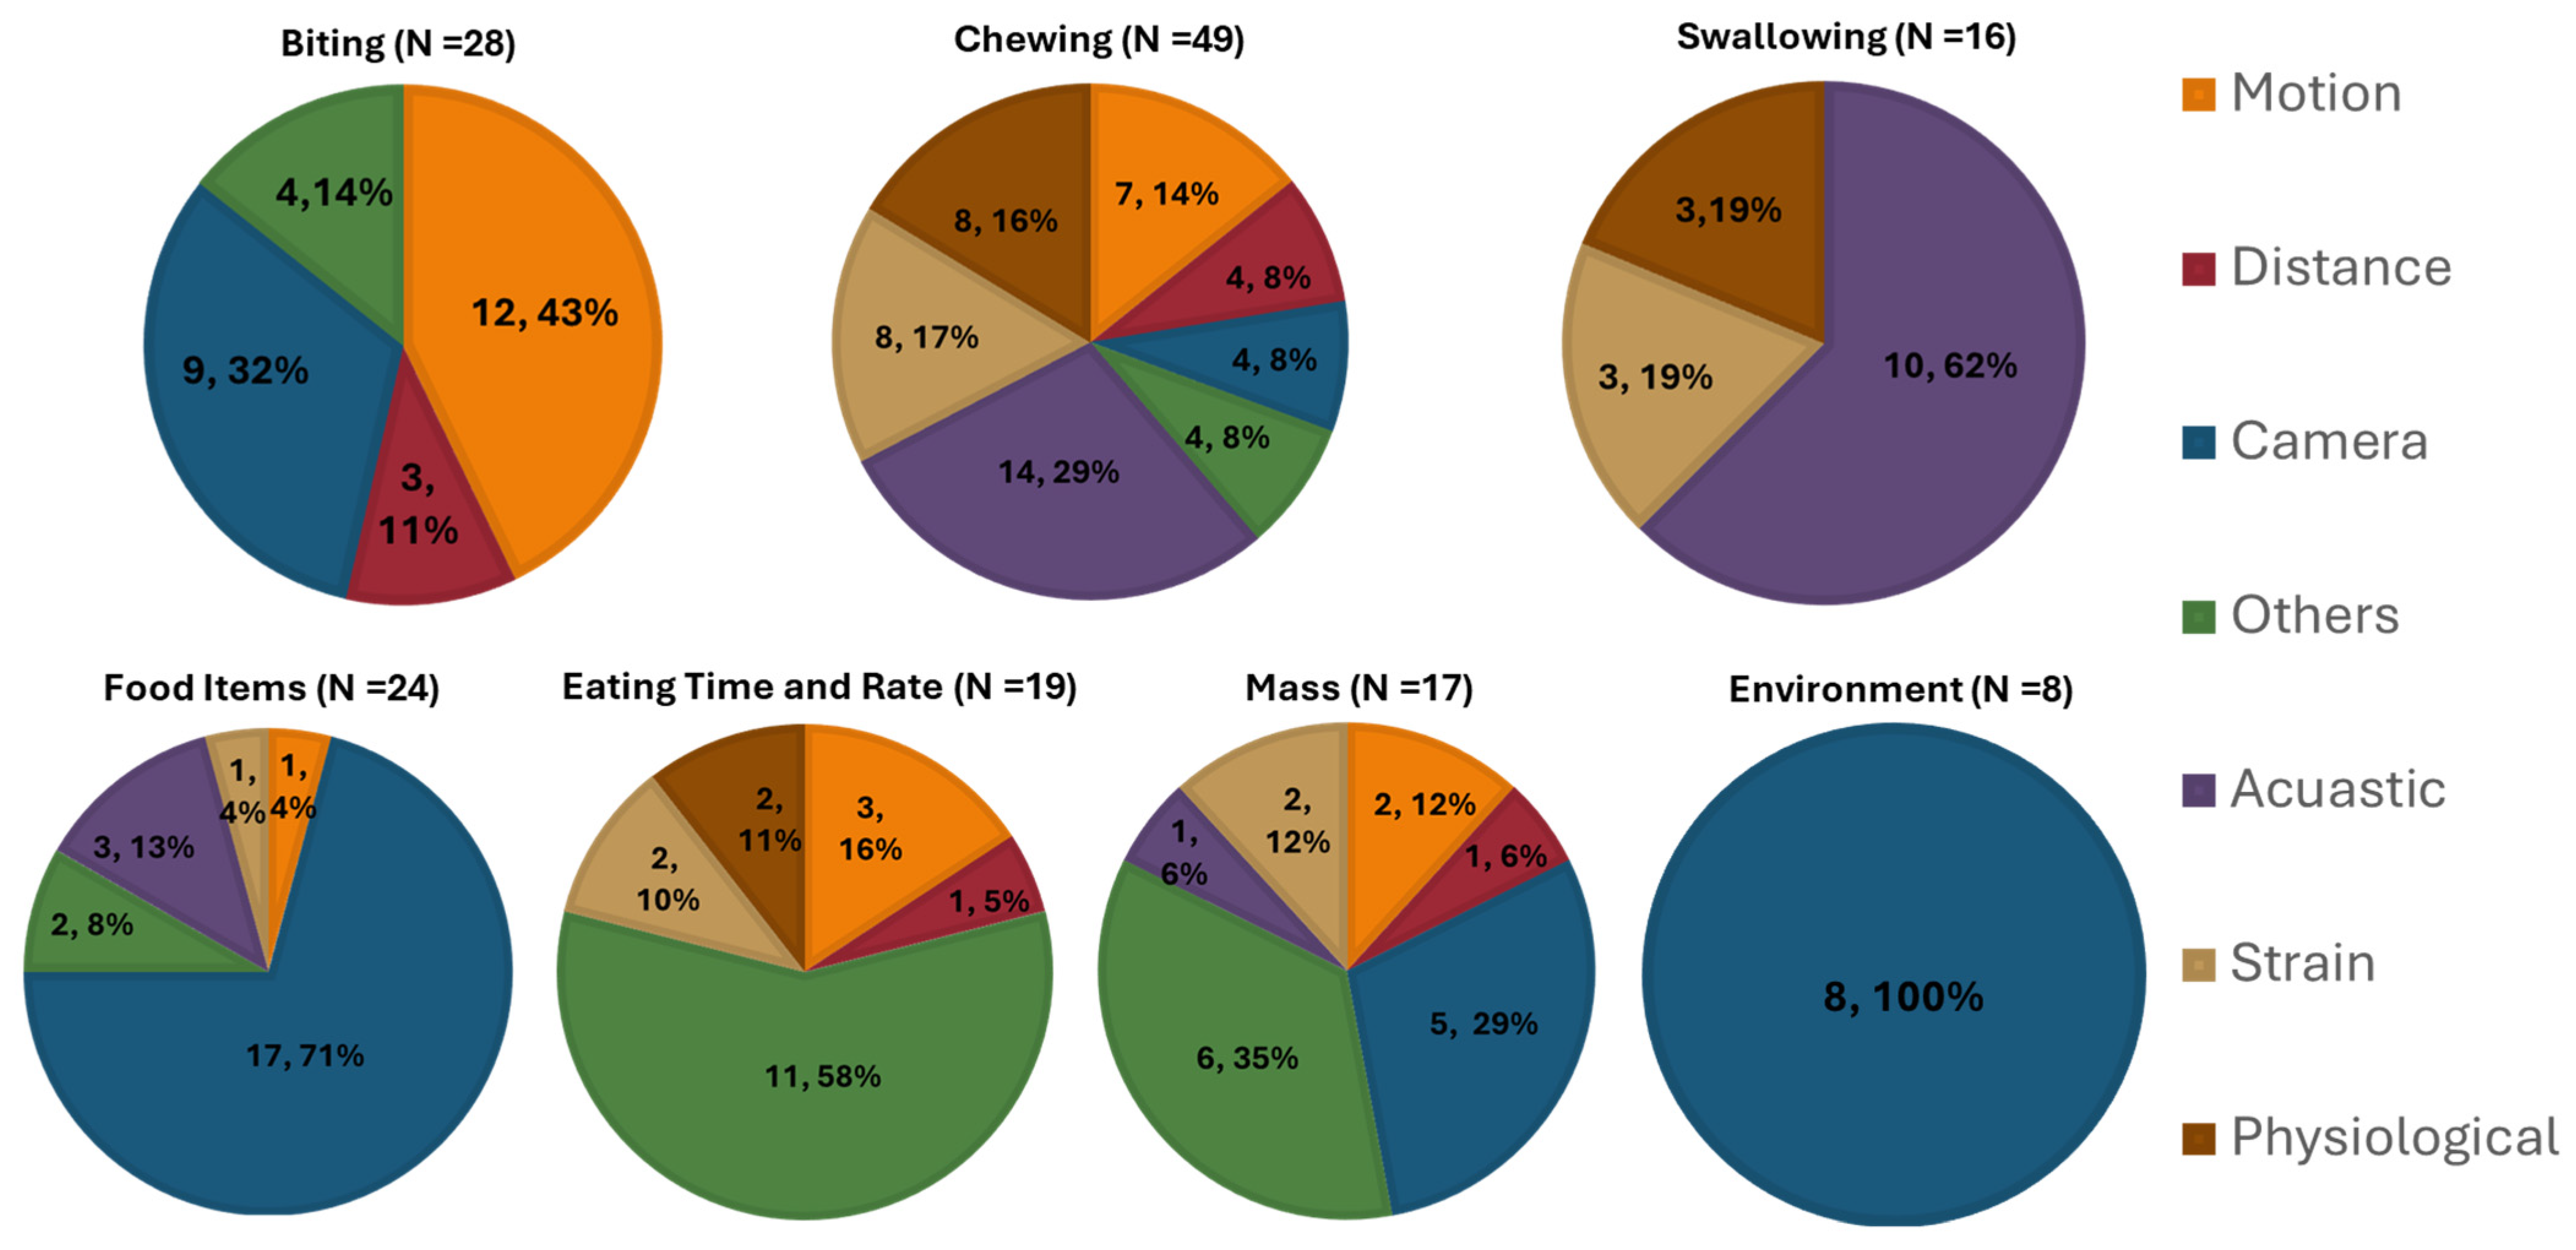
3.3. Measurement Devices/Sensors
3.3.1. Biting
Motion Sensors
Distance Sensors
Cameras
Others
3.3.2. Chewing
Acoustic Sensors
Motion Sensors
Strain Sensors
Distance Sensors
Physiological Sensors
Cameras
Others
3.3.3. Swallowing
Acoustic Sensors
Strain Sensors
Physiological Sensors
Distance Sensors
3.3.4. Food Item
Acoustic Sensors
Motion Sensors
Strain Sensors
Cameras
Others
3.3.5. Eating Time and Rate
Motion Sensors
Strain Sensors
Distance Sensors
Physiological Sensors
Others
3.3.6. Mass of Food Intake
Acoustic Sensors
Distance Sensor
Motion Sensors
Strain Sensors
Cameras
Others
3.3.7. Food Intake Environment
Cameras
4. Discussion
5. Challenges and Future Trends
6. Conclusions
Author Contributions
Funding
Institutional Review Board Statement
Informed Consent Statement
Data Availability Statement
Conflicts of Interest
Appendix A
Appendix A.1

| Article | Device | Sensor | Position | Participants | Lab | Free Living | Real Time | Performance |
|---|---|---|---|---|---|---|---|---|
| [90] | Motion | Accelerometer, gyroscope | Wrist | 22 | Yes | Yes | No | F1 Score = 0.923 |
| [38] | Motion | Orientation | Wrist | 10 | Yes | No | No | Sensitivity = 91% |
| [87] | Motion | Accelerometer Gyroscope | Wrist | 271 | Yes | Yes | No | Sensitivity = 75% |
| [88] | Motion | Accelerometer Gyroscope | Wrist | 276 | Yes | Yes | No | Accuracy = 79.7% |
| [44] | Motion | Gyroscope | Wrist | 99 | Yes | Yes | Yes | NA |
| [86] | Motion | Accelerometer Gyroscope | Wrist | 34 | Yes | Yes | No | False positive rate = 6.5% False Negative Rate = 3.3% |
| [84] | Motion | Accelerometer | Wrist | 1 | Yes | No | Yes | NA |
| [85] | Motion | Accelerometer Gyroscope | Wrist | 3 | Yes | Yes | No | Accuracy = 91.8% |
| [89] | Motion | Accelerometer Gyroscope | Wrist | 12 | Yes | F1 Score = 0.91 | ||
| [91] | Motion | Smartwatch | Wrist | 10 | Yes | No | No | Mean Absolute Error = 3.99 g per bite |
| [183] | Motion | Gyroscope | Wrist | 8 | Yes | No | No | Accuracy ≥ 90% |
| [39] | Motion | Tri-axial accelerometer | wrist | 15 | Yes | No | No | Accuracy = 81.2% |
| [92] | Distance | Magnetic proximity | Neck | 1 | Yes | No | No | NA |
| [184] | Distance | Capacitive Sensing | 3-D Printed Ice cream Cone | NA | Yes | No | Yes | NA |
| [93] | Distance | Ambient light | Neck | 20 | Yes | Yes | No | F1 Score = 77.1% |
| [95] | Camera | Depth Camera (Kinect Xbox One) | In front of the user | 1 | Yes | No | No | Sensitivity = 96.2% |
| [40] | Camera | SJ4000 Action Camera (Black) | 3 feet away from the user | 28 | Yes | No | No | Accuracy = 85.4% |
| [185] | Camera | Digital camcorder | 1.5 m away from the user | 85 | Yes | No | No | Recall = 91.7% |
| [94] | Camera | Digital Camcorder | 1.5 m away from the user | 85 | Yes | No | No | F1 Score = 0.948 |
| [96] | Camera | 360 Degree Camera | In front of the table | 4 | Yes | Yes | No | Error = 26.2% |
| [97] | Camera | Digital camera | Ceiling | 264 | Yes | No | No | F1 score = 0.899 |
| [99] | Camera | Digital camera | Ceiling | 264 | Yes | No | No | F1 score = 0.93 |
| [98] | Camera | Digital Camera | In front of the table | 18 | Yes | No | No | Accuracy = 79% |
| [37] | Camera | Fisheye camera | Shoulder | 16 | Yes | Yes | No | NA |
| [186] | Others | Electrical Conductivity of Foods | Food Item | 1 | Yes | No | No | NA |
| [100] | Others | Augmented Fork | Fork | 141 | Yes | Yes | Yes | NA |
| [101] | Others | Weight Sensors | Plate | 24 | Yes | Yes | No | Precision = 0.76 Recall = 0.76 |
| [187] | Others | Voltage Divider | Embedded Fork | 6 | Yes | Yes | No | Accuracy = 77% |
Appendix A.2
| Article | Device | Sensor | Position | Participants | Lab | Free Living | Real Time | Performance |
|---|---|---|---|---|---|---|---|---|
| [111] | Acoustic, Motion | Accelerometer, Gyroscope, Microphone | Earbud | 5 | Yes | No | No | Accuracy = 97% |
| [103] | Acoustic, Camera | Microphone, camera | Ear | 6 | Yes | Yes | No | Accuracy = 80% |
| [104] | Acoustic | Throat Microphone | Neck | 12 | Yes | No | No | Accuracy = 86.6% |
| [113] | Acoustic | Two-channel condenser microphone | Under ear | 18 | Yes | No | No | F score = 0.8 |
| [105] | Acoustic | Throat microphone | Neck | 12 | Yes | No | No | F score = 71.4% |
| [114] | Acoustic, Motion | 9 axis IMU, microphone | Wrist, Ear | 6 | Yes | Yes | No | Recall = 84% Precision = 67% |
| [108] | Acoustic | Throat Microphone | Neck | 8 | Yes | No | No | Accuracy = 0.783 |
| [102] | Acoustic | Microphone | Ear | NA | Yes | No | No | Error Rate = 1.93% |
| [147] | Acoustic | Ultrasonic Doppler Sensor | Neck | 10 | Yes | No | No | Accuracy = 91.4% |
| [10] | Acoustic | Microphone | Ear | 55 | Yes | No | No | Precision > 80 Recall > 80% |
| [106] | Acoustic | Bluetooth Headset | Ear | 28 | Yes | No | No | Accuracy = (77–94)% |
| [112] | Acoustic | Skin contact microphone | Neck | 14 | Yes | No | No | F score = 77.5% |
| [109] | Acoustic | Bone conduction microphone | Ear | 6 | Yes | No | Yes | Accuracy = 97.6% |
| [107] | Acoustic, Motion | Microphone, 9-axis IMU, 9 axis motion sensor | Ear, Wrist, Head | 6 | Yes | Yes | No | Accuracy = 85% |
| [110] | Acoustic | Bone conduction microphone | Ear | 9 | Yes | Yes | No | Accuracy = 97.1% |
| [115] | Acoustic | Microphone | Eyeglass | 5 | Yes | No | No | F score = 0.96 |
| [119] | Motion, physiological | Accelerometer, Orientation, Gyroscope, EMG | Wrist | 36 | Yes | No | No | F score = 0.92 |
| [188] | Motion, Strain | Accelerometer, Hand Gesture sensor, Piezoelectric strain | Wrist, Wrist, Below Ear | 12 | Yes | Yes | No | Accuracy = 89.8% |
| [118] | Motion | Single axis accelerometer | Temporalis Muscle | 4 | Yes | No | No | Accuracy = 97% F score = 93% |
| [116] | Motion | 3 axis accelerometer, 3 axis gyroscope, 3 axis magnetometer | Chin | 13 | Yes | No | No | NA |
| [120] | Motion | IMU | Ear | 8 | Yes | No | No | F score = 0.91 |
| [121] | Strain | Piezoelectric Strain | Below ear | 20 | Yes | No | No | Accuracy = 80.98% |
| [122] | Strain | Jaw motion sensor | Below ear | 12 | Yes | Yes | No | Accuracy = 86.86 ± 6.5% |
| [48] | Strain | Piezoelectric Strain Sensor | Below Ear | 30 | Yes | No | No | Error rate = 9.66% |
| [123] | Strain | Piezoelectric Strain Sensor | Below ear | 5 | Yes | No | No | Error rate = 8.09% |
| [49] | Strain | Piezoelectric Strain Sensor | Below Ear | 30 | Yes | Yes | No | Error rate = 15.01% |
| [124] | Motion, Strain | Accelerometer, Piezoelectric Strain | Eyeglass temple, below ear | 10 | Yes | No | No | F score = 99.85% |
| [125] | Motion, Strain | Accelerometer, hand gesture sensor, Piezoelectric Strain | Wrist, Wrist, Below Ear | 12 | Yes | Yes | No | Accuracy = 93% |
| [47] | Strain | Piezoelectric Strain | Temporalis Muscle | 10 | Yes | Yes | No | Error Rate = 3.83% |
| [126] | Physiological, Strain | EMG, piezo | Chin, Neck | 10 | Yes | No | No | Accuracy = 0.938 |
| [93] | Distance | Proximity | Neck | 20 | Yes | Yes | No | F1 Score = 77.1% |
| [50] | Motion, Distance | Accelerometer, Infrared Distance Sensor | Ear pinna | 22 | Yes | No | No | Precision = 85.3% Recall = 84.5% |
| [127] | Distance | Proximity Sensor | Necklace | 32 | Yes | Yes | No | Precision = 78.2&% Recall = 72.5% |
| [128] | Distance | Proximity Sensor | Right temple of eyeglass | 10 | Yes | No | No | Error rate = 2.69% |
| [129] | Distance | Proximity Sensor | Eyeglass | 20 | Yes | No | No | Accuracy = 96.4% |
| [130] | Physiological | EMG | Right and Left masseter, anterior temporalis muscle | 37 | Yes | No | No | NA |
| [52] | Physiological | EMG | Right and left masseter, Right and left temporalis muscle | 13 | Yes | No | No | NA |
| [131] | Physiological | Portable EMG | Center of masseter, mastoid | 28 | Yes | No | No | NA |
| [132] | Physiological | EMG | Eyeglass | 8 | Yes | No | No | Precision = 80% |
| [65] | Acoustic, Physiological | Microphone, photoplethysmography (PPG) | Ear | 22 | Yes | Yes | No | Accuracy = 0.938 |
| [135] | Physiological | EMG | Between the mastoid and the masseter muscle | 15 | Yes | Yes | No | Sensitivity > 90% |
| [133] | Physiological | EMG | Eyeglass | 10 | Yes | Yes | No | Precision > 77% |
| [136] | Physiological | Myoelectric sensor | Masseter muscle | 8 | Yes | No | Yes | NA |
| [51] | Camera | Digital camera | In front of user | 6 | Yes | No | No | NA |
| [40] | Camera | SJ4000 Action Camera (Black) | 3 feet away from user | 28 | Yes | No | No | Accuracy = 88.9% |
| [137] | Camera | Digital camera | In front of the user | 37 | Yes | No | No | NA |
| [138] | Camera | Smartphone camera | In front of the user | 100 | Yes | No | No | Error Rate = 7% |
| [174] | Camera | video camera | Dining tray | NA | Yes | No | No | NA |
| [139] | Others | EMG, Piezoelectric Strain Sensor, Piezoresistive Sensor, Pressure Sensor | Right temporalis muscle, left temporalis muscle, eyeglass, ear canal | 15 | Yes | No | No | NA |
Appendix A.3
| Article | Device | Sensor | Position | Participants | Lab | Free Living | Real Time | Performance |
|---|---|---|---|---|---|---|---|---|
| [140] | Acoustic | Throat microphone | Throat | 21 | Yes | No | No | NA |
| [12] | Acoustic | Throat microphone | Throat | 20 | Yes | No | No | Accuracy = 84.7% |
| [141] | Acoustic | Throat and Ambient Microphone | Throat | 7 | Yes | No | No | Recall > 85% |
| [142] | Acoustic | Throat Microphone | Throat | 7 | Yes | No | No | Accuracy > 94% |
| [143] | Acoustic | Microphone | Neck | 85 | Yes | No | Yes | Accuracy > 79.3% |
| [104] | Acoustic | High fidelity microphone | Neck | 12 | Yes | No | Yes | Accuracy = 86.6% |
| [147] | Acoustic | Ultrasonic Doppler Sensor | Neck | 10 | Yes | No | No | Accuracy = 78.4% |
| [108] | Acoustic | Throat Microphone | Neck | 8 | Yes | No | No | Accuracy = 0.712 |
| [110] | Acoustic | Bone conduction microphone | Neck | 9 | Yes | No | Yes | Accuracy = 97.1% |
| [109] | Acoustic | Bone conduction microphone | Ear | 6 | Yes | No | Yes | Accuracy = 97.6% |
| [144] | Strain | Piezoelectric Sensor | Lower Trachea | 20 | Yes | No | Yes | F score = 80% |
| [189] | Strain | Piezoelectric Sensor | Lower Trachea | 20 | Yes | No | Yes | F score = 91.2% |
| [55] | Strain | Piezoelectric Sensor, IMU | Neck | 10 | Yes | No | No | F score = 76.07% |
| [145] | Physiological | Piezo-respiratory belt | Chest | 3 | Yes | No | No | Accuracy = 80% |
| [146] | Physiological | Respiratory Inductance Plethysmography (RIP) belt | Chest and Abdomen | 6 | Yes | No | No | Precision = 80% |
| [46] | Physiological | EMG | Masseter muscle | 16 | Yes | No | No | F1 score = 0.87 |
Appendix A.4
| Article | Device | Sensor | Position | Participants | Lab | Free Living | Real Time | Performance |
|---|---|---|---|---|---|---|---|---|
| [104] | Acoustic | High fidelity microphone | Neck | 12 | Yes | No | Yes | Accuracy = 84.9% |
| [144] | Strain | Piezoelectric Sensor | Lower Trachea | 20 | Yes | No | Yes | Precision = 80% |
| [148] | Acoustic | Lavalier microphone (MAONO) | Shirt collar | 10 | Yes | No | No | F score = 97.2% |
| [149] | Acoustic | Microphone | Over Ear | 16 | Yes | Yes | No | F score = 97.44% |
| [71] | Motion | Internal and external microphone, 9-axis IMU in the wrist, 9-axis IMU in head | Ear, Wrist, Head | 6 | Yes | No | No | Accuracy = 82.7% |
| [190] | Camera | Digital camera | On top of table | NA | Yes | No | No | NA |
| [58] | Camera | Digital camera | On top of table | NA | Yes | No | No | NA |
| [150] | Camera | Cellular phone camera | Smartphone | NA | Yes | No | No | Accuracy = 61.34% |
| [176] | Camera | Digital camera | Ceiling | NA | Yes | No | No | NA |
| [57] | Camera | Smartphone camera | Smartphone | NA | Yes | No | Yes | Accuracy = 81.55% |
| [18] | Camera | Smartphone camera | Smartphone | NA | Yes | No | No | Accuracy = 92.1% |
| [151] | Camera | Smartphone camera | Smartphone | NA | Yes | No | No | NA |
| [152] | Camera | Slight tilt in front of user | Smartphone | 5 | Yes | No | Yes | Classification rate = 74.8% |
| [153] | Camera | Smartphone camera | Smartphone | NA | Yes | No | Yes | Accuracy = 88.5% |
| [154] | Camera | Thermal Camera | Smartphone | NA | Yes | No | No | Accuracy = 88.93% |
| [155] | Camera | Color, Thermal Cameras | Wrist | NA | Yes | No | No | NA |
| [156] | Camera | Camera | Smartphone | NA | Yes | No | No | Accuracy = 95% |
| [157] | Camera | Smartphone camera | Smartphone | NA | Yes | No | No | NA |
| [158] | Camera | Smartphone camera | Smartphone | NA | Yes | No | No | NA |
| [60] | Camera | Smartphone camera | Smartphone | NA | Yes | No | No | Accuracy = 82% |
| [59] | Camera | Smartphone camera | Smartphone | NA | Yes | No | No | Accuracy = 87.3% |
| [159] | Camera | Smartphone camera | Smartphone | NA | Yes | No | No | NA |
| [160] | Others | Ion selective pH, conductivity | Cup | NA | Yes | No | No | Accuracy = 79% |
| [73] | Others | Ultrasonic, RGB color, Temperature | Bottle | NA | Yes | No | No | Accuracy = (74.93–94.98%) |
Appendix A.5
| Article | Device | Sensor | Position | Participants | Lab | Free Living | Real Time | Measured Metric |
|---|---|---|---|---|---|---|---|---|
| [84] | Motion | Accelerometer | Wrist | 1 | Yes | No | Yes | Eating speed |
| [126] | Strain | Piezoelectric | Neck | 10 | Yes | No | Yes | Eating speed |
| [155] | Physiological | EMG | Wrist | 17 | Yes | Yes | No | Eating speed |
| [66] | Motion | Accelerometer, IMU | Wrist | NA | Yes | No | Yes | Eating speed |
| [161] | Motion | IMU | Wrist | 36 | Yes | No | No | Eating Speed |
| [65] | Strain | Piezoelectric Strain | Temporalis Muscle | 12 | Yes | No | No | No. of meals, meal duration, Duration of actual ingestion |
| [67] | Distance | Optical Sensor | Ear | 11 | Yes | Yes | No | Mealtime |
| [162] | Physiological | Two Respiratory Inductance Plethysmography (RIP) belts | Chest and abdomen | 14 | Yes | No | No | Mealtime, duration |
| [64] | Others | Universal Eating Monitor | Table | 60 | Yes | Yes | No | Eating rate |
| [63] | Others | Weight Scale | Table | 35 | Yes | No | No | Eating rate |
| [42] | Others | Sussex Ingestion Pattern Monitor | Table | 35 | Yes | No | No | Eating rate, bite size, meal duration |
| [163] | Others | Smart Fork | Fork | 11 | Yes | Yes | Yes | Eating speed |
| [164] | Others | Glucose sensor | Artificial pancreas | 30 | Yes | No | No | Meal-size |
| [165] | Others | Smart Fork | Fork | 128 | Yes | No | No | Eating rate |
| [191] | Others | Smart utensil | Utensil | NA | Yes | No | No | Eating rate |
| [166] | Others | Pressure Sensor | Sheet | 2 | Yes | No | No | Mealtime, pace, duration |
| [74] | Others | Smart utensil | Utensil | 10 | Yes | No | No | Eating rate |
Appendix A.6
| Article | Device | Sensor | Position | Participants | Lab | Free Living | Real Time | Performance |
|---|---|---|---|---|---|---|---|---|
| [71] | Acoustic | Internal and external microphone, 9-axis IMU in wrist, 9-axis IMU in head | Ear, Wrist, Head | 6 | Yes | No | No | Error = 35.4% |
| [73] | Motion | Accelerometer | Bottle | NA | Yes | No | No | Error = 13.36% |
| [167] | Distance | Time of Flight (ToF) | Eyeglass | NA | Yes | No | No | NA |
| [168] | Motion | Gyroscope, Accelerometer | Wrist | 41 | Yes | Yes | No | Accuracy = 59.2% |
| [170] | Strain | Force sensing resistor | Tray | 10 | Yes | Yes | No | NA |
| [192] | Strain | Piezoelectric Strain | Temporalis Muscle | 18 | Yes | Yes | No | NA |
| [61] | Camera | Smartphone camera | Smartphone | NA | Yes | No | No | NA |
| [171] | Camera | Smartphone camera | Smartphone | NA | Yes | No | No | Error = 3.73% |
| [172] | Others | Electronic Balance | Table | 26 | Yes | No | No | NA |
| [76] | Others | Electronic Balance | Table | 39 | Yes | No | No | NA |
| [75] | Others | Mandometer | Table | 77 | Yes | No | No | Accuracy = 0.69% |
| [173] | Others | Weight scale | Table | 72 | Yes | No | No | NA |
| [175] | Others | Weight scale | Table | 84 | Yes | No | No | NA |
| [174] | Others | Weight scale | Tray | NA | Yes | No | No | NA |
References
- Neuhouser, M.L. The importance of healthy dietary patterns in chronic disease prevention. Nutr. Res. 2019, 70, 3–6. [Google Scholar] [CrossRef] [PubMed]
- Jannasch, F.; Kröger, J.; Schulze, M.B. Dietary Patterns and Type 2 Diabetes: A Systematic Literature Review and Meta-Analysis of Prospective Studies12. J. Nutr. 2017, 147, 1174–1182. [Google Scholar] [CrossRef] [PubMed]
- Tourlouki, E.; Matalas, A.-L.; Panagiotakos, D.B. Dietary habits and cardiovascular disease risk in middle-aged and elderly populations: A review of evidence. Clin. Interv. Aging 2009, 4, 319–330. [Google Scholar] [CrossRef] [PubMed]
- Thompson, F.E.; Subar, A.F.; Loria, C.M.; Reedy, J.L.; Baranowski, T. Need for Technological Innovation in Dietary Assessment. J. Am. Diet. Assoc. 2010, 110, 48–51. [Google Scholar] [CrossRef]
- Shim, J.-S.; Oh, K.; Kim, H.C. Dietary assessment methods in epidemiologic studies. Epidemiol. Health 2014, 36, e2014009. [Google Scholar] [CrossRef]
- Magarey, A.; Watson, J.; Golley, R.K.; Burrows, T.; Sutherland, R.; McNaughton, S.A.; Denney-Wilson, E.; Campbell, K.; Collins, C. Assessing dietary intake in children and adolescents: Considerations and recommendations for obesity research. Int. J. Pediatr. Obes. 2011, 6, 2–11. [Google Scholar] [CrossRef]
- Livingstone, M.B.E.; Robson, P.J.; Wallace, J.M.W. Issues in dietary intake assessment of children and adolescents. Br. J. Nutr. 2004, 92, S213–S222. [Google Scholar] [CrossRef]
- Schoeller, D.A. Limitations in the assessment of dietary energy intake by self-report. Metabolism 1995, 44, 18–22. [Google Scholar] [CrossRef]
- Paßler, S.; Fischer, W.-J. Food Intake Activity Detection Using a Wearable Microphone System. In Proceedings of the 2011 Seventh International Conference on Intelligent Environments, Nottingham, UK, 25–28 July 2011; pp. 298–301. [Google Scholar] [CrossRef]
- Päßler, S.; Fischer, W. Food Intake Monitoring: Automated Chew Event Detection in Chewing Sounds. IEEE J. Biomed. Health Inform. 2014, 18, 278–289. [Google Scholar] [CrossRef]
- Sazonov, E.; Schuckers, S.; Lopez-Meyer, P.; Makeyev, O.; Sazonova, N.; Melanson, E.L.; Neuman, M. Non-invasive monitoring of chewing and swallowing for objective quantification of ingestive behavior. Physiol. Meas. 2008, 29, 525–541. [Google Scholar] [CrossRef]
- Sazonov, E.S.; Makeyev, O.; Schuckers, S.; Lopez-Meyer, P.; Melanson, E.L.; Neuman, M.R. Automatic Detection of Swallowing Events by Acoustical Means for Applications of Monitoring of Ingestive Behavior. IEEE Trans. Biomed. Eng. 2010, 57, 626–633. [Google Scholar] [CrossRef] [PubMed]
- Lopez-Meyer, P.; Makeyev, O.; Schuckers, S.; Melanson, E.L.; Neuman, M.R.; Sazonov, E. Detection of Food Intake from Swallowing Sequences by Supervised and Unsupervised Methods. Ann. Biomed. Eng. 2010, 38, 2766–2774. [Google Scholar] [CrossRef] [PubMed]
- Amft, O.; Troster, G. On-Body Sensing Solutions for Automatic Dietary Monitoring. IEEE Pervasive Comput. 2009, 8, 62–70. [Google Scholar] [CrossRef]
- Dong, Y.; Scisco, J.; Wilson, M.; Muth, E.; Hoover, A. Detecting Periods of Eating During Free-Living by Tracking Wrist Motion. IEEE J. Biomed. Health Inform. 2014, 18, 1253–1260. [Google Scholar] [CrossRef]
- Salley, J.N.; Hoover, A.W.; Wilson, M.L.; Muth, E.R. Comparison between Human and Bite-Based Methods of Estimating Caloric Intake. J. Acad. Nutr. Diet. 2016, 116, 1568–1577. [Google Scholar] [CrossRef]
- Martin, C.K.; Kaya, S.; Gunturk, B.K. Quantification of food intake using food image analysis. In Proceedings of the 2009 Annual International Conference of the IEEE Engineering in Medicine and Biology Society, Minneapolis, MN, USA, 3–6 September 2009; pp. 6869–6872. [Google Scholar] [CrossRef]
- Pouladzadeh, P.; Shirmohammadi, S.; Al-Maghrabi, R. Measuring Calorie and Nutrition From Food Image. IEEE Trans. Instrum. Meas. 2014, 63, 1947–1956. [Google Scholar] [CrossRef]
- Zhu, F.; Bosch, M.; Khanna, N.; Boushey, C.J.; Delp, E.J. Multiple Hypotheses Image Segmentation and Classification With Application to Dietary Assessment. IEEE J. Biomed. Health Inform. 2015, 19, 377–388. [Google Scholar] [CrossRef] [PubMed]
- Kong, F.; Tan, J. DietCam: Automatic dietary assessment with mobile camera phones. Pervasive Mob. Comput. 2012, 8, 147–163. [Google Scholar] [CrossRef]
- Martin, C.K.; Correa, J.B.; Han, H.; Allen, H.R.; Rood, J.C.; Champagne, C.M.; Gunturk, B.K.; Bray, G.A. Validity of the Remote Food Photography Method (RFPM) for Estimating Energy and Nutrient Intake in Near Real-Time. Obesity 2012, 20, 891–899. [Google Scholar] [CrossRef]
- Deng, Y.; Qin, S.; Wu, Y. An automatic food recognition algorithm with both shape and texture information. In PIAGENG 2009: Image Processing and Photonics for Agricultural Engineering; SPIE: Nuremberg, Germany, 2009; pp. 33–40. [Google Scholar] [CrossRef]
- Meyers, A.; Johnston, N.; Rathod, V.; Korattikara, A.; Gorban, A.; Silberman, N.; Guadarrama, S.; Papandreou, G.; Huang, J.; Murphy, K.P. Im2Calories: Towards an Automated Mobile Vision Food Diary. In Proceedings of the IEEE International Conference on Computer Vision, 2015; pp. 1233–1241. Available online: https://openaccess.thecvf.com/content_iccv_2015/html/Meyers_Im2Calories_Towards_an_ICCV_2015_paper.html (accessed on 21 March 2022).
- He, S.; Li, S.; Nag, A.; Feng, S.; Han, T.; Mukhopadhyay, S.C.; Powel, W. A comprehensive review of the use of sensors for food intake detection. Sens. Actuators Phys. 2020, 315, 112318. [Google Scholar] [CrossRef]
- Vu, T.; Lin, F.; Alshurafa, N.; Xu, W. Wearable Food Intake Monitoring Technologies: A Comprehensive Review. Computers 2017, 6, 4. [Google Scholar] [CrossRef]
- Hassannejad, H.; Matrella, G.; Ciampolini, P.; De Munari, I.; Mordonini, M.; Cagnoni, S. Automatic diet monitoring: A review of computer vision and wearable sensor-based methods. Int. J. Food Sci. Nutr. 2017, 68, 656–670. [Google Scholar] [CrossRef] [PubMed]
- Bell, B.M.; Alam, R.; Alshurafa, N.; Thomaz, E.; Mondol, A.S.; de la Haye, K.; Stankovic, J.A.; Lach, J.; Spruijt-Metz, D. Automatic, wearable-based, in-field eating detection approaches for public health research: A scoping review. Npj Digit. Med. 2020, 3, 38. [Google Scholar] [CrossRef]
- Schoeller, D.A.; Westerterp, M. Advances in the Assessment of Dietary Intake; CRC Press: Boca Raton, FL, USA, 2017. [Google Scholar]
- Doulah, A.; Mccrory, M.A.; Higgins, J.A.; Sazonov, E. A Systematic Review of Technology-Driven Methodologies for Estimation of Energy Intake. IEEE Access 2019, 7, 49653–49668. [Google Scholar] [CrossRef]
- Herrera, M.C.A.; Chan, C.B. Narrative Review of New Methods for Assessing Food and Energy Intake. Nutrients 2018, 10, 1064. [Google Scholar] [CrossRef]
- Raju, V.B.; Sazonov, E. A Systematic Review of Sensor-Based Methodologies for Food Portion Size Estimation. IEEE Sens. J. 2021, 21, 12882–12899. [Google Scholar] [CrossRef]
- Tufano, M.; Lasschuijt, M.; Chauhan, A.; Feskens, E.J.M.; Camps, G. Capturing Eating Behavior from Video Analysis: A Systematic Review. Nutrients 2022, 14, 4847. [Google Scholar] [CrossRef]
- Hiraguchi, H.; Perone, P.; Toet, A.; Camps, G.; Brouwer, A.-M. Technology to Automatically Record Eating Behavior in Real Life: A Systematic Review. Sensors 2023, 23, 7757. [Google Scholar] [CrossRef] [PubMed]
- Page, M.J.; McKenzie, J.E.; Bossuyt, P.M.; Boutron, I.; Hoffmann, T.C.; Mulrow, C.D.; Shamseer, L.; Tetzlaff, J.M.; Akl, E.A.; Brennan, S.E.; et al. The PRISMA 2020 statement: An updated guideline for reporting systematic reviews. BMJ 2021, 372, n71. [Google Scholar] [CrossRef]
- Haddaway, N.R.; Page, M.J.; Pritchard, C.C.; McGuinness, L.A. PRISMA2020: An R package and Shiny app for producing PRISMA 2020-compliant flow diagrams, with interactivity for optimised digital transparency and Open Synthesis. Campbell Syst. Rev. 2022, 18, e1230. [Google Scholar] [CrossRef]
- Weathers, D.; Siemens, J.C.; Kopp, S.W. Tracking food intake as bites: Effects on cognitive resources, eating enjoyment, and self-control. Appetite 2017, 111, 23–31. [Google Scholar] [CrossRef]
- Alshurafa, N.; Zhang, S.; Romano, C.; Zhang, H.; Pfammatter, A.F.; Lin, A.W. Association of number of bites and eating speed with energy intake: Wearable technology results under free-living conditions. Appetite 2021, 167, 105653. [Google Scholar] [CrossRef] [PubMed]
- Dong, Y.; Hoover, A.; Muth, E. A Device for Detecting and Counting Bites of Food Taken by a Person during Eating. In Proceedings of the 2009 IEEE International Conference on Bioinformatics and Biomedicine, Washington, DC, USA, 1–4 November 2009; pp. 265–268. [Google Scholar] [CrossRef]
- Desendorf, J.; Bassett, D.R.J.; Raynor, H.A.; Coe, D.P. Validity of the Bite Counter device in a controlled laboratory setting. Eat. Behav. 2014, 15, 502–504. [Google Scholar] [CrossRef]
- Hossain, D.; Ghosh, T.; Sazonov, E. Automatic Count of Bites and Chews From Videos of Eating Episodes. IEEE Access 2020, 8, 101934–101945. [Google Scholar] [CrossRef] [PubMed]
- Scisco, J.L.; Muth, E.R.; Dong, Y.; Hoover, A.W. Slowing bite-rate reduces energy intake: An application of the bite counter device. J. Am. Diet. Assoc. 2011, 111, 1231–1235. [Google Scholar] [CrossRef]
- Almiron-Roig, E.; Tsiountsioura, M.; Lewis, H.B.; Wu, J.; Solis-Trapala, I.; Jebb, S.A. Large portion sizes increase bite size and eating rate in overweight women. Physiol. Behav. 2015, 139, 297–302. [Google Scholar] [CrossRef] [PubMed]
- Beatty, J.A.; Greene, G.W.; Blissmer, B.J.; Delmonico, M.J.; Melanson, K.J. Effects of a novel bites, steps and eating rate-focused weight loss randomised controlled trial intervention on body weight and eating behaviours. J. Hum. Nutr. Diet. Off. J. Br. Diet. Assoc. 2020, 33, 330–341. [Google Scholar] [CrossRef]
- Jasper, P.; James, M.T.; Hoover, A.; Muth, E.R. Effects of Bite Count Feedback from a Wearable Device and Goal Setting on Consumption in Young Adults. J. Acad. Nutr. Diet. 2016, 116, 1785–1793. [Google Scholar] [CrossRef]
- Sari, K.I.; Rafisa, A. Chewing and Swallowing Patterns for Different Food Textures in Healthy Subjects. Int. J. Dent. 2023, 2023, e6709350. [Google Scholar] [CrossRef]
- Nicholls, B.; Ang, C.S.; Kanjo, E.; Siriaraya, P.; Mirzaee Bafti, S.; Yeo, W.-H.; Tsanas, A. An EMG-based Eating Behaviour Monitoring system with haptic feedback to promote mindful eating. Comput. Biol. Med. 2022, 149, 106068. [Google Scholar] [CrossRef]
- Farooq, M.; Sazonov, E. Segmentation and Characterization of Chewing Bouts by Monitoring Temporalis Muscle Using Smart Glasses With Piezoelectric Sensor. IEEE J. Biomed. Health Inform. 2017, 21, 1495–1503. [Google Scholar] [CrossRef] [PubMed]
- Farooq, M.; Sazonov, E. Linear regression models for chew count estimation from piezoelectric sensor signals. In Proceedings of the International Conference on Sensing Technology, ICST, Nanjing, China, 11–13 November 2016. [Google Scholar] [CrossRef]
- Farooq, M.; Sazonov, E. Automatic Measurement of Chew Count and Chewing Rate during Food Intake. Electronics 2016, 5, 62. [Google Scholar] [CrossRef]
- Hori, K.; Uehara, F.; Yamaga, Y.; Yoshimura, S.; Okawa, J.; Tanimura, M.; Ono, T. Reliability of a novel wearable device to measure chewing frequency. J. Prosthodont. Res. 2021, 65, 340–345. [Google Scholar] [CrossRef]
- Ioakimidis, I.; Zandian, M.; Eriksson-Marklund, L.; Bergh, C.; Grigoriadis, A.; Södersten, P. Description of chewing and food intake over the course of a meal. Physiol. Behav. 2011, 104, 761–769. [Google Scholar] [CrossRef]
- Smit, H.J.; Kemsley, E.K.; Tapp, H.S.; Henry, C.J.K. Does prolonged chewing reduce food intake? Fletcherism revisited. Appetite 2011, 57, 295–298. [Google Scholar] [CrossRef]
- Okada, A.; Honma, M.; Nomura, S.; Yamada, Y. Oral behavior from food intake until terminal swallow. Physiol. Behav. 2007, 90, 172–179. [Google Scholar] [CrossRef] [PubMed]
- Cheng, J.; Zhou, B.; Kunze, K.; Rheinländer, C.C.; Wille, S.; Wehn, N.; Weppner, J.; Lukowicz, P. Activity Recognition and Nutrition Monitoring in Every Day Situations with a Textile Capacitive Neckband. In Proceedings of the 2013 ACM Conference on Pervasive and Ubiquitous Computing Adjunct Publication, in UbiComp’13 Adjunct, Zurich, Switzerland, 8–12 September 2013; Association for Computing Machinery: New York, NY, USA, 2013; pp. 155–158. [Google Scholar] [CrossRef]
- Nguyen, D.T.; Cohen, E.; Pourhomayoun, M.; Alshurafa, N. SwallowNet: Recurrent neural network detects and characterizes eating patterns. In Proceedings of the 2017 IEEE International Conference on Pervasive Computing and Communications Workshops (PerCom Workshops), Kona, HI, USA, 13–17 March 2017; pp. 401–406. [Google Scholar] [CrossRef]
- Makeyev, O.; Lopez-Meyer, P.; Schuckers, S.; Besio, W.; Sazonov, E. Automatic food intake detection based on swallowing sounds. Biomed. Signal Process. Control 2012, 7, 649–656. [Google Scholar] [CrossRef] [PubMed]
- Kawano, Y.; Yanai, K. Real-Time Mobile Food Recognition System. In Proceedings of the 2013 IEEE Conference on Computer Vision and Pattern Recognition Workshops, Portland, OR, USA, 23–28 June 2013; pp. 1–7. [Google Scholar] [CrossRef]
- Sun, M.; Liu, Q.; Schmidt, K.; Yang, J.; Yao, N.; Fernstrom, J.D.; Fernstrom, M.H.; DeLany, J.P.; Sclabassi, R.J. Determination of food portion size by image processing. In Proceedings of the 2008 30th Annual International Conference of the IEEE Engineering in Medicine and Biology Society, Vancouver, BC, Canada, 20–25 August 2008; pp. 871–874. [Google Scholar] [CrossRef]
- Rajayogi, J.R.; Manjunath, G.; Shobha, G. Indian Food Image Classification with Transfer Learning. In Proceedings of the 2019 4th International Conference on Computational Systems and Information Technology for Sustainable Solution (CSITSS), Bengaluru, India, 20–21 December 2019; pp. 1–4. [Google Scholar] [CrossRef]
- Tiankaew, U.; Chunpongthong, P.; Mettanant, V. A Food Photography App with Image Recognition for Thai Food. In Proceedings of the 2018 Seventh ICT International Student Project Conference (ICT-ISPC), Nakhonpathom, Thailand, 11–13 July 2018; pp. 1–6. [Google Scholar] [CrossRef]
- Li, J.; Han, F.; Guerrero, R.; Pavlovic, V. Picture-to-Amount (PITA): Predicting Relative Ingredient Amounts from Food Images. In Proceedings of the 2020 25th International Conference on Pattern Recognition (ICPR), Milan, Italy, 10–15 January 2021; pp. 10343–10350. [Google Scholar] [CrossRef]
- Hubel, R.; Laessle, R.G.; Lehrke, S.; Jass, J. Laboratory measurement of cumulative food intake in humans: Results on reliability. Appetite 2006, 46, 57–62. [Google Scholar] [CrossRef] [PubMed]
- Shah, M.; Copeland, J.; Dart, L.; Adams-Huet, B.; James, A.; Rhea, D. Slower Eating Speed Lowers Energy Intake in Normal-Weight but not Overweight/Obese Subjects. J. Acad. Nutr. Diet. 2014, 114, 393–402. [Google Scholar] [CrossRef]
- Petty, A.J.; Melanson, K.J.; Greene, G.W. Self-reported eating rate aligns with laboratory measured eating rate but not with free-living meals. Appetite 2013, 63, 36–41. [Google Scholar] [CrossRef]
- Doulah, A.; Farooq, M.; Yang, X.; Parton, J.; McCrory, M.A.; Higgins, J.A.; Sazonov, E. Meal Microstructure Characterization from Sensor-Based Food Intake Detection. Front. Nutr. 2017, 4, 31. [Google Scholar] [CrossRef]
- Kim, J.; Bae, B.-C. A Smartwatch-Based Feedback System for Eating Rate Guidance. In Proceedings of the 2018 ACM International Joint Conference and 2018 International Symposium on Pervasive and Ubiquitous Computing and Wearable Computers, in UbiComp ’18, Singapore, 8–12 October 2018; Association for Computing Machinery: New York, NY, USA, 2018; pp. 384–387. [Google Scholar] [CrossRef]
- Taniguchi, K.; Chiaki, H.; Kurosawa, M.; Nishikawa, A. A Novel Earphone Type Sensor for Measuring Mealtime: Consideration of the Method to Distinguish between Running and Meals. Sensors 2017, 17, 252. [Google Scholar] [CrossRef]
- Laessle, R.G.; Lehrke, S.; Dückers, S. Laboratory eating behavior in obesity. Appetite 2007, 49, 399–404. [Google Scholar] [CrossRef]
- Kim, J.; Lee, M.; LEE, K.-J.; Lee, T.; Bae, B.-C.; Cho, J.-D. An Eating Speed Guide System Using a Wristband and Tabletop Unit. In Proceedings of the 2016 ACM International Joint Conference on Pervasive and Ubiquitous Computing: Adjunct, in UbiComp ’16, Heidelberg, Germany, 12–16 September 2016; Association for Computing Machinery: New York, NY, USA, 2016; pp. 121–124. [Google Scholar] [CrossRef]
- Garner, D.M.; Garfinkel, P.E. The Eating Attitudes Test: An index of the symptoms of anorexia nervosa. Psychol. Med. 1979, 9, 273–279. [Google Scholar] [CrossRef] [PubMed]
- Mirtchouk, M.; Merck, C.; Kleinberg, S. Automated Estimation of Food Type and Amount Consumed from Body-Worn Audio and Motion Sensors. In Proceedings of the 2016 ACM International Joint Conference on Pervasive and Ubiquitous Computing, in UbiComp ’16, Heidelberg, Germany, 12–16 September 2016; Association for Computing Machinery: New York, NY, USA, 2016; pp. 451–462. [Google Scholar] [CrossRef]
- Stütz, T.; Dinic, R.; Domhardt, M.; Ginzinger, S. Can mobile augmented reality systems assist in portion estimation? A user study. In Proceedings of the 2014 IEEE International Symposium on Mixed and Augmented Reality—Media, Art, Social Science, Humanities and Design (ISMAR-MASH’D), Munich, Germany, 10–12 September 2014; pp. 51–57. [Google Scholar] [CrossRef]
- Pedram, M.; Mirzadeh, S.I.; Rokni, S.A.; Fallahzadeh, R.; Woodbridge, D.M.-K.; Lee, S.I.; Ghasemzadeh, H. LIDS: Mobile System to Monitor Type and Volume of Liquid Intake. IEEE Sens. J. 2021, 21, 20750–20763. [Google Scholar] [CrossRef]
- Zhang, Z.; Zheng, H.; Rempel, S.; Hong, K.; Han, T.; Sakamoto, Y.; Irani, P. A Smart Utensil for Detecting Food Pick-up Gesture and Amount While Eating. In Proceedings of the 11th Augmented Human International Conference, in AH ’20, Winnipeg, MB, Canada, 27–29 May 2020; Association for Computing Machinery: New York, NY, USA, 2020. [Google Scholar] [CrossRef]
- Papapanagiotou, V.; Diou, C.; Ioakimidis, I.; Södersten, P.; Delopoulos, A. Automatic Analysis of Food Intake and Meal Microstructure Based on Continuous Weight Measurements. IEEE J. Biomed. Health Inform. 2019, 23, 893–902. [Google Scholar] [CrossRef]
- Thomas, J.M.; Dourish, C.T.; Higgs, S. Effects of awareness that food intake is being measured by a universal eating monitor on the consumption of a pasta lunch and a cookie snack in healthy female volunteers. Appetite 2015, 92, 247–251. [Google Scholar] [CrossRef]
- Almiron-Roig, E.; Solis-Trapala, I.; Dodd, J.; Jebb, S.A. Estimating food portions. Influence of unit number, meal type and energy density. Appetite 2013, 71, 95–103. [Google Scholar] [CrossRef] [PubMed]
- Kelly, M.T.; Wallace, J.M.W.; Robson, P.J.; Rennie, K.L.; Welch, R.W.; Hannon-Fletcher, M.P.; Brennan, S.; Fletcher, A.; Livingstone, M.B.E. Increased portion size leads to a sustained increase in energy intake over 4 d in normal-weight and overweight men and women. Br. J. Nutr. 2009, 102, 470–477. [Google Scholar] [CrossRef]
- Sawyer, A.D.M.; van Lenthe, F.; Kamphuis, C.B.M.; Terragni, L.; Roos, G.; Poelman, M.P.; Nicolaou, M.; Waterlander, W.; Djojosoeparto, S.K.; Scheidmeir, M.; et al. Dynamics of the complex food environment underlying dietary intake in low-income groups: A systems map of associations extracted from a systematic umbrella literature review. Int. J. Behav. Nutr. Phys. Act. 2021, 18, 96. [Google Scholar] [CrossRef]
- Gemming, L.; Doherty, A.; Utter, J.; Shields, E.; Mhurchu, C.N. The use of a wearable camera to capture and categorise the environmental and social context of self-identified eating episodes. Appetite 2015, 92, 118–125. [Google Scholar] [CrossRef] [PubMed]
- Ruddock, H.K.; Brunstrom, J.M.; Higgs, S. The social facilitation of eating: Why does the mere presence of others cause an increase in energy intake? Physiol. Behav. 2021, 240, 113539. [Google Scholar] [CrossRef]
- Mekhmoukh, A.; Chapelot, D.; Bellisle, F. Influence of environmental factors on meal intake in overweight and normal-weight male adolescents. A laboratory study. Appetite 2012, 59, 90–95. [Google Scholar] [CrossRef]
- García-Segovia, P.; Harrington, R.J.; Seo, H.-S. Influences of table setting and eating location on food acceptance and intake. Food Qual. Prefer. 2015, 39, 1–7. [Google Scholar] [CrossRef]
- Mendi, E.; Ozyavuz, O.; Pekesen, E.; Bayrak, C. Food intake monitoring system for mobile devices. In Proceedings of the 5th IEEE International Workshop on Advances in Sensors and Interfaces IWASI, Bari, Italy, 13–14 June 2013; pp. 31–33. [Google Scholar] [CrossRef]
- Fortuna, C.; Giraud-Carrier, C.; West, J. Hand-to-Mouth Motion Tracking in Free-Living Conditions for Improved Weight Control. In Proceedings of the 2016 IEEE International Conference on Healthcare Informatics (ICHI), Chicago, IL, USA, 4–7 October 2016; pp. 341–348. [Google Scholar] [CrossRef]
- Sen, S.; Subbaraju, V.; Misra, A.; Balan, R.K.; Lee, Y. Experiences in Building a Real-World Eating Recogniser. In Proceedings of the 4th International on Workshop on Physical Analytics, in WPA ’17, Niagara Falls, NY, USA, 19 June 2017; Association for Computing Machinery: New York, NY, USA, 2017; pp. 7–12. [Google Scholar] [CrossRef]
- Shen, Y.; Salley, J.; Muth, E.; Hoover, A. Assessing the Accuracy of a Wrist Motion Tracking Method for Counting Bites Across Demographic and Food Variables. IEEE J. Biomed. Health Inform. 2017, 21, 599–606. [Google Scholar] [CrossRef] [PubMed]
- Luktuke, Y.Y.; Hoover, A. Segmentation and Recognition of Eating Gestures from Wrist Motion using Deep Learning. In Proceedings of the 2020 IEEE International Conference on Big Data (Big Data), Atlanta, GA, USA, 10–13 December 2020; pp. 1368–1373. [Google Scholar] [CrossRef]
- Kyritsis, K.; DIou, C.; Delopoulos, A. Modeling Wrist Micromovements to Measure In-Meal Eating Behavior from Inertial Sensor Data. IEEE J. Biomed. Health Inform. 2019, 23, 2325–2334. [Google Scholar] [CrossRef] [PubMed]
- Kyritsis, K.; Diou, C.; Delopoulos, A. A Data Driven End-to-End Approach for In-the-Wild Monitoring of Eating Behavior Using Smartwatches. IEEE J. Biomed. Health Inform. 2021, 25, 22–34. [Google Scholar] [CrossRef]
- Levi, I.; Kyritsis, K.; Papapanagiotou, V.; Tsakiridis, G.; Delopoulos, A. Estimation of Food Intake Quantity Using Inertial Signals from Smartwatches. arXiv 2025, arXiv:2502.06649. [Google Scholar] [CrossRef]
- Li, C.; Bai, Y.; Jia, W.; Sun, M. Eating Event Detection by Magnetic Proximity Sensing. In Proceedings of the 2013 39th Annual Northeast Bioengineering Conference, Syracuse, NY, USA, 5–7 April 2013; pp. 15–16. [Google Scholar] [CrossRef]
- Zhang, S.; Zhao, Y.; Nguyen, D.T.; Xu, R.; Sen, S.; Hester, J.; Alshurafa, N. NeckSense: A Multi-Sensor Necklace for Detecting Eating Activities in Free-Living Conditions. Proc. ACM Interact. Mob. Wearable Ubiquitous Technol. 2020, 4, 1–26. [Google Scholar] [CrossRef]
- Konstantinidis, D.; Dimitropoulos, K.; Langlet, B.; Daras, P.; Ioakimidis, I. Validation of a Deep Learning System for the Full Automation of Bite and Meal Duration Analysis of Experimental Meal Videos. Nutrients 2020, 12, 209. [Google Scholar] [CrossRef]
- Kassim, M.F.; Mohd, M.N.H.; Tomari, M.R.M.; Suriani, N.S.; Zakaria, W.N.W.; Sari, S. A non-invasive and non-wearable food intake monitoring system based on depth sensor. Bull. Electr. Eng. Inform. 2020, 9, 2342–2349. [Google Scholar] [CrossRef]
- Lei, J.; Qiu, J.; Lo, F.P.-W.; Lo, B. Assessing Individual Dietary Intake in Food Sharing Scenarios with Food and Human Pose Detection. In Pattern Recognition. ICPR International Workshops and Challenges, Lecture Notes in Computer Science; Del Bimbo, A., Cucchiara, R., Sclaroff, S., Farinella, G.M., Mei, T., Bertini, M., Escalante, H.J., Vezzani, R., Eds.; Springer International Publishing: Cham, Switzerland, 2021; pp. 549–557. [Google Scholar] [CrossRef]
- Tang, Z.; Hoover, A. A New Video Dataset for Recognizing Intake Gestures in a Cafeteria Setting. In Proceedings of the 2022 26th International Conference on Pattern Recognition (ICPR), Montreal, QC, Canada, 21–25 August 2022; pp. 4399–4405. [Google Scholar] [CrossRef]
- Tufano, M.; Lasschuijt, M.P.; Chauhan, A.; Feskens, E.J.M.; Camps, G. Rule-based systems to automatically count bites from meal videos. Front. Nutr. 2024, 11, 1343868. [Google Scholar] [CrossRef]
- Tang, Z.; Hoover, A. Video-based Intake Gesture Recognition using Meal-length Context. ACM Trans Comput Healthc. 2024, 6, 1–24. [Google Scholar] [CrossRef]
- Hermsen, S.; Mars, M.; Higgs, S.; Frost, J.H.; Hermans, R.C.J. Effects of eating with an augmented fork with vibrotactile feedback on eating rate and body weight: A randomized controlled trial. Int. J. Behav. Nutr. Phys. Act. 2019, 16, 1–11. [Google Scholar] [CrossRef] [PubMed]
- Mertes, G.; Ding, L.; Chen, W.; Hallez, H.; Jia, J.; Vanrumste, B. Measuring and Localizing Individual Bites Using a Sensor Augmented Plate During Unrestricted Eating for the Aging Population. IEEE J. Biomed. Health Inform. 2020, 24, 1509–1518. [Google Scholar] [CrossRef] [PubMed]
- Nishimura, J.; Kuroda, T. Eating habits monitoring using wireless wearable in-ear microphone. In Proceedings of the 2008 3rd International Symposium on Wireless Pervasive Computing, Santorini, Greece, 7–9 May 2008; pp. 130–132. [Google Scholar] [CrossRef]
- Liu, J.; Johns, E.; Atallah, L.; Pettitt, C.; Lo, B.; Frost, G.; Yang, G. An Intelligent Food-Intake Monitoring System Using Wearable Sensors. In Proceedings of the 2012 Ninth International Conference on Wearable and Implantable Body Sensor Networks, London, UK, 9–12 May 2012; pp. 154–160. [Google Scholar] [CrossRef]
- Bi, Y.; Lv, M.; Song, C.; Xu, W.; Guan, N.; Yi, W. AutoDietary: A Wearable Acoustic Sensor System for Food Intake Recognition in Daily Life. IEEE Sens. J. 2016, 16, 806–816. [Google Scholar] [CrossRef]
- Olubanjo, T.; Moore, E.; Ghovanloo, M. Detecting food intake acoustic events in noisy recordings using template matching. In Proceedings of the 2016 IEEE-EMBS International Conference on Biomedical and Health Informatics (BHI), Las Vegas, NV, USA, 24–27 February 2016; pp. 388–391. [Google Scholar] [CrossRef]
- Gao, Y.; Zhang, N.; Wang, H.; Ding, X.; Ye, X.; Chen, G.; Cao, Y. iHear Food: Eating Detection Using Commodity Bluetooth Headsets. In Proceedings of the 2016 IEEE First International Conference on Connected Health: Applications, Systems and Engineering Technologies (CHASE), Washington, DC, USA, 27–29 June 2016; pp. 163–172. [Google Scholar] [CrossRef]
- Mirtchouk, M.; Lustig, D.; Smith, A.; Ching, I.; Zheng, M.; Kleinberg, S. Recognizing Eating from Body-Worn Sensors: Combining Free-Living and Laboratory Data. Proc. ACM Interact. Mob. Wearable Ubiquitous Technol. 2017, 1, 1–20. [Google Scholar] [CrossRef]
- Turan, M.A.T.; Erzin, E. Detection of Food Intake Events From Throat Microphone Recordings Using Convolutional Neural Networks. In Proceedings of the 2018 IEEE International Conference on Multimedia & Expo Workshops (ICMEW), San Diego, CA, USA, 23–27 July 2018; pp. 1–6. [Google Scholar] [CrossRef]
- Kondo, T.; Shiro, H.; Yokokubo, A.; Lopez, G. Optimized Classification Model for Efficient Recognition of Meal-Related Activities in Daily Life Meal Environment. In Proceedings of the 2019 Joint 8th International Conference on Informatics, Electronics & Vision (ICIEV) and 2019 3rd International Conference on Imaging, Vision & Pattern Recognition (icIVPR), Spokane, WA, USA, 30 May–2 June 2019; pp. 146–151. [Google Scholar] [CrossRef]
- Kondo, T.; Kamachi, H.; Ishii, S.; Yokokubo, A.; Lopez, G. Robust Classification of Eating Sound Collected in Natural Meal Environment. In Proceedings of the Adjunct Proceedings of the 2019 ACM International Joint Conference on Pervasive and Ubiquitous Computing and Proceedings of the 2019 ACM International Symposium on Wearable Computers, in UbiComp/ISWC ’19 Adjunct, London, UK, 9–13 September 2019; Association for Computing Machinery: New York, NY, USA, 2019; pp. 105–108. [Google Scholar] [CrossRef]
- Lotfi, R.; Tzanetakis, G.; Eskicioglu, R.; Irani, P. A Comparison between Audio and IMU Data to Detect Chewing Events Based on an Earable Device. In Proceedings of the 11th Augmented Human International Conference, in AH ’20, Winnipeg, MB, Canada, 27–29 May 2020; Association for Computing Machinery: New York, NY, USA, 2020. [Google Scholar] [CrossRef]
- Bi, S.; Lu, Y.; Tobias, N.; Ryan, E.; Masterson, T.; Sen, S.; Halter, R.; Sorber, J.; Gilbert-Diamond, D.; Kotz, D. Measuring children’s eating behavior with a wearable device. In Proceedings of the 2020 IEEE International Conference on Healthcare Informatics (ICHI), Oldenburg, Germany, 30 November–3 December 2020; pp. 1–11. [Google Scholar] [CrossRef]
- Nakamura, A.; Mineno, H.; Nishimura, M.; Saito, T.; Ikeda, D.; Ohta, K. Automatic Detection of the Chewing Side Using Two-channel Recordings under the Ear. In Proceedings of the 2020 IEEE 2nd Global Conference on Life Sciences and Technologies (LifeTech), Kyoto, Japan, 10–12 March 2020; pp. 82–83. [Google Scholar] [CrossRef]
- Mirtchouk, M.; Kleinberg, S. Detecting Granular Eating Behaviors From Body-worn Audio and Motion Sensors. In Proceedings of the 2021 IEEE EMBS International Conference on Biomedical and Health Informatics (BHI), Athens, Greece, 27–30 July 2021; pp. 1–4. [Google Scholar] [CrossRef]
- Papapanagiotou, V.; Liapi, A.; Delopoulos, A. Chewing Detection from Commercial Smart-glasses. In Proceedings of the 7th International Workshop on Multimedia Assisted Dietary Management on Multimedia Assisted Dietary Management, Lisboa, Portugal, 10 October 2022; pp. 11–16. [Google Scholar] [CrossRef]
- Lin, Z.; Zecca, M.; Sessa, S.; Ishii, H.; Takanishi, A. Development of an ultra-miniaturized inertial measurement unit for jaw movement analysis during free chewing. J. Comput. Sci. 2010, 6, 896–903. [Google Scholar] [CrossRef]
- Farooq, M.; Sazonov, E. Accelerometer-Based Detection of Food Intake in Free-living Individuals. IEEE Sens. J. 2018, 18, 3752–3758. [Google Scholar] [CrossRef]
- Wang, S.; Zhou, G.; Hu, L.; Chen, Z.; Chen, Y. CARE: Chewing Activity Recognition Using Noninvasive Single Axis Accelerometer. In Proceedings of the Adjunct Proceedings of the 2015 ACM International Joint Conference on Pervasive and Ubiquitous Computing and Proceedings of the 2015 ACM International Symposium on Wearable Computers, in UbiComp/ISWC’15 Adjunct, Osaka, Japan, 9–11 September 2015; Association for Computing Machinery: New York, NY, USA, 2015; pp. 109–112. [Google Scholar] [CrossRef]
- Lee, J.; Paudyal, P.; Banerjee, A.; Gupta, S.K.S. A User-Adaptive Modeling for Eating Action Identification from Wristband Time Series. ACM Trans. Interact. Intell. Syst. 2019, 9, 1–35. [Google Scholar] [CrossRef]
- Ketmalasiri, T.; Wu, Y.Y.; Butkow, K.-J.; Mascolo, C.; Liu, Y. IMChew: Chewing Analysis using Earphone Inertial Measurement Units. In Proceedings of the Workshop on Body-Centric Computing Systems, in BodySys ’24, Tokyo Japan, 3–7 June 2024; Association for Computing Machinery: New York, NY, USA, 2024; pp. 29–34. [Google Scholar] [CrossRef]
- Sazonov, E.S.; Fontana, J.M. A Sensor System for Automatic Detection of Food Intake Through Non-Invasive Monitoring of Chewing. IEEE Sens. J. 2012, 12, 1340–1348. [Google Scholar] [CrossRef] [PubMed]
- Farooq, M.; Fontana, J.M.; Boateng, A.F.; Mccrory, M.A.; Sazonov, E. A Comparative Study of Food Intake Detection Using Artificial Neural Network and Support Vector Machine. In Proceedings of the 2013 12th International Conference on Machine Learning and Applications, Miami, FL, USA, 4–7 December 2013; p. 153. [Google Scholar] [CrossRef]
- Farooq, M.; Sazonov, E. Comparative testing of piezoelectric and printed strain sensors in characterization of chewing. In Proceedings of the 2015 37th Annual International Conference of the IEEE Engineering in Medicine and Biology Society (EMBC), Milan, Italy, 25–29 August 2015; pp. 7538–7541. [Google Scholar] [CrossRef]
- Farooq, M.; Sazonov, E. A Novel Wearable Device for Food Intake and Physical Activity Recognition. Sensors 2016, 16, 1067. [Google Scholar] [CrossRef] [PubMed]
- Farooq, M.; Sazonov, E. Detection of chewing from piezoelectric film sensor signals using ensemble classifiers. In Proceedings of the 2016 38th Annual International Conference of the IEEE Engineering in Medicine and Biology Society (EMBC), Orlando, FL, USA, 16–20 August 2016; pp. 4929–4932. [Google Scholar] [CrossRef]
- Kim, J.; Lee, K.-J.; Lee, M.; Lee, N.; Bae, B.-C.; Lee, G.; Cho, J.; Shim, Y.M.; Cho, J.-D. Slowee: A Smart Eating-Speed Guide System with Light and Vibration Feedback. In Proceedings of the 2016 CHI Conference Extended Abstracts on Human Factors in Computing Systems, in CHI EA ’16, San Jose, CA, USA, 7–12 May 2016; Association for Computing Machinery: New York, NY, USA, 2016; pp. 2563–2569. [Google Scholar] [CrossRef]
- Chun, K.S.; Bhattacharya, S.; Thomaz, E. Detecting Eating Episodes by Tracking Jawbone Movements with a Non-Contact Wearable Sensor. Proc. ACM Interact. Mob. Wearable Ubiquitous Technol. 2018, 2, 1–21. [Google Scholar] [CrossRef]
- Selamat, N.A.; Ali, S.H.M. Analysis of Chewing Signals Based on Chewing Detection Using Proximity Sensor for Diet Monitoring. In Lecture Notes in Computer Science (Including Subseries Lecture Notes in Artificial Intelligence and Lecture Notes in Bioinformatics); Springer: Berlin/Heidelberg, Germany, 2021; Volume 12665 LNCS, p. 616. [Google Scholar] [CrossRef]
- Selamat, N.A.; Ali, S.H.M.; Minhad, K.N.B.; Ahmad, S.A.; Sampe, J. A Novel Peak Detection Algorithm Using Particle Swarm Optimization for Chew Count Estimation of a Contactless Chewing Detection. IEEE Trans. Instrum. Meas. 2022, 71, 9512712. [Google Scholar] [CrossRef]
- Rey, A.; González, R.; Martínez-de-Juan, J.L.; Benedito, J.; Mulet, A. EMG assessment of chewing behaviour for food evaluation: Influence of personality characteristics. Food Qual. Prefer. 2007, 18, 585–595. [Google Scholar] [CrossRef]
- White, A.K.; Venn, B.; Lu, L.W.; Rush, E.; Gallo, L.M.; Yong, J.L.C.; Farella, M. A comparison of chewing rate between overweight and normal BMI individuals. Physiol. Behav. 2015, 145, 8–13. [Google Scholar] [CrossRef]
- Zhang, R.; Bernhart, S.; Amft, O. Diet eyeglasses: Recognising food chewing using EMG and smart eyeglasses. In Proceedings of the 2016 IEEE 13th International Conference on Wearable and Implantable Body Sensor Networks (BSN), San Francisco, CA, USA, 14–17 June 2016; pp. 7–12. [Google Scholar] [CrossRef]
- Zhang, R.; Amft, O. Monitoring Chewing and Eating in Free-Living Using Smart Eyeglasses. IEEE J. Biomed. Health Inform. 2018, 22, 23–32. [Google Scholar] [CrossRef]
- Papapanagiotou, V.; Diou, C.; Zhou, L.; van den Boer, J.; Mars, M.; Delopoulos, A. A Novel Chewing Detection System Based on PPG, Audio, and Accelerometry. IEEE J. Biomed. Health Inform. 2017, 21, 607–618. [Google Scholar] [CrossRef]
- Blechert, J.; Liedlgruber, M.; Lender, A.; Reichenberger, J.; Wilhelm, F.H. Unobtrusive electromyography-based eating detection in daily life: A new tool to address underreporting? Appetite 2017, 118, 168–173. [Google Scholar] [CrossRef]
- Sugita, Y.; Zempo, K.; Ando, Y.; Kakutani, Y.; Mizutani, K.; Wakatsuki, N. Diet Gamification toward Chewing Amount Control via Head Mounted Display. In Proceedings of the SIGGRAPH Asia 2018 Posters, in SA ’18, Tokyo, Japan, 4–7 December 2018; Association for Computing Machinery: New York, NY, USA, 2018. [Google Scholar] [CrossRef]
- Cadavid, S.; Abdel-Mottaleb, M.; Helal, A. Exploiting visual quasi-periodicity for real-time chewing event detection using active appearance models and support vector machines. Pers. Ubiquitous Comput. 2012, 16, 729–739. [Google Scholar] [CrossRef]
- Alshboul, S.; Fraiwan, M. Determination of Chewing Count from Video Recordings Using Discrete Wavelet Decomposition and Low Pass Filtration. Sensors 2021, 21, 6806. [Google Scholar] [CrossRef] [PubMed]
- Hossain, D.; Imtiaz, M.H.; Sazonov, E. Comparison of Wearable Sensors for Estimation of Chewing Strength. IEEE Sens. J. 2020, 20, 5379–5388. [Google Scholar] [CrossRef]
- Makeyev, O.; Sazonov, E.; Schuckers, S.; Melanson, E.; Neuman, M. Limited receptive area neural classifier for recognition of swallowing sounds using short-time Fourier transform. In Proceedings of the 2007 International Joint Conference on Neural Networks, Orlando, FL, USA, 12–17 August 2007; pp. 1601–1606. [Google Scholar] [CrossRef]
- Fontana, J.M.; Melo, P.L.; Sazonov, E.S. Swallowing detection by sonic and subsonic frequencies: A comparison. In Proceedings of the 2011 Annual International Conference of the IEEE Engineering in Medicine and Biology Society, Boston, MA, USA, 30 August–3 September 2011; pp. 6890–6893. [Google Scholar] [CrossRef]
- Walker, W.P.; Bhatia, D.K. Automated Ingestion Detection for a Health Monitoring System. IEEE J. Biomed. Health Inform. 2014, 18, 682–692. [Google Scholar] [CrossRef]
- Jayatilake, D.; Ueno, T.; Teramoto, Y.; Nakai, K.; Hidaka, K.; Ayuzawa, S.; Eguchi, K.; Matsumura, A.; Suzuki, K. Smartphone-Based Real-time Assessment of Swallowing Ability From the Swallowing Sound. IEEE J. Transl. Eng. Health Med. 2015, 3, 1–10. [Google Scholar] [CrossRef]
- Alshurafa, N.; Kalantarian, H.; Pourhomayoun, M.; Sarin, S.; Liu, J.J.; Sarrafzadeh, M. Non-invasive monitoring of eating behavior using spectrogram analysis in a wearable necklace. In Proceedings of the 2014 IEEE Healthcare Innovation Conference (HIC), Seattle, WA, USA, 8–10 October 2014; pp. 71–74. [Google Scholar] [CrossRef]
- Dong, B.; Biswas, S. Wearable diet monitoring through breathing signal analysis. In Proceedings of the 2013 35th Annual International Conference of the IEEE Engineering in Medicine and Biology Society (EMBC), Osaka, Japan, 3–7 July 2013; pp. 1186–1189. [Google Scholar] [CrossRef]
- Dong, B.; Biswas, S.; Gernhardt, R.; Schlemminger, J. A mobile food intake monitoring system based on breathing signal analysis. In Proceedings of the 8th International Conference on Body Area Networks, in BodyNets ’13, Boston, MA, USA, 30 September–2 October 2013; pp. 165–168. [Google Scholar] [CrossRef]
- Lee, K. Food Intake Detection Using Ultrasonic Doppler Sonar. IEEE Sens. J. 2017, 17, 6056–6068. [Google Scholar] [CrossRef]
- Zhang, S.; Nguyen, D.; Zhang, G.; Xu, R.; Maglaveras, N.; Alshurafa, N. Estimating Caloric Intake in Bedridden Hospital Patients with Audio and Neck-Worn Sensors. In Proceedings of the 2018 IEEE/ACM International Conference on Connected Health: Applications, Systems and Engineering Technologies (CHASE), Washington, DC, USA, 26–28 September 2018; pp. 1–2. [Google Scholar] [CrossRef]
- Khan, M.I.; Acharya, B.; Chaurasiya, R.K. iHearken: Chewing sound signal analysis based food intake recognition system using Bi-LSTM softmax network. Comput. Methods Programs Biomed. 2022, 221, 106843. [Google Scholar] [CrossRef] [PubMed]
- Joutou, T.; Yanai, K. A food image recognition system with Multiple Kernel Learning. In Proceedings of the 2009 16th IEEE International Conference on Image Processing (ICIP), Cairo, Egypt, 7–10 November 2009; pp. 285–288. [Google Scholar] [CrossRef]
- Pouladzadeh, P.; Shirmohammadi, S.; Yassine, A. Using graph cut segmentation for food calorie measurement. In Proceedings of the 2014 IEEE International Symposium on Medical Measurements and Applications (MeMeA), Lisboa, Portugal, 11–12 June 2014; pp. 1–6. [Google Scholar] [CrossRef]
- Okamoto, K.; Yanai, K. Real-time eating action recognition system on a smartphone. In Proceedings of the 2014 IEEE International Conference on Multimedia and Expo Workshops (ICMEW), Chengdu, China, 14–18 July 2014; pp. 1–6. [Google Scholar] [CrossRef]
- Lee, J.; Banerjee, A.; Gupta, S.K.S. MT-diet demo: Demonstration of automated smartphone based diet assessment system. In Proceedings of the 2016 IEEE International Conference on Pervasive Computing and Communication Workshops (PerCom Workshops), Sydney, NSW, Australia, 14–18 March 2016; pp. 1–3. [Google Scholar] [CrossRef]
- Lee, J.; Banerjee, A.; Gupta, S.K.S. MT-Diet: Automated smartphone based diet assessment with infrared images. In Proceedings of the 2016 IEEE International Conference on Pervasive Computing and Communications (PerCom), Sydney, NSW, Australia, 14–19 March 2016; pp. 1–6. [Google Scholar] [CrossRef]
- Lee, J.; Paudyal, P.; Banerjee, A.; Gupta, S.K.S. FIT-Eve and ADAM: Estimation of velocity and energy for automated diet activity monitoring. In Proceedings of the 16th IEEE International Conference on Machine Learning and Applications, ICMLA 2017, Cancun, Mexico, 18–21 December 2017; pp. 1071–1074. [Google Scholar] [CrossRef]
- Minija, S.J.; Emmanuel, W.R.S. Food image classification using sphere shaped—Support vector machine. In Proceedings of the 2017 International Conference on Inventive Computing and Informatics (ICICI), Coimbatore, India, 23–24 November 2017; pp. 109–113. [Google Scholar] [CrossRef]
- Ocay, A.B.; Fernandez, J.M.; Palaoag, T.D. NutriTrack: Android-based food recognition app for nutrition awareness. In Proceedings of the 2017 3rd IEEE International Conference on Computer and Communications (ICCC), Chengdu, China, 13–16 December 2017; pp. 2099–2104. [Google Scholar] [CrossRef]
- Liu, C.; Cao, Y.; Luo, Y.; Chen, G.; Vokkarane, V.; Ma, Y.; Chen, S.; Hou, P. A New Deep Learning-Based Food Recognition System for Dietary Assessment on An Edge Computing Service Infrastructure. IEEE Trans. Serv. Comput. 2018, 11, 249–261. [Google Scholar] [CrossRef]
- Jiang, L.; Qiu, B.; Liu, X.; Huang, C.; Lin, K. DeepFood: Food Image Analysis and Dietary Assessment via Deep Model. IEEE Access 2020, 8, 47477–47489. [Google Scholar] [CrossRef]
- Lester, J.; Tan, D.; Patel, S.; Brush, A.J.B. Automatic classification of daily fluid intake. In Proceedings of the 2010 4th International Conference on Pervasive Computing Technologies for Healthcare, Munich, Germany, 22–25 March 2010; pp. 1–8. [Google Scholar] [CrossRef]
- Lee, J.; Paudyal, P.; Banerjee, A.; Gupta, S.K.S. IDEA: Instant Detection of Eating Action Using Wrist-Worn Sensors in Absence of User-Specific Model. In Proceedings of the 26th Conference on User Modeling, Adaptation and Personalization, in UMAP ’18, Singapore, 8–11 July 2018; Association for Computing Machinery: New York, NY, USA, 2018; pp. 371–372. [Google Scholar] [CrossRef]
- Dong, B.; Biswas, S. Meal-time and duration monitoring using wearable sensors. Biomed. Signal Process. Control 2017, 32, 97–109. [Google Scholar] [CrossRef]
- Hermsen, S.; Frost, J.H.; Robinson, E.; Higgs, S.; Mars, M.; Hermans, R.C.J. Evaluation of a Smart Fork to Decelerate Eating Rate. J. Acad. Nutr. Diet. 2016, 116, 1066–1067. [Google Scholar] [CrossRef]
- Samadi, S.; Turksoy, K.; Hajizadeh, I.; Feng, J.; Sevil, M.; Cinar, A. Meal Detection and Carbohydrate Estimation Using Continuous Glucose Sensor Data. IEEE J. Biomed. Health Inform. 2017, 21, 619–627. [Google Scholar] [CrossRef] [PubMed]
- Hermans, R.C.J.; Hermsen, S.; Robinson, E.; Higgs, S.; Mars, M.; Frost, J.H. The effect of real-time vibrotactile feedback delivered through an augmented fork on eating rate, satiation, and food intake. Appetite 2017, 113, 7–13. [Google Scholar] [CrossRef]
- Watanabe, T.; Shimokakimoto, T.; Jayatilake, D.; Inoue, M.; Suzuki, K. A portable sensor sheet for measuring the eating pace in meal assistance care. In Proceedings of the 2019 41st Annual International Conference of the IEEE Engineering in Medicine and Biology Society (EMBC), Berlin, Germany, 23–27 July 2019; pp. 4297–4300. [Google Scholar] [CrossRef]
- Raju, V.B.; Hossain, D.; Sazonov, E. Estimation of Plate and Bowl Dimensions for Food Portion Size Assessment in a Wearable Sensor System. IEEE Sens. J. 2023, 23, 5391–5400. [Google Scholar] [CrossRef]
- Hamatani, T.; Elhamshary, M.; Uchiyama, A.; Higashino, T. FluidMeter: Gauging the Human Daily Fluid Intake Using Smartwatches. Proc. ACM Interact. Mob. Wearable Ubiquitous Technol. 2018, 2, 1–25. [Google Scholar] [CrossRef]
- Fontana, J.M.; Higgins, J.A.; Schuckers, S.C.; Bellisle, F.; Pan, Z.; Melanson, E.L.; Neuman, M.R.; Sazonov, E. Energy intake estimation from counts of chews and swallows. Appetite 2015, 85, 14–21. [Google Scholar] [CrossRef]
- Jung, G.; Zarzycki, A.; Lee, J.-H. Mom’s Tray: Real-Time Dietary Monitoring System. In Proceedings of the SIGGRAPH Asia 2017 Mobile Graphics & Interactive Applications, in SA ’17, Bangkok Thailand, 27–30 December 2017; Association for Computing Machinery: New York, NY, USA, 2017. [Google Scholar] [CrossRef]
- Konstantakopoulos, F.S.; Georga, E.I.; Fotiadis, D.I. A novel approach to estimate the weight of food items based on features extracted from an image using boosting algorithms. Sci. Rep. 2023, 13, 21040. [Google Scholar] [CrossRef] [PubMed]
- Kissileff, H.R.; Klingsberg, G.; Van Itallie, T.B. Universal eating monitor for continuous recording of solid or liquid consumption in man. Am. J. Physiol. 1980, 238, R14–R22. [Google Scholar] [CrossRef]
- Salley, J.N.; Hoover, A.W.; Muth, E.R. Between- and Within-Subjects Predictors of the Kilocalorie Content of Bites of Food. J. Acad. Nutr. Diet. 2019, 119, 1109–1117. [Google Scholar] [CrossRef]
- Lasschuijt, M.P.; Brouwer-Brolsma, E.; Mars, M.; Siebelink, E.; Feskens, E.; de Graaf, C.; Camps, G. Concept development and use of an automated food intake and eating behavior assessment method. J. Vis. Exp. 2021, 168, e62144. [Google Scholar] [CrossRef]
- Naaman, R.; Parrett, A.; Bashawri, D.; Campo, I.; Fleming, K.; Nichols, B.; Burleigh, E.; Murtagh, J.; Reid, J.; Gerasimidis, K. Assessment of Dietary Intake Using Food Photography and Video Recording in Free-Living Young Adults: A Comparative Study. J. Acad. Nutr. Diet. 2021, 121, 749–761. [Google Scholar] [CrossRef]
- Maekawa, T. A sensor device for automatic food lifelogging that is embedded in home ceiling light: A preliminary investigation. In Proceedings of the 2013 7th International Conference on Pervasive Computing Technologies for Healthcare and Workshops, PervasiveHealth 2013, Venice, Italy, 5–8 May 2013; pp. 405–407. [Google Scholar] [CrossRef]
- Martinez, E.T.; Leyva-Vallina, M.; Sarker, M.M.K.; Puig, D.; Petkov, N.; Radeva, P. Hierarchical Approach to Classify Food Scenes in Egocentric Photo-Streams. IEEE J. Biomed. Health Inform. 2020, 24, 866–877. [Google Scholar] [CrossRef]
- Bi, C.; Xing, G.; Hao, T.; Huh-Yoo, J.; Peng, W.; Ma, M.; Chang, X. FamilyLog: Monitoring Family Mealtime Activities by Mobile Devices. IEEE Trans. Mob. Comput. 2020, 19, 1818–1830. [Google Scholar] [CrossRef]
- Oliver, J.H.; Hollis, J.H. Virtual Reality as a Tool to Study the Influence of the Eating Environment on Eating Behavior: A Feasibility Study. Foods 2021, 10, 89. [Google Scholar] [CrossRef] [PubMed]
- Huang, Y.; A Hassan, M.; He, J.; Higgins, J.; Mccrory, M.; Eicher-Miller, H.; Thomas, J.G.; Sazonov, E.; Zhu, F. Automatic Recognition of Food Ingestion Environment from the AIM-2 Wearable Sensor. In Proceedings of the IEEE/CVF Conference on Computer Vision and Pattern Recognition, 2024; pp. 3685–3694. Available online: https://openaccess.thecvf.com/content/CVPR2024W/MTF/html/Huang_Automatic_Recognition_of_Food_Ingestion_Environment_from_the_AIM-2_Wearable_CVPRW_2024_paper.html (accessed on 13 February 2025).
- Shahi, S.; Sen, S.; Pedram, M.; Alharbi, R.; Gao, Y.; Katsaggelos, A.K.; Hester, J.; Alshurafa, N. Detecting Eating, and Social Presence with All Day Wearable RGB-T. In Proceedings of the 8th ACM/IEEE International Conference on Connected Health: Applications, Systems and Engineering Technologies, in CHASE ’23, Wilmington, DE, USA, 19–21 June 2024; Association for Computing Machinery: New York, NY, USA, 2024; pp. 68–79. [Google Scholar] [CrossRef]
- Ghosh, T.; Hossain, D.; Sazonov, E. Detection of Food Intake Sensor’s Wear Compliance in Free-Living. IEEE Sens. J. 2021, 21, 27728–27735. [Google Scholar] [CrossRef]
- Maramis, C.; Kilintzis, V.; Maglaveras, N. Real-Time Bite Detection from Smartwatch Orientation Sensor Data. In Proceedings of the 9th Hellenic Conference on Artificial Intelligence, in SETN ’16, Thessaloniki, Greece, 18–20 May 2016; Association for Computing Machinery: New York, NY, USA, 2016. [Google Scholar] [CrossRef]
- Wang, Y.; Li, Z.; Jarvis, R.; Khot, R.A. Floyd” Mueller, IScream!: Towards the Design of Playful Gustosonic Experiences with Ice Cream. In Proceedings of the Extended Abstracts of the 2019 CHI Conference on Human Factors in Computing Systems, in CHI EA ’19, Online, 4–9 May 2019; Association for Computing Machinery: New York, NY, USA, 2019; pp. 1–4. [Google Scholar] [CrossRef]
- Konstantinidis, D.; Dimitropoulos, K.; Ioakimidis, I.; Langlet, B.; Daras, P. A Deep Network for Automatic Video-Based Food Bite Detection. In Computer Vision Systems, Lecture Notes in Computer Science; Tzovaras, D., Giakoumis, D., Vincze, M., Argyros, A., Eds.; Springer International Publishing: Cham, Switzerland, 2019; pp. 586–595. [Google Scholar] [CrossRef]
- Punpongsanon, P.; Ishizuka, H. Edisensor: Facilitating food electricity for eating habits analysis. In Proceedings of the LifeTech 2021—2021 IEEE 3rd Global Conference on Life Sciences and Technologies, Nara, Japan, 9–11 March 2021; pp. 104–105. [Google Scholar] [CrossRef]
- Kadomura, A.; Li, C.-Y.; Tsukada, K.; Chu, H.-H.; Siio, I. Persuasive Technology to Improve Eating Behavior Using a Sensor-Embedded Fork. In Proceedings of the 2014 ACM International Joint Conference on Pervasive and Ubiquitous Computing, in UbiComp ’14, Seattle, WA, USA, 13–17 September 2014; Association for Computing Machinery: New York, NY, USA, 2014; pp. 319–329. [Google Scholar] [CrossRef]
- Fontana, J.M.; Farooq, M.; Sazonov, E. Automatic Ingestion Monitor: A Novel Wearable Device for Monitoring of Ingestive Behavior. IEEE Trans. Biomed. Eng. 2014, 61, 1772–1779. [Google Scholar] [CrossRef] [PubMed]
- Alshurafa, N.; Kalantarian, H.; Pourhomayoun, M.; Liu, J.J.; Sarin, S.; Shahbazi, B.; Sarrafzadeh, M. Recognition of Nutrition Intake Using Time-Frequency Decomposition in a Wearable Necklace Using a Piezoelectric Sensor. IEEE Sens. J. 2015, 15, 3909–3916. [Google Scholar] [CrossRef]
- Yao, N.; Sclabassi, R.J.; Liu, Q.; Sun, M. A video-based algorithm for food intake estimation in the study of obesity. In Proceedings of the 2007 IEEE 33rd Annual Northeast Bioengineering Conference, Stony Brook, NY, USA, 10–11 March 2007; pp. 298–299. [Google Scholar] [CrossRef]
- Zhang, Z.; Kim, J.; Sakamoto, Y.; Han, T.; Irani, P. Applying a pneumatic interface to intervene with rapid eating behaviour. Stud. Health Technol. Inform. 2019, 257, 519. [Google Scholar] [CrossRef]
- Farooq, M.; McCrory, M.A.; Sazonov, E. Reduction of energy intake using just-in-time feedback from a wearable sensor system. Obes. Silver Spring Md. 2017, 25, 676–681. [Google Scholar] [CrossRef]

| Inclusion Criteria | Exclusion Criteria |
|---|---|
| Articles published since 1 January 2000. | Articles not written in English |
| Articles published after peer-reviewed | Not an article, such as studies published as posters, abstracts, book chapters, database descriptions, and review articles |
| Articles must address a set of keywords including chewing, chewing rate, chewing frequency, biting, bite rate, bite frequency, swallowing, swallow rate, swallow frequency, eating rate, eating speed, meal duration, mealtime, eating amount, food items, portion size, mass of intake, eating environment, sensor, device, technology | Studies conducted on animals. |
| Articles that describe the measurement of quantifiable metrics for eating behavior after eating detection using technology. | Unrelated articles, such as studies that describe the eating detection process but with no quantifiable metrics for eating behavior, and studies that do not use technology to measure eating behavior. |
| Search Strings | Databases | |||||
|---|---|---|---|---|---|---|
| ACM | IEEE | PubMed | Science Direct | Scopus | Total | |
| (chewing OR biting OR swallowing OR food items OR eating environment OR portion size) AND (sensor OR device OR technology) | 60 | 252 | 35 | 454 | 135 | 936 |
| (chewing rate OR chewing frequency OR bite rate OR bite frequency OR swallowing rate OR swallowing frequency) AND (sensor OR device OR technology) | 114 | 125 | 78 | 301 | 231 | 849 |
| (mealtime OR meal duration OR eating duration OR eating rate OR eating speed) AND (sensor OR device OR technology) | 64 | 219 | 73 | 155 | 77 | 588 |
Disclaimer/Publisher’s Note: The statements, opinions and data contained in all publications are solely those of the individual author(s) and contributor(s) and not of MDPI and/or the editor(s). MDPI and/or the editor(s) disclaim responsibility for any injury to people or property resulting from any ideas, methods, instructions or products referred to in the content. |
© 2025 by the authors. Licensee MDPI, Basel, Switzerland. This article is an open access article distributed under the terms and conditions of the Creative Commons Attribution (CC BY) license (https://creativecommons.org/licenses/by/4.0/).
Share and Cite
Hossain, D.; Thomas, J.G.; McCrory, M.A.; Higgins, J.; Sazonov, E. A Systematic Review of Sensor-Based Methods for Measurement of Eating Behavior. Sensors 2025, 25, 2966. https://doi.org/10.3390/s25102966
Hossain D, Thomas JG, McCrory MA, Higgins J, Sazonov E. A Systematic Review of Sensor-Based Methods for Measurement of Eating Behavior. Sensors. 2025; 25(10):2966. https://doi.org/10.3390/s25102966
Chicago/Turabian StyleHossain, Delwar, J. Graham Thomas, Megan A. McCrory, Janine Higgins, and Edward Sazonov. 2025. "A Systematic Review of Sensor-Based Methods for Measurement of Eating Behavior" Sensors 25, no. 10: 2966. https://doi.org/10.3390/s25102966
APA StyleHossain, D., Thomas, J. G., McCrory, M. A., Higgins, J., & Sazonov, E. (2025). A Systematic Review of Sensor-Based Methods for Measurement of Eating Behavior. Sensors, 25(10), 2966. https://doi.org/10.3390/s25102966