

Exploring Near- and Far-Field Effects in Photoplethysmography Signals Across Different Source–Detector Distances

 ,
,  , ,
, ,  and
and
Abstract
1. Introduction
- Identification of near-field effects in PPG systems in reflection mode.
- Methodology to identify the start of the stable far-field region of LEDs.
2. Background and Related Work
LED Light Emission Characteristics

3. Materials and Methods
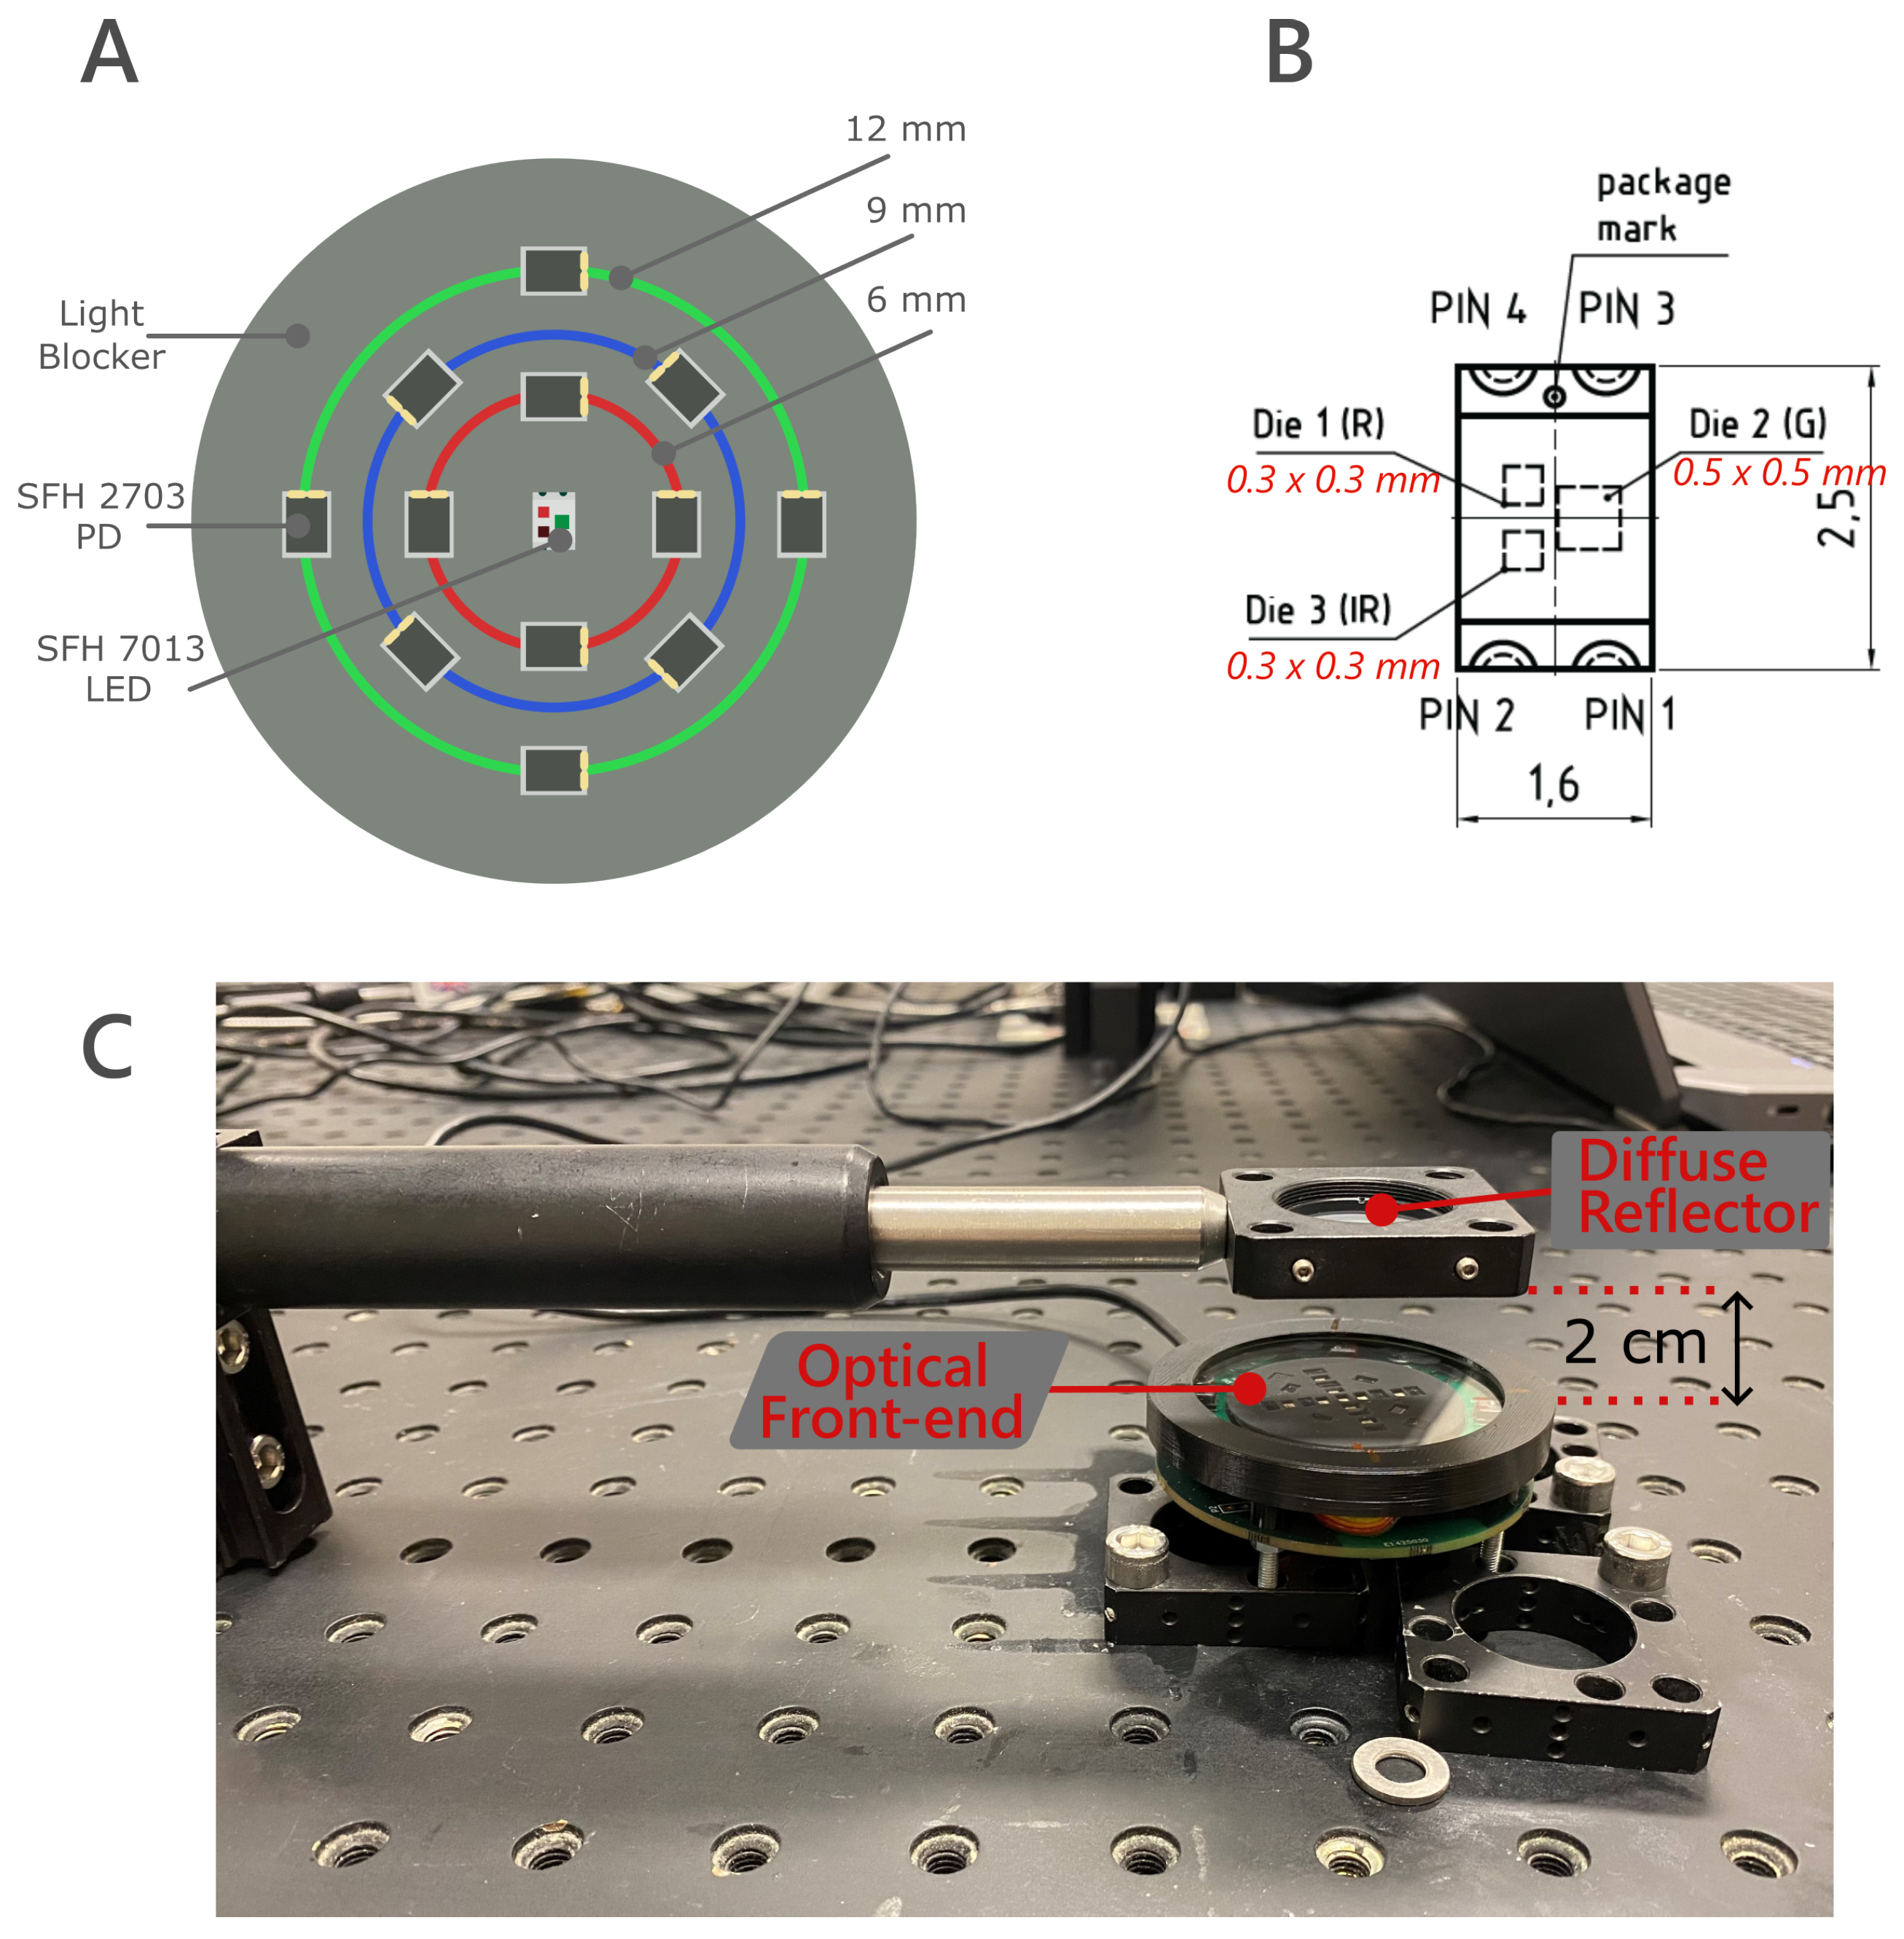
3.1. Lab Experiment
3.2. PPG Signal Acquisition
4. Results
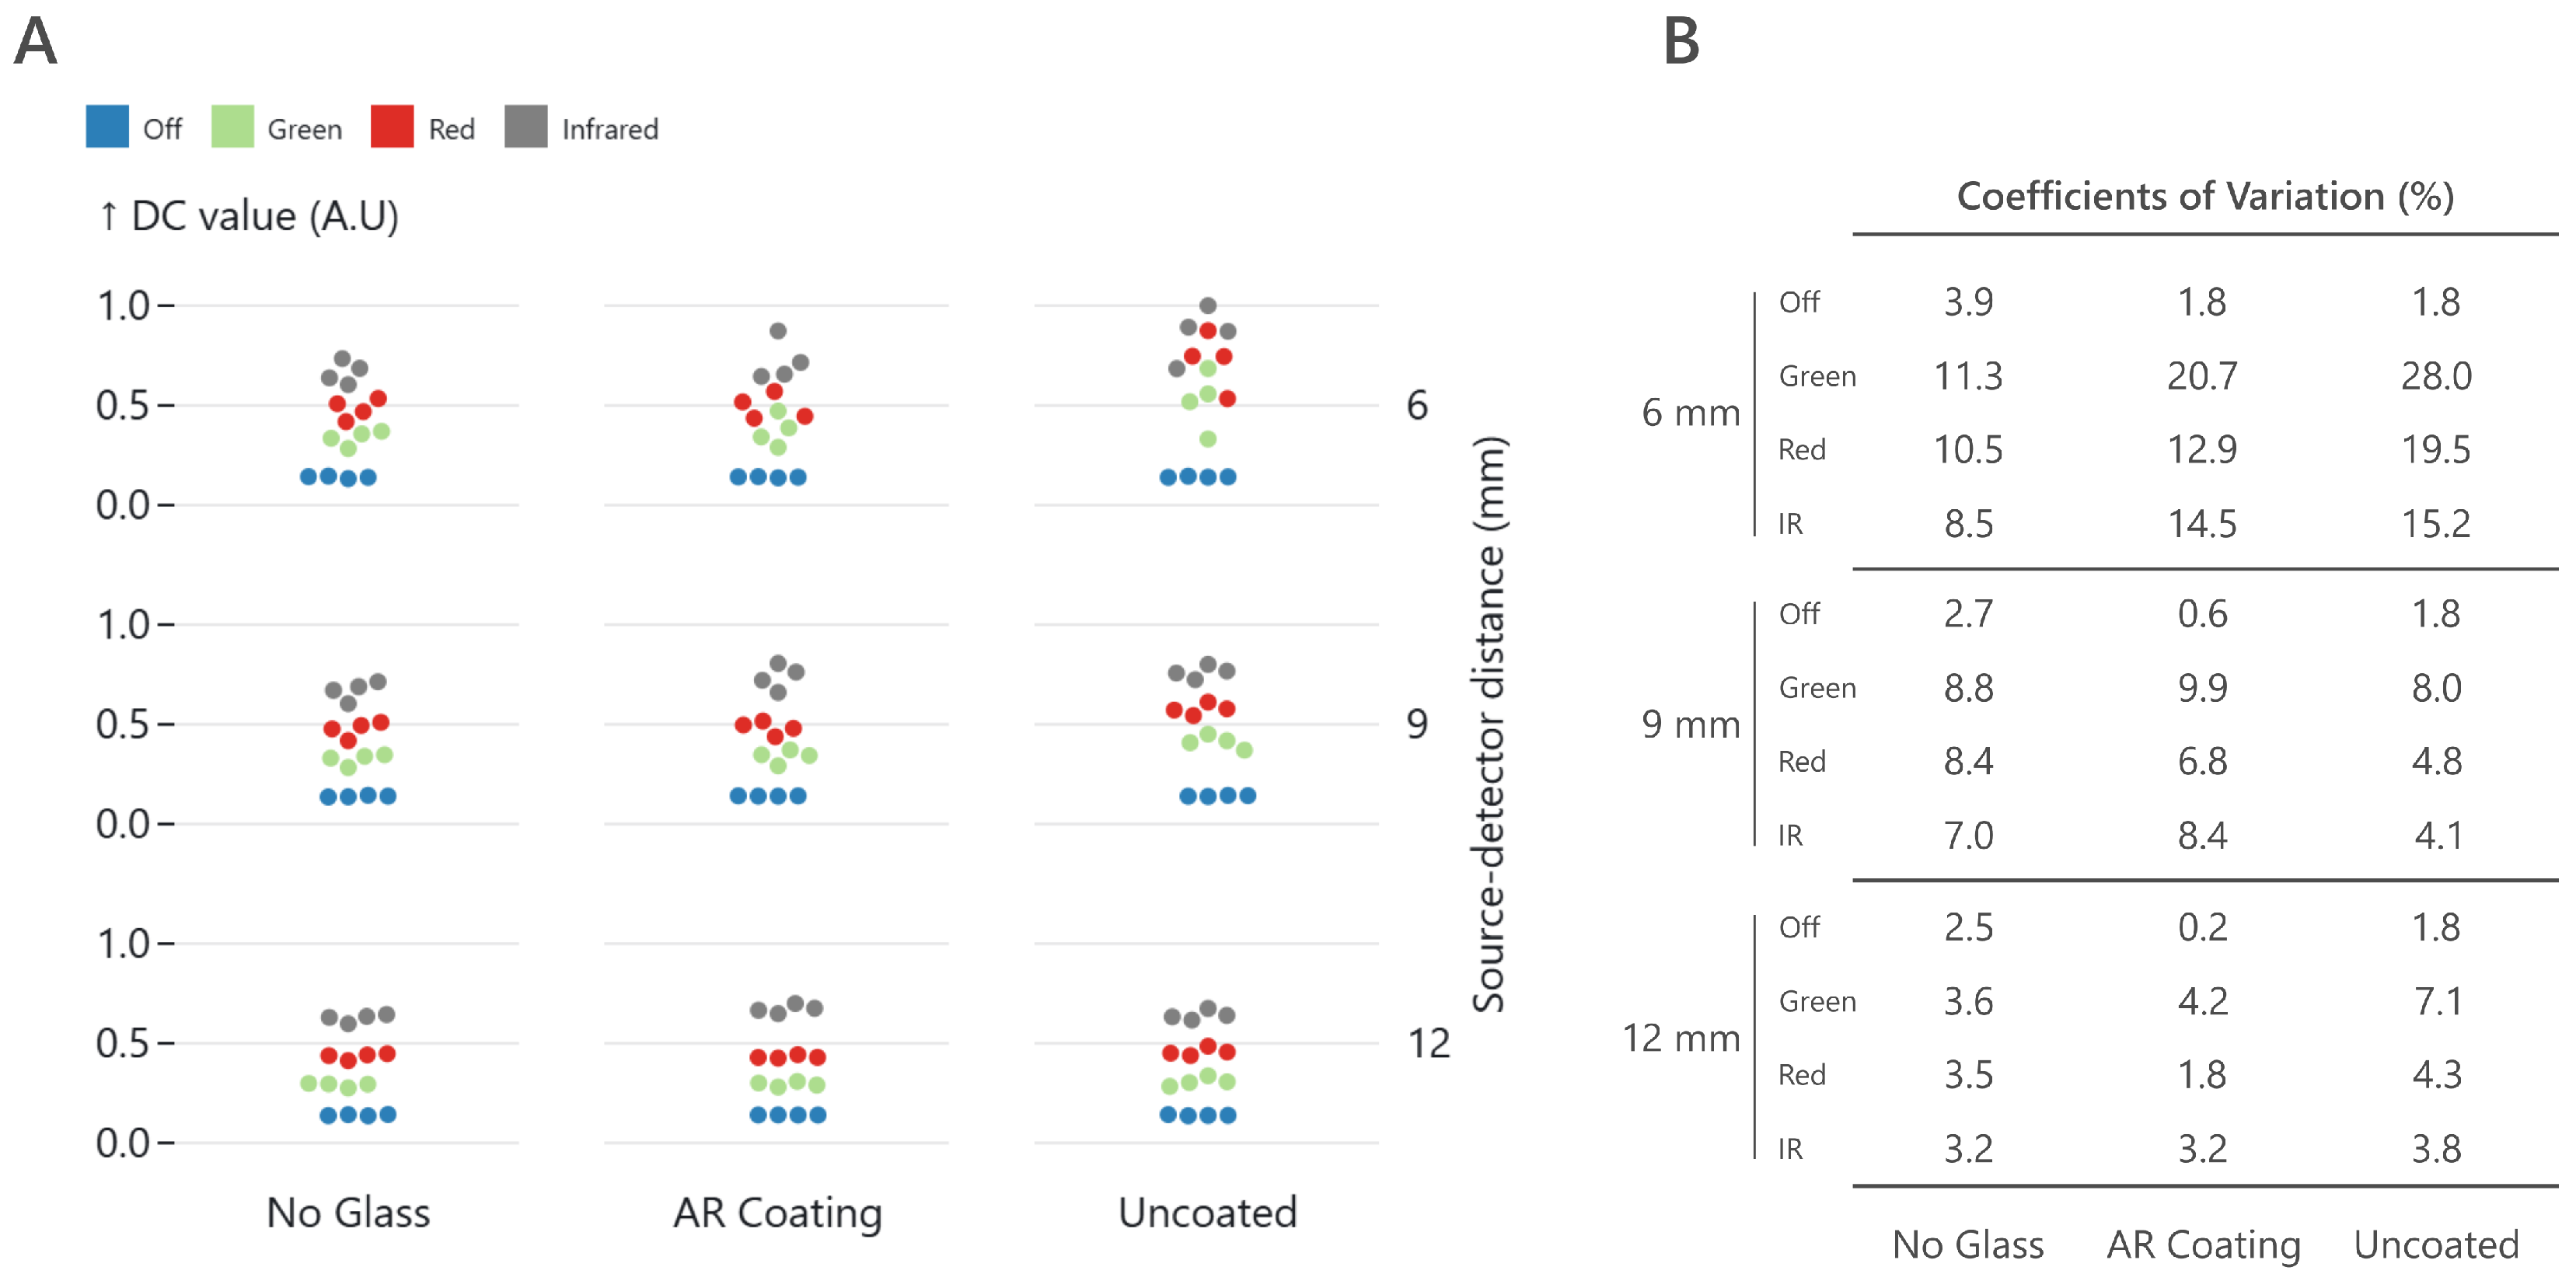
4.1. Lab Experiment
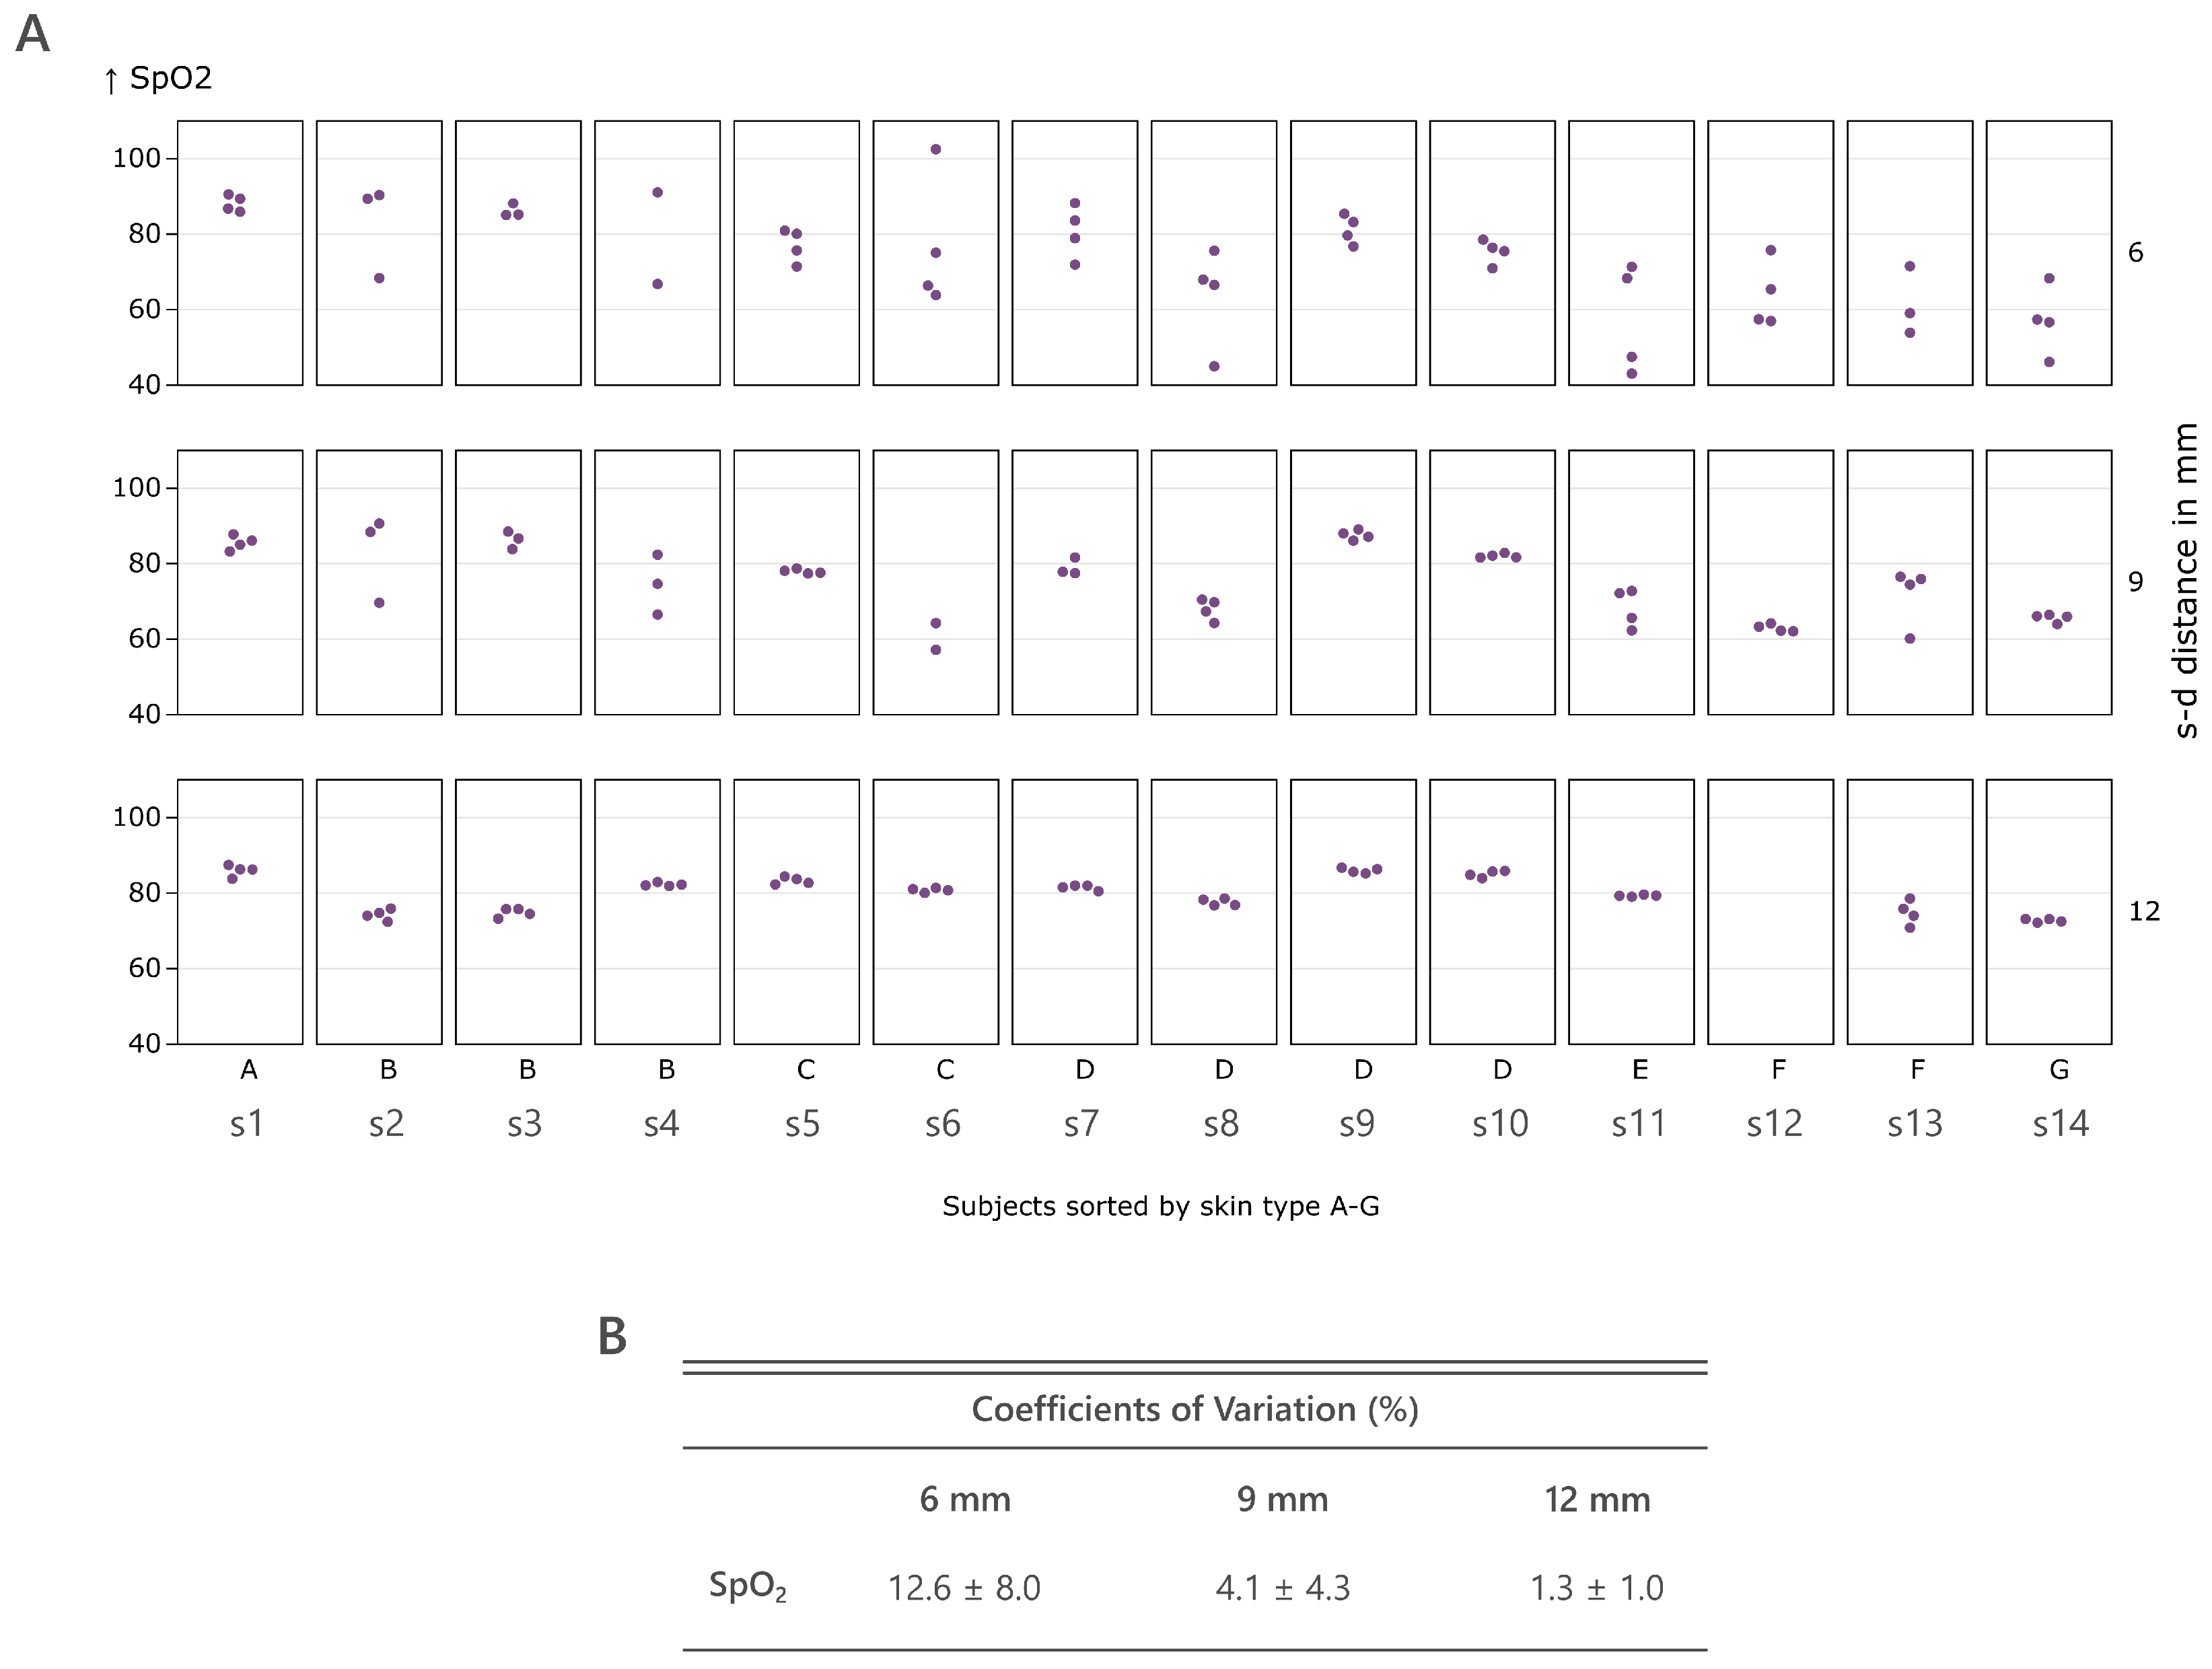
4.2. PPG Signal Acquisition
5. Discussion
5.1. Lab Experiment
5.2. PPG Signal Acquisition
6. Conclusions
Author Contributions
Funding
Institutional Review Board Statement
Informed Consent Statement
Data Availability Statement
Acknowledgments
Conflicts of Interest
References
- Sun, Y.; Thakor, N. Photoplethysmography Revisited: From Contact to Noncontact, from Point to Imaging. IEEE Trans. Biomed. Eng. 2016, 63, 463–477. [Google Scholar] [CrossRef] [PubMed]
- Kyriacou, P.A. Introduction to photoplethysmography. In Photoplethysmography: Technology, Signal Analysis and Applications; Academic Press: Cambridge, MA, USA, 2022; pp. 1–16. [Google Scholar] [CrossRef]
- Charlton, P.H.; Kyriacou, P.A.; Mant, J.; Marozas, V.; Chowienczyk, P.; Alastruey, J. Wearable Photoplethysmography for Cardiovascular Monitoring. Proc. IEEE 2022, 110, 355–381. [Google Scholar] [CrossRef] [PubMed]
- Allen, J. Photoplethysmography and its application in clinical physiological measurement. Physiol. Meas. 2007, 28, 1–39. [Google Scholar] [CrossRef]
- Mejía-Mejía, E.; Allen, J.; Budidha, K.; El-Hajj, C.; Kyriacou, P.A.; Charlton, P.H. Photoplethysmography signal processing and synthesis. In Photoplethysmography: Technology, Signal Analysis and Applications; Academic Press: Cambridge, MA, USA, 2022; pp. 69–146. [Google Scholar] [CrossRef]
- Alian, A.A.; Shelley, K.H. PPG in clinical monitoring. In Photoplethysmography: Technology, Signal Analysis and Applications; Academic Press: Cambridge, MA, USA, 2021; pp. 341–359. [Google Scholar] [CrossRef]
- Fine, J.; Branan, K.L.; Rodriguez, A.J.; Boonya-Ananta, T.; Ajmal; Ramella-Roman, J.C.; McShane, M.J.; Coté, G.L. Sources of inaccuracy in photoplethysmography for continuous cardiovascular monitoring. Biosensors 2021, 11, 126. [Google Scholar] [CrossRef] [PubMed]
- Scardulla, F.; Cosoli, G.; Spinsante, S.; Poli, A.; Iadarola, G.; Pernice, R.; Busacca, A.; Pasta, S.; Scalise, L.; D’Acquisto, L. Photoplethysmograhic sensors, potential and limitations: Is it time for regulation? A comprehensive review. Measurement 2023, 218, 113150. [Google Scholar] [CrossRef]
- Lambert Cause, J.; Solé Morillo, Á.; da Silva, B.; García-Naranjo, J.C.; Stiens, J. Evaluating Vascular Depth-Dependent Changes in Multi-Wavelength PPG Signals Due to Contact Force. Sensors 2024, 24, 2692. [Google Scholar] [CrossRef] [PubMed]
- Morillo, A.S.; Cause, J.L.; Da Silva, B.; Garcia-Naranjo, J.C.; Stiens, J. Effect of the Transimpedance Amplifier Topology on the Photoplethysmography Signal. In Proceedings of the IECON Proceedings (Industrial Electronics Conference), Brussels, Belgium, 17–20 October 2022; IEEE Computer Society: Washington, DC, USA, 2022. [Google Scholar] [CrossRef]
- Budidha, K.; Kyriacou, P.A. Photoplethysmography technology. In Photoplethysmography: Technology, Signal Analysis and Applications; Academic Press: Cambridge, MA, USA, 2022; pp. 43–68. [Google Scholar] [CrossRef]
- Ray, D.; Collins, T.; Woolley, S.; Ponnapalli, P. A Review of Wearable Multi-Wavelength Photoplethysmography. IEEE Rev. Biomed. Eng. 2023, 16, 136–151. [Google Scholar] [CrossRef]
- Han, S.; Roh, D.; Park, J.; Shin, H. Design of multi-wavelength optical sensor module for depth-dependent photoplethysmography. Sensors 2019, 19, 5441. [Google Scholar] [CrossRef]
- Lambert Cause, J.; Solé Morillo, Á.; da Silva, B.; García-Naranjo, J.C.; Stiens, J. Novel Multi-Parametric Sensor System for Comprehensive Multi-Wavelength Photoplethysmography Characterization. Sensors 2023, 23, 6628. [Google Scholar] [CrossRef]
- Sole Morillo, A.; Lambert Cause, J.; Rizk, D.; Da Silva Gomes, B.; Stiens, J.H. Evaluation of the impact of LED viewing angle and optical window choice on photoplethysmography signal quality. In Proceedings of the Optical Fibers and Sensors for Medical Diagnostics, Treatment, and Environmental Applications XXIV, San Francisco, CA, USA, 27–29 January 2024; p. 23. [Google Scholar] [CrossRef]
- Moreno, I.; Sun, C.C. LED array: Where does far-field begin? In Proceedings of the Eighth International Conference on Solid State Lighting, San Diego, CA, USA, 26 August 2008; Volume 7058, pp. 143–151. [Google Scholar] [CrossRef]
- Liu, X.; Cai, W.; Lei, X.; Du, X.; Chen, W. Far-field distance for surface light source with different luminous area. Appl. Opt. 2013, 52, 1629–1635. [Google Scholar] [CrossRef] [PubMed]
- Stover, J.C. Optical Scattering: Measurement and Analysis; SPIE Press: Bellingham, WA, USA, 2012. [Google Scholar]
- Moreno, I. LED irradiance pattern at short distances. Appl. Opt. 2020, 59, 190. [Google Scholar] [CrossRef]
- Ams OSRAM. OSRAM Multi Chip LED, SFH 7013 Multi Color LEDs. Available online: https://ams-osram.com/products/leds/multi-color-leds/osram-multi-chip-led-sfh-7013 (accessed on 14 November 2024).
- Lo, Y.C.; Hsieh, C.C.; Moreno, I.; Chien, W.T.; Sun, C.C. Analysis of the far-field region of LEDs. Opt. Express 2009, 17, 13918–13927. [Google Scholar] [CrossRef]
- Everitt, B. The Cambridge Dictionary of Statistics, 4th ed.; Cambridge University Press: Cambridge, UK, 1998; p. 360. [Google Scholar]
- Brown, C.E. Coefficient of Variation. In Applied Multivariate Statistics in Geohydrology and Related Sciences; Springer: Berlin/Heidelberg, Germany, 1998; pp. 155–157. [Google Scholar] [CrossRef]
- Charlton, P.H.; Kyriacou, P.; Mant, J.; Alastruey, J. Acquiring Wearable Photoplethysmography Data in Daily Life: The PPG Diary Pilot Study. Eng. Proc. 2020, 2, 80. [Google Scholar] [CrossRef]
- Elgendi, M. PPG Signal Analysis: An Introduction Using MATLAB; CRC Press: Boca Raton, FL, USA, 2021. [Google Scholar]
- Orphanidou, C. Signal Quality Assessment in Physiological Monitoring State of the Art and Practical Considerations; Springer: Berlin/Heidelberg, Germany, 2018. [Google Scholar]
- Lambert Cause, J.; Solé Morillo, Á.; García-Naranjo, J.C.; Stiens, J.; da Silva, B. The Impact of Contact Force on Signal Quality Indices in Photoplethysmography Measurements. Appl. Sci. 2024, 14, 5704. [Google Scholar] [CrossRef]
- Abay, T.Y.; Kyriacou, P.A. Photoplethysmography in oxygenation and blood volume measurements. In Photoplethysmography: Technology, Signal Analysis and Applications; Academic Press: Cambridge, MA, USA, 2022; pp. 147–188. [Google Scholar] [CrossRef]
- ISO 80601-2-61:2017; Medical Electrical Equipment—Part 2-61: Particular Requirements for Basic Safety and Essential Performance of Pulse Oximeter Equipment. International Organization for Standardization (ISO): Geneva, Switzerland, 2017.
- Chatterjee, S.; Budidha, K.; Kyriacou, P.A. Investigating the origin of photoplethysmography using a multiwavelength monte carlo model. Physiol. Meas. 2020, 41, 084001. [Google Scholar] [CrossRef] [PubMed]


| Demographic Data | Values |
|---|---|
| Age (y) | |
| Gender (M/F) | 13/1 |
| BMI | |
| Skin Tone (MST) | A(1), B(3), C(2), D(4), E(1), F(2), G(1) |
| Temperature (°C) | |
| PR | |
| SpO2 |
| Active Area | LED Package | |
|---|---|---|
| Green | 2.9 mm | 9.2 mm |
| Red | 1.7 mm | 9.2 mm |
| Infrared | 1.7 mm | 9.2 mm |
Disclaimer/Publisher’s Note: The statements, opinions and data contained in all publications are solely those of the individual author(s) and contributor(s) and not of MDPI and/or the editor(s). MDPI and/or the editor(s) disclaim responsibility for any injury to people or property resulting from any ideas, methods, instructions or products referred to in the content. |
© 2024 by the authors. Licensee MDPI, Basel, Switzerland. This article is an open access article distributed under the terms and conditions of the Creative Commons Attribution (CC BY) license (https://creativecommons.org/licenses/by/4.0/).
Share and Cite
Solé Morillo, Á.; Cause, J.L.; De Pauw, K.; Silva, B.d.; Stiens, J. Exploring Near- and Far-Field Effects in Photoplethysmography Signals Across Different Source–Detector Distances. Sensors 2025, 25, 99. https://doi.org/10.3390/s25010099
Solé Morillo Á, Cause JL, De Pauw K, Silva Bd, Stiens J. Exploring Near- and Far-Field Effects in Photoplethysmography Signals Across Different Source–Detector Distances. Sensors. 2025; 25(1):99. https://doi.org/10.3390/s25010099
Chicago/Turabian StyleSolé Morillo, Ángel, Joan Lambert Cause, Kevin De Pauw, Bruno da Silva, and Johan Stiens. 2025. "Exploring Near- and Far-Field Effects in Photoplethysmography Signals Across Different Source–Detector Distances" Sensors 25, no. 1: 99. https://doi.org/10.3390/s25010099
APA StyleSolé Morillo, Á., Cause, J. L., De Pauw, K., Silva, B. d., & Stiens, J. (2025). Exploring Near- and Far-Field Effects in Photoplethysmography Signals Across Different Source–Detector Distances. Sensors, 25(1), 99. https://doi.org/10.3390/s25010099