1. Introduction
Grating interferometry (GI), known in the relevant literature as High-Sensitivity Moiré Interferometry, is a full-field optical method used for in-plane displacement and strain measurement [
1,
2]. In addition to its high sensitivity, GI has a unique feature compared to other displacement measurement methods—the specimen grating retains the “memory” of its initial state, which means that all successive measurements have the same reference (the moment when the grating was attached to the specimen surface), which allows one to obtain information about the cumulative displacement between the measurement periods and enables the monitoring of the state of the tested specimen at any time. Measurement systems and sensors based on GI have many applications as they can be used in the study of composite materials [
3], in electronics and MEMS micro-elements [
4], in joint analysis [
5], in biomechanics [
6], etc. [
7].
Grating interferometry has seen numerous design solutions over the years [
8,
9]. Among these solutions, sensors incorporating a microinterferometric waveguide head [
10] have shown significant promise. The concept of the conventional waveguide grating microinterferometric sensor is schematically illustrated in
Figure 1. The microinterferometric head comprises reflective surfaces—the top (MT), right (MR), and left (ML) surfaces—and a diffraction grating (DG). A specimen grating (SG) with the same spatial frequency as the DG is affixed to the object under examination. A collimated light beam (B) from a diode laser (DL) illuminates the diffraction grating, causing diffraction. The beam of the first positive diffraction order, after reflecting off the MR surface and then the MT surface, illuminates the specimen grating at the angle θ of the first diffraction order. The beam of the first negative diffraction order, after reflecting off the MT surface and then the ML surface, symmetrically illuminates the specimen grating. In this scenario, beams BL1 and BR1, diffracted by the specimen grating, propagate along the normal grating surface and cause interference. The intensity distribution, captured by a video camera (MD), is described by the following equation:
where d is the period of the specimen grating and u(x,y) is the function describing the in-plane displacements of the object under test.
This implies that the recorded interferogram contains information about the distribution of in-plane displacements across the entire field of view. The sensitivity of this measurement is high, equivalent to half the period of the grating (d/2). For a typical grating with a spatial frequency of f = 1200 lines/mm, the basic sensitivity is approximately d/2 = 1/2f = 0.417 µm.
Owing to the symmetry of the head configuration and the identical spatial frequencies of both gratings, the grating microinterferometer is achromatic and resistant to vibrations [
11].
To analyse the obtained interferograms, various methods of automatic fringe pattern analysis (AFPA) can be employed, such as the Fourier Transform, Temporary Phase Shifting (TPS), and Carrier Frequency Phase Shifting (CFPS) [
12,
13]. The TPS method is often preferred in many applications. It necessitates the registration of at least three interferograms with fringes shifted by a known phase. In a displacement sensor with a conventional grating microinterferometer head, the phase shift can essentially only be achieved by a very precise movement of the head over the specimen grating. This is a complex and costly solution. Moreover, this sequential acquisition of interferograms over time requires highly stable conditions, which limits the use of the sensor to measurements of static objects.
These challenges can be addressed by using the Polarization Phase Shifting (PPS) method with a specialized video camera equipped with a polarization-sensitive subpixel mask [
14]. Regrettably, the conventional grating microinterferometer head is insensitive to the polarization state due to the equal number of reflections of the propagating beams. This implies that the polarization state of the output beams will be identical for each polarization of the illuminating beam, rendering the implementation of the PPS method impossible.
The next section of this paper introduces a novel modification to the grating microinterferometry head, which enables the implementation of the polarization method to shift the phases of interference fringes.
2. Concept of a Grating Microinterferometric Head with Polarization Phase Shift
The proposed new waveguide grating microinterferometer is schematically depicted in
Figure 2. The configuration of this microinterferometric head is almost the same as that of the conventional head described earlier, although there is one key difference: the MR reflective surface has been replaced by two reflective surfaces (MR1 and MR2). The optical path of the BR beam is now extended, and notably, the number of specular reflections is one reflection greater than the number of reflections of the BL beam.
A full analysis of the influence of the reflecting surface material on the changes in beam polarization after reflection is described in the next section. For now, we will ignore the influence of reflecting surfaces on the wave’s amplitude coefficients and only take into account the fact that after a light wave is reflected, the phase of the component perpendicular to the plane of incidence changes by 180 degrees. Consequently, in the event of the linear polarization of the illuminating beam at an angle of +45 degrees to the plane of incidence, the BR beam, after three reflections, will be linearly polarized at the same angle of +45 degrees. Conversely, the BL beam, after two reflections, will be linearly polarized at an angle of −45 degrees. This implies that the output beams have linear and mutually orthogonal polarizations.
It is now feasible to employ a phase shift polarization system, which has been documented in the literature and comprises a quarter-wave plate and a rotating polarizer [
15] or a matrix of polarizers with the appropriate orientation integrated with the pixels of the photosensitive matrix detector with the polarization mask (PMD) [
16].
When a quarter-wave plate (QWP) is inserted at an angle of 45 degrees to the directions of the mutually orthogonal linear polarizations of the output beams, the polarization of these beams behind the quarter-wave plate becomes circular, left-handed, and right-handed, respectively. Subsequently, after passing through a polarizer oriented at an angle α, the beams will be linearly polarized in the same direction but with a phase shift of 2α. The beams can now interfere, and the observed intensity distribution can be described by the following equation:
where α is the orientation angle of the polarizer axis.
Despite the simplicity of this head modification, it introduces a significant improvement, namely, the fact that it allows for the application of the automated Temporary Phase Shifting (TPS) method for analysing the interference image captured in a single frame. This enhancement not only increases the measurement accuracy but also expands the sensor’s applicability to the study of time-varying objects. However, due to the difference in the optical paths of the propagating beams, the proposed microinterferometer loses its achromatic property, necessitating the use of a laser as the light source. This trade-off is a crucial aspect to consider in the practical implementation of the proposed system.
3. Design and Numerical Simulation
Building upon the concept delineated in the preceding section, an actual grating microinterferometer head was designed and developed. This head is tailored for use with reflection diffraction gratings at a spatial frequency of 1200 lines/mm and with laser light with a wavelength of λ = 632.8 nm. This means that will be possible to measure in-plane displacements with a basic sensitivity of d/2 = 0.417 µm/fringe, and after using the phase shifting method, with a theoretical resolution of 0.01 of the fringe, i.e., about 4 nm. The measurement field, limited by the input and output windows, is as follows: 2 mm × 2 mm. The spatial resolution depends on the resolution of the photosensitive matrix, and for the proposed camera, it is 2448 × 2048 pixels [
16]. The framerate is equal to 24 FPS.
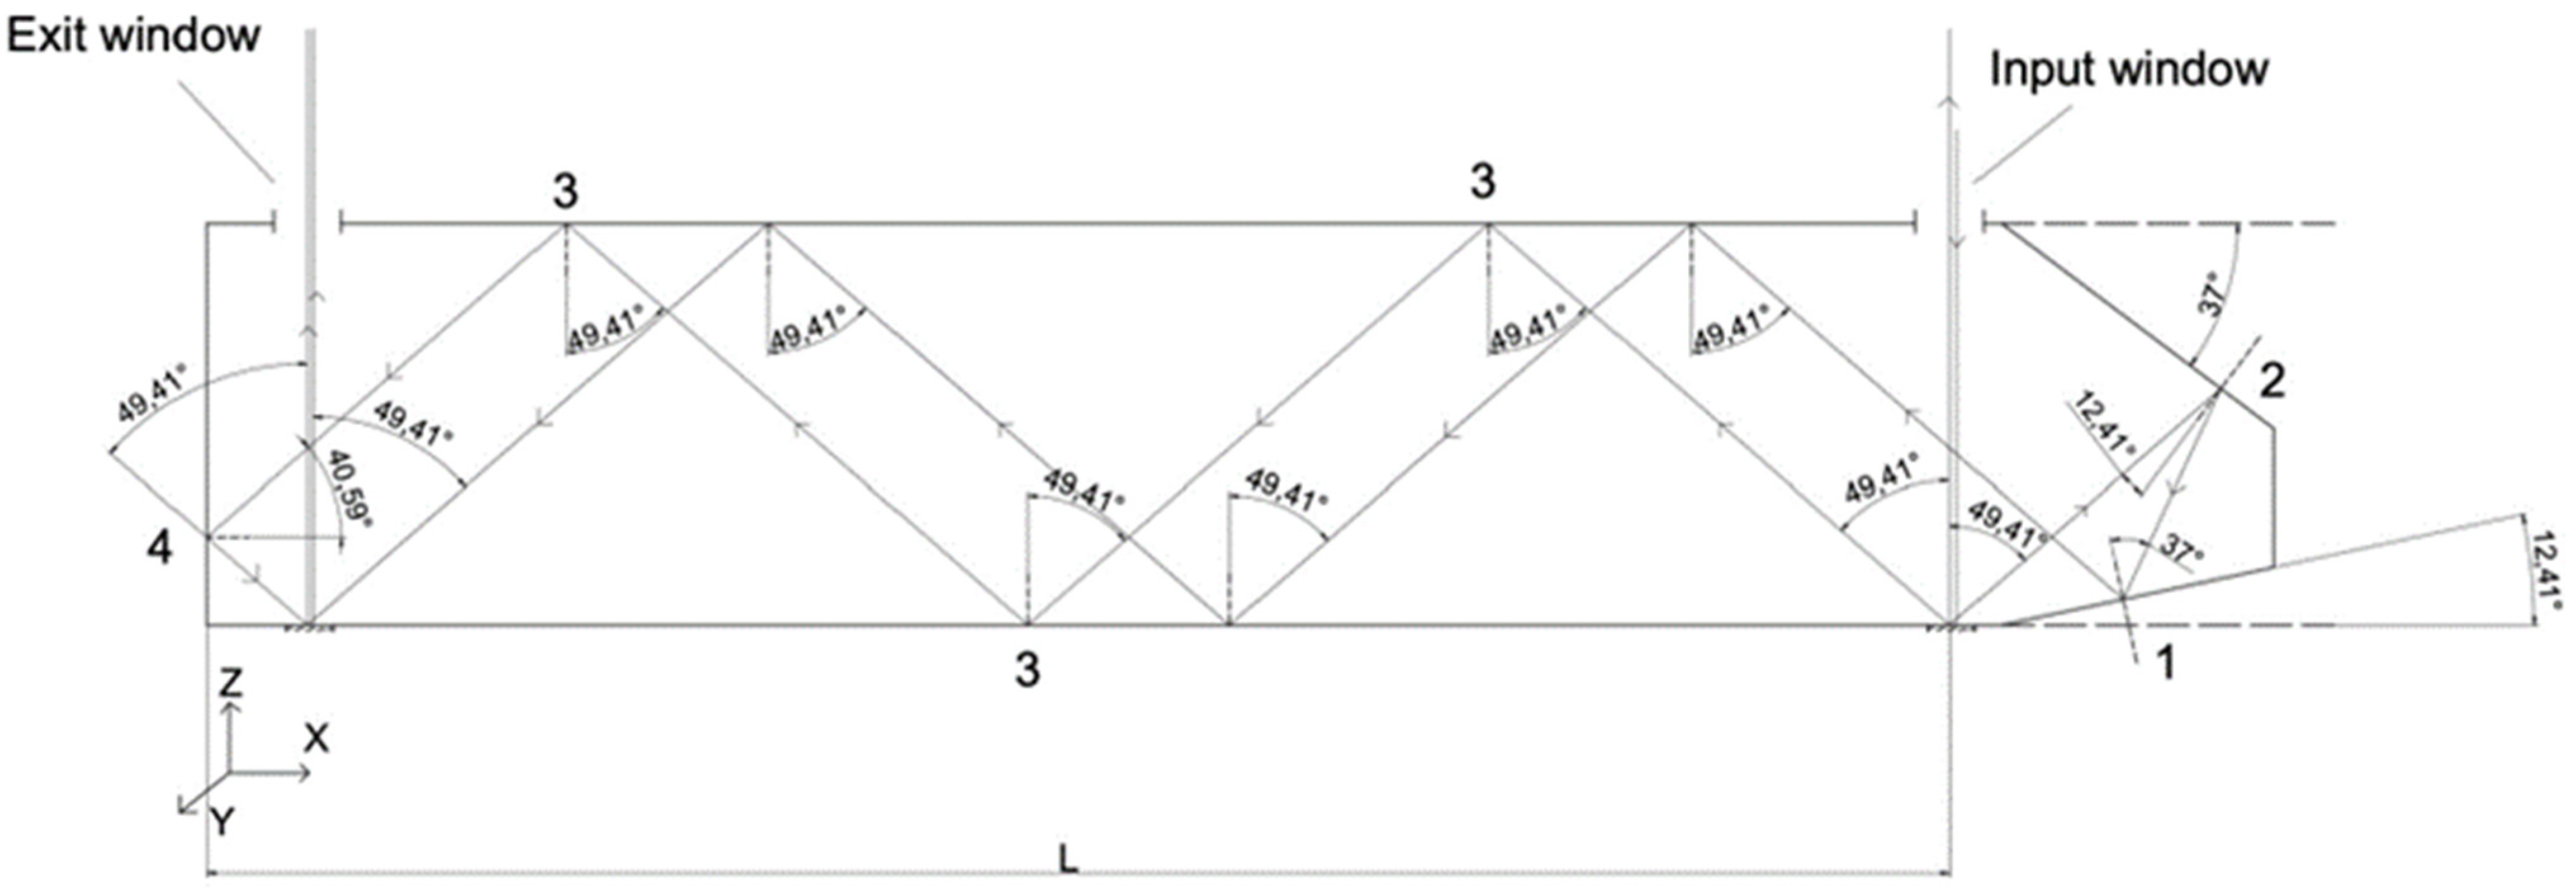
The head is a type of cavity waveguide that has mirror surfaces coated with an aluminium layer. It is also feasible for the beams to enter and exit through windows in the upper mirror, resulting in an asymmetry at the MR1/MR2 corner. Owing to the necessity to accommodate the lighting and detection system, the length (L) of the designed head is twice the length (LM) of the basic head module depicted in
Figure 2. It is worth noting that the length of the head can be extended by incorporating additional basic modules. The final geometry of the developed head is illustrated in
Figure 3 and is as follows: a length of 50.8 mm and a height of 11.6 mm.
To verify the polarization properties of the microinterferometer head designed in this manner, numerical simulations were conducted using the MATLAB v. R2023b platform. Jones matrices were employed to analyse the polarization state of both output beams [
17,
18]. It is important to note that this analysis sufficiently demonstrated that a polarization state of the input beam exists, for which the output beams will be linearly and orthogonally polarized relative to each other. This can be verified by analysing the contrast of the interference fringes, which, for the aforementioned situation, should diminish to zero.
Using the Jones matrix, the polarization state of the output beams can be described by the following equations:
where
- -
[E1] and [E2] are the matrixes describing the amplitudes and phase of the output beams:
- -
[E0] is the matrix describing the amplitudes and phase of the illuminating beam:
- -
[S] is the matrix describing the influence of the diffraction grating on the polarization of the diffracted beam
The coefficients were determined experimentally for the reflection grating at a spatial frequency of 1200 lines/mm by measuring the intensity of the diffracted beam under illumination with a linearly polarized beam perpendicular and parallel to the grid and are as follows:
s+ = 0.18 and
s‖ = 0.14, respectively. The phase was estimated based on the literature [
19], as follows:
δs = 1.22 rad.
- -
[Jk] are the matrixes describing the influence of the aluminium mirrors’ reflection:
The index
k denotes the matrix for the following incident angles:
θ1 = 12.41°,
θ2 = 37°,
θ3 = 49.41°, and
θ4 = 40.59° (see
Figure 3). The values of the amplitude components and the phase for each angle of incidence were determined using Fresnel’s formulas, assuming the refractive index of aluminium is as follows:
n = 1.37289 +
i7.617691. We also assumed that the refractive index of the medium (air) between the reflecting surfaces is as follows:
n = 1.0003.
Then, the intensity was determined numerically using the following relationship:
where “x” denotes the Kronecker product of the matrixes and “
H” represents the Hermitian conjugate of the matrix.
Finally, the contrast of the interference fringes was determined based on the following standard equation:
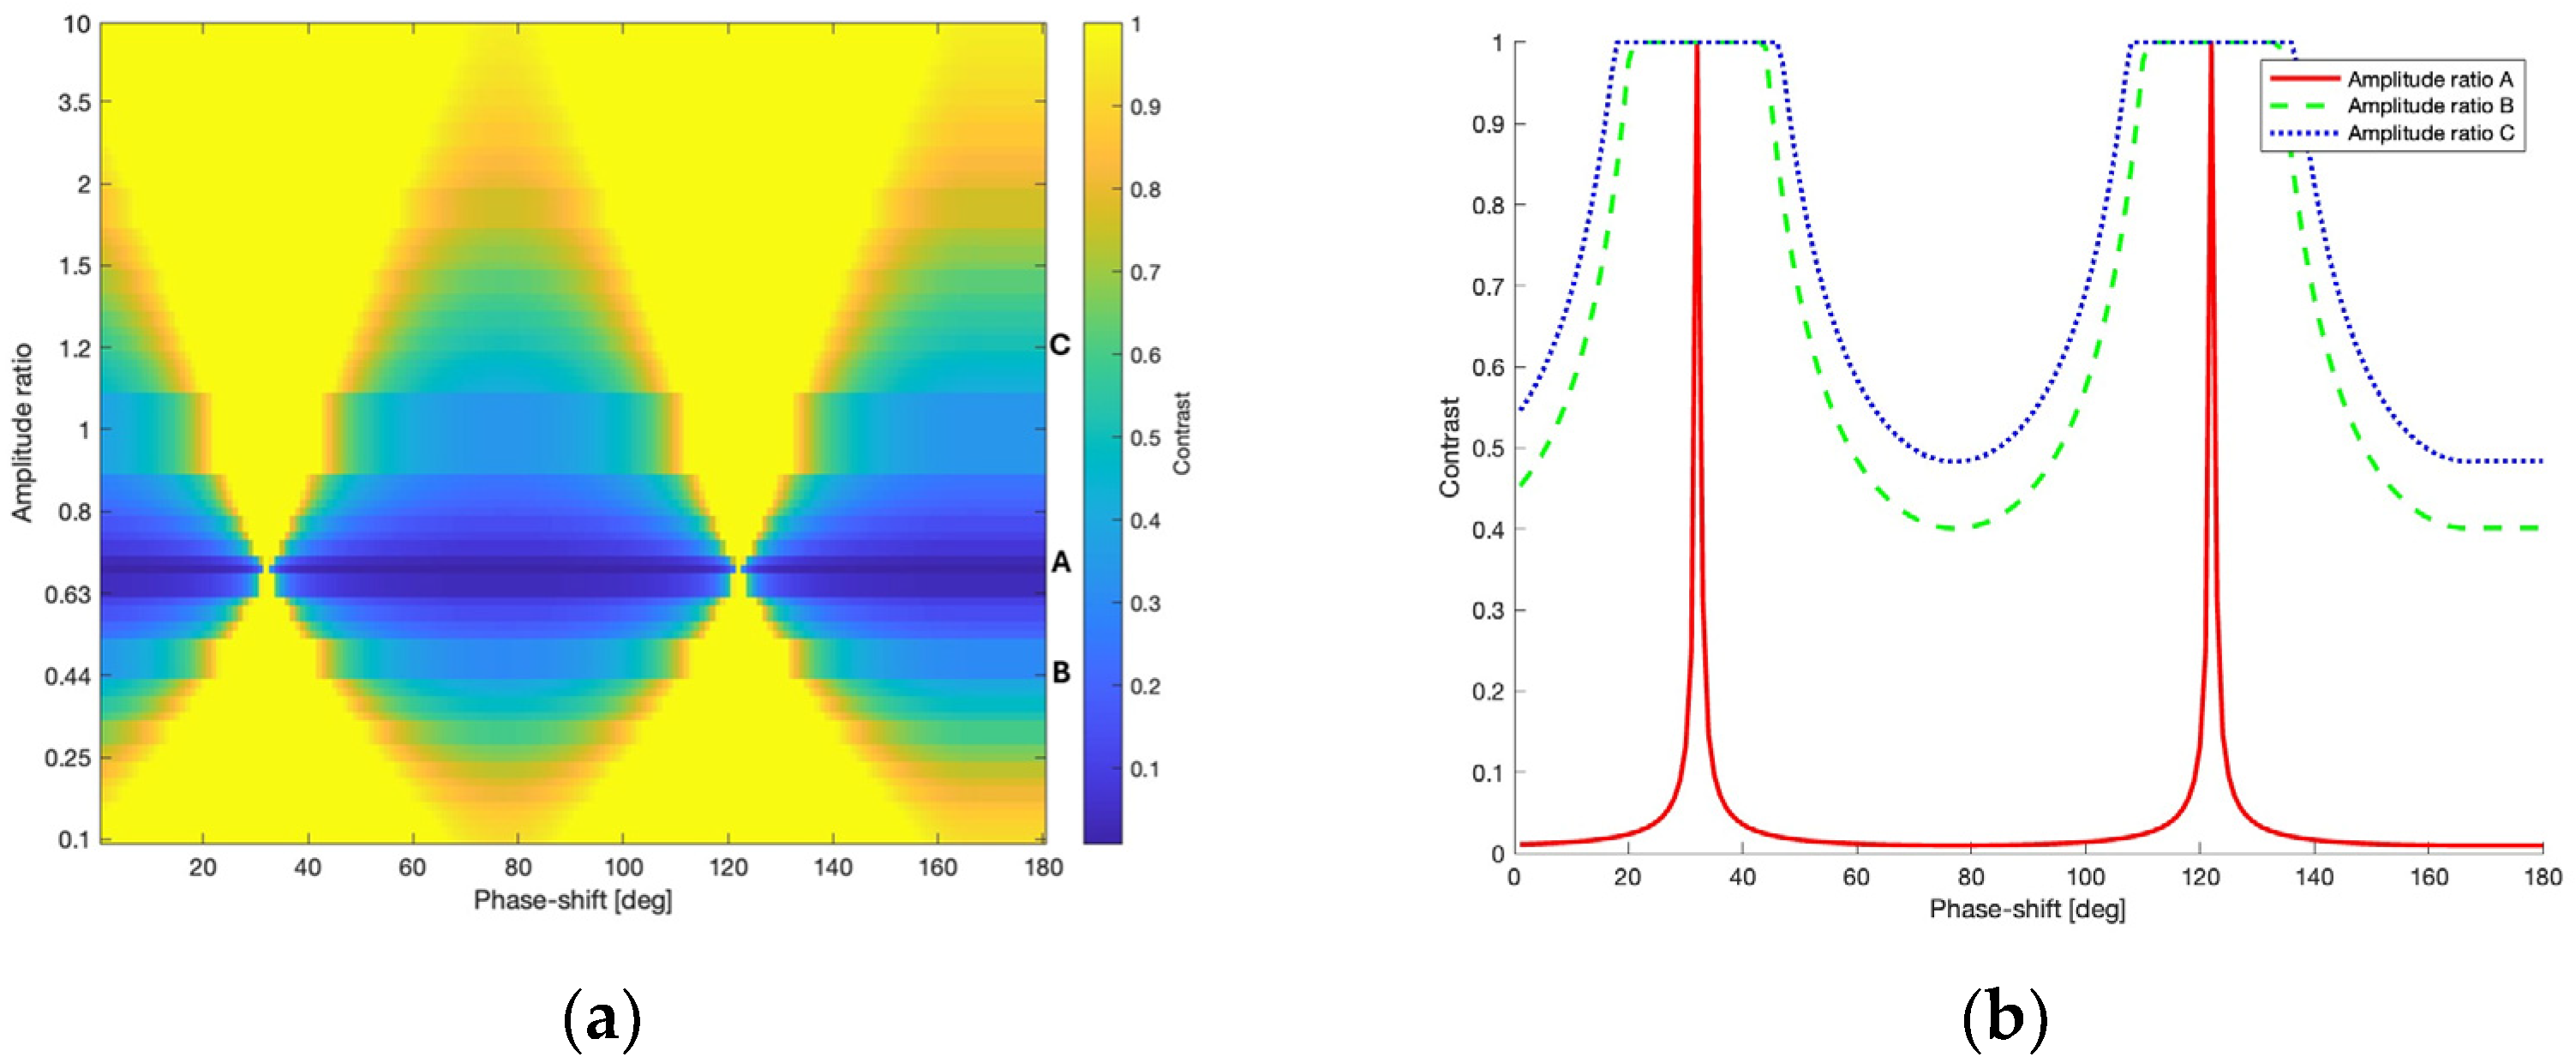
The calculations were carried out using various ratios of the components of the illuminating beam (
E0x/
E0y), ranging from 0.1 to 10 for all combinations of
E0x and
E0y amplitude values, both in the range of 0.1 to 1 with a step of 0.1, and with a phase difference
δwe in the range of 0 to 180°. The result is presented in
Figure 4a in the form of a 2D diagram.
Then, the algorithm finds the value of the ratio of the amplitudes of the components of the illuminating beam for which the contrast reaches a minimum value close to zero. In our case, this ratio is 0.7.
Figure 4b shows the contrast plot for this value (line A) and, for example, for amplitude ratios of 0.44 (line B) and 1.2 (line C). From plot (A), it can be seen that a contrast close to zero, indicating orthogonal polarizations of the output beams, can be obtained for various phase shifts between the components of the illuminating beam. The next step is to determine, based on Formulas (3) and (4), the phase shift for which the output beams are additionally linearly polarized.
To conclude, the analysis of the acquired data revealed that the fringe contrast reaches the minimum ratio of the polarization components of the illuminating beam at 0.7 (E0X = 0.7 and E0Y = 1) and a phase shift of 167°. Subsequently, the polarization parameters of the output beams are as follows: the amplitude ratio for the first beam is E1X/E1Y = 1.005, with a phase shift of δ1 = 181.30°, and for the second beam, it is E2X/E2Y = 1.002, with δ2 = 1.52°. This implies that the beams are practically linearly polarized at angles of ±45°, rendering them mutually orthogonal, a prerequisite for implementing the PPS method. In this scenario, to ensure the appropriate polarization of the input beam, a polarization compensator (phase plate) would be necessary. However, in practice, using a half-wave plate that rotates the polarization plane of the illuminating beam by an angle of approximately arctan(0.7) ≈ 35° may be sufficient.
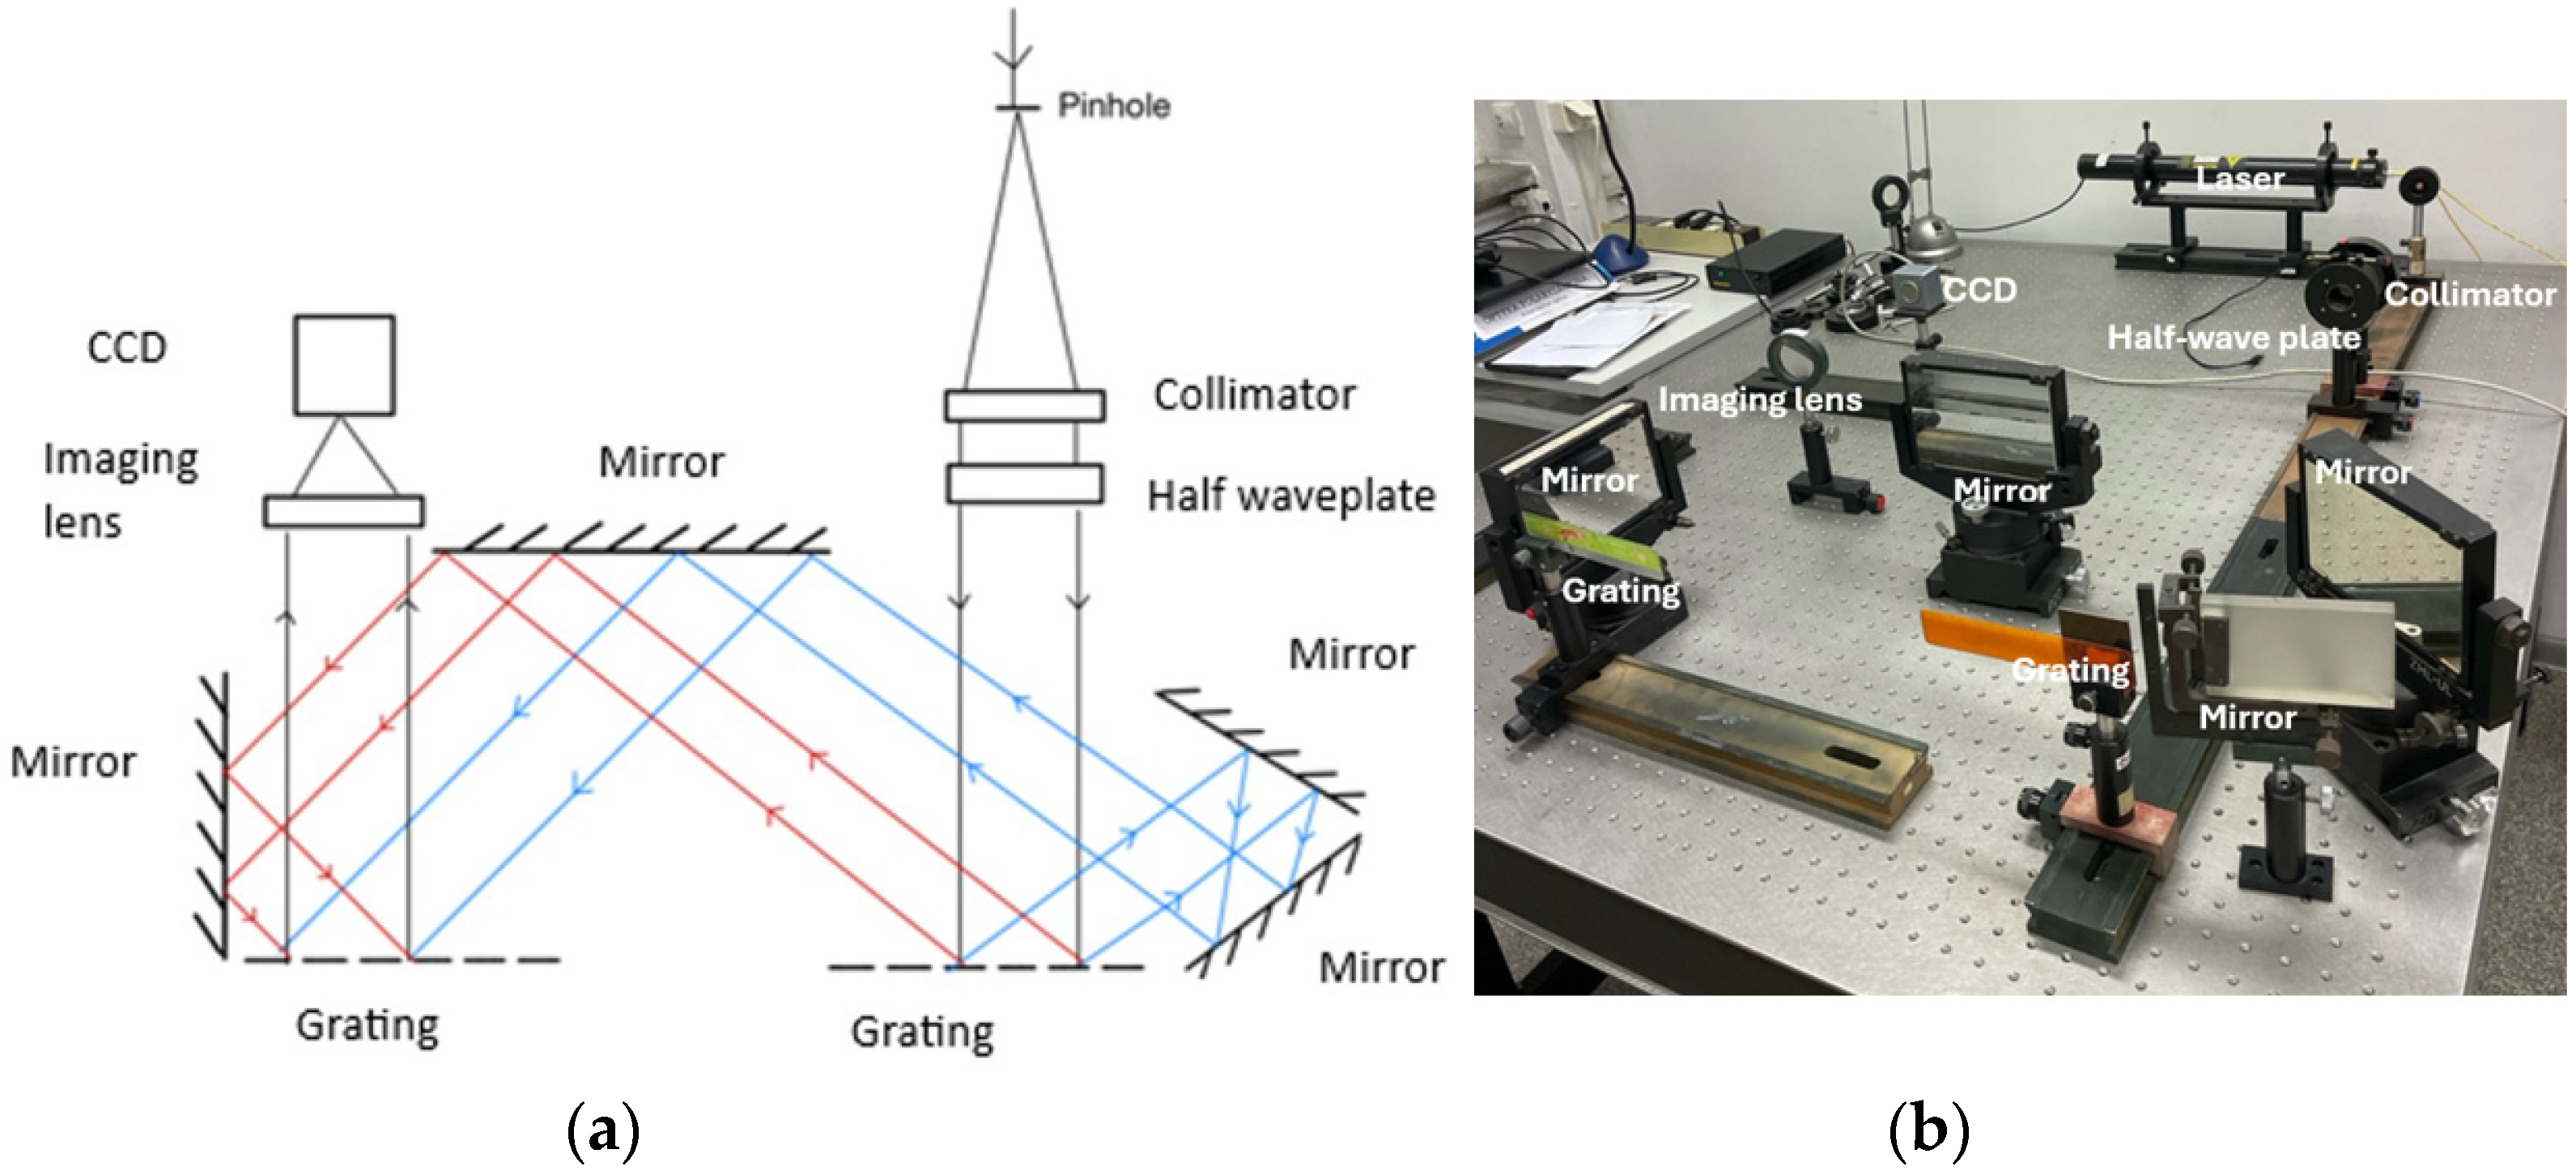
4. Experimental Work
To experimentally validate the described grating microinterferometer head as a displacement sensor, preliminary experimental tests were conducted. A schematic and macro-scale photograph of the laboratory system are presented in
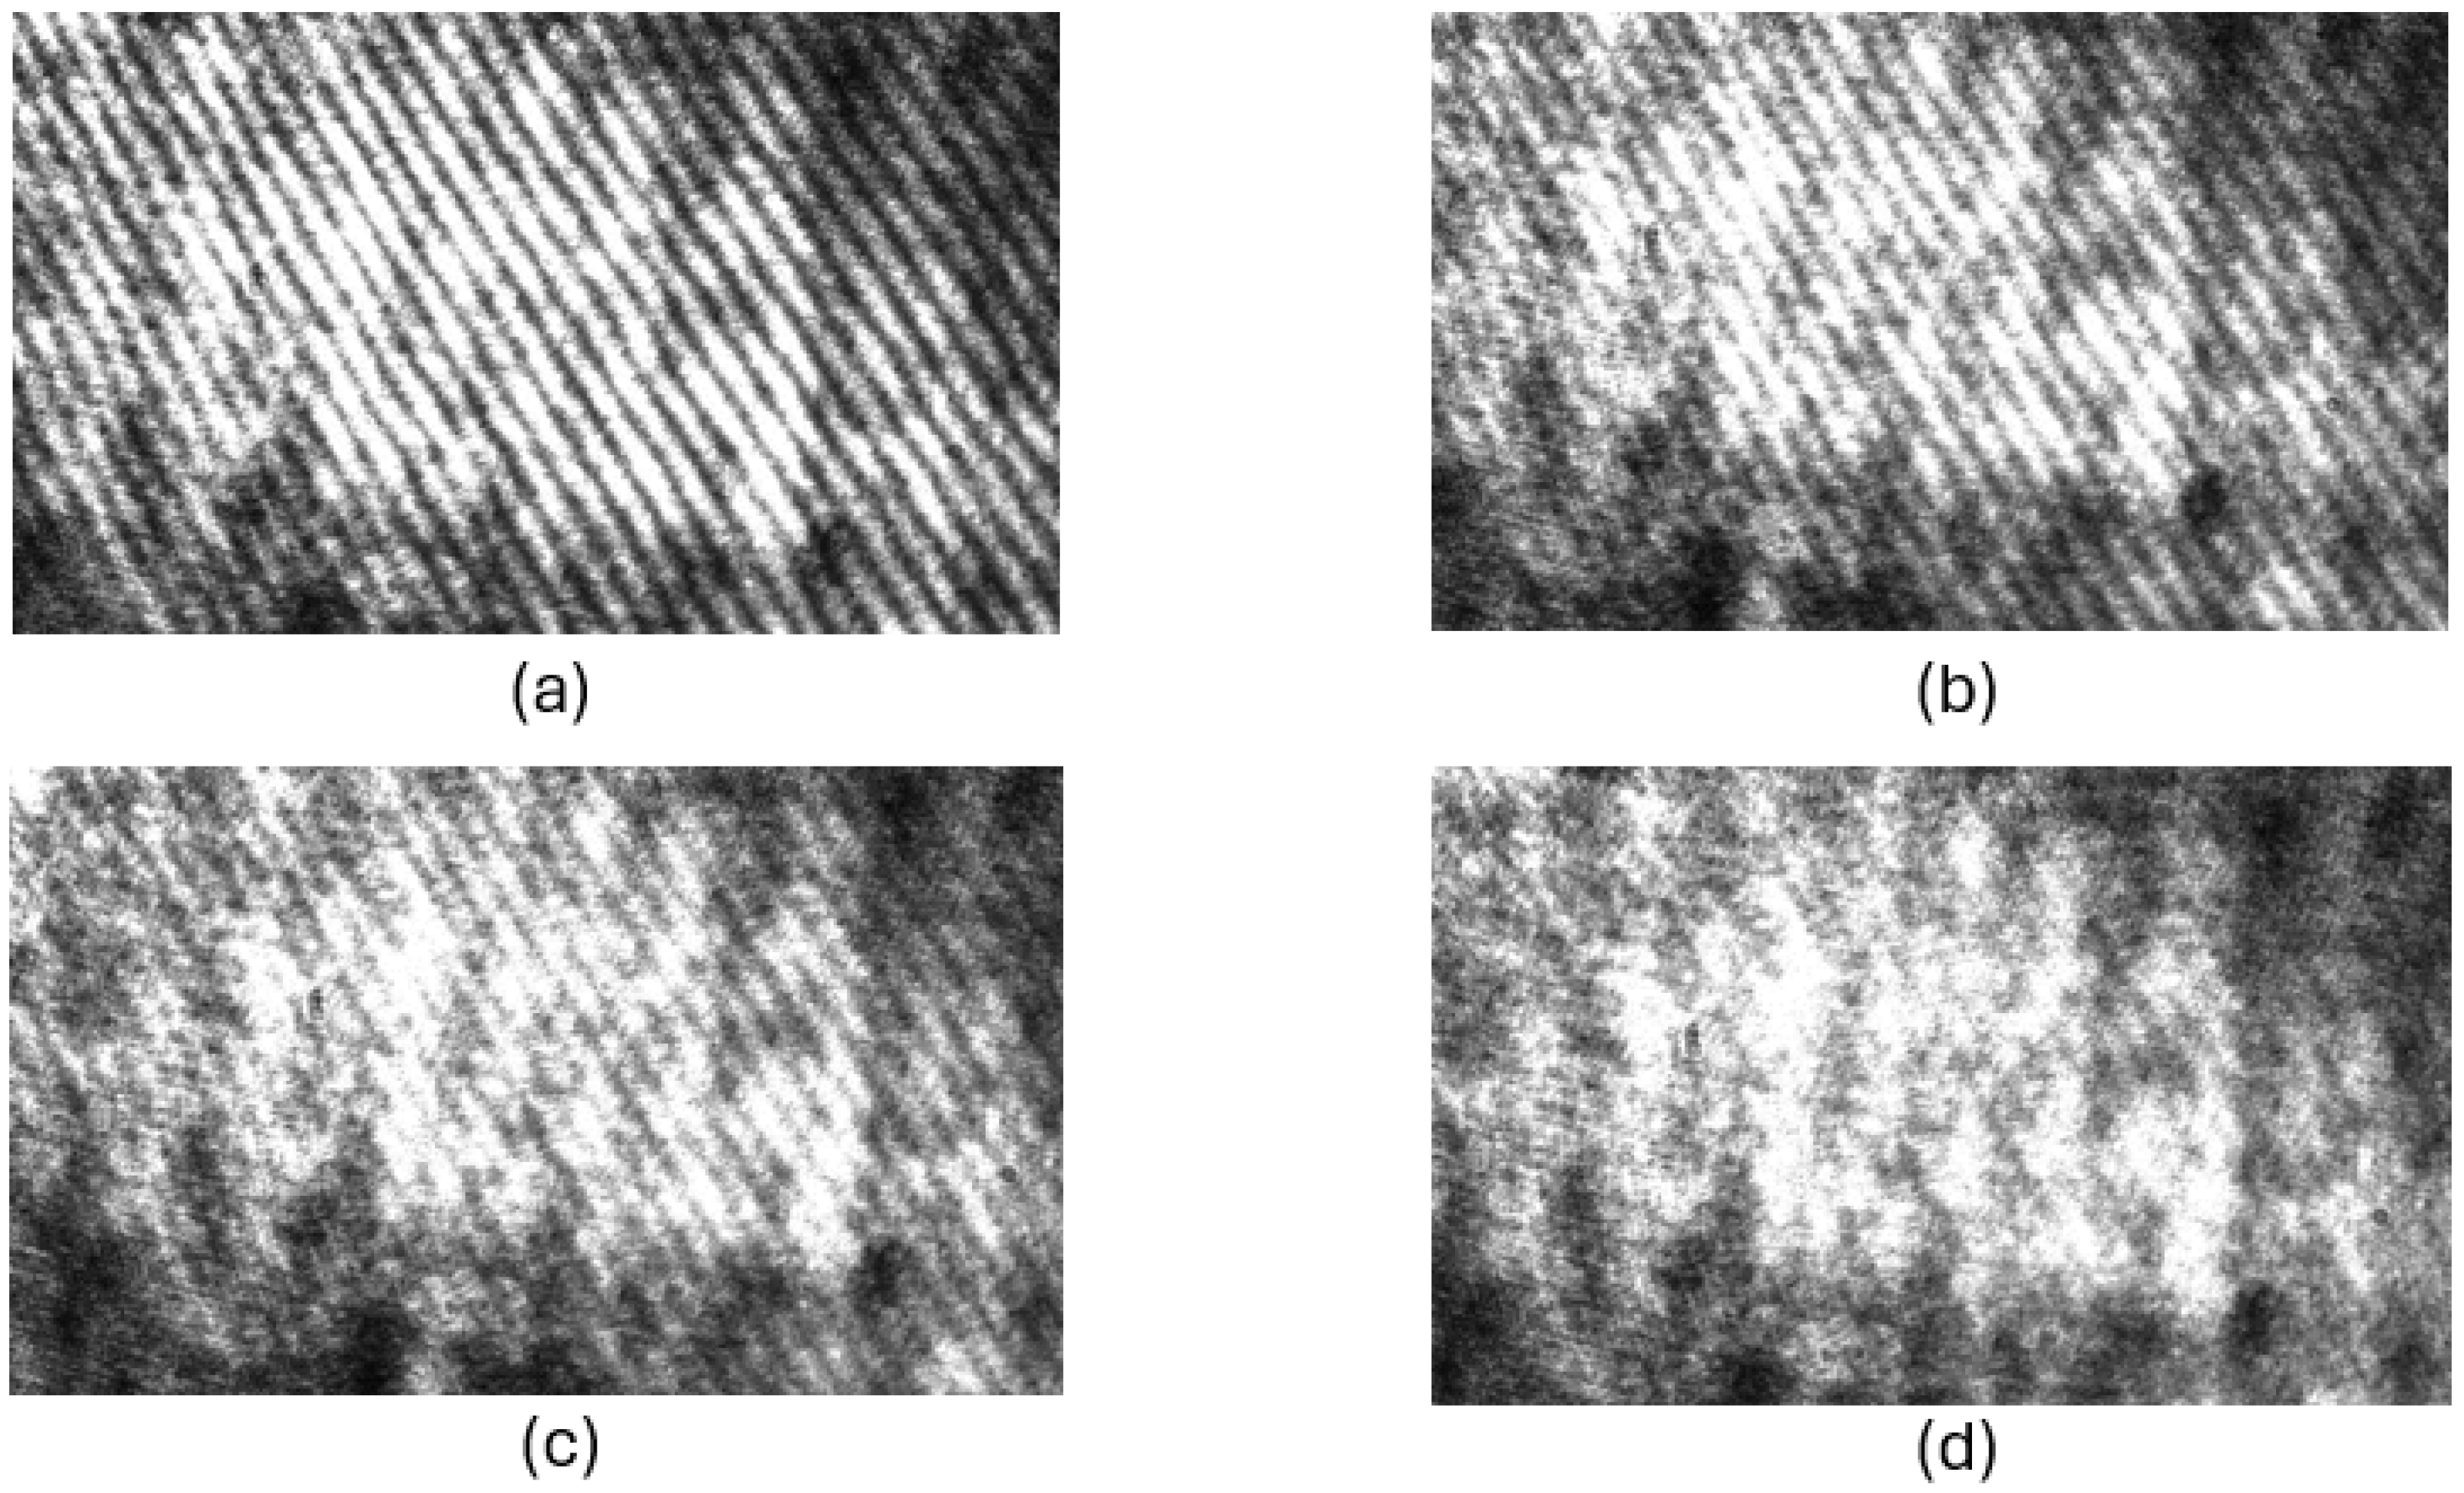
Figure 5. Initially, the system was calibrated to achieve maximum fringe contrast. Previous analyses indicate that this condition is met when the polarization plane of the illuminating beam is either parallel or perpendicular to the plane of incidence. The interferogram registered for this case is shown in
Figure 6a, and the contrast of the fringes (
C1) determined based on Equation (10) is approximately 0.8.
Subsequently, a half-wave plate was utilized to rotate the polarization plane until the fringe contrast vanished. This was achieved for a half-wave plate rotation angle of 17° ± 1°, which means that the rotation of the polarization plane is approximately 35°, which is consistent with the analysis presented in the previous section. For this case, the interferogram is shown in
Figure 6d, and the contrast (
C4) of the fringes was determined to be less than 0.2. Interferograms for intermediate values of the rotation angle of the polarization plane of 10° and 20° are shown in
Figure 6b and
Figure 6c, respectively, along with the determined contrast values.
The sequence of recorded interferograms, as depicted in
Figure 6, provided empirical evidence for the theoretical and numerical analyses conducted. The observed disappearance of the fringe pattern contrast, specifically in
Figure 6d, validates the accuracy of the analyses and affirms the efficacy of the proposed modification to the interferometric displacement sensor head. This experimental confirmation underscores the potential of the proposed design in enhancing the performance of grating microinterferometric systems.


