
Unobtrusive Sensors for Synchronous Monitoring of Different Breathing Parameters in Care Environments


Abstract
1. Introduction
- Decreases in peak airflow (how quickly someone can exhale) and the exchange of carbon dioxide and oxygen.
- Decreases in measures of lung function such as vital capacity (the maximum amount of air that can be breathed out following a maximal inhalation).
- Weakening of the respiratory muscles.
- Decline in the effectiveness of lung defence mechanisms.
2. Materials and Methods
2.1. Wi-Fi Sensor for Detecting Respiratory Rates
2.1.1. Wi-Fi CSI Sensing Background
2.1.2. Wi-Fi CSI Sensing Hardware
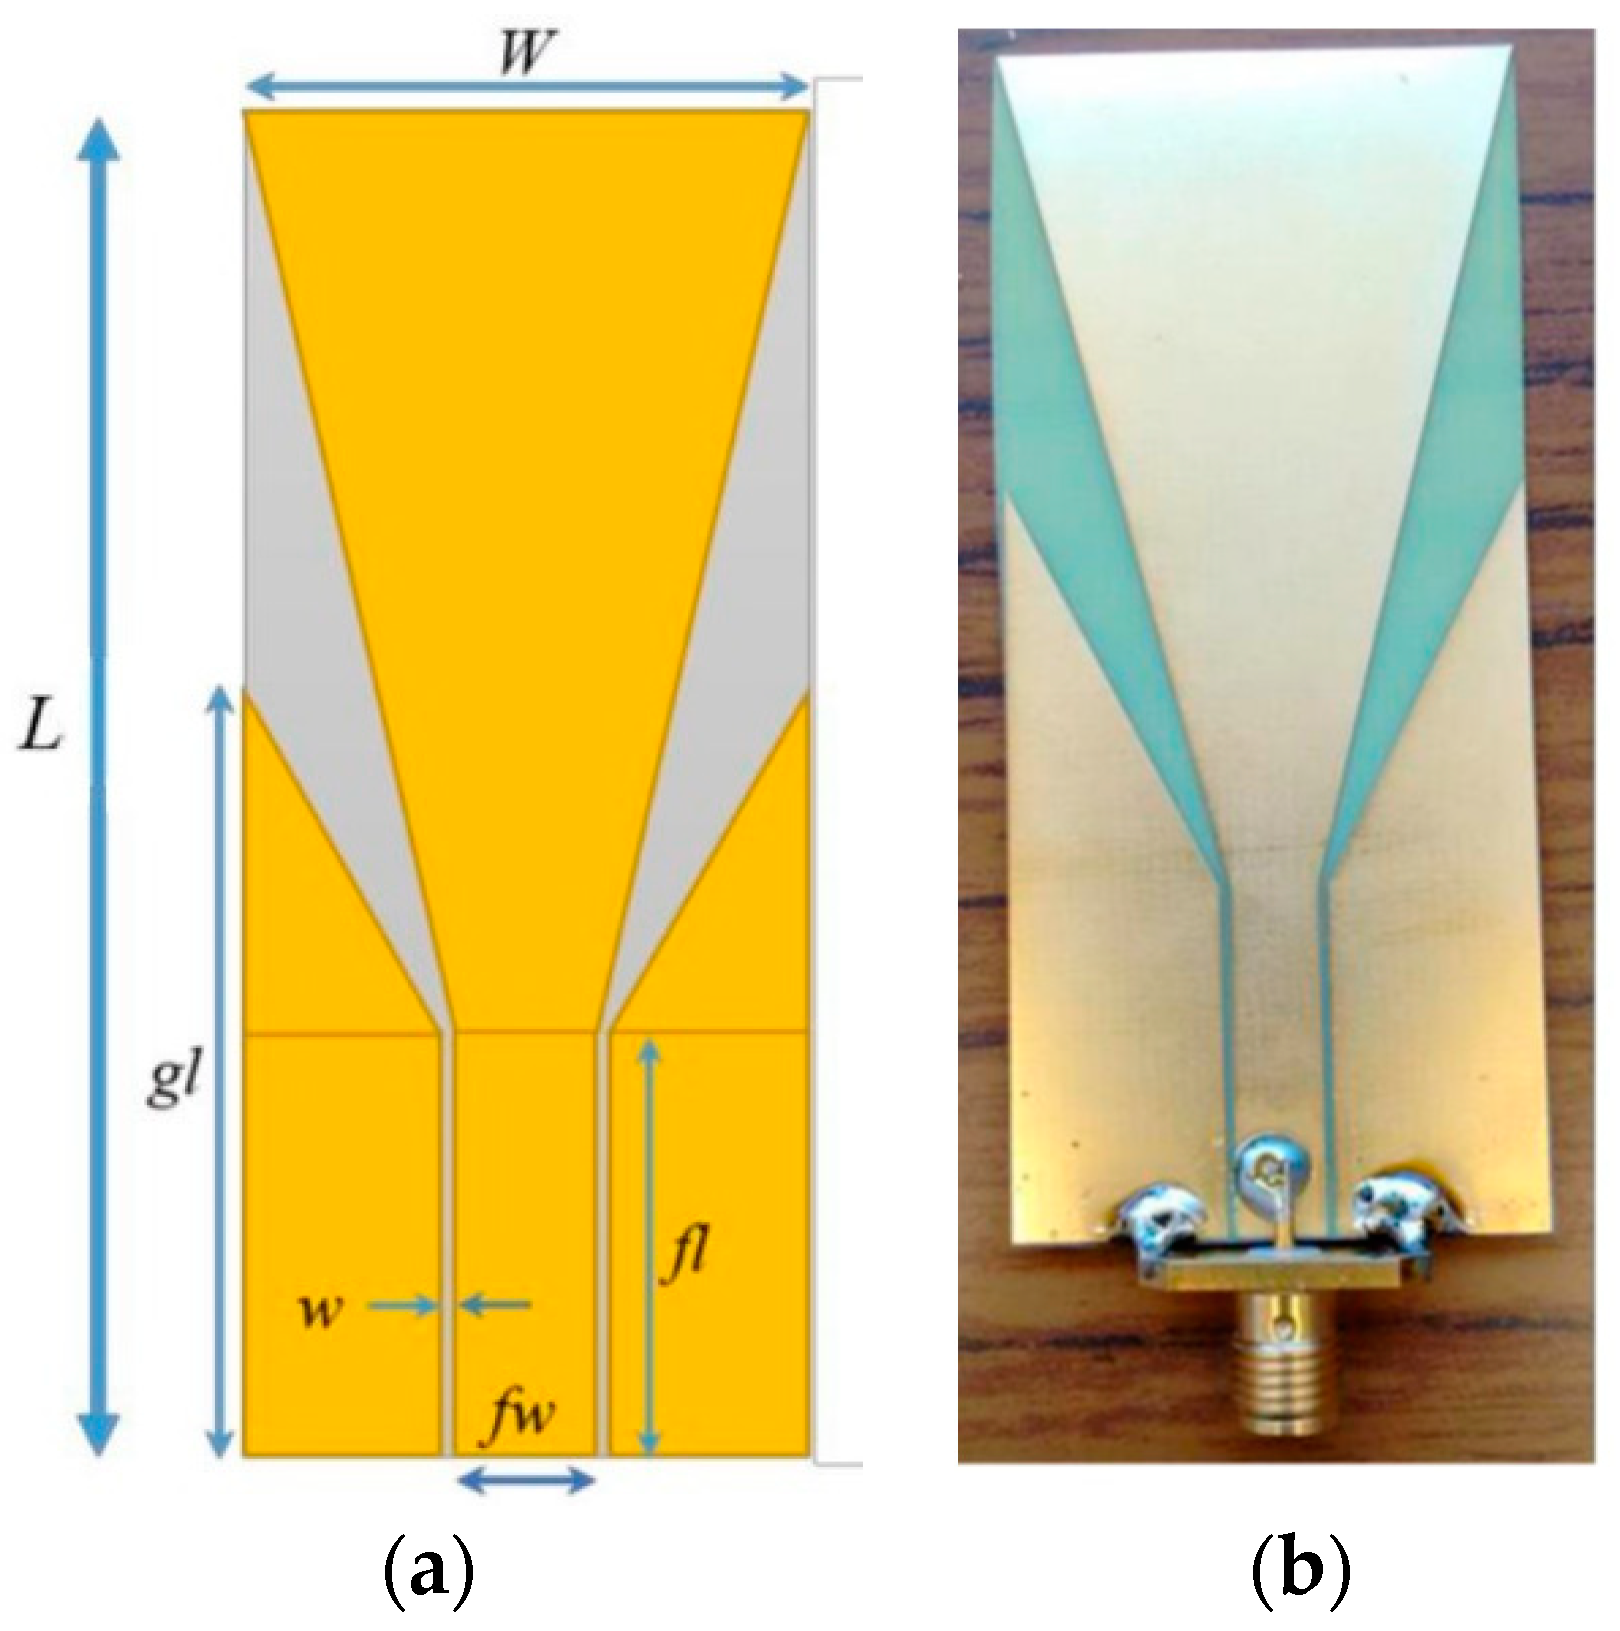
2.2. Ultra-Wideband Antenna for Detecting Exhaled Breaths
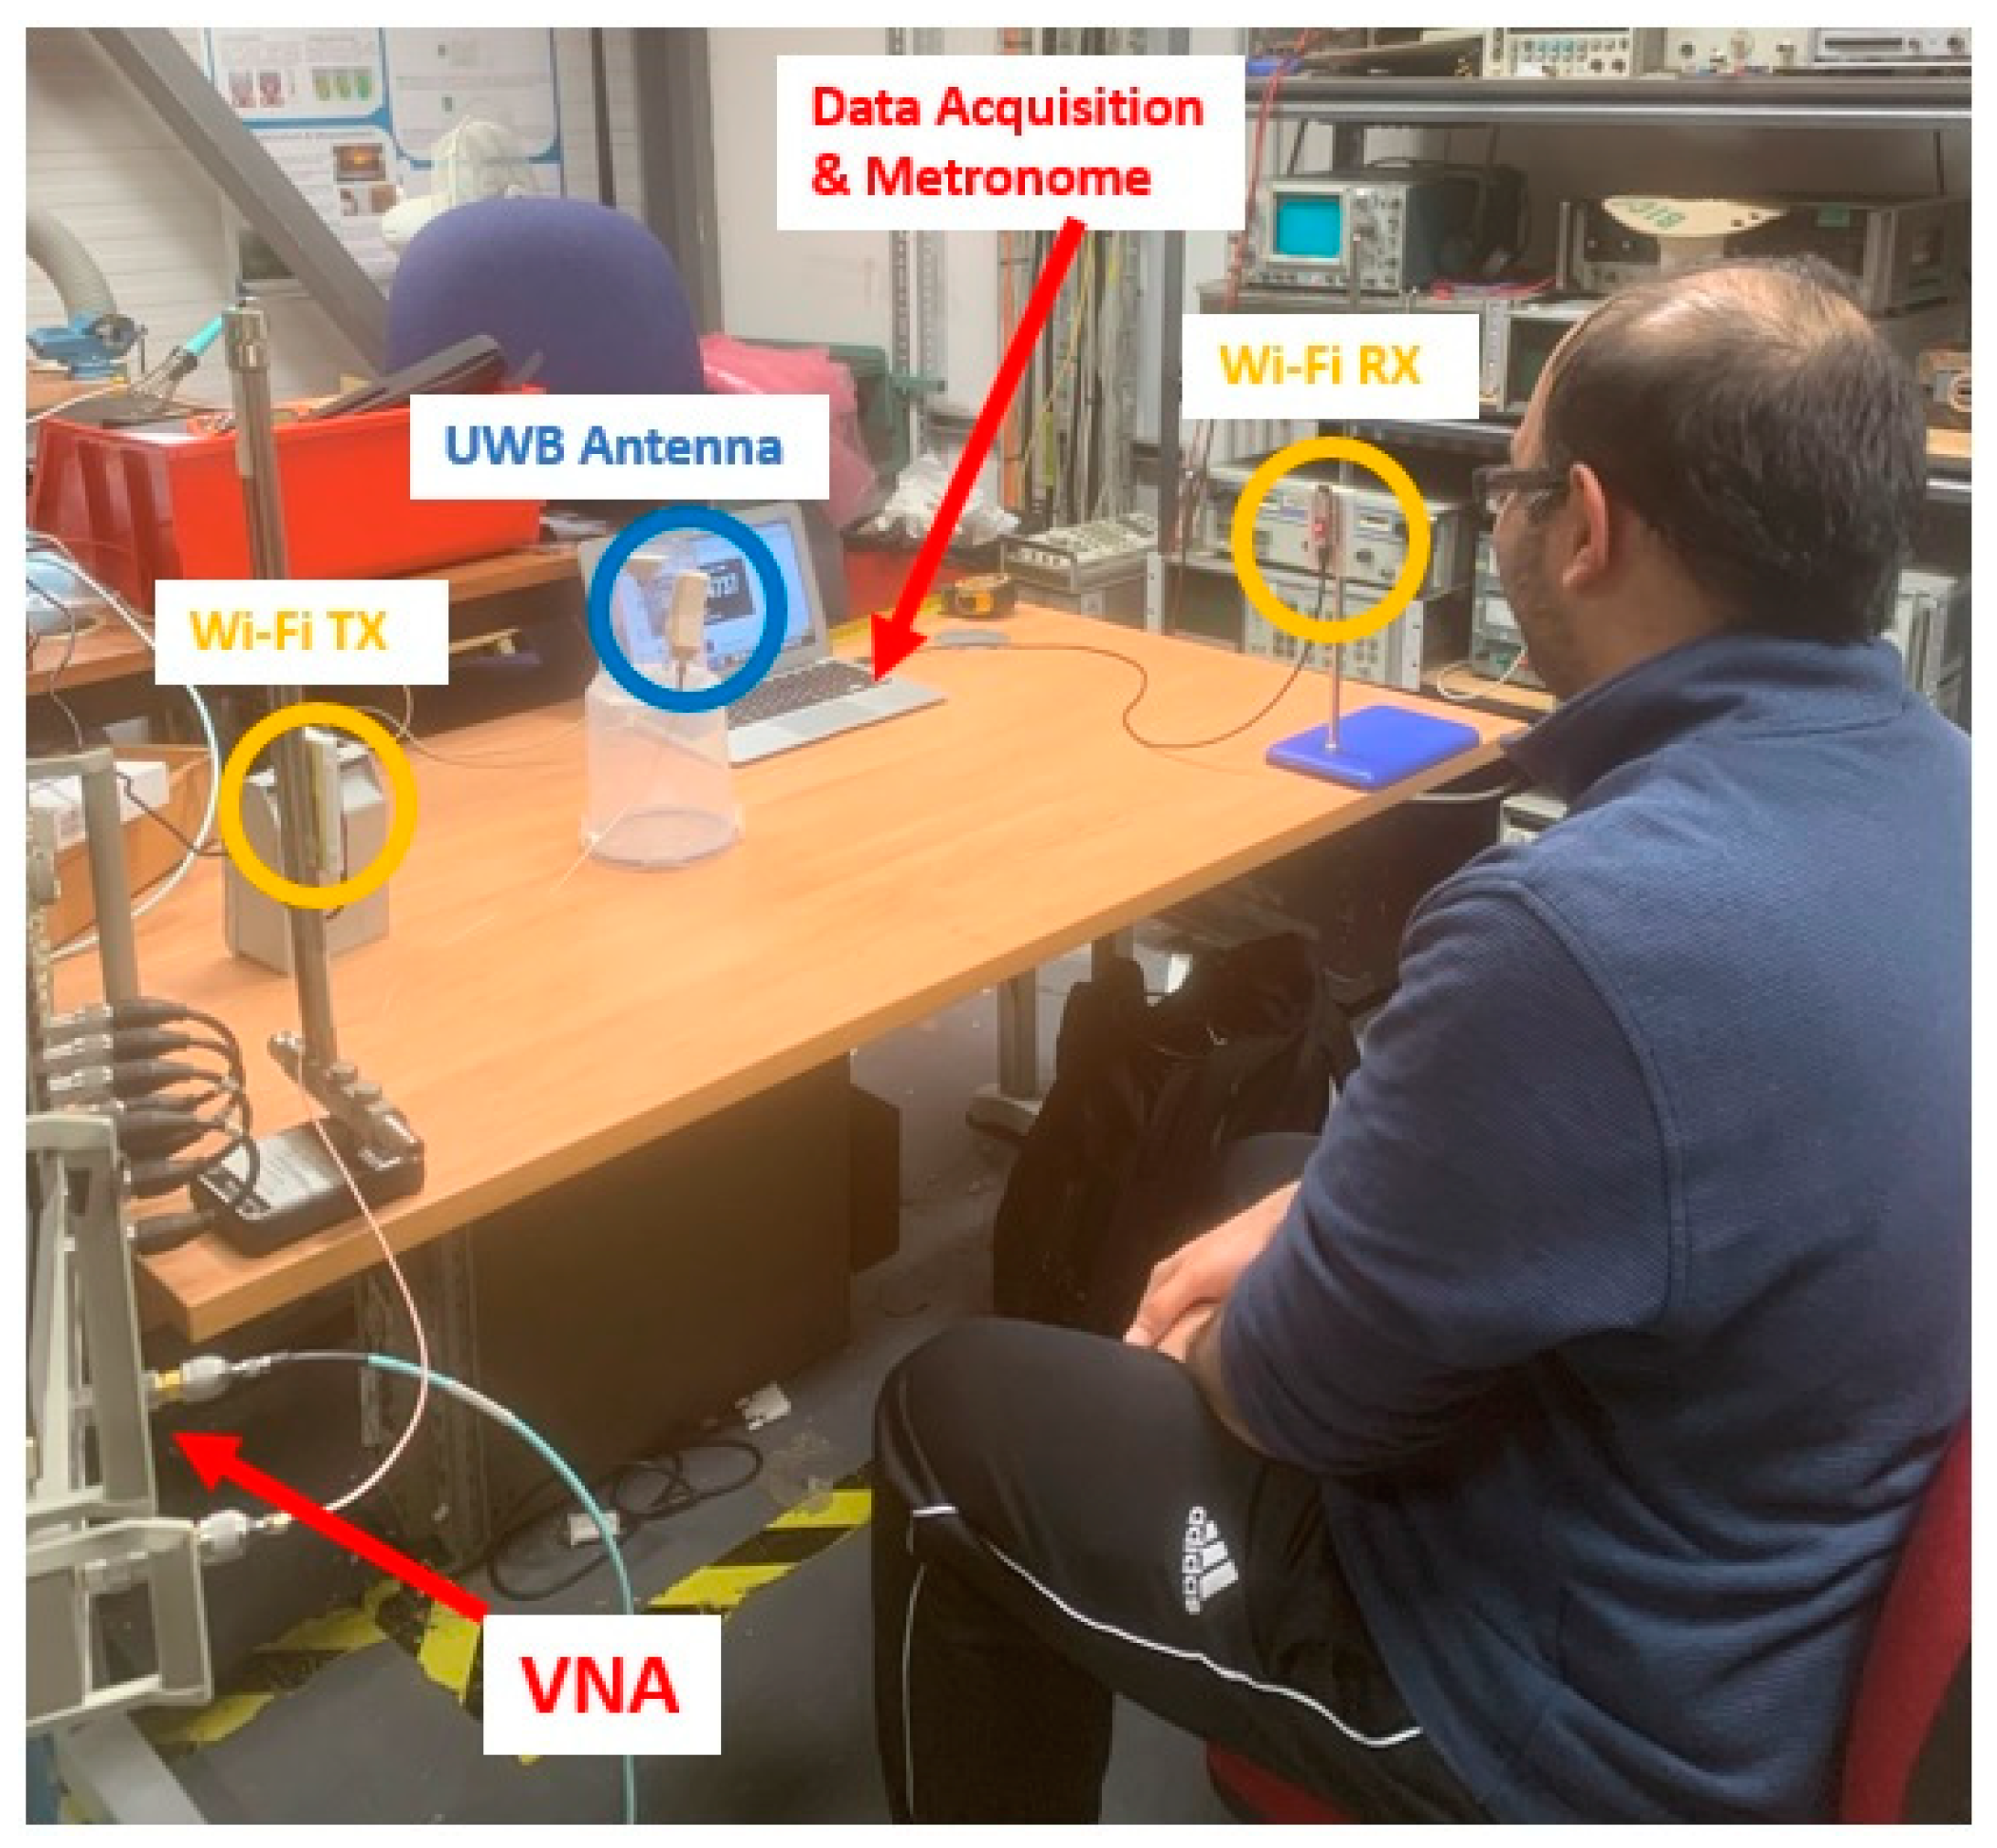
2.3. Experiment Setup
3. Results
3.1. Respiratory Rate Data Captured from Wi-Fi Antennas
3.2. Exhaled Breath Data Captured by the Digital Psychrometer
3.3. Exhaled Breath Data Captured from the UWB Antenna
4. Discussion
Comparison of Results Captured from the Wi-Fi Sensor and UWB Antenna
5. Conclusions
Author Contributions
Funding
Institutional Review Board Statement
Informed Consent Statement
Data Availability Statement
Conflicts of Interest
References
- World Health Organization. “Ageing and Health” Who.int. Available online: https://www.who.int/news-room/fact-sheets/detail/ageing-and-health (accessed on 23 February 2022).
- Lowery, E.M.; Brubaker, A.L.; Kuhlmann, E.; Kovacs, E.J. The aging lung. Clin. Interv. Aging 2013, 8, 1489–1496. [Google Scholar] [CrossRef]
- Dezube, R. Effects of Aging on the Respiratory System. Available online: https://www.msdmanuals.com/en-gb/home/lung-and-airway-disorders/biology-of-the-lungs-and-airways/effects-of-aging-on-the-respiratory-system (accessed on 23 February 2022).
- Chu, M.; Nguyen, T.; Pandey, V.; Zhou, Y.; Pham, H.N.; Bar-Yoseph, R.; Radom-Aizik, S.; Jain, R.; Cooper, D.M.; Khine, M. Respiration rate and volume measurements using wearable strain sensors. Dig. Med. 2019, 2, 8. [Google Scholar] [CrossRef] [PubMed]
- Graham, B.L.; Steenbruggen, I.; Miller, M.R.; Barjaktarevic, I.Z.; Cooper, B.G.; Hall, G.L.; Hallstrand, T.S.; Kaminsky, D.A.; McCarthy, K.; McCormack, M.C.; et al. Standardization of spirometry. Eur. Respir. J. 2005, 26, 319–338. [Google Scholar]
- Criée, C.; Sorichter, S.; Smith, H.; Kardos, P.; Merget, R.; Heise, D.; Berdel, D.; Köhler, D.; Magnussen, H.; Marek, W.; et al. Body plethysmography—Its principles and clinical use. Respir. Med. 2011, 105, 959–971. [Google Scholar] [CrossRef]
- Konno, K.; Mead, J. Measurement of the separate volume changes of rib cage and abdomen during breathing. J. Appl. Physiol. 1967, 22, 407–422. [Google Scholar] [CrossRef]
- Caretti, D.M.; Pullen, P.V.; Premo, L.A.; Kuhlmann, W.D. Reliability of respiratory inductive plethysmography for measuring tidal volume during exercise. Am. Ind. Hyg. Assoc. J. 1994, 55, 918–923. [Google Scholar] [CrossRef] [PubMed]
- Massaroni, C.; Carraro, E.; Vianello, A.; Miccinilli, S.; Morrone, M.; Levai, I.K.; Schena, E.; Saccomandi, P.; Sterzi, S.; Dickinson, J.W.; et al. Optoelectronic plethysmography in clinical practice and research: A review. Respiration 2017, 93, 339–354. [Google Scholar] [CrossRef]
- Voscopoulos, C.; Brayanov, J.; Ladd, D.; Lalli, M.; Panasyuk, A.; Freeman, J. Evaluation of a novel noninvasive respiration monitor providing continuous measurement of minute ventilation in ambulatory subjects in a variety of clinical scenarios. Anesth. Analg. 2013, 117, 91–100. [Google Scholar] [CrossRef] [PubMed]
- Yilmaz, T.; Foster, R.; Hao, Y. Detecting vital signs with wearable wireless sensors. Sensors 2010, 10, 10837–10862. [Google Scholar] [CrossRef]
- Khan, Y.; Ostfeld, A.E.; Lochner, C.M.; Pierre, A.; Arias, A.C. Monitoring of vital signs with flexible and wearable medical devices. Adv. Mater. 2016, 28, 4373–4395. [Google Scholar] [CrossRef]
- Patel, S.; Park, H.; Bonato, P.; Chan, L.; Rodgers, M.A. A review of wearable sensors and systems with application in rehabilitation. J. Neuroeng. Rehabil. 2012, 9, 1–17. [Google Scholar] [CrossRef] [PubMed]
- Amjadi, M.; Kyung, K.-U.; Park, I.; Sitti, M. Stretchable, Skin-Mountable, and Wearable Strain Sensors and Their Potential Applications: A Review. Adv. Funct. Mater. 2016, 26, 1678–1698. [Google Scholar] [CrossRef]
- Li, Z.; Wu, K. 24-GHz frequency-modulation continuous-wave radar front-end system-on-substrate. IEEE Trans. Microw. Theory Tech. 2008, 56, 278–285. [Google Scholar] [CrossRef]
- Liu, L.; Liu, S. Remote Detection of Human Vital Sign with Stepped-Frequency Continuous Wave Radar. IEEE J. Sel. Top. Appl. Earth Obs. Remote Sens. 2014, 7, 775–782. [Google Scholar] [CrossRef]
- Wang, G.; Gu, C.; Inoue, T.; Li, C. Hybrid FMCW-interferometry radar system in the 5.8 GHz ISM band for indoor precise position and motion detection. In Proceedings of the 2013 IEEE MTT-S International Conference on Microwave Symposium Digest (IMS), Seattle, WA, USA, 2–7 June 2013; pp. 1–4. [Google Scholar]
- Zito, D.; Pepe, D.; Mincica, M.; Zito, F. A 90 nm CMOS SoC UWB pulse radar for respiratory rate monitoring. In Proceedings of the 2011 IEEE International Solid-State Circuits Conference Digest of Technical Papers, San Francisco, CA, USA, 20–24 February 2011; pp. 40–41. [Google Scholar]
- Zito, D.; Pepe, D.; Mincica, M.; Zito, F.; Tognetti, A.; Lanata, A.; De Rossi, D. SoC CMOS UWB pulse radar sensor for contactless respiratory rate monitoring. IEEE Trans. Biomed. Circuits Syst. 2010, 5, 503–510. [Google Scholar] [CrossRef] [PubMed]
- Baholi, M.; Singh, A.; Soll, B.; Boric-Lubecke, O.; Lubecke, V.M. Wireless Sleep Apnea Detection Using Continuous Wave Quadrature Doppler Radar. IEEE Sens. J. 2020, 20, 538–545. [Google Scholar] [CrossRef]
- Massagram, W.; Lubecke, V.M.; HØst-Madsen, A.; Boric-Lubecke, O. Assessment of Heart Rate Variability and Respiratory Sinus Arrhythmia via Doppler Radar. IEEE Trans. Microw. Theory Tech. 2009, 57, 2542–2549. [Google Scholar] [CrossRef]
- Zieliński, J.; Przybylski, J. Ile wody tracimy z oddechem? [How much water is lost during breathing?]. Pneumonol. Alergol. Pol. 2012, 80, 339–342. (In Polish) [Google Scholar] [PubMed]
- Mansour, E.; Vishinkin, R.; Rihet, S.; Saliba, W.; Fish, F.; Sarfati, P.; Haick, H. Measurement of temperature and relative humidity in exhaled breath. Sens. Actuators B Chem. 2020, 304, 127371. [Google Scholar] [CrossRef]
- Koley, S.; Benouakta, S.; Hutu, F.; Duroc, Y. Passive UHF RFID Yarn for Relative Humidity Sensing Application. In Proceedings of the 2019 13th European Conference on Antennas and Propagation (EuCAP), Warsaw, Poland, 31 March–5 April 2019. [Google Scholar]
- Manzari, S.; Occhiuzzi, C.; Nawale, S.; Catini, A.; Di Natale, C.; Marrocco, G. Humidity Sensing by Polymer-Loaded UHF RFID Antennas. IEEE Sens. J. 2012, 12, 2851–2858. [Google Scholar] [CrossRef]
- Rahman, M.M.; Nayeem, M.A.; Nahid, S.; Bin Alvee, S.R.; Rashidul Hasan, R.; Rahman, M.A. On-Body Humidity Sensing Antenna with Polyimide for BAN Applications over 5G Networks. In Proceedings of the 2020 IEEE International IOT, Electronics and Mechatronics Conference (IEMTRONICS), Online, 9–12 September 2020; pp. 1–7. [Google Scholar] [CrossRef]
- Lin, X.; Seet, B.; Joseph, F. Wearable humidity sensing antenna for BAN applications over 5G networks. In Proceedings of the 2018 IEEE 19th Wireless and Microwave Technology Conference (WAMICON), Sand Key, FL, USA, 9–10 April 2018; pp. 1–4. [Google Scholar] [CrossRef]
- Green, D.W.; Southard, M.Z. Perry’s Chemical Engineers’ Handbook, 9th ed.; McGraw-Hill Education: New York, NY, USA, 2019. [Google Scholar]
- Abdelnasser, H.; Harras, K.A.; Youssef, M. UbiBreathe: A Ubiquitous non-Invasive WiFi-based Breathing Estimator. In Proceedings of the 16th ACM International Symposium on Mobile Ad Hoc Networking and Computing. MobiHoc’15, Hangzhou, China, 22–25 June 2015; Association for Computing Machinery: Hangzhou, China, 2015; pp. 277–286. [Google Scholar]
- Alzaabi, A.; Arslan, T.; Polydorides, N. Non-Contact Wi-Fi Sensing of Respiration Rate for Older Adults in Care: A Validity and Repeatability Study. IEEE Access 2024, 12, 6400–6412. [Google Scholar] [CrossRef]
- Halperin, D.; Hu, W.; Sheth, A.; Wetherall, D. Tool Release: Gathering 802.11n Traces with Channel State Information. ACM SIGCOMM Comput. Commun. Rev. 2011, 41, 53. [Google Scholar] [CrossRef]
- Xie, Y.; Li, Z.; Li, M. Precise Power Delay Profiling with Commodity Wi-Fi. In Proceedings of the 21st Annual International Conference on Mobile Computing and Networking (MobiCom’15), ACM, New York, NY, USA, 7–11 September 2015; pp. 53–64. [Google Scholar] [CrossRef]
- Hernandez, S.M.; Bulut, E. Lightweight and Standalone IoT Based Wi-Fi Sensing for Active Repositioning and Mobility. In Proceedings of the 2020 IEEE 21st International Symposium on “A World of Wireless, Mobile and Multimedia Networks” (WoWMoM), Cork, Ireland, 15–18 June 2020; IEEE: Piscataway, NJ, USA, 2020; pp. 277–280. [Google Scholar]
- Saied, I.; Bashri, M.S.R.; Arslan, T.; Smith, C.; Chandran, S. Dielectric Measurements of Brain Tissues with Alzheimer’s Disease Pathology in the Microwave Region. In Proceedings of the2019 IEEE International Symposium on Medical Measurements and Applications (MeMeA), Istanbul, Turkey, 26–28 June 2019; pp. 1–6. [Google Scholar] [CrossRef]
- Gabriel, C.; Gabriel, S.; Corthout, E. The dielectric properties of biological tissues: I. Literature survey. Phys. Med. Biol. 1996, 41, 2231–2249. [Google Scholar] [CrossRef]
- Bashri, M.S.R.; Arslan, T.; Zhou, W.; Haridas, N. Wearable device for microwave head imaging. In Proceedings of the 2016 46th European Microwave Conference (EuMC), London, UK, 4–6 October 2016; pp. 671–674. [Google Scholar] [CrossRef]
- Rodríguez-Molinero, A.; Narvaiza, L.; Ruiz, J.; Gálvez-Barrón, C. Normal respiratory rate and peripheral blood oxygen saturation in the elderly population. J. Am. Geriatr. Soc. 2013, 61, 2238–2240. [Google Scholar] [CrossRef] [PubMed]
- Zeng, Y.; Wu, D.; Xiong, J.; Yi, E.; Gao, R.; Zhang, D. FarSense: Pushing the Range Limit of WiFi-based Respiration Sensing with CSI Ratio of Two Antennas. Proc. ACM Interact. Mob. Wearable Ubiquitous Technol. 2019, 3, 1–26. [Google Scholar]


| Symbol | Parameter Name | Value (mm) |
|---|---|---|
| L | Antenna Length | 80 |
| W | Antenna Width | 35 |
| h | Substrate Thickness | 0.2 |
| w | CPW Gap | 0.65 |
| fw | CPW Feed-Line Width | 5.714 |
| fl | CPW Feed-Line Length | 22.857 |
| gw | CPW Ground Length | 50.29 |
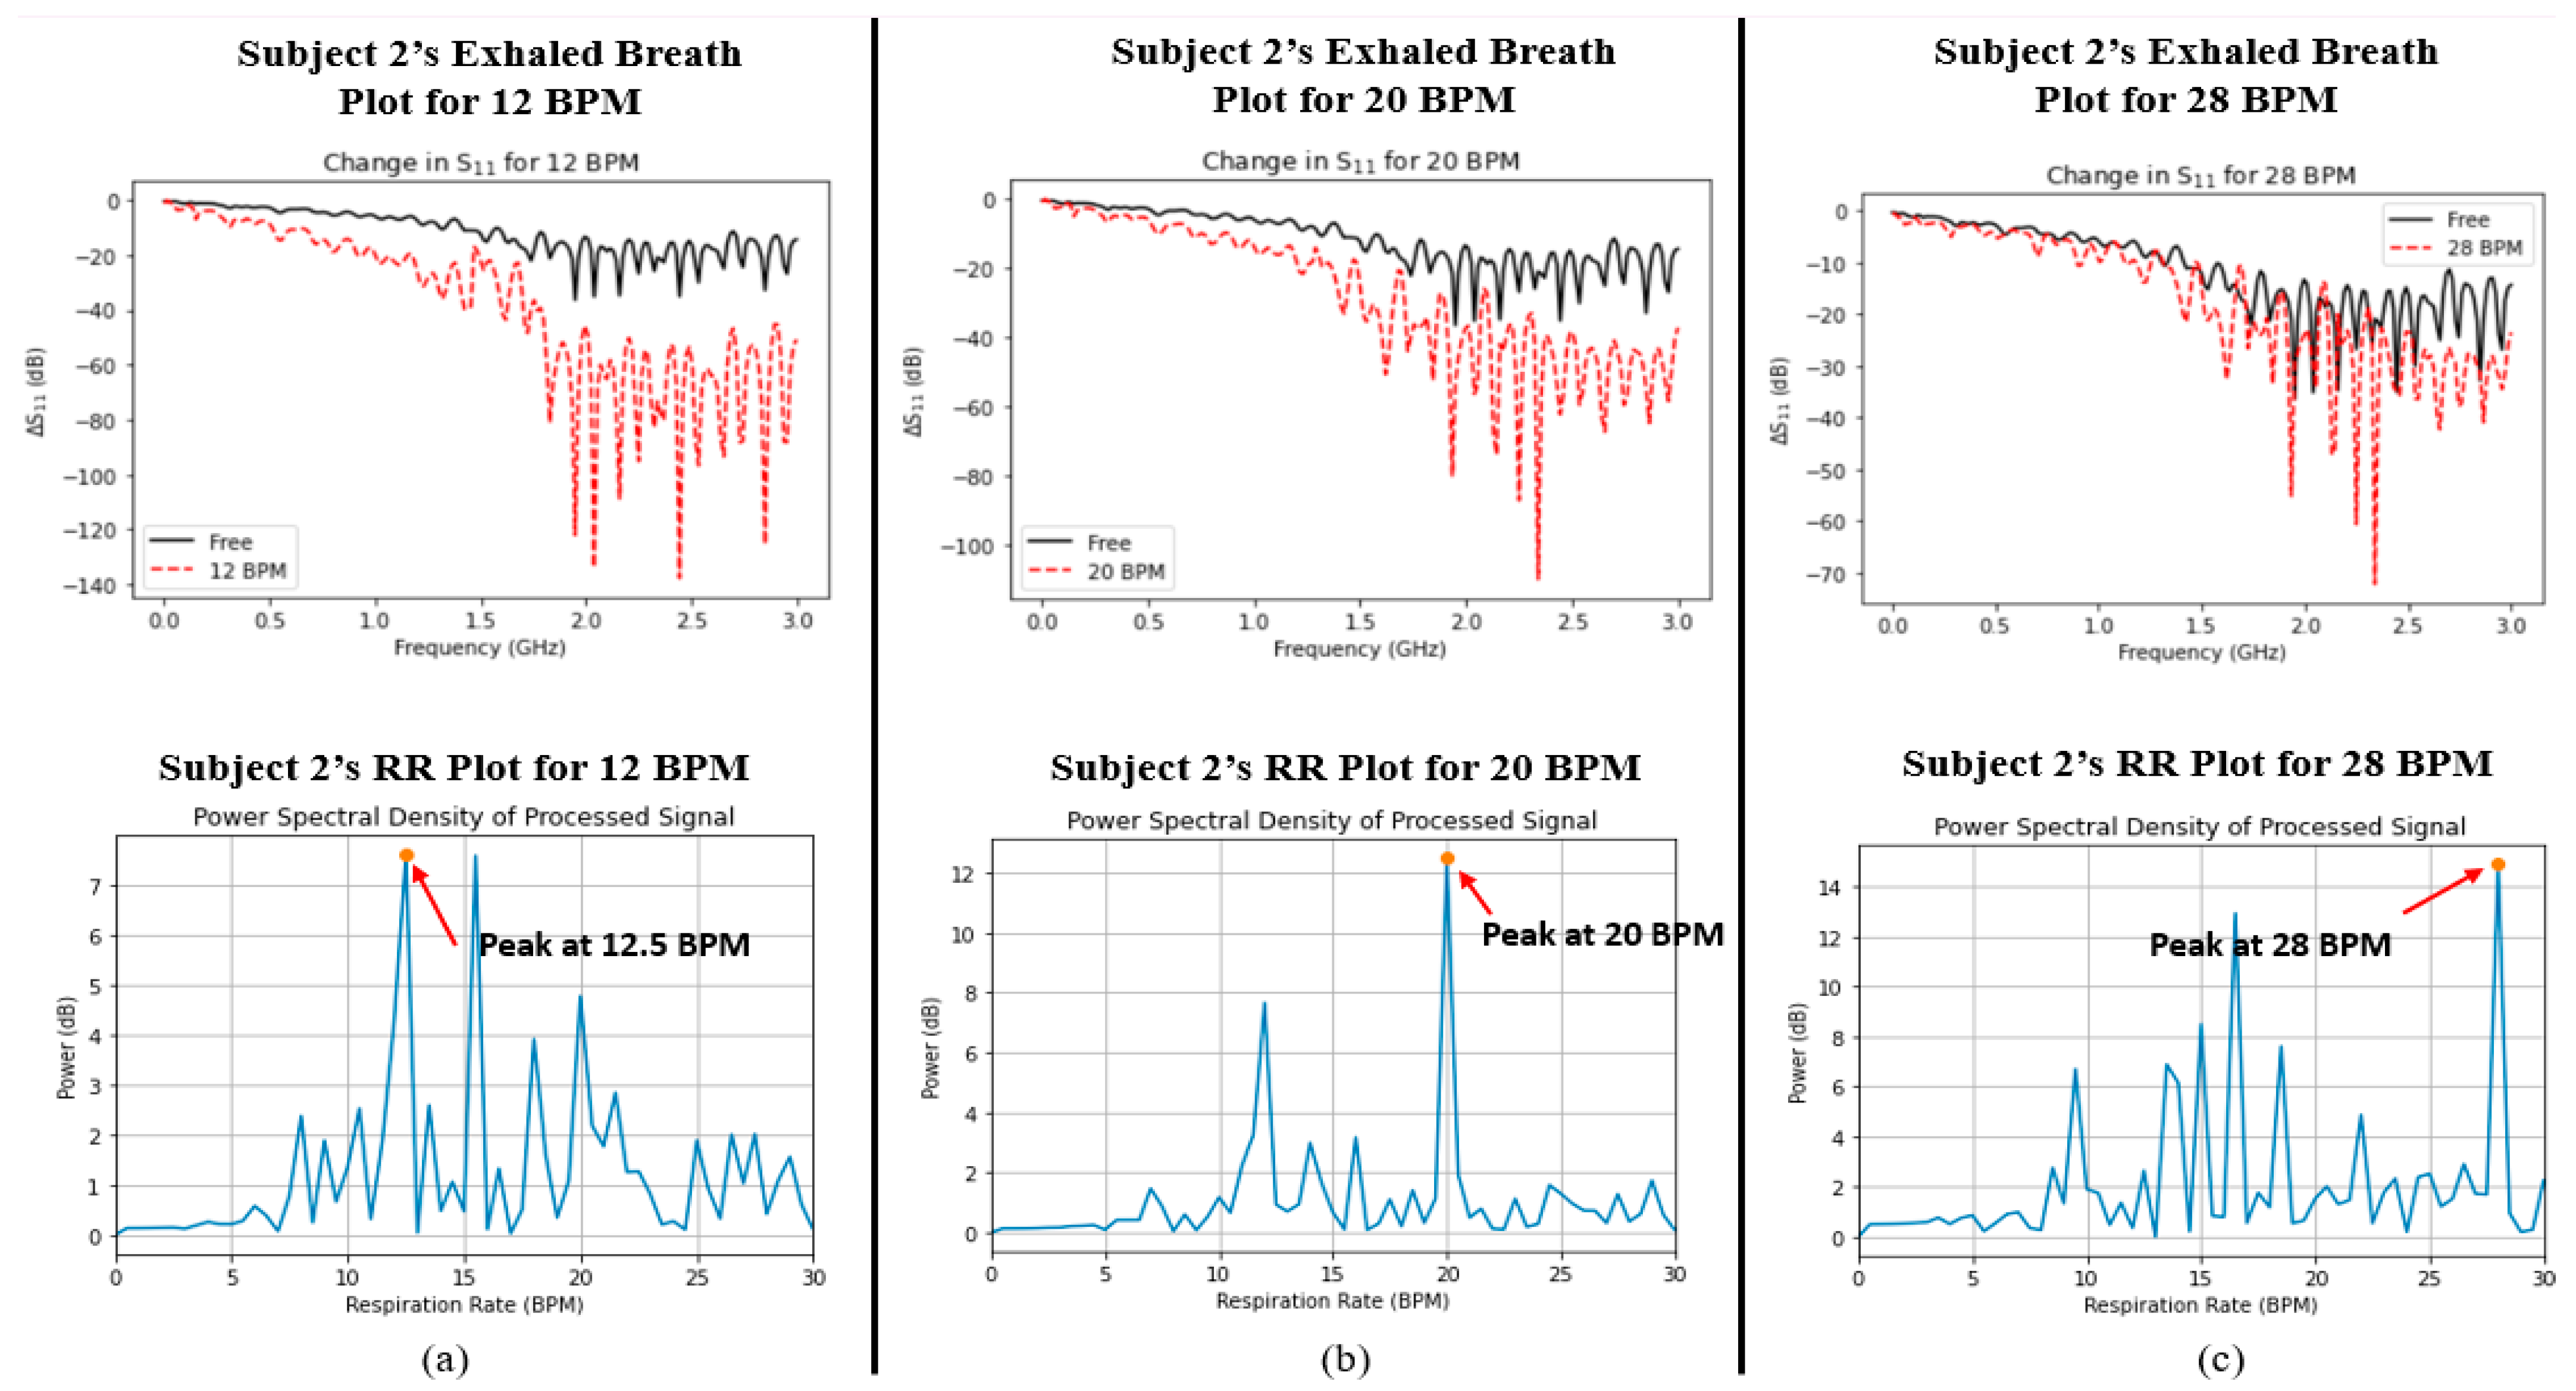
| RR (Ground Truth) | RR (Wi-Fi Sensor, Subject 1) | RR (Wi-Fi Sensor, Subject 2) |
|---|---|---|
| 12 BPM | 12 BPM | 12.5 BPM |
| 20 BPM | 20 BPM | 20 BPM |
| 28 BPM | 28 BPM | 28 BPM |
| Subject 1 | Subject 2 | |||
|---|---|---|---|---|
| CASE | ΔS11 (%) | ΔRH (%) | ΔS11 (%) | ΔRH (%) |
| 12 BPM | 252.18 ± 20.87 | 28.75 ± 1.719 | 233.89 ± 22.43 | 34.24 ± 5.15 |
| 20 BPM | 142.64 ± 12.65 | 22.23 ± 2.22 | 143.03 ± 14.01 | 26.56 ± 5.23 |
| 28 BPM | 50.03 ± 5.63 | 10.93 ± 2.02 | 50.22 ± 6.94 | 20.21 ± 5.89 |
| Case | rRR | rS11 |
|---|---|---|
| 12 BPM | 0.2256 | 0.2256 |
| 20 BPM | 0.3206 | 0.3206 |
| 28 BPM | 0.2892 | 0.2892 |
Disclaimer/Publisher’s Note: The statements, opinions and data contained in all publications are solely those of the individual author(s) and contributor(s) and not of MDPI and/or the editor(s). MDPI and/or the editor(s) disclaim responsibility for any injury to people or property resulting from any ideas, methods, instructions or products referred to in the content. |
© 2024 by the authors. Licensee MDPI, Basel, Switzerland. This article is an open access article distributed under the terms and conditions of the Creative Commons Attribution (CC BY) license (https://creativecommons.org/licenses/by/4.0/).
Share and Cite
Saied, I.; Alzaabi, A.; Arslan, T. Unobtrusive Sensors for Synchronous Monitoring of Different Breathing Parameters in Care Environments. Sensors 2024, 24, 2233. https://doi.org/10.3390/s24072233
Saied I, Alzaabi A, Arslan T. Unobtrusive Sensors for Synchronous Monitoring of Different Breathing Parameters in Care Environments. Sensors. 2024; 24(7):2233. https://doi.org/10.3390/s24072233
Chicago/Turabian StyleSaied, Imran, Aaesha Alzaabi, and Tughrul Arslan. 2024. "Unobtrusive Sensors for Synchronous Monitoring of Different Breathing Parameters in Care Environments" Sensors 24, no. 7: 2233. https://doi.org/10.3390/s24072233
APA StyleSaied, I., Alzaabi, A., & Arslan, T. (2024). Unobtrusive Sensors for Synchronous Monitoring of Different Breathing Parameters in Care Environments. Sensors, 24(7), 2233. https://doi.org/10.3390/s24072233