
An Adaptive Radon-Transform-Based Marker Detection and Localization Method for Displacement Measurements Using Unmanned Aerial Vehicles


Abstract
1. Introduction
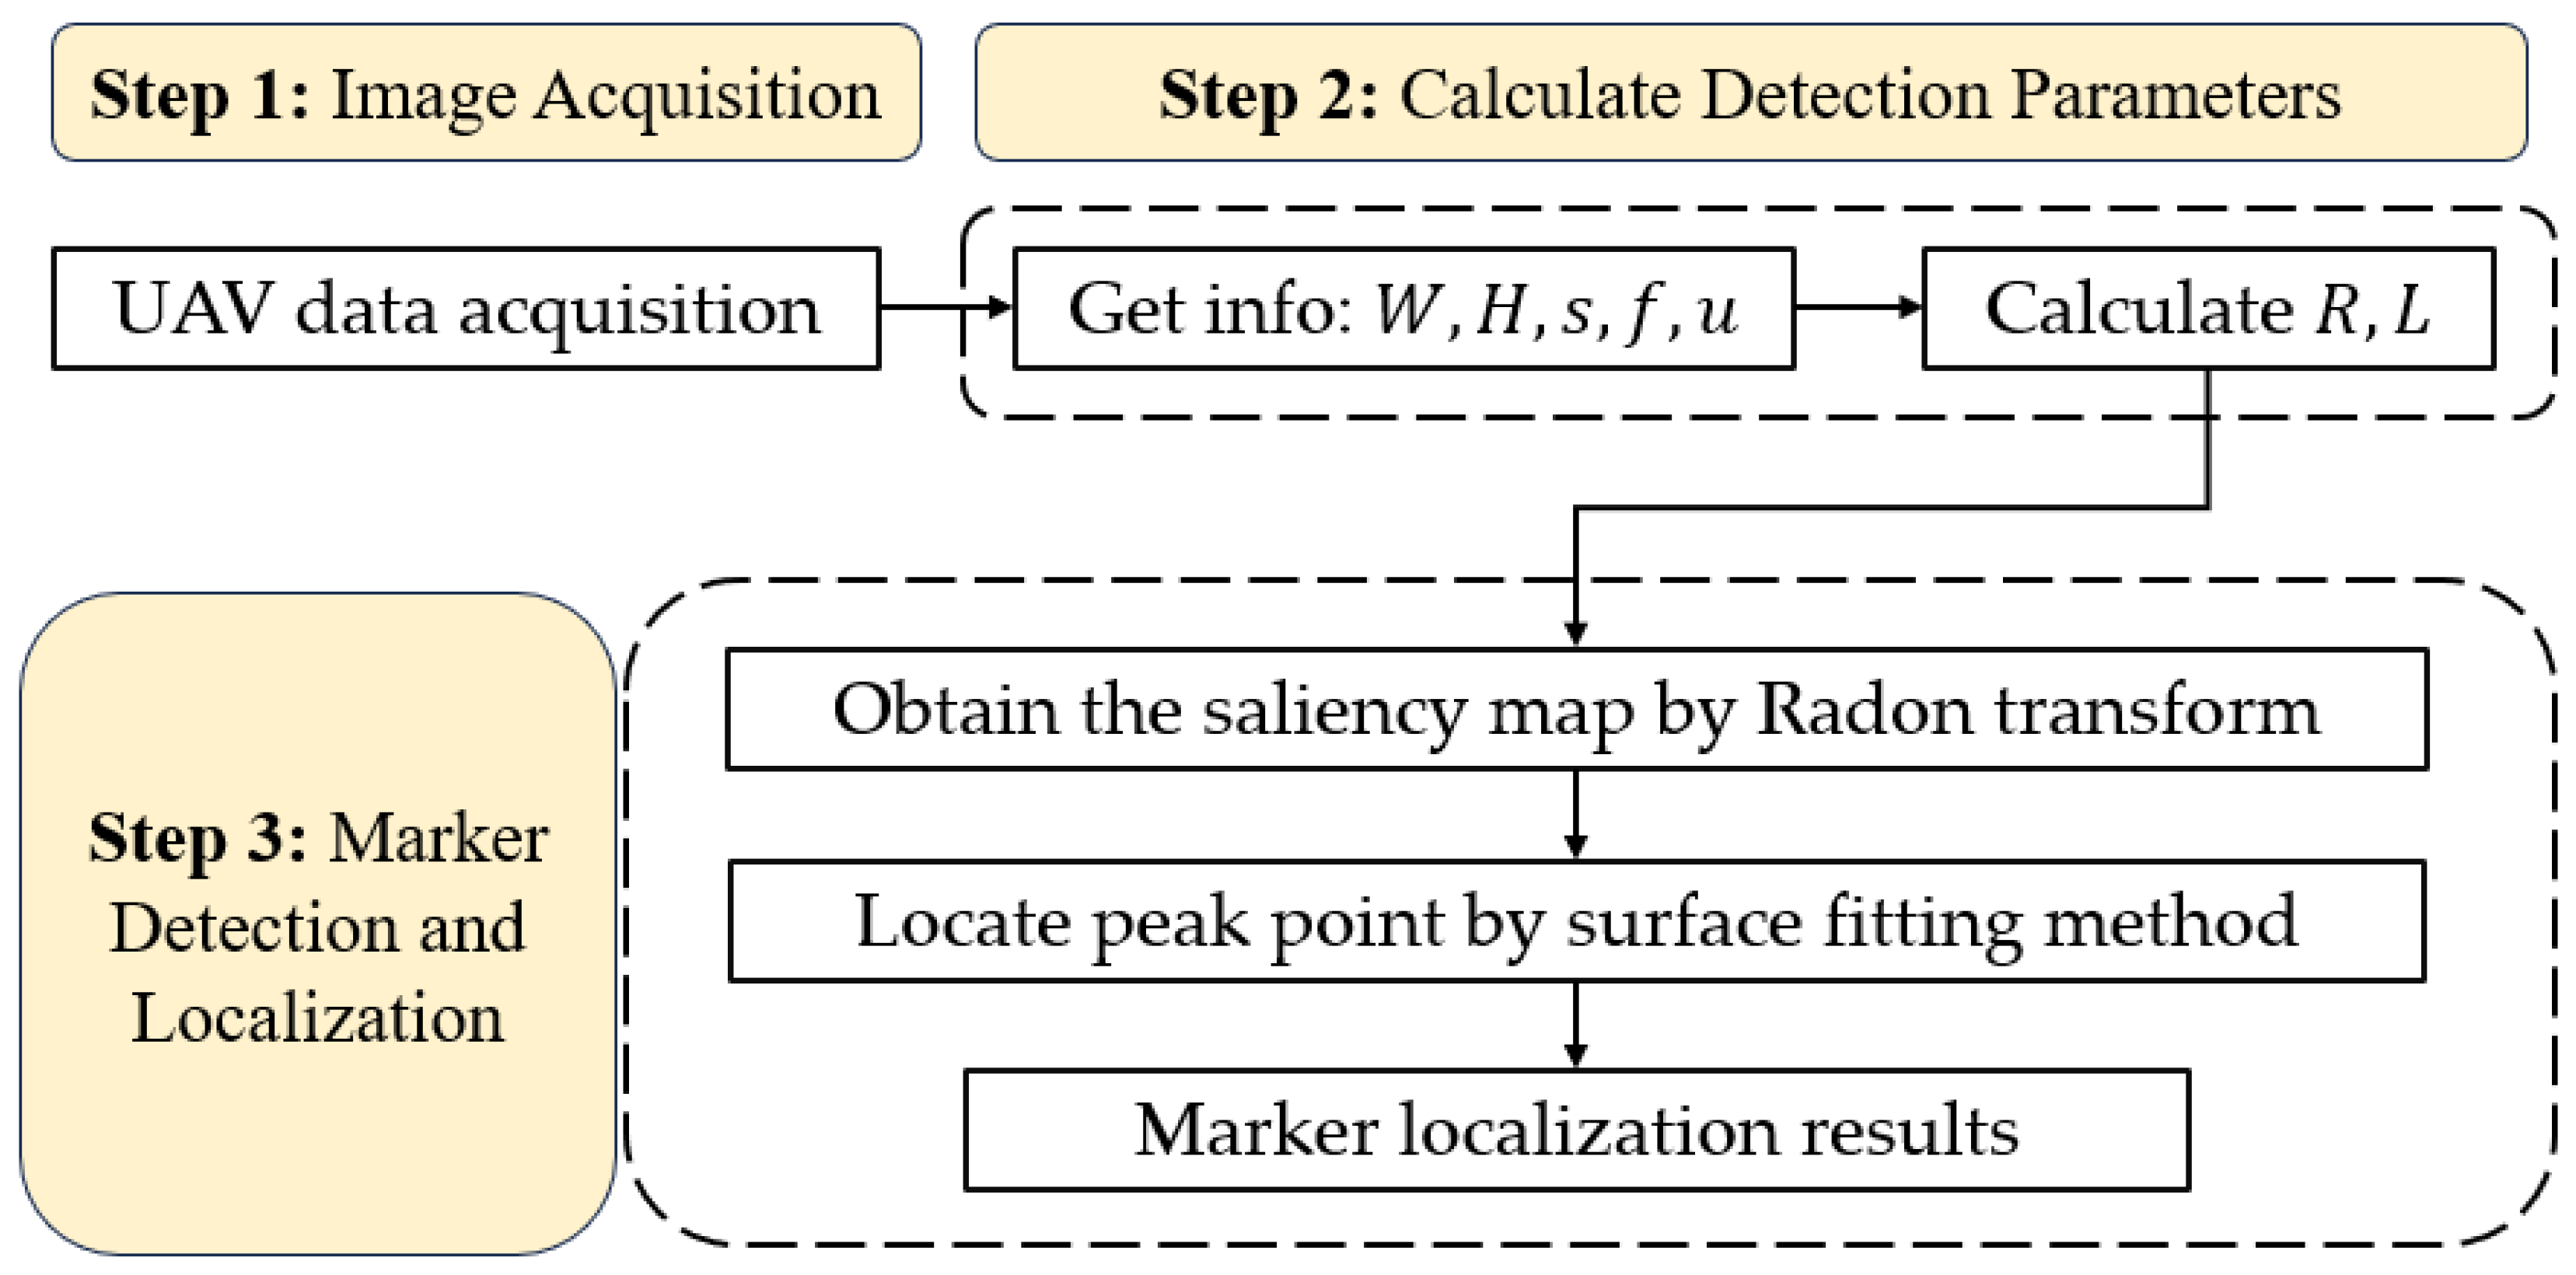
2. Methods
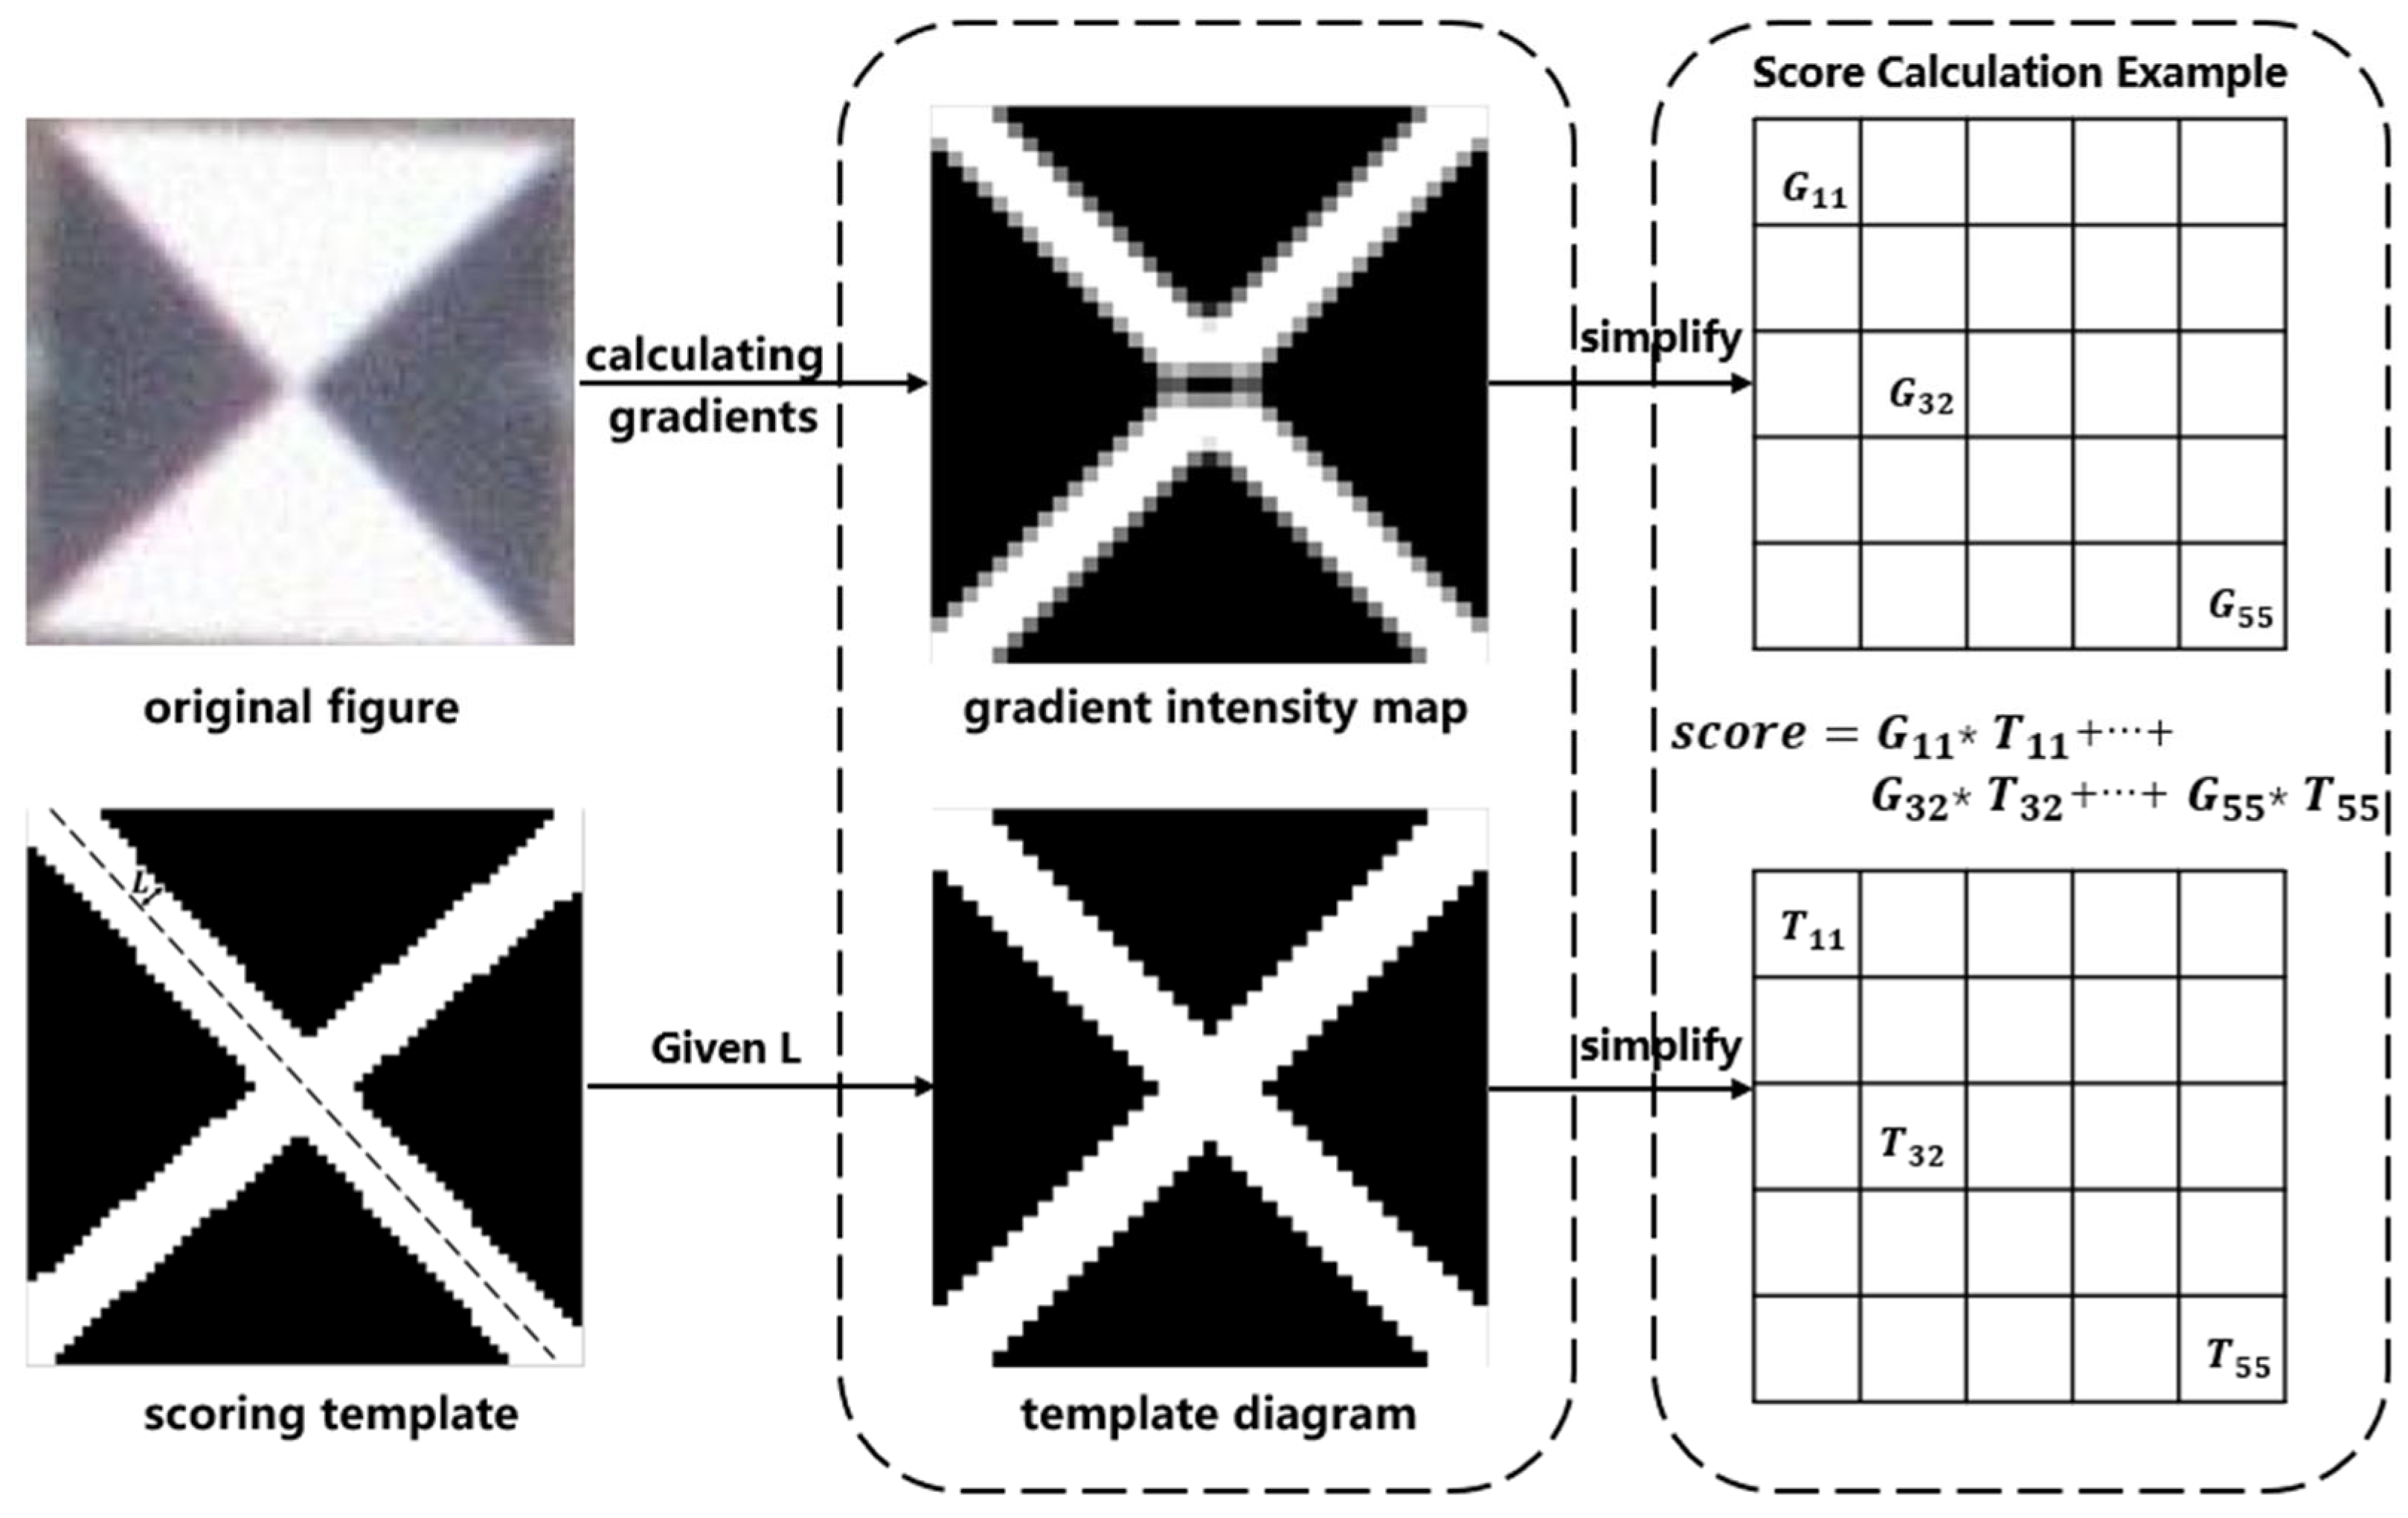
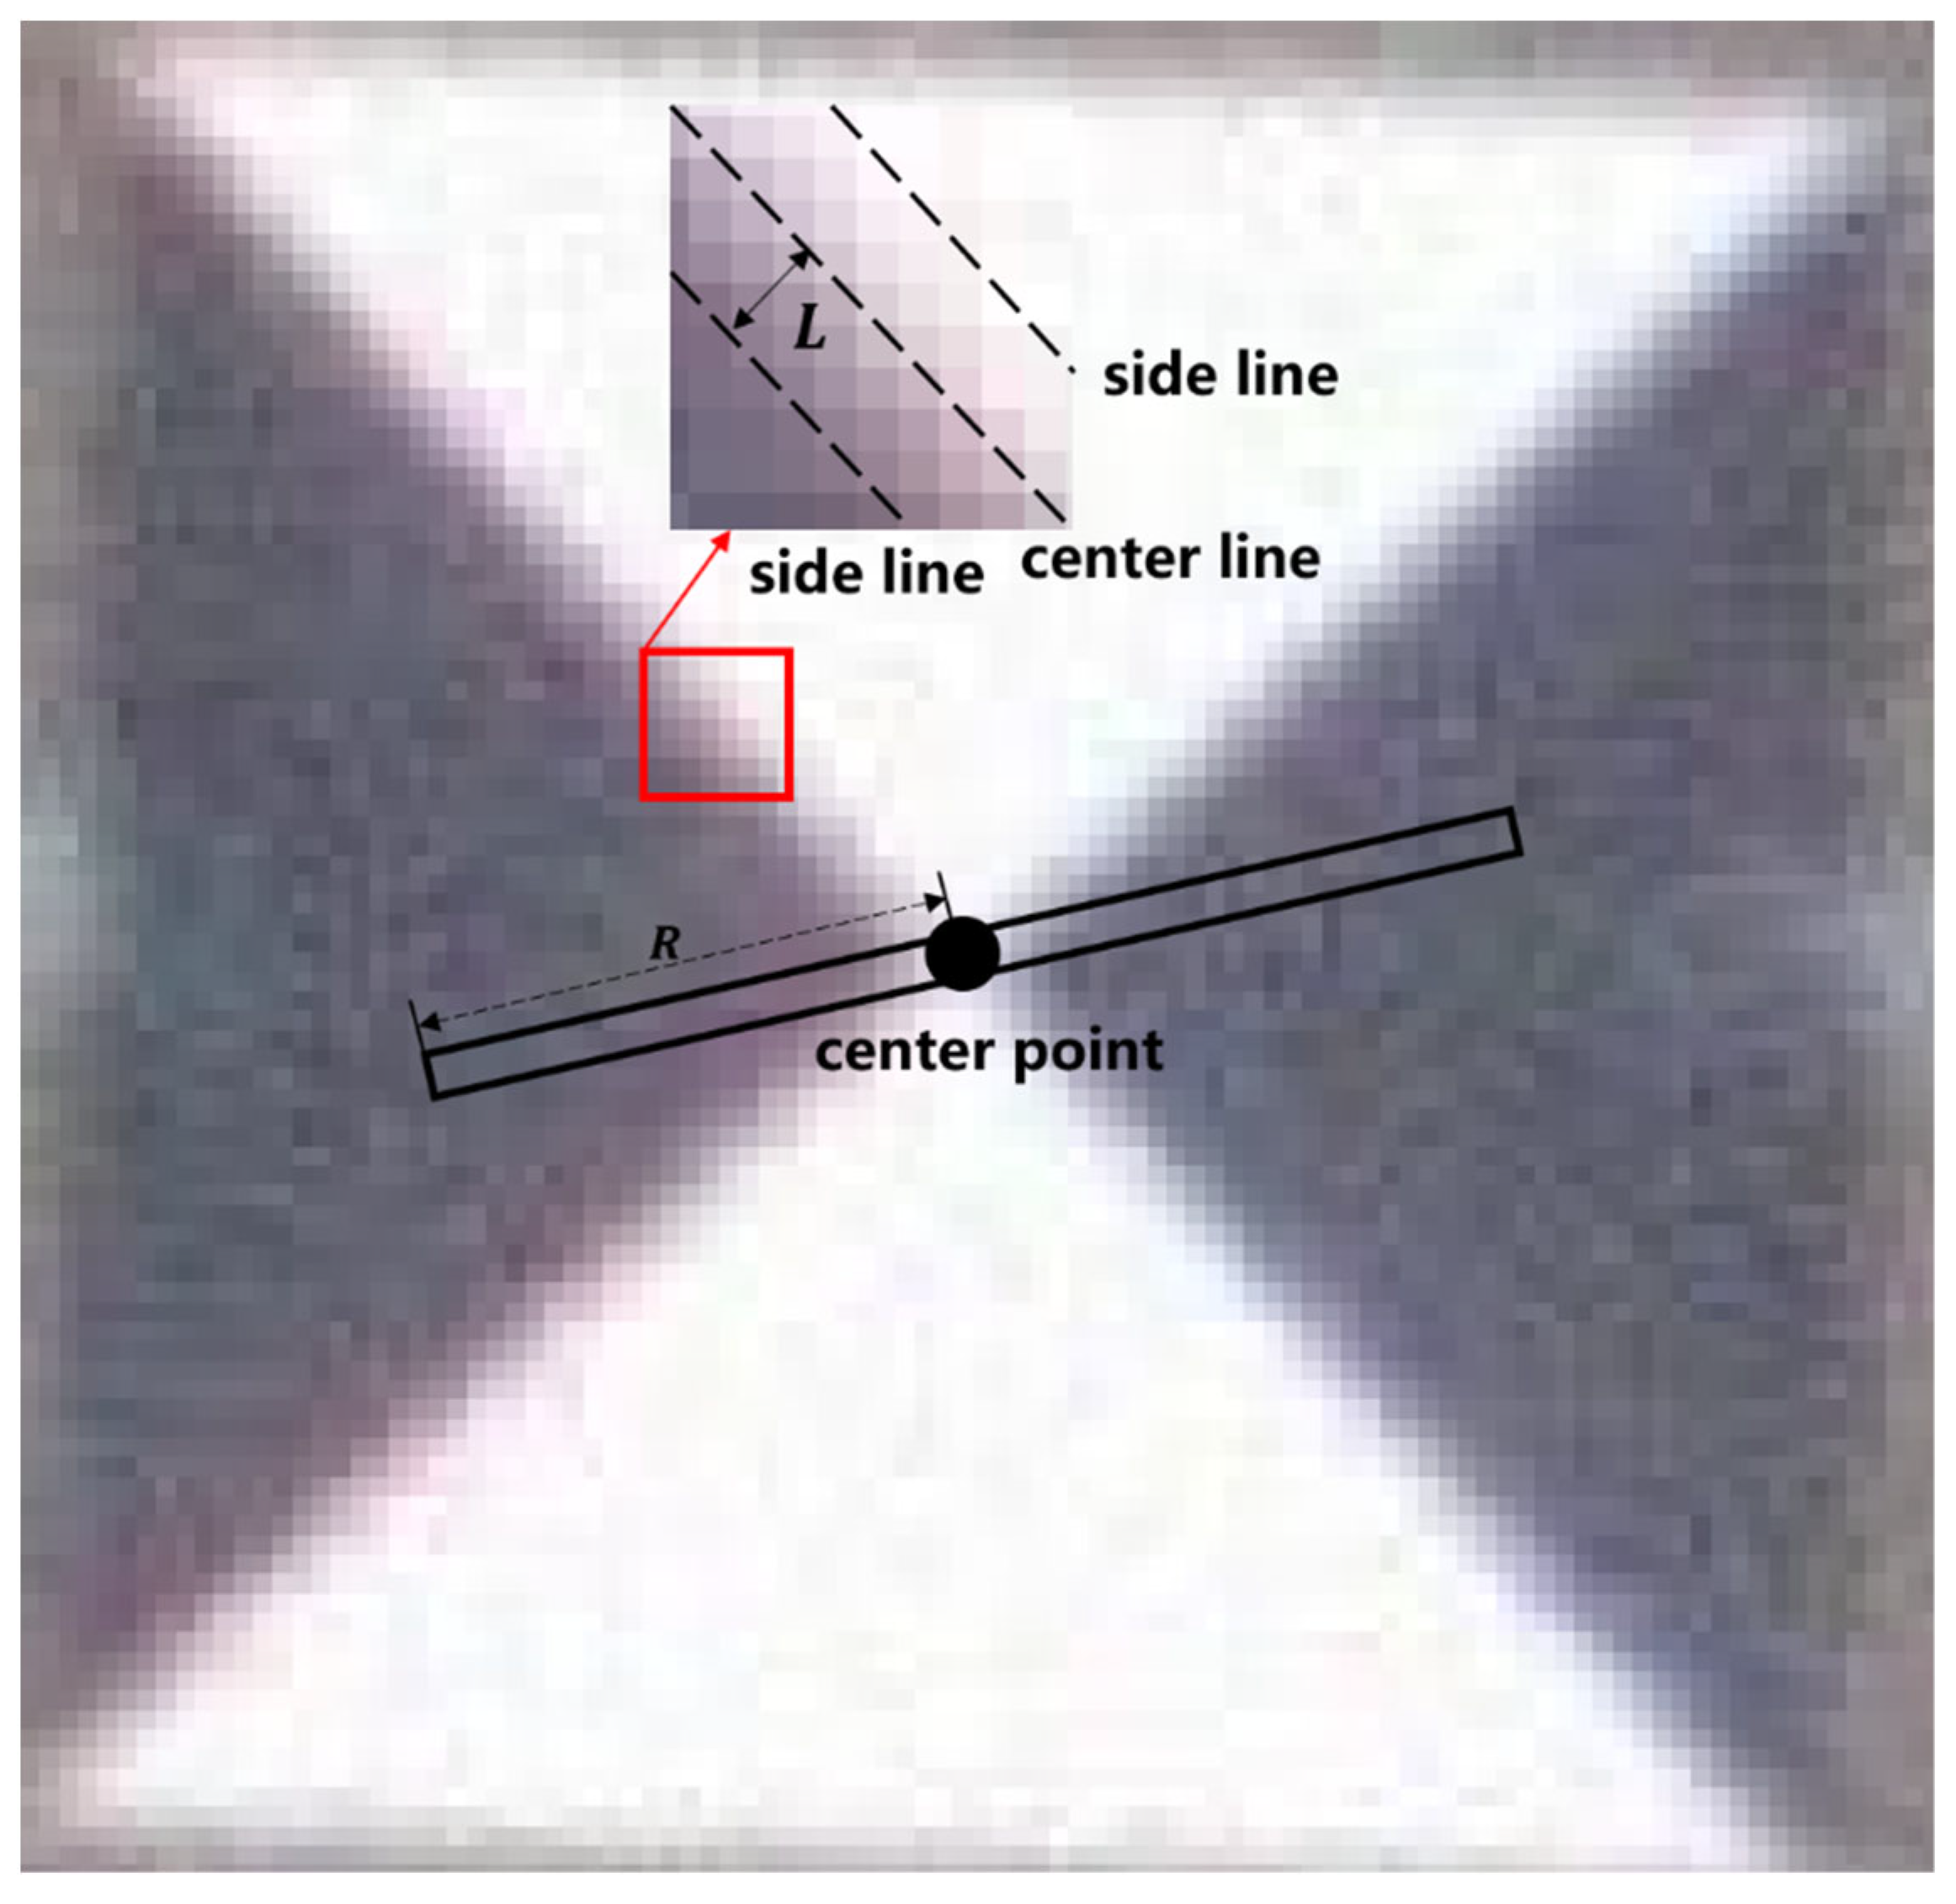
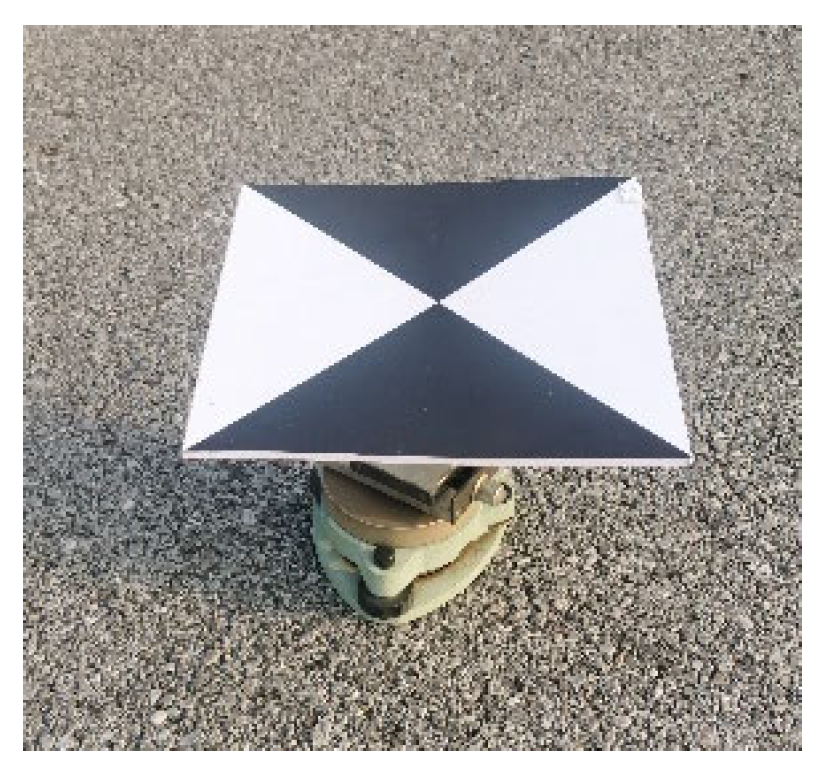
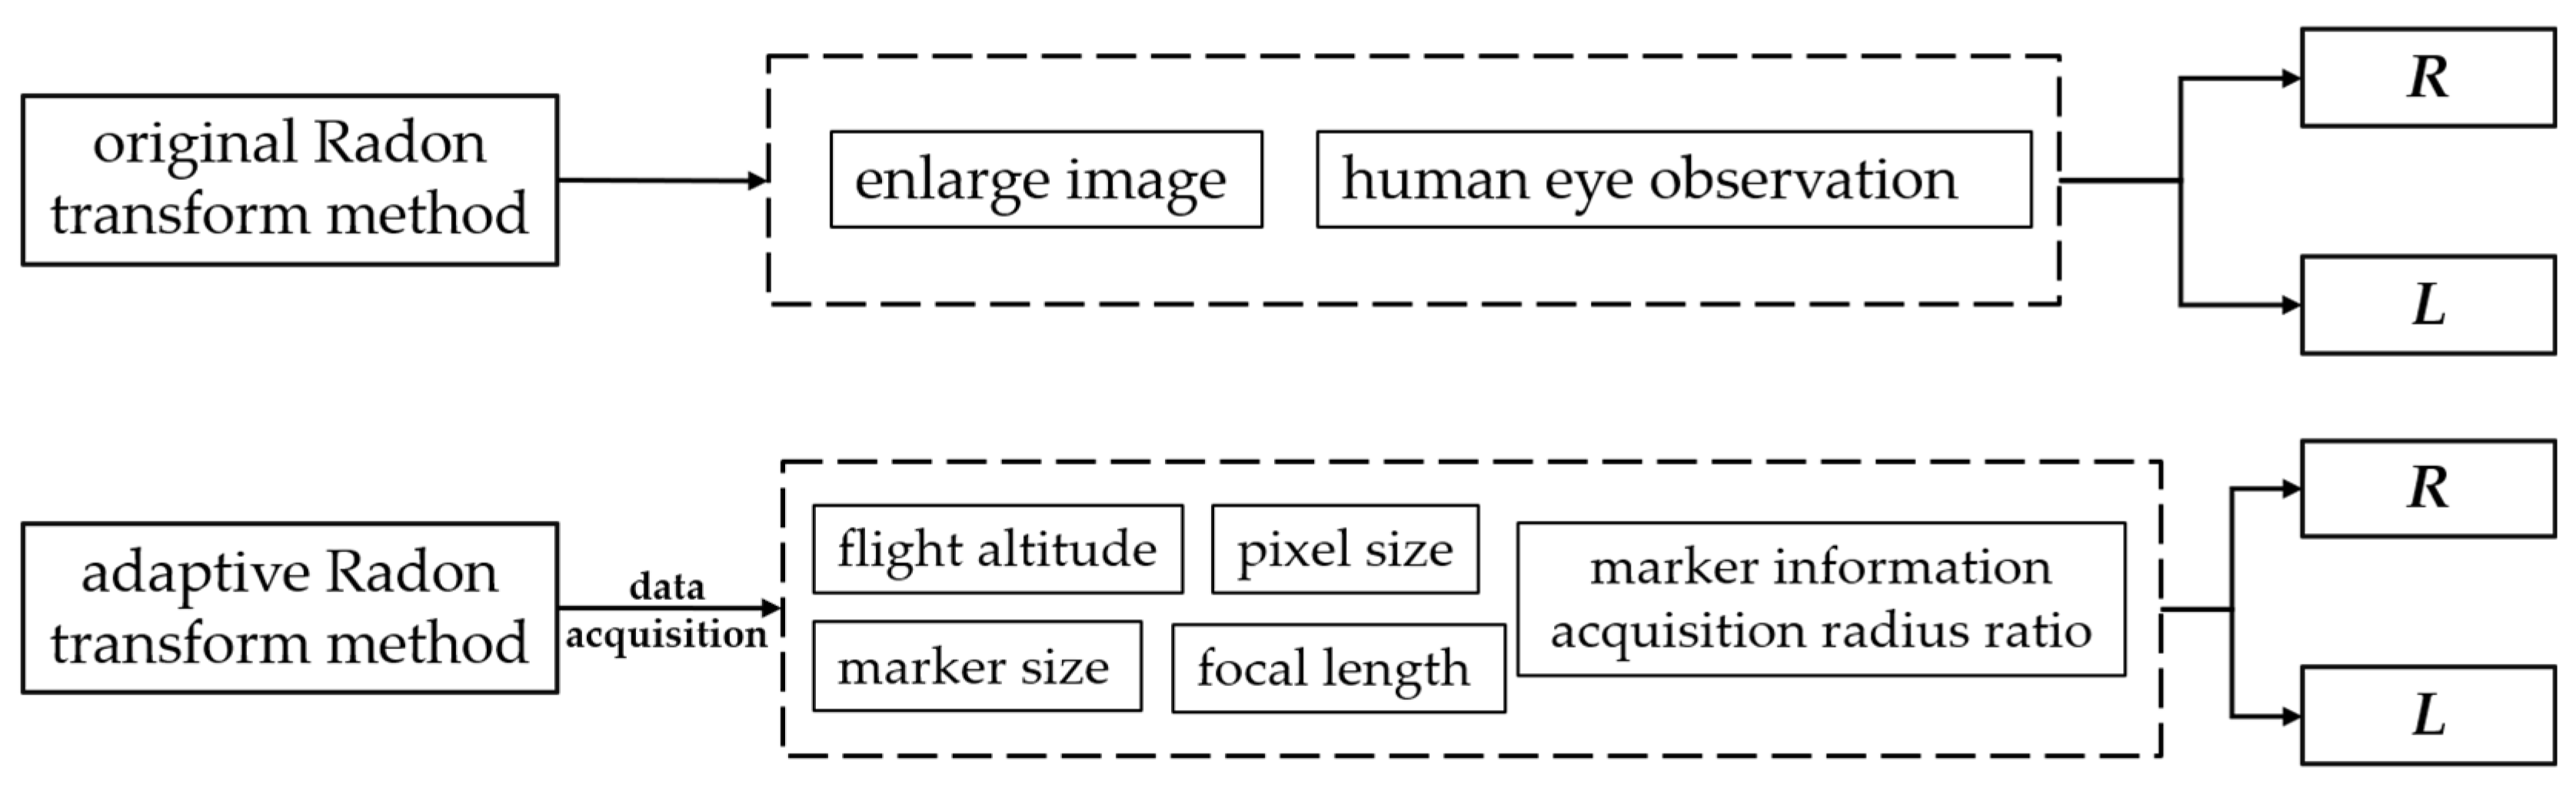
2.1. Cross-Shaped Marker Detection and Localization Method Based on the Radon Transform
2.2. Adaptive Cross-Shaped Marker Detection and Localization Method Based on the Radon Transform
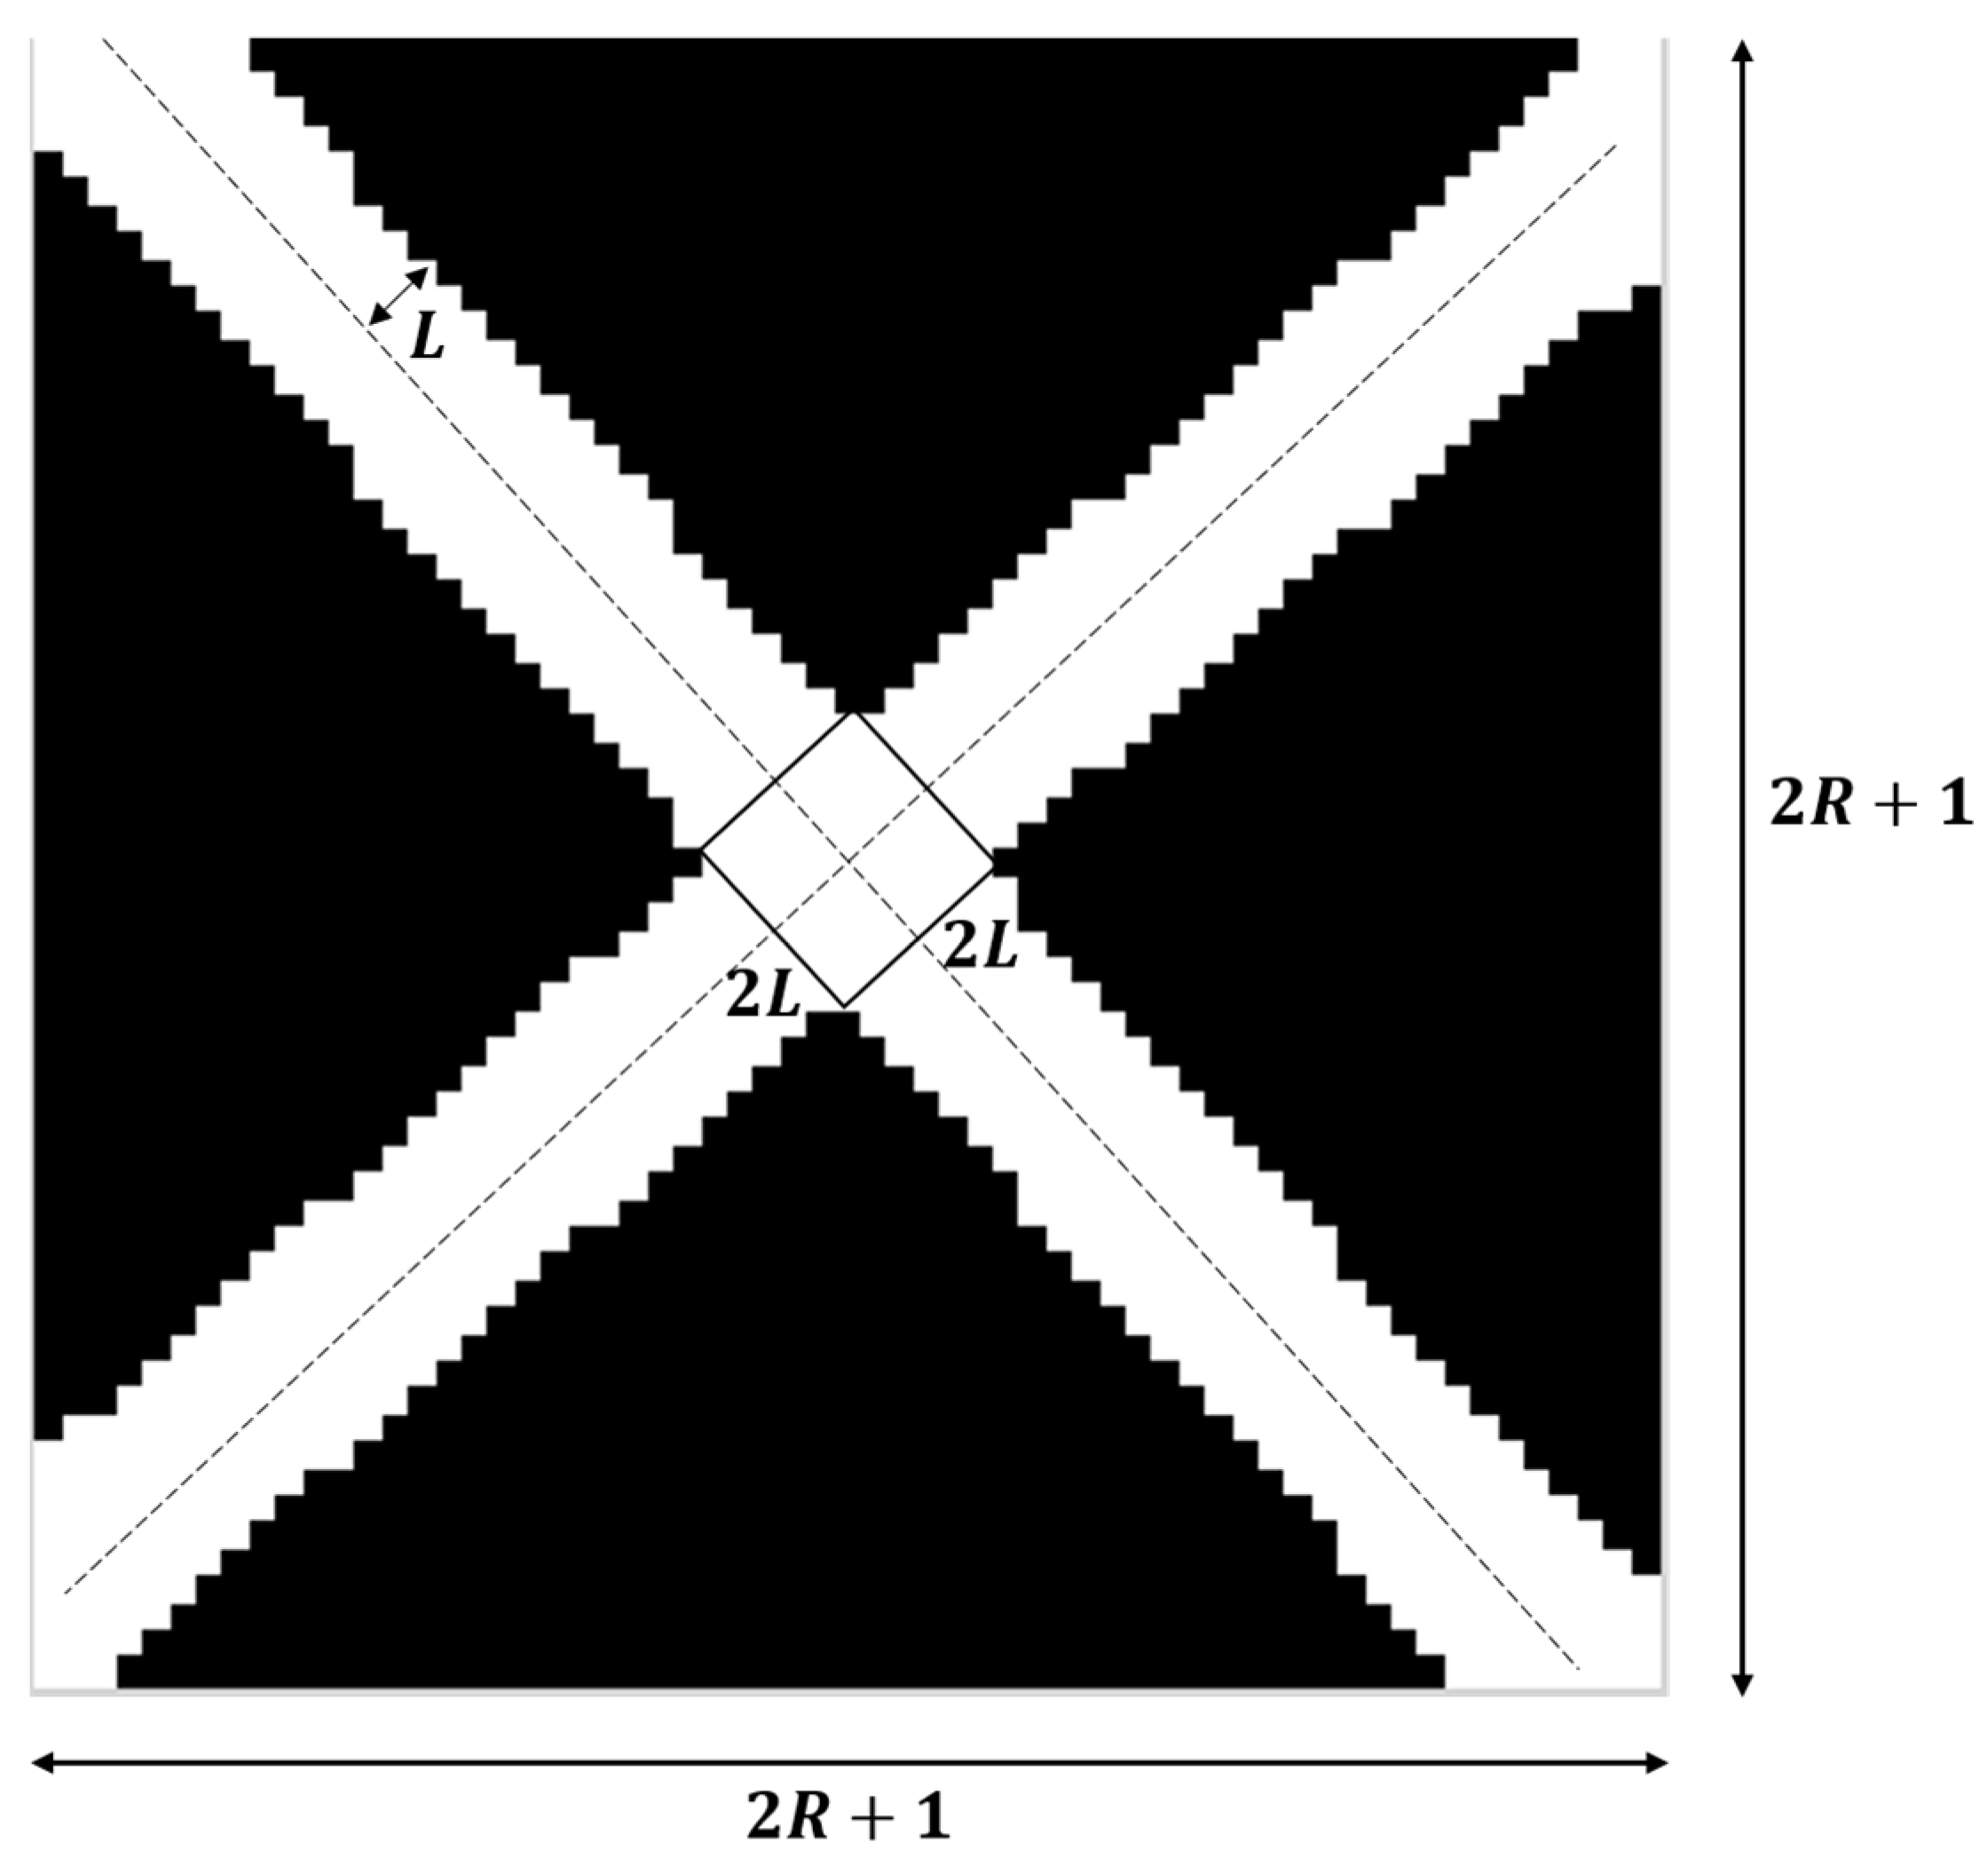
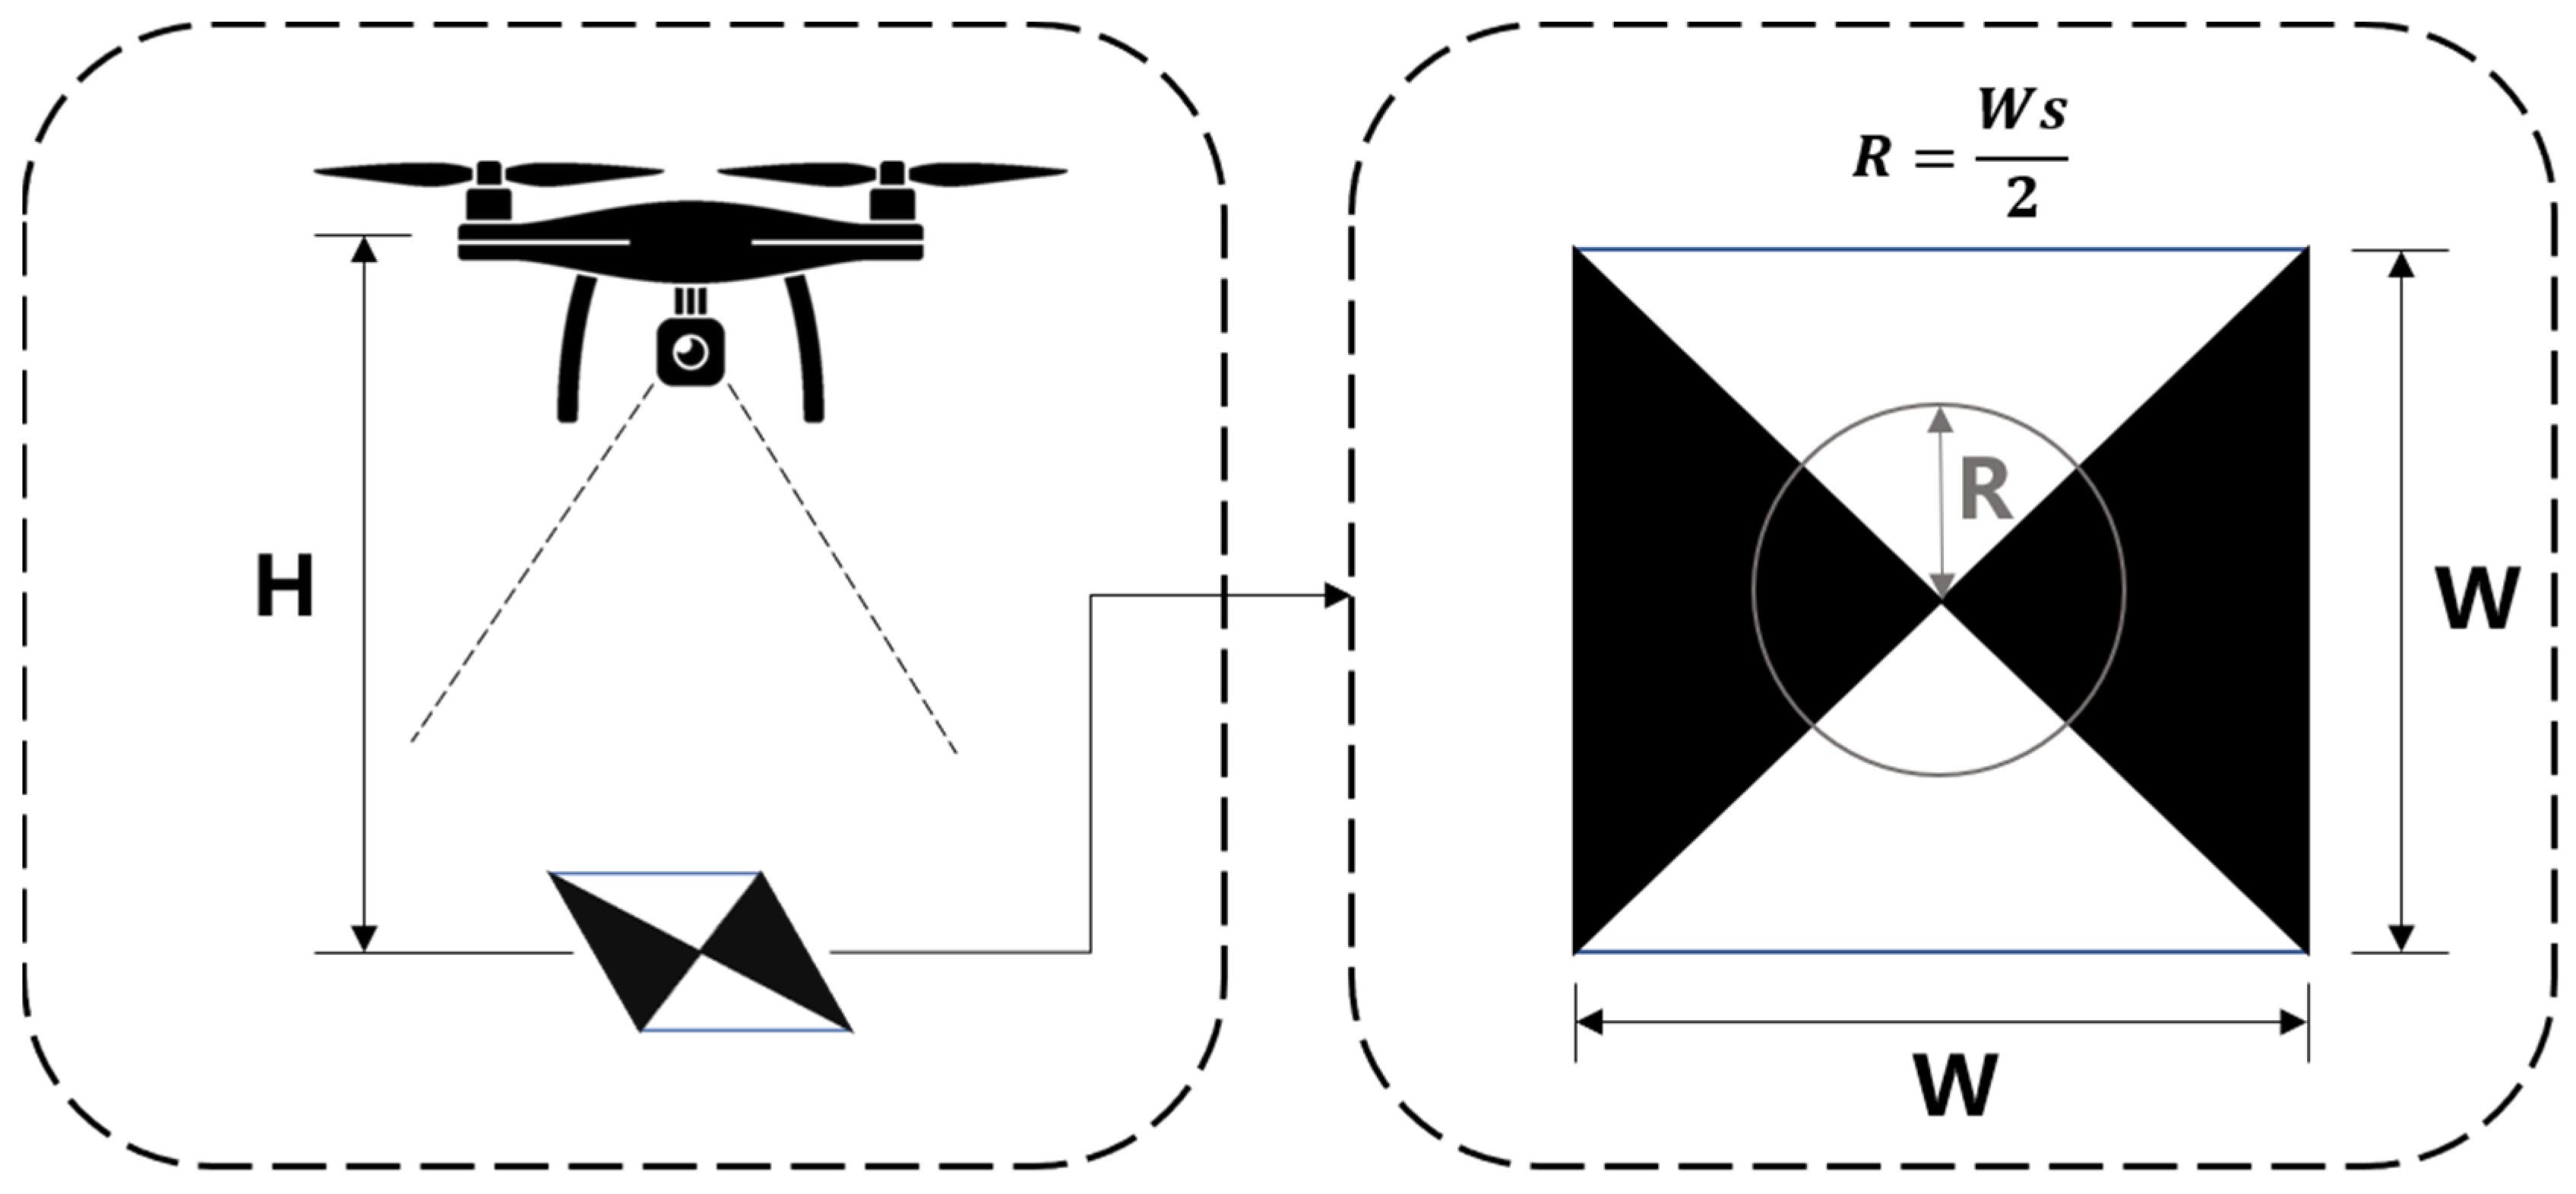
2.2.1. Adaptive Method for Determining the Marker Information Acquisition Radius
2.2.2. Adaptive Method for Determining the Edge Width of a Cross-Shaped Scoring Template
3. Experiments and Analysis
3.1. Critical Detection Radius
- (1)
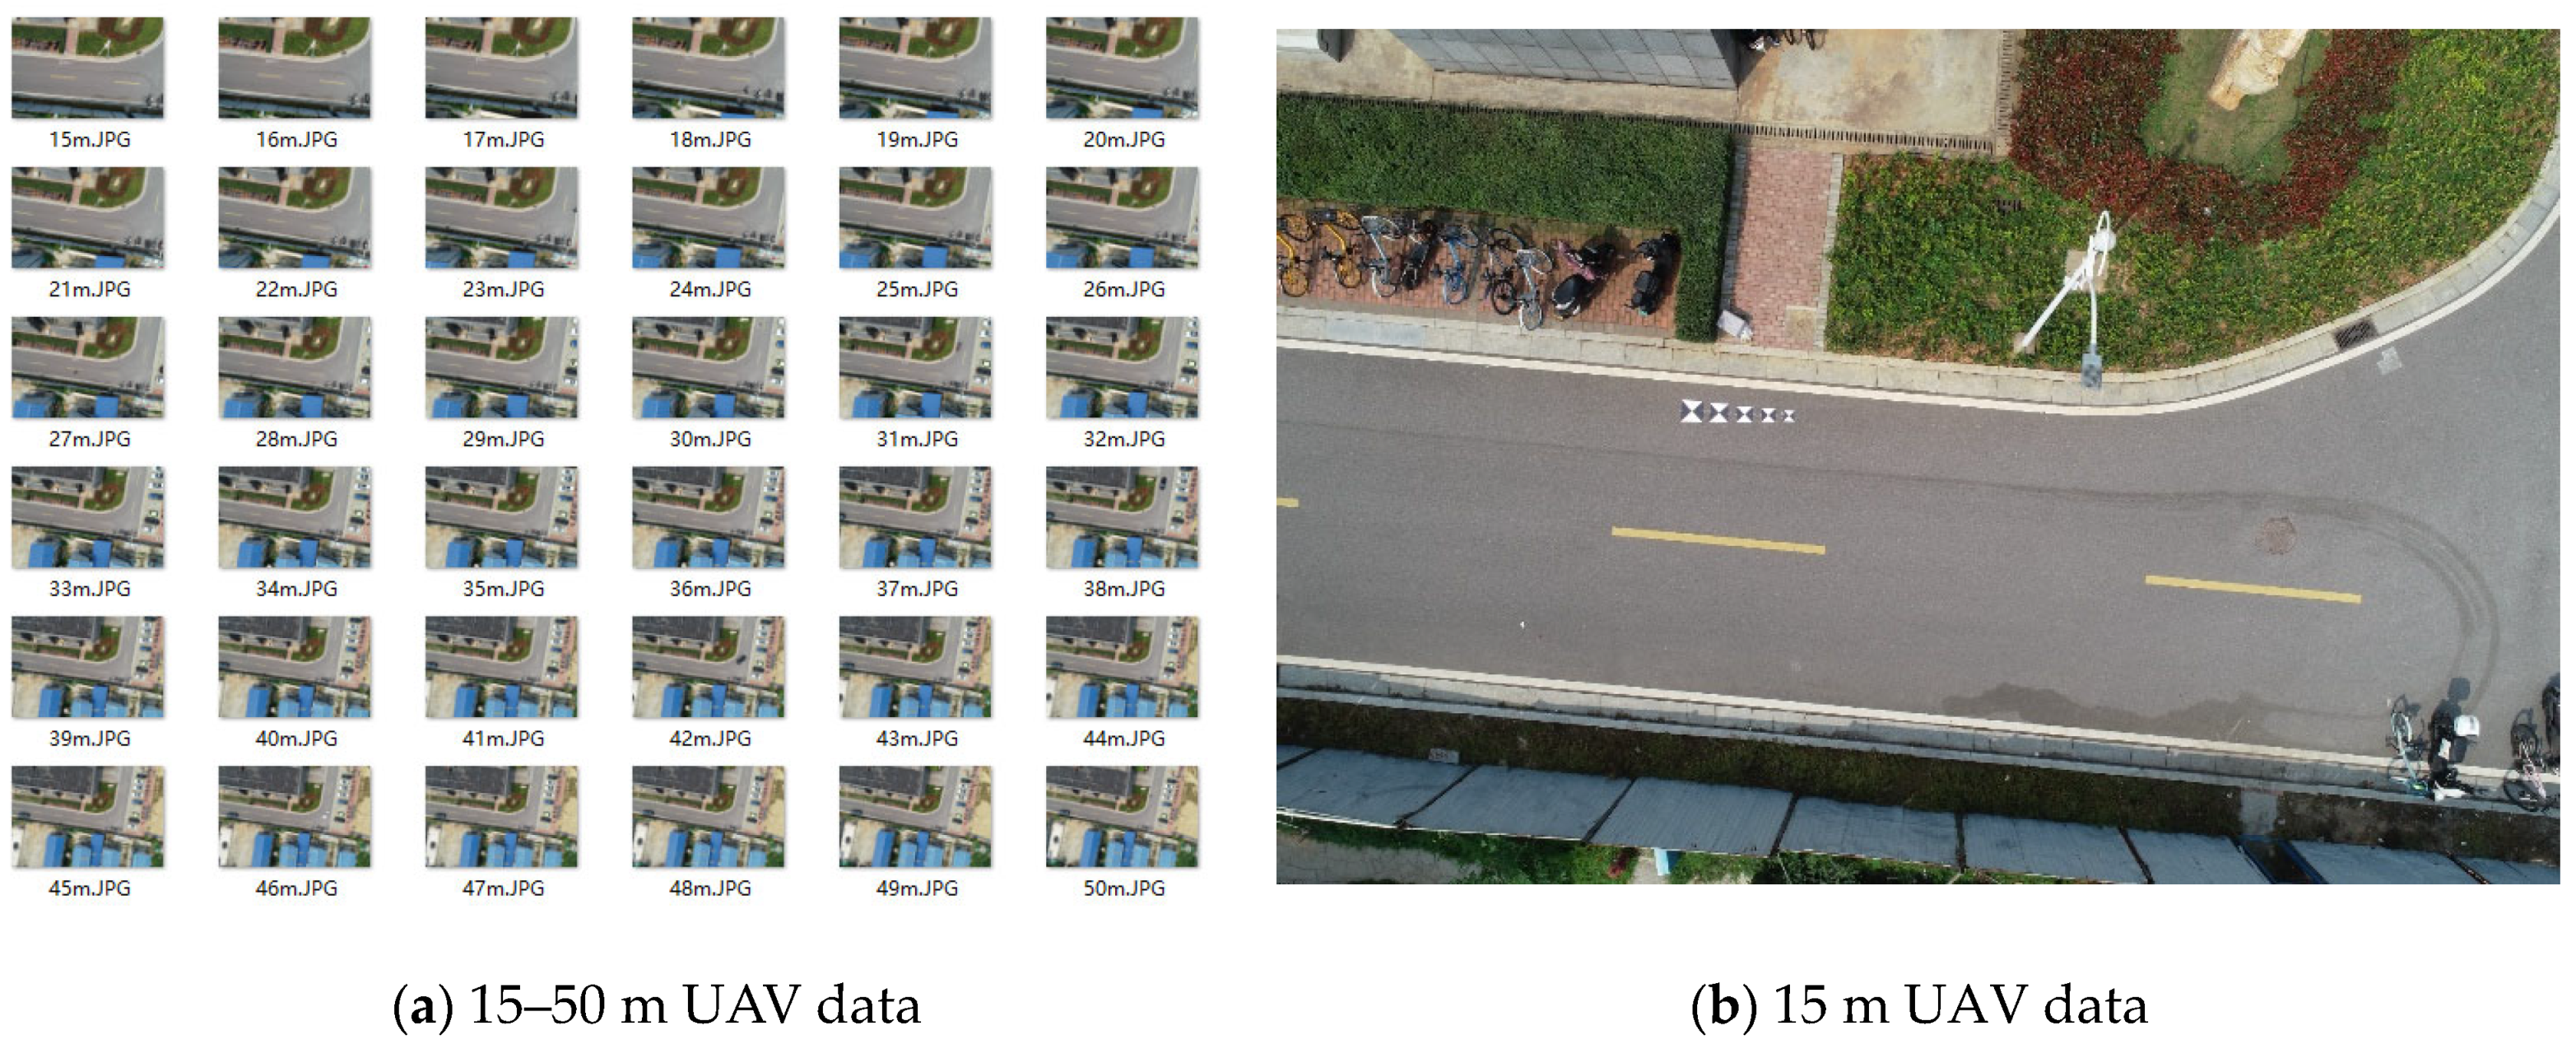
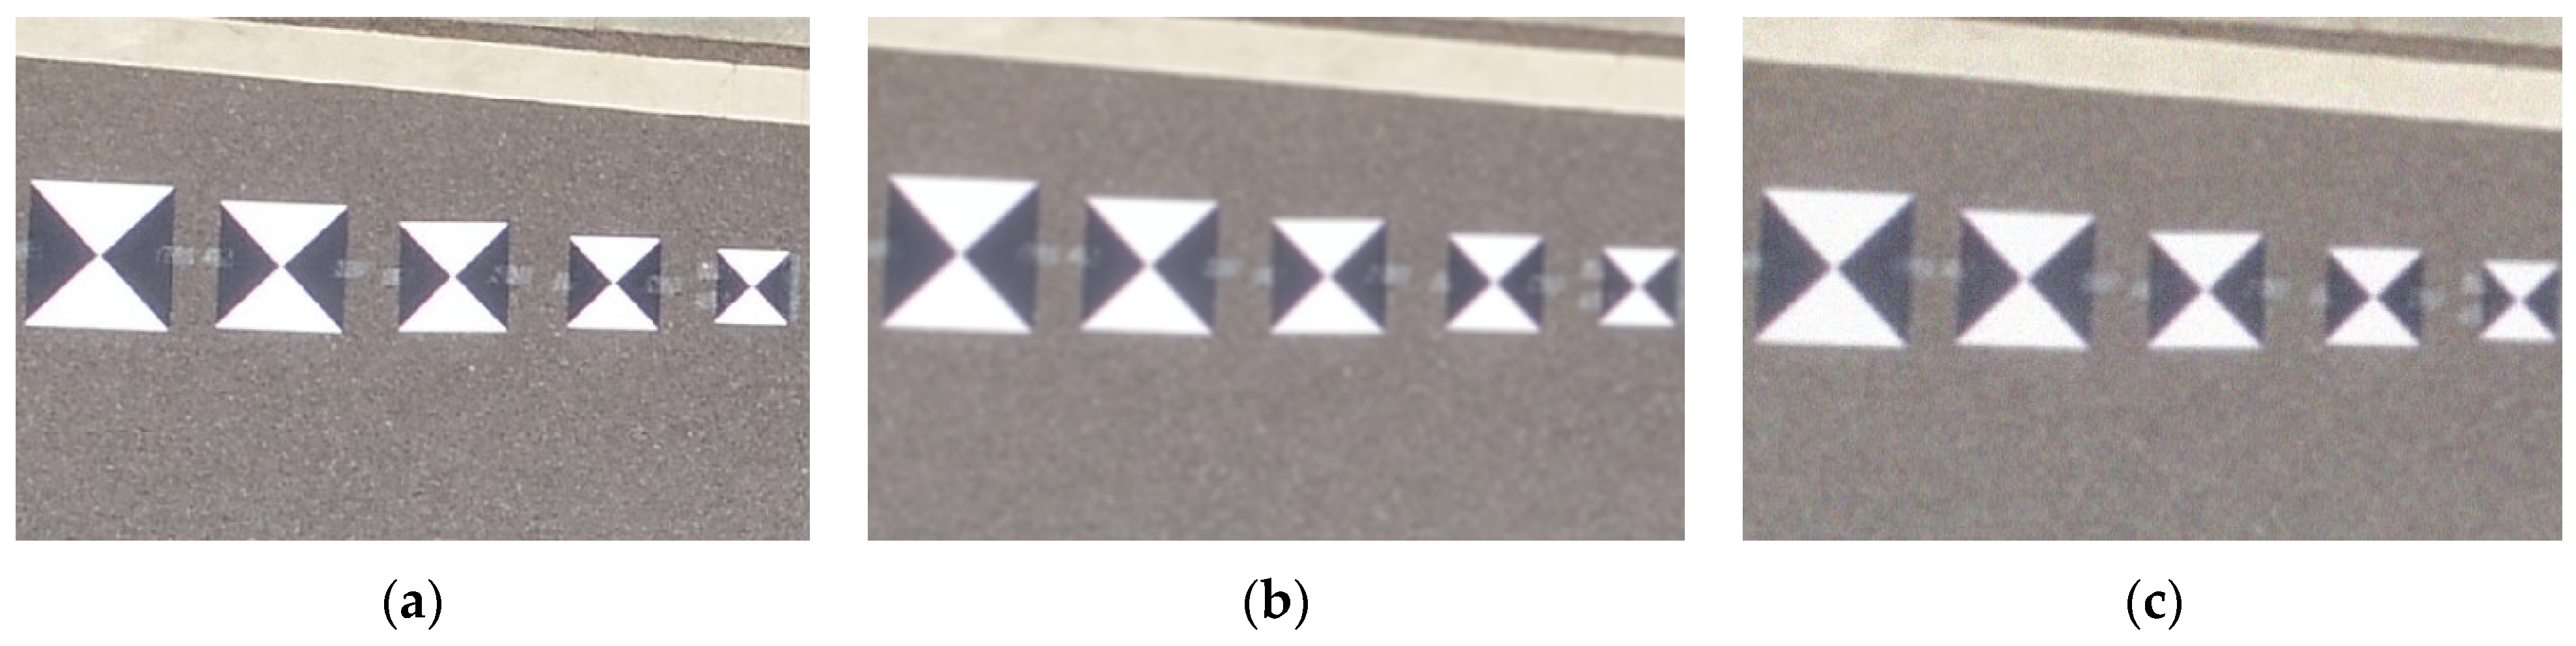
- : images were acquired at different heights from 15 m to 50 m with a step size of 1 m;
- (2)
- : five targets of {20, 25, 30, 35, 40} cm were laid at each height;
- (3)
- : each target was processed with six presets ratios {1/4, 1/3, 1/2, 2/3, 3/4, 1}.
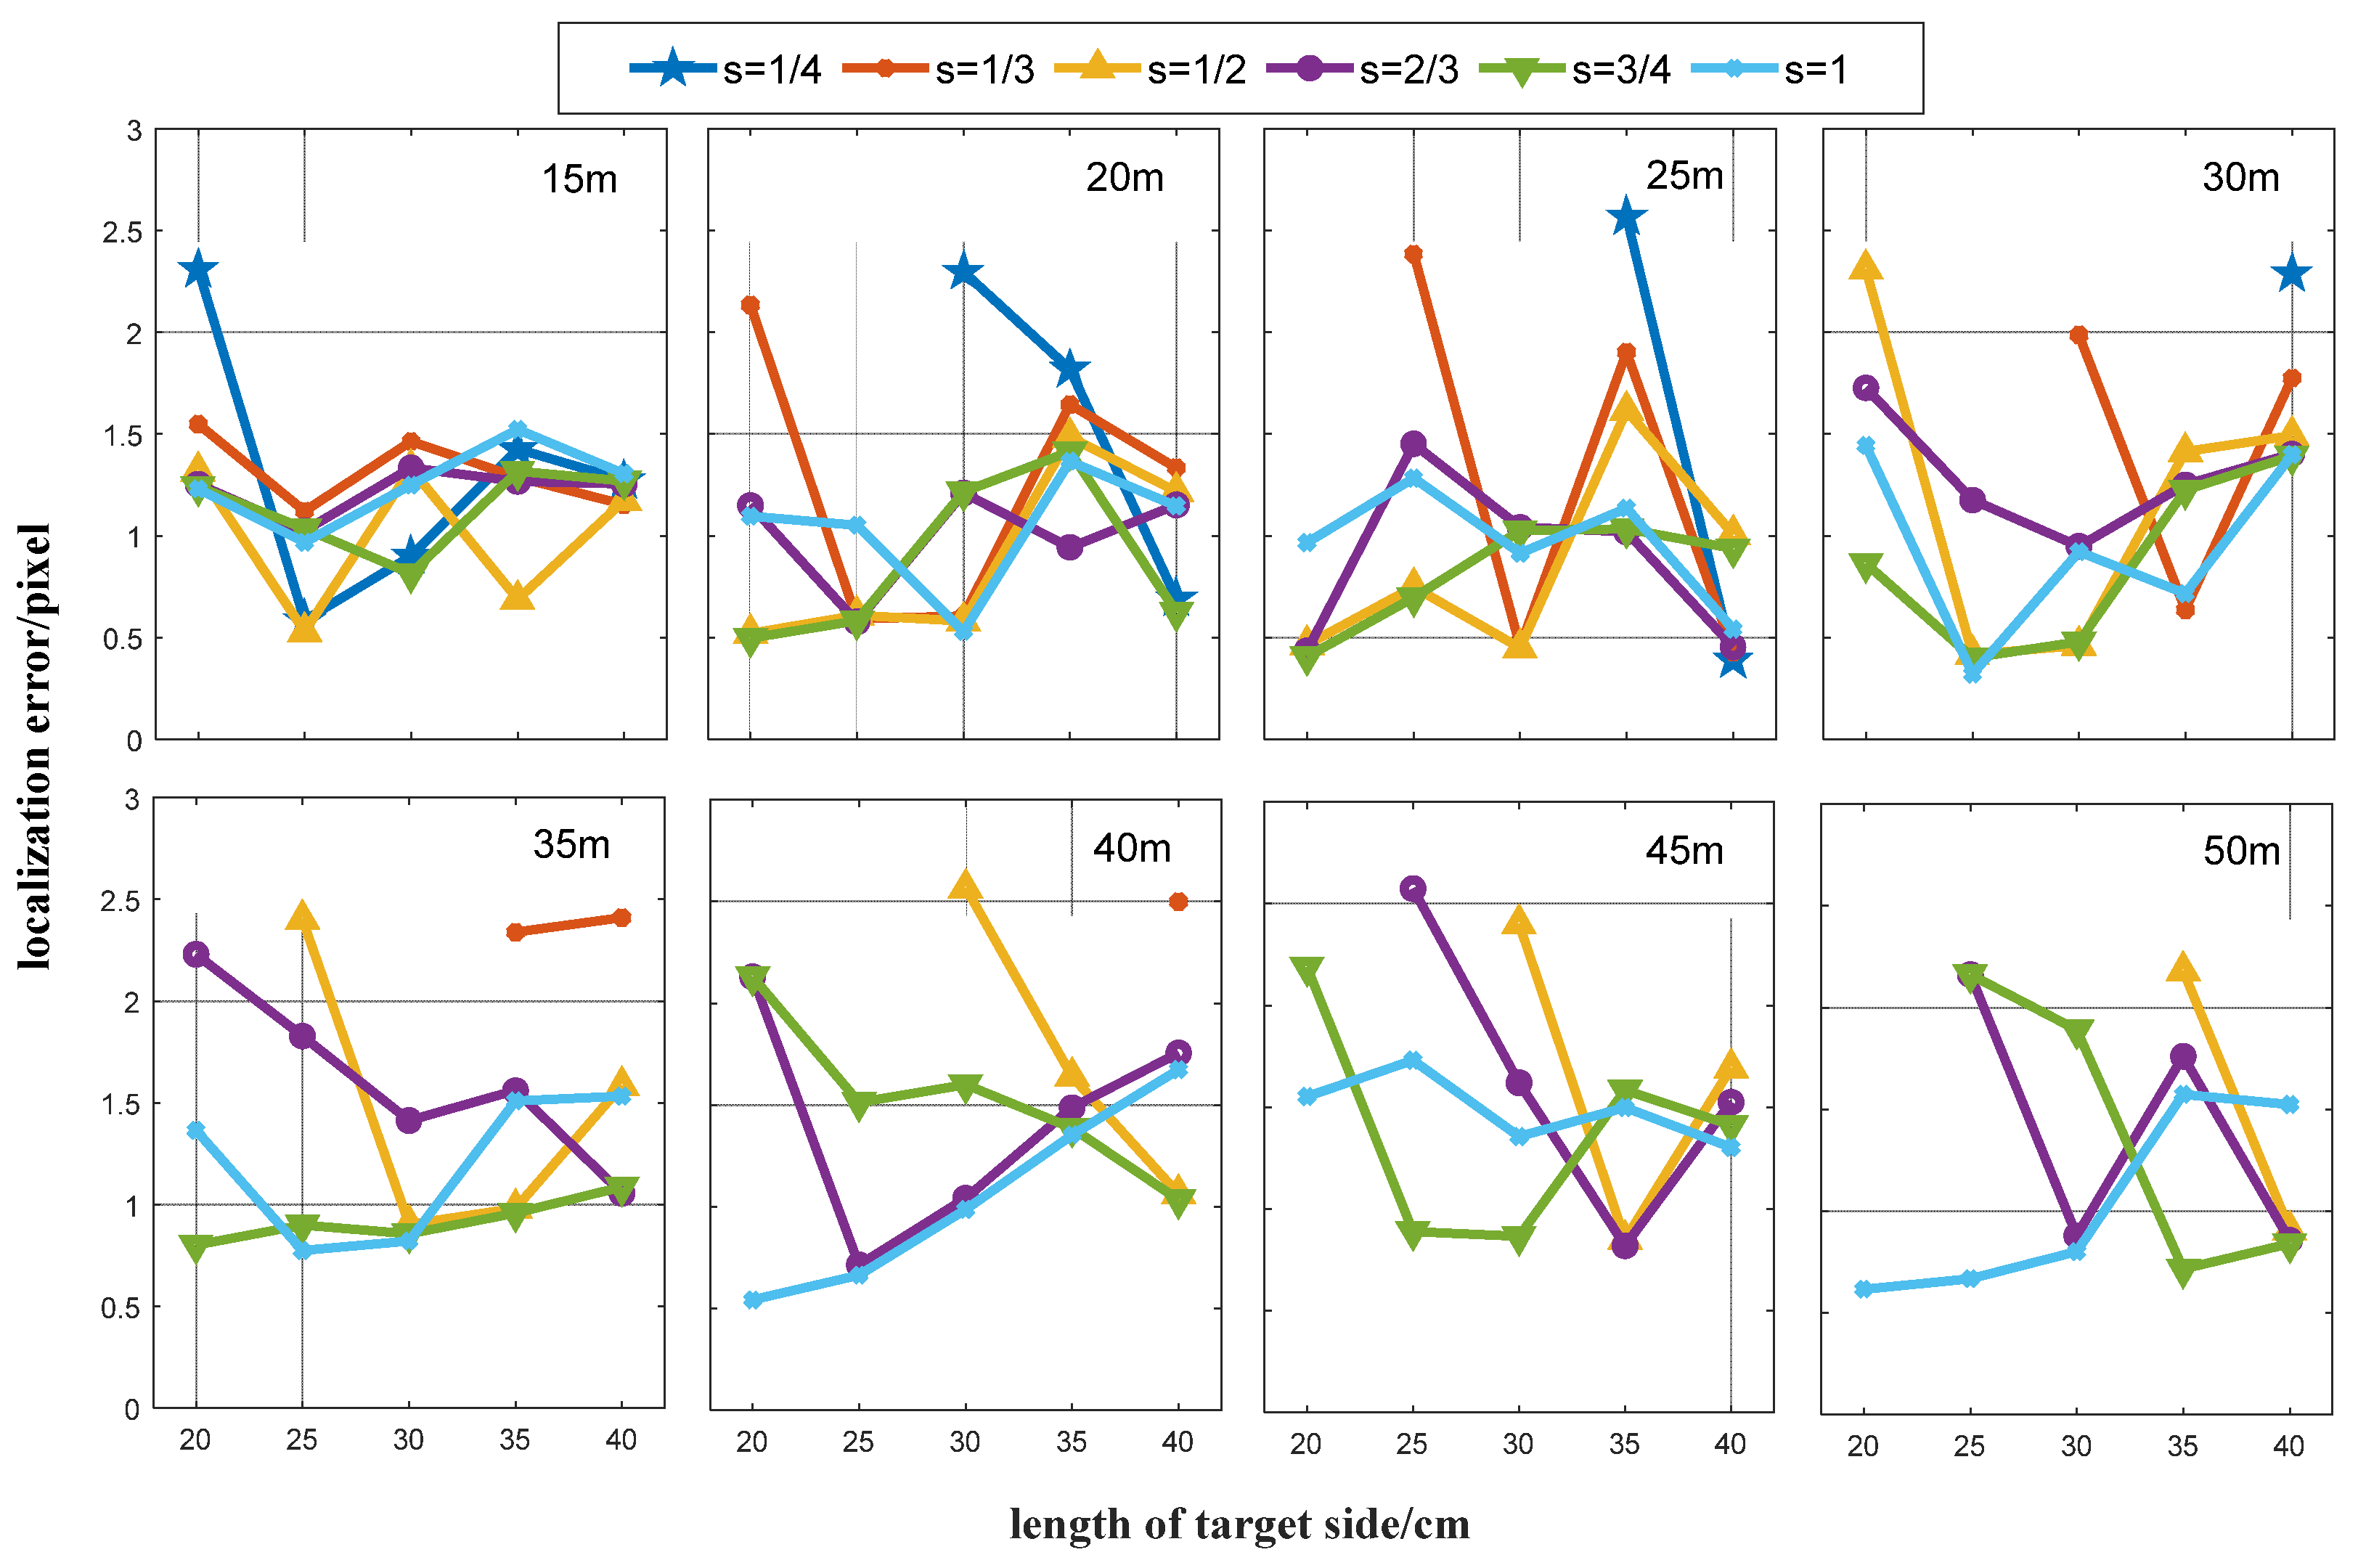
3.2. Appropriate Combinations of Detection Parameters
- (1)
- The minimum detection error was determined for each height of ;
- (2)
- The accuracy threshold was set and all detection errors were found that satisfy at height ;
- (3)
- As the value of increases, the difficulty of marker installation is more significant than the improvement in the computational efficiency. In this paper, we give priority to rather than . Therefore, among all the detection errors that satisfy the conditions in (2), we prioritized the combination of parameters with a small marker size as the appropriate detection parameter.
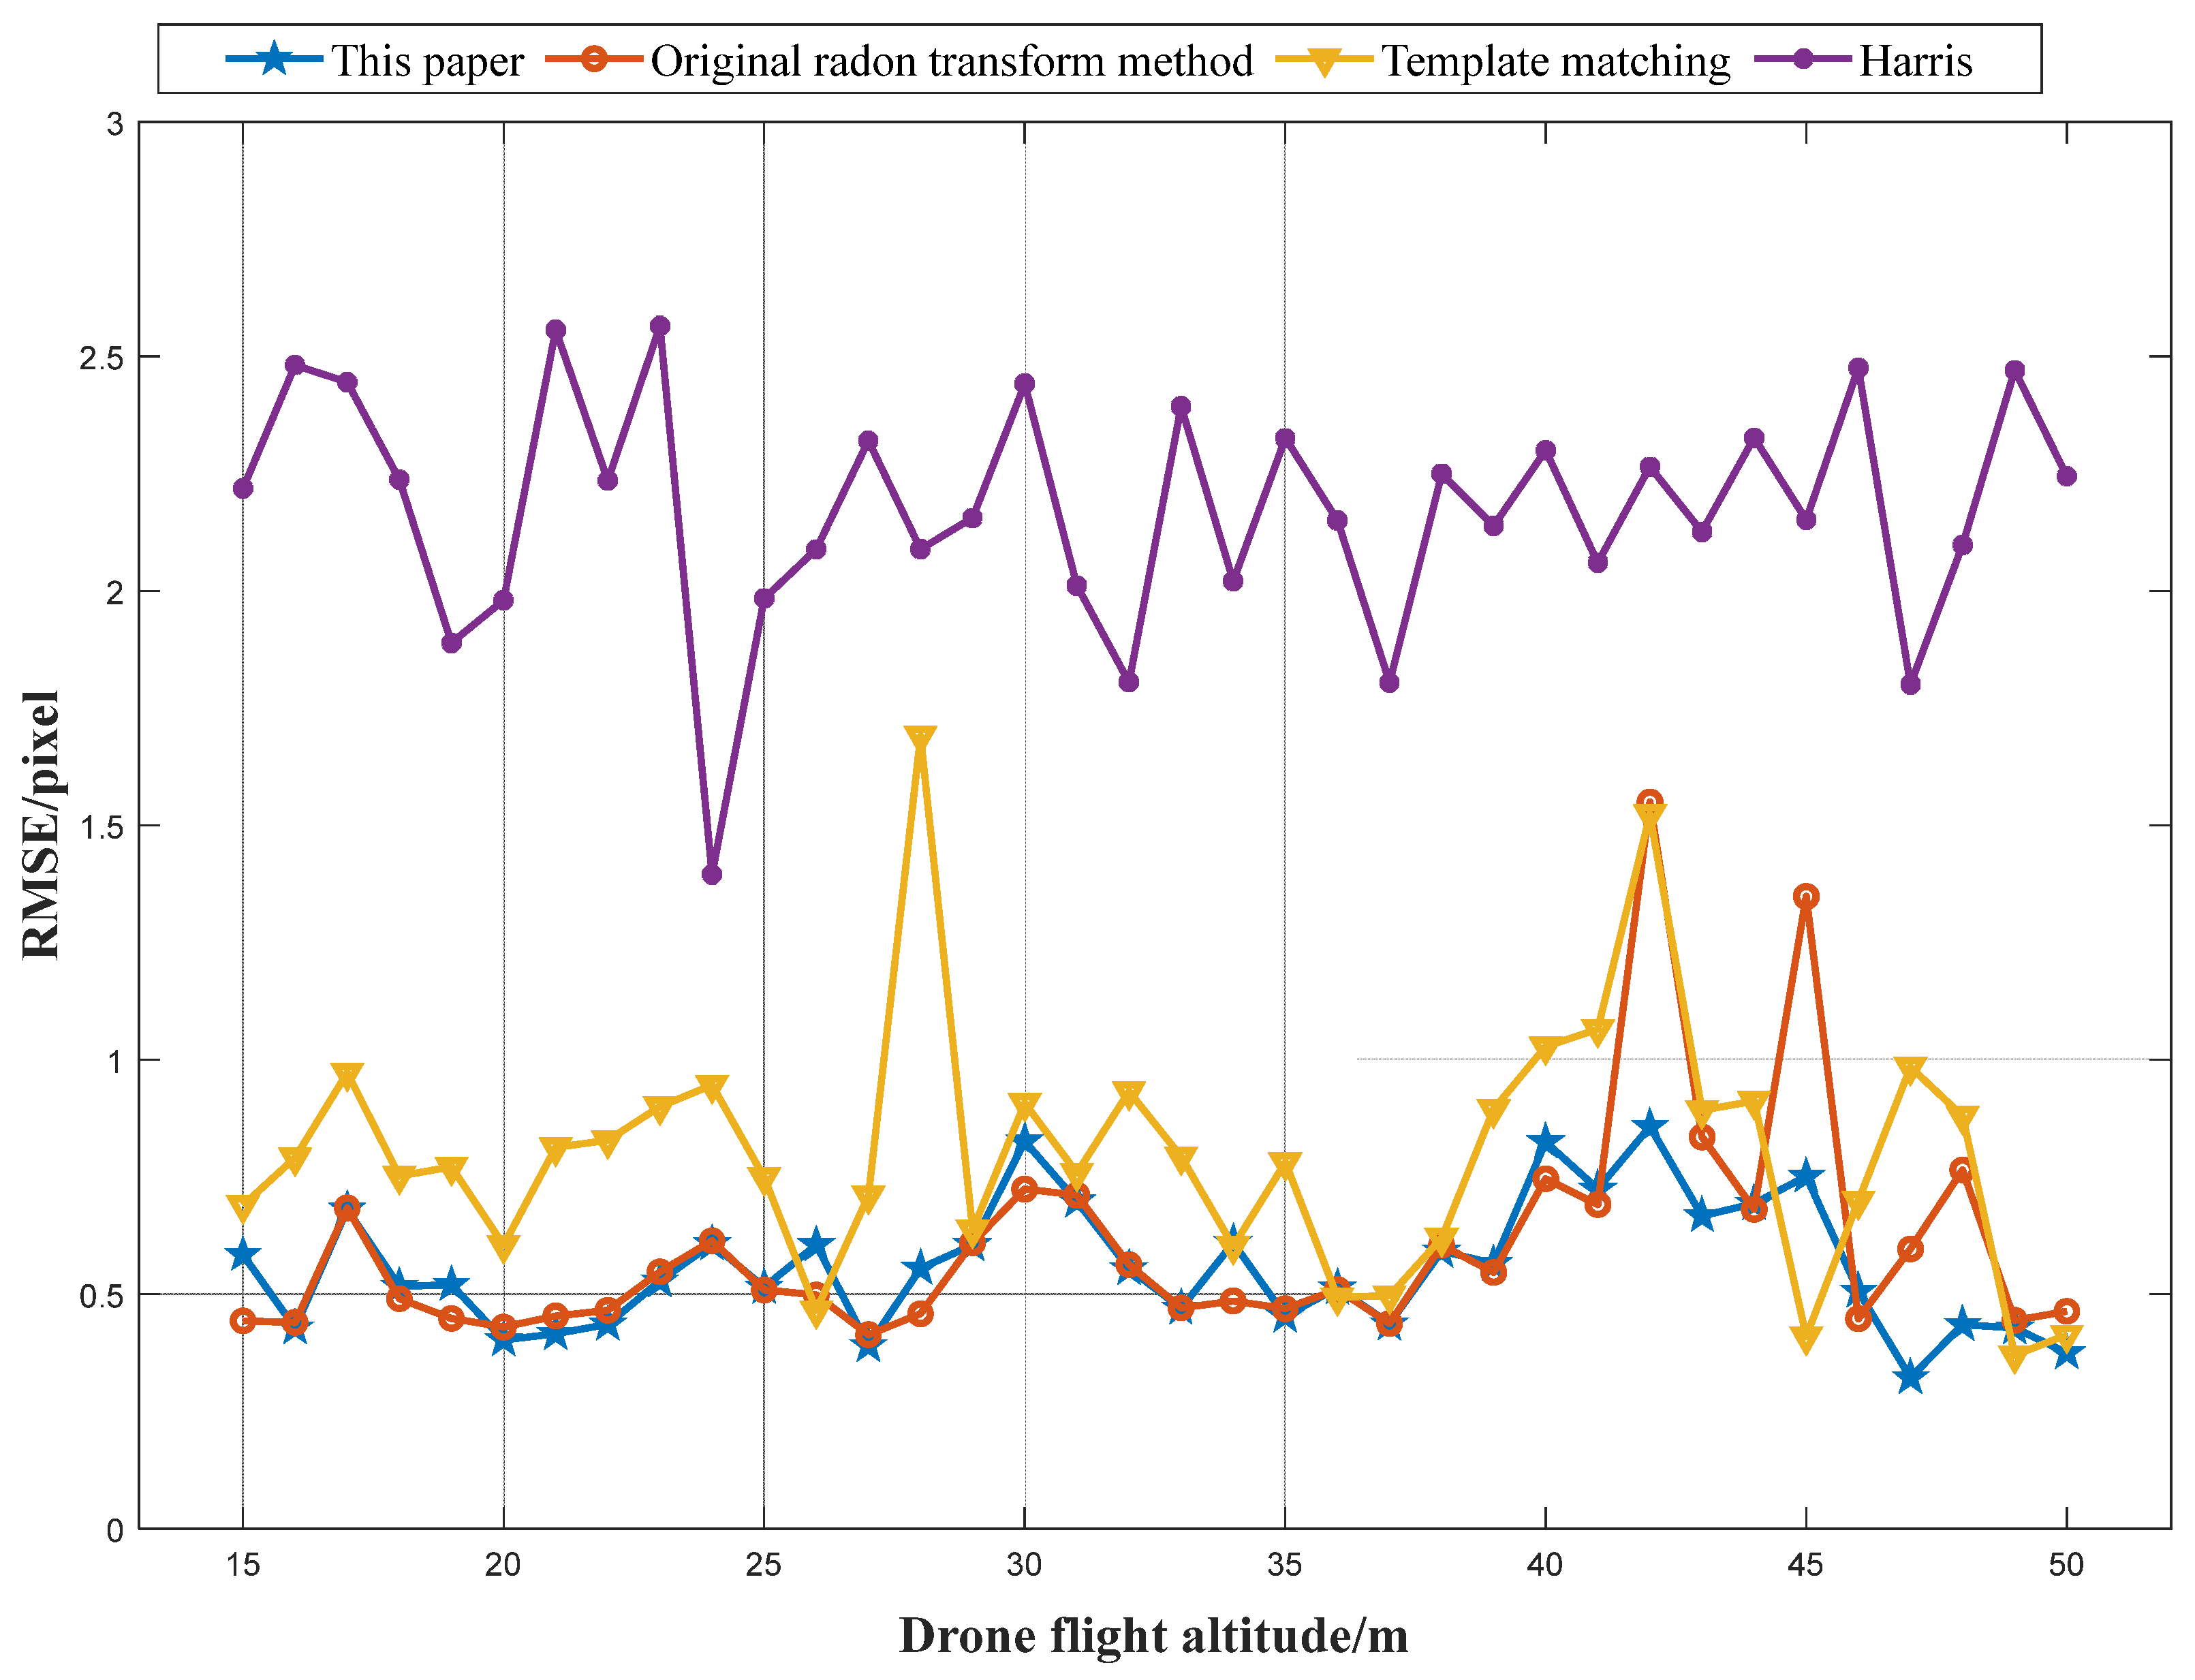
3.3. Performance of the Adaptive Radon Transform Method
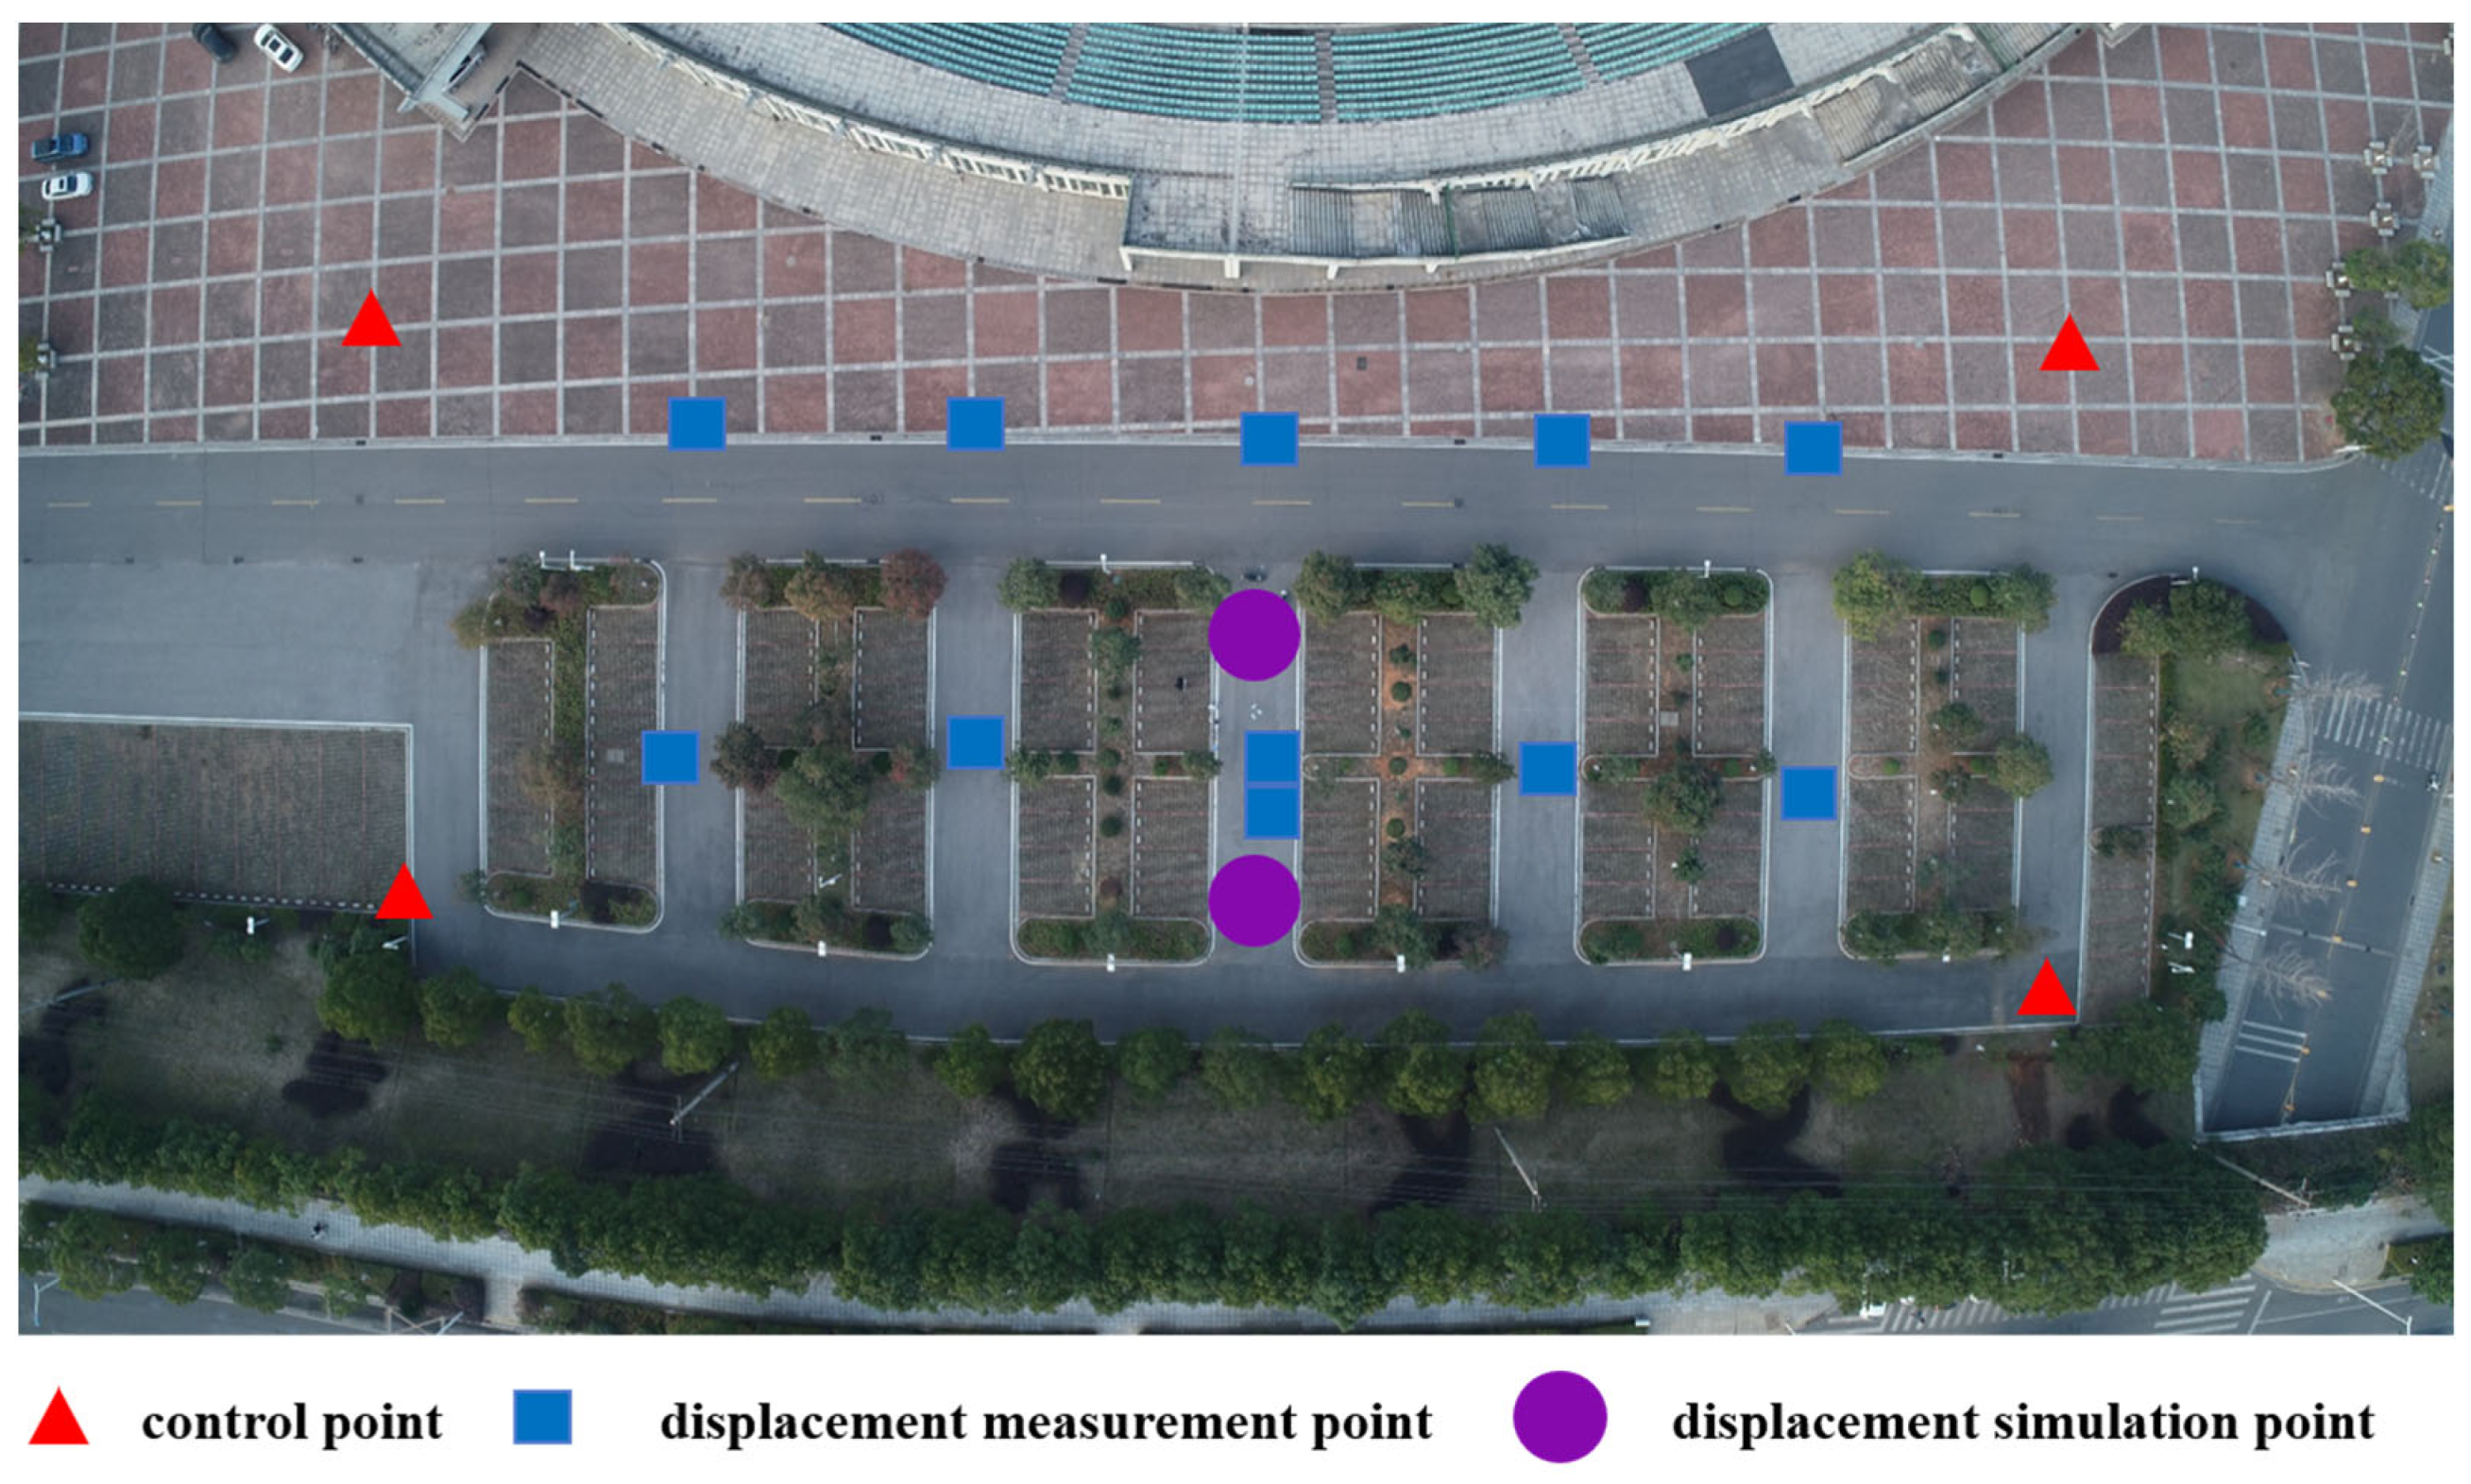
3.4. Displacement Measurement Experiment
4. Conclusions
Author Contributions
Funding
Institutional Review Board Statement
Informed Consent Statement
Data Availability Statement
Conflicts of Interest
References
- Niethammer, U.; Rothmund, S.; Schwaderer, U. Open source image-processing tools for low-cost UAV-based landslide investigations. Int. Arch. Photogramm. Remote Sens. Spat. Inf. Sci. 2012, 38, 161–166. [Google Scholar] [CrossRef]
- Stumpf, A.; Malet, J.P.; Allemand, P. Ground-based multi-view photogrammetry for the monitoring of landslide deformation and erosion. Geomorphology 2015, 231, 130–145. [Google Scholar] [CrossRef]
- Ong, W.H.; Chiu, W.K.; Kuen, T.; Kodikara, J. Determination of the State of Strain of Large Floating Covers Using Unmanned Aerial Vehicle (UAV) Aided Photogrammetry. Sensors 2017, 17, 1731. [Google Scholar] [CrossRef] [PubMed]
- Darmawan, H.; Walter, T.R.; Brotopuspito, K.S. Morphological and structural changes at the Merapi lava dome monitored in 2012–15 using unmanned aerial vehicles (UAVs). J. Volcanol. Geotherm. Res. 2018, 349, 256–267. [Google Scholar] [CrossRef]
- Xing, L.; Dai, W. A local feature extraction method for UAV-based image registration based on virtual line descriptors. Signal Image Video Process. 2021, 15, 705–713. [Google Scholar] [CrossRef]
- Gatrell, L.B.; Hoff, W.A.; Sklair, C.W. Robust image features: Concentric contrasting circles and their image extraction. Coop. Intell. Robot. Space II SPIE 1992, 1612, 235–244. [Google Scholar] [CrossRef]
- O’Connor, J. Impact of Image Quality on SfM Photogrammetry: Colour, Compression and Noise; Kingston University: Kingston, UK, 2018. [Google Scholar]
- Gonçalves, J.; Henriques, R. UAV photogrammetry for topographic monitoring of coastal areas. ISPRS J. Photogramm. Remote Sens. 2015, 104, 101–111. [Google Scholar] [CrossRef]
- Dong, S.; Ma, J.; Su, Z. Robust circular marker localization under non-uniform illuminations based on homomorphic filtering. Measurement 2021, 170, 108700. [Google Scholar] [CrossRef]
- Hastaoğlu, K.; Gül, Y.; Poyraz, F. Monitoring 3D areal displacements by a new methodology and software using UAV photogrammetry. Int. J. Appl. Earth Obs. Geoinf. 2019, 83, 101916. [Google Scholar] [CrossRef]
- Dandoš, R.; Mozdřeň, K.; Staňková, H. A new control mark for photogrammetry and its localization from single image using computer vision. Comput. Stand. Interfaces 2018, 56, 41–48. [Google Scholar] [CrossRef]
- Harris, C.; Stephens, M. A combined corner and edge detector. Alvey Vis. Conf. 1988, 15, 10–5244. [Google Scholar]
- Du, W.; Lei, D.; Hang, Z. Short-distance and long-distance bridge displacement measurement based on template matching and feature detection methods. J. Civ. Struct. Health Monit. 2023, 13, 343–360. [Google Scholar] [CrossRef]
- Geiger, A.; Moosmann, F.; Car, Ö. Automatic camera and range sensor calibration using a single shot. In Proceedings of the 2012 IEEE International Conference on Robotics and Automation, St. Paul, MN, USA, 14–18 May 2012; IEEE: Piscataway, NJ USA, 2012; pp. 3936–3943. [Google Scholar] [CrossRef]
- Redmon, J.; Divvala, S.; Girshick, R. You only look once: Unified, real-time object detection. In Proceedings of the IEEE Conference on Computer Vision and Pattern Recognition, Las Vegas, NV, USA, 26 June–1 July 2016; pp. 779–788. [Google Scholar]
- Ren, S.; He, K.; Girshick, R. Faster r-cnn: Towards real-time object detection with region proposal networks. Adv. Neural Inf. Process. Syst. 2015, 28. [Google Scholar] [CrossRef] [PubMed]
- Liu, W.; Anguelov, D.; Erhan, D. Ssd: Single shot multibox detector. In Proceedings of the Computer Vision–ECCV 2016: 14th European Conference, Amsterdam, The Netherlands, 11–14 October 2016; Proceedings, Part I 14. Springer International Publishing: Berlin/Heidelberg, Germany, 2016; pp. 21–37. [Google Scholar]
- Cheng, C.; Wang, X.; Li, X. UAV image matching based on surf feature and harris corner algorithm. In Proceedings of the 4th International Conference on Smart and Sustainable City (ICSSC 2017), Shanghai, China, 5–6 June 2017. [Google Scholar] [CrossRef]
- Azimbeik, K.; Mahdavi, S.; Rofooei, F. Improved image-based, full-field structural displacement measurement using template matching and camera calibration methods. Measurement 2023, 211, 112650. [Google Scholar] [CrossRef]
- Girshick, R.; Donahue, J.; Darrell, T. Rich feature hierarchies for accurate object detection and semantic segmentation. In Proceedings of the IEEE Conference on Computer Vision and Pattern Recognition, Columbus, OH, USA, 23–28 June 2014; pp. 580–587. [Google Scholar]
- Xing, L.; Dai, W. A Robust Detection and Localization Method for Cross-Shaped Markers Oriented to Vision Measurement. Sci. Surv. Mapp. 2022, 47, 58–64. [Google Scholar]
- Ha, H.; Perdoch, M.; Alismail, H. Deltille grids for geometric camera calibration. In Proceedings of the IEEE International Conference on Computer Vision 2017, Venice, Italy, 22–29 October 2017; pp. 5344–5352. [Google Scholar]


| Parameter Name | Parameter Data |
|---|---|
| type | FC6310R |
| resolution | 5472 × 3648 |
| focal length | 8.8 (mm) |
| pixel size | 2.4 (um) |
| W (cm) | s | H (m) | R (Pixel) | |
|---|---|---|---|---|
| Group 1 | 20 | 1/4 | 18 | 5 |
| Group 2 | 20 | 1/3 | 23 | 5 |
| Group 3 | 20 | 1/2 | 34 | 5 |
| Group 4 | 20 | 2/3 | 46 | 5 |
| Group 5 | 20 | 3/4 | 46 | 5 |
| Group 6 | 25 | 1/4 | 21 | 5 |
| Group 7 | 25 | 1/3 | 27 | 5 |
| Group 8 | 25 | 1/2 | 34 | 6 |
| Group 9 | 30 | 1/4 | 21 | 6 |
| Group 10 | 30 | 1/3 | 37 | 4 |
| Group 11 | 30 | 1/2 | 46 | 5 |
| Group 12 | 35 | 1/4 | 28 | 5 |
| Group 13 | 35 | 1/3 | 39 | 5 |
| Group 14 | 40 | 1/4 | 32 | 5 |
| Group 15 | 40 | 1/3 | 42 | 5 |
| Flying Height | W/cm | s | Avg_RMSE */Pixel | Min_Error/Pixel | Error/Pixel |
|---|---|---|---|---|---|
| 15 m | 25 | 1/2 | 1.25 | 0.53 | 0.53 |
| 20 m | 20 | 3/4 | 1.18 | 0.50 | 0.50 |
| 25 m | 20 | 3/4 | 1.15 | 0.39 | 0.41 |
| 30 m | 25 | 1 | 1.32 | 0.32 | 0.32 |
| 35 m | 25 | 1 | 1.50 | 0.77 | 0.77 |
| 40 m | 20 | 1 | 1.57 | 0.54 | 0.54 |
| 45 m | 25 | 3/4 | 1.60 | 0.82 | 0.89 |
| 50 m | 20 | 1 | 1.43 | 0.62 | 0.62 |
| Methods | Number of Correct Detections | Total Number of Detections | Correct Detection Rate (%) |
|---|---|---|---|
| Proposed method | 176 | 180 | 97.8 |
| Original Radon transform method | 171 | 180 | 95.0 |
| Template matching method | 124 | 180 | 68.9 |
| Harris algorithm | 133 | 180 | 73.9 |
| Detection Rate/(%) | RMSE /(Pixel) | Time for One Set of Data /(s) | |
|---|---|---|---|
| Proposed method | 97.8 | 0.57 | 1 |
| Original Radon transform method | 95.0 | 0.64 | 10 |
| Template matching method | 68.9 | 0.84 | 1 |
| Harris algorithm | 73.9 | 2.19 | 0 |
| Condition | |
|---|---|
| flying height | 25 (m) |
| flying speed | 2.4 (m/s) |
| GSD | 0.68 (cm/pixel) |
| overlap rate (vertical/horizontal) | 80%/75% |
| camera tilt angle | −60° |
| Displacement Simulation Point 1 | Displacement Simulation Point 2 | |||||
|---|---|---|---|---|---|---|
| Group 1 | Group 2 | Group 3 | Group 1 | Group 2 | Group 3 | |
| Preset displacement (mm) | 11.5 | 16.7 | 10.0 | 5.0 | 10.0 | 15.0 |
| Proposed method (mm) | 15.3 | 18.7 | 8.5 | 9.9 | 13.6 | 15.4 |
| Original Radon transform method (mm) | 17.9 | 12.6 | 7.9 | 12.0 | 18.1 | 16.3 |
| Template matching method (mm) | 23.3 | 22.7 | 7.0 | 18.7 | 16.0 | 9.6 |
| Harris algorithm (mm) | 28.0 | 24.1 | 25.7 | 34.9 | 20.3 | 29.8 |
| Methods | RMSE (mm) |
|---|---|
| Proposed method | 3.1 |
| Original Radon transform method | 5.5 |
| Template matching method | 8.5 |
| Harris algorithm | 17.3 |
Disclaimer/Publisher’s Note: The statements, opinions and data contained in all publications are solely those of the individual author(s) and contributor(s) and not of MDPI and/or the editor(s). MDPI and/or the editor(s) disclaim responsibility for any injury to people or property resulting from any ideas, methods, instructions or products referred to in the content. |
© 2024 by the authors. Licensee MDPI, Basel, Switzerland. This article is an open access article distributed under the terms and conditions of the Creative Commons Attribution (CC BY) license (https://creativecommons.org/licenses/by/4.0/).
Share and Cite
Liu, J.; Dai, W.; Zhang, Y.; Xing, L.; Pan, D. An Adaptive Radon-Transform-Based Marker Detection and Localization Method for Displacement Measurements Using Unmanned Aerial Vehicles. Sensors 2024, 24, 1930. https://doi.org/10.3390/s24061930
Liu J, Dai W, Zhang Y, Xing L, Pan D. An Adaptive Radon-Transform-Based Marker Detection and Localization Method for Displacement Measurements Using Unmanned Aerial Vehicles. Sensors. 2024; 24(6):1930. https://doi.org/10.3390/s24061930
Chicago/Turabian StyleLiu, Jianlin, Wujiao Dai, Yunsheng Zhang, Lei Xing, and Deyong Pan. 2024. "An Adaptive Radon-Transform-Based Marker Detection and Localization Method for Displacement Measurements Using Unmanned Aerial Vehicles" Sensors 24, no. 6: 1930. https://doi.org/10.3390/s24061930
APA StyleLiu, J., Dai, W., Zhang, Y., Xing, L., & Pan, D. (2024). An Adaptive Radon-Transform-Based Marker Detection and Localization Method for Displacement Measurements Using Unmanned Aerial Vehicles. Sensors, 24(6), 1930. https://doi.org/10.3390/s24061930