
Design of Long-Life Wireless Near-Field Hydrogen Gas Sensor

Abstract
1. Introduction
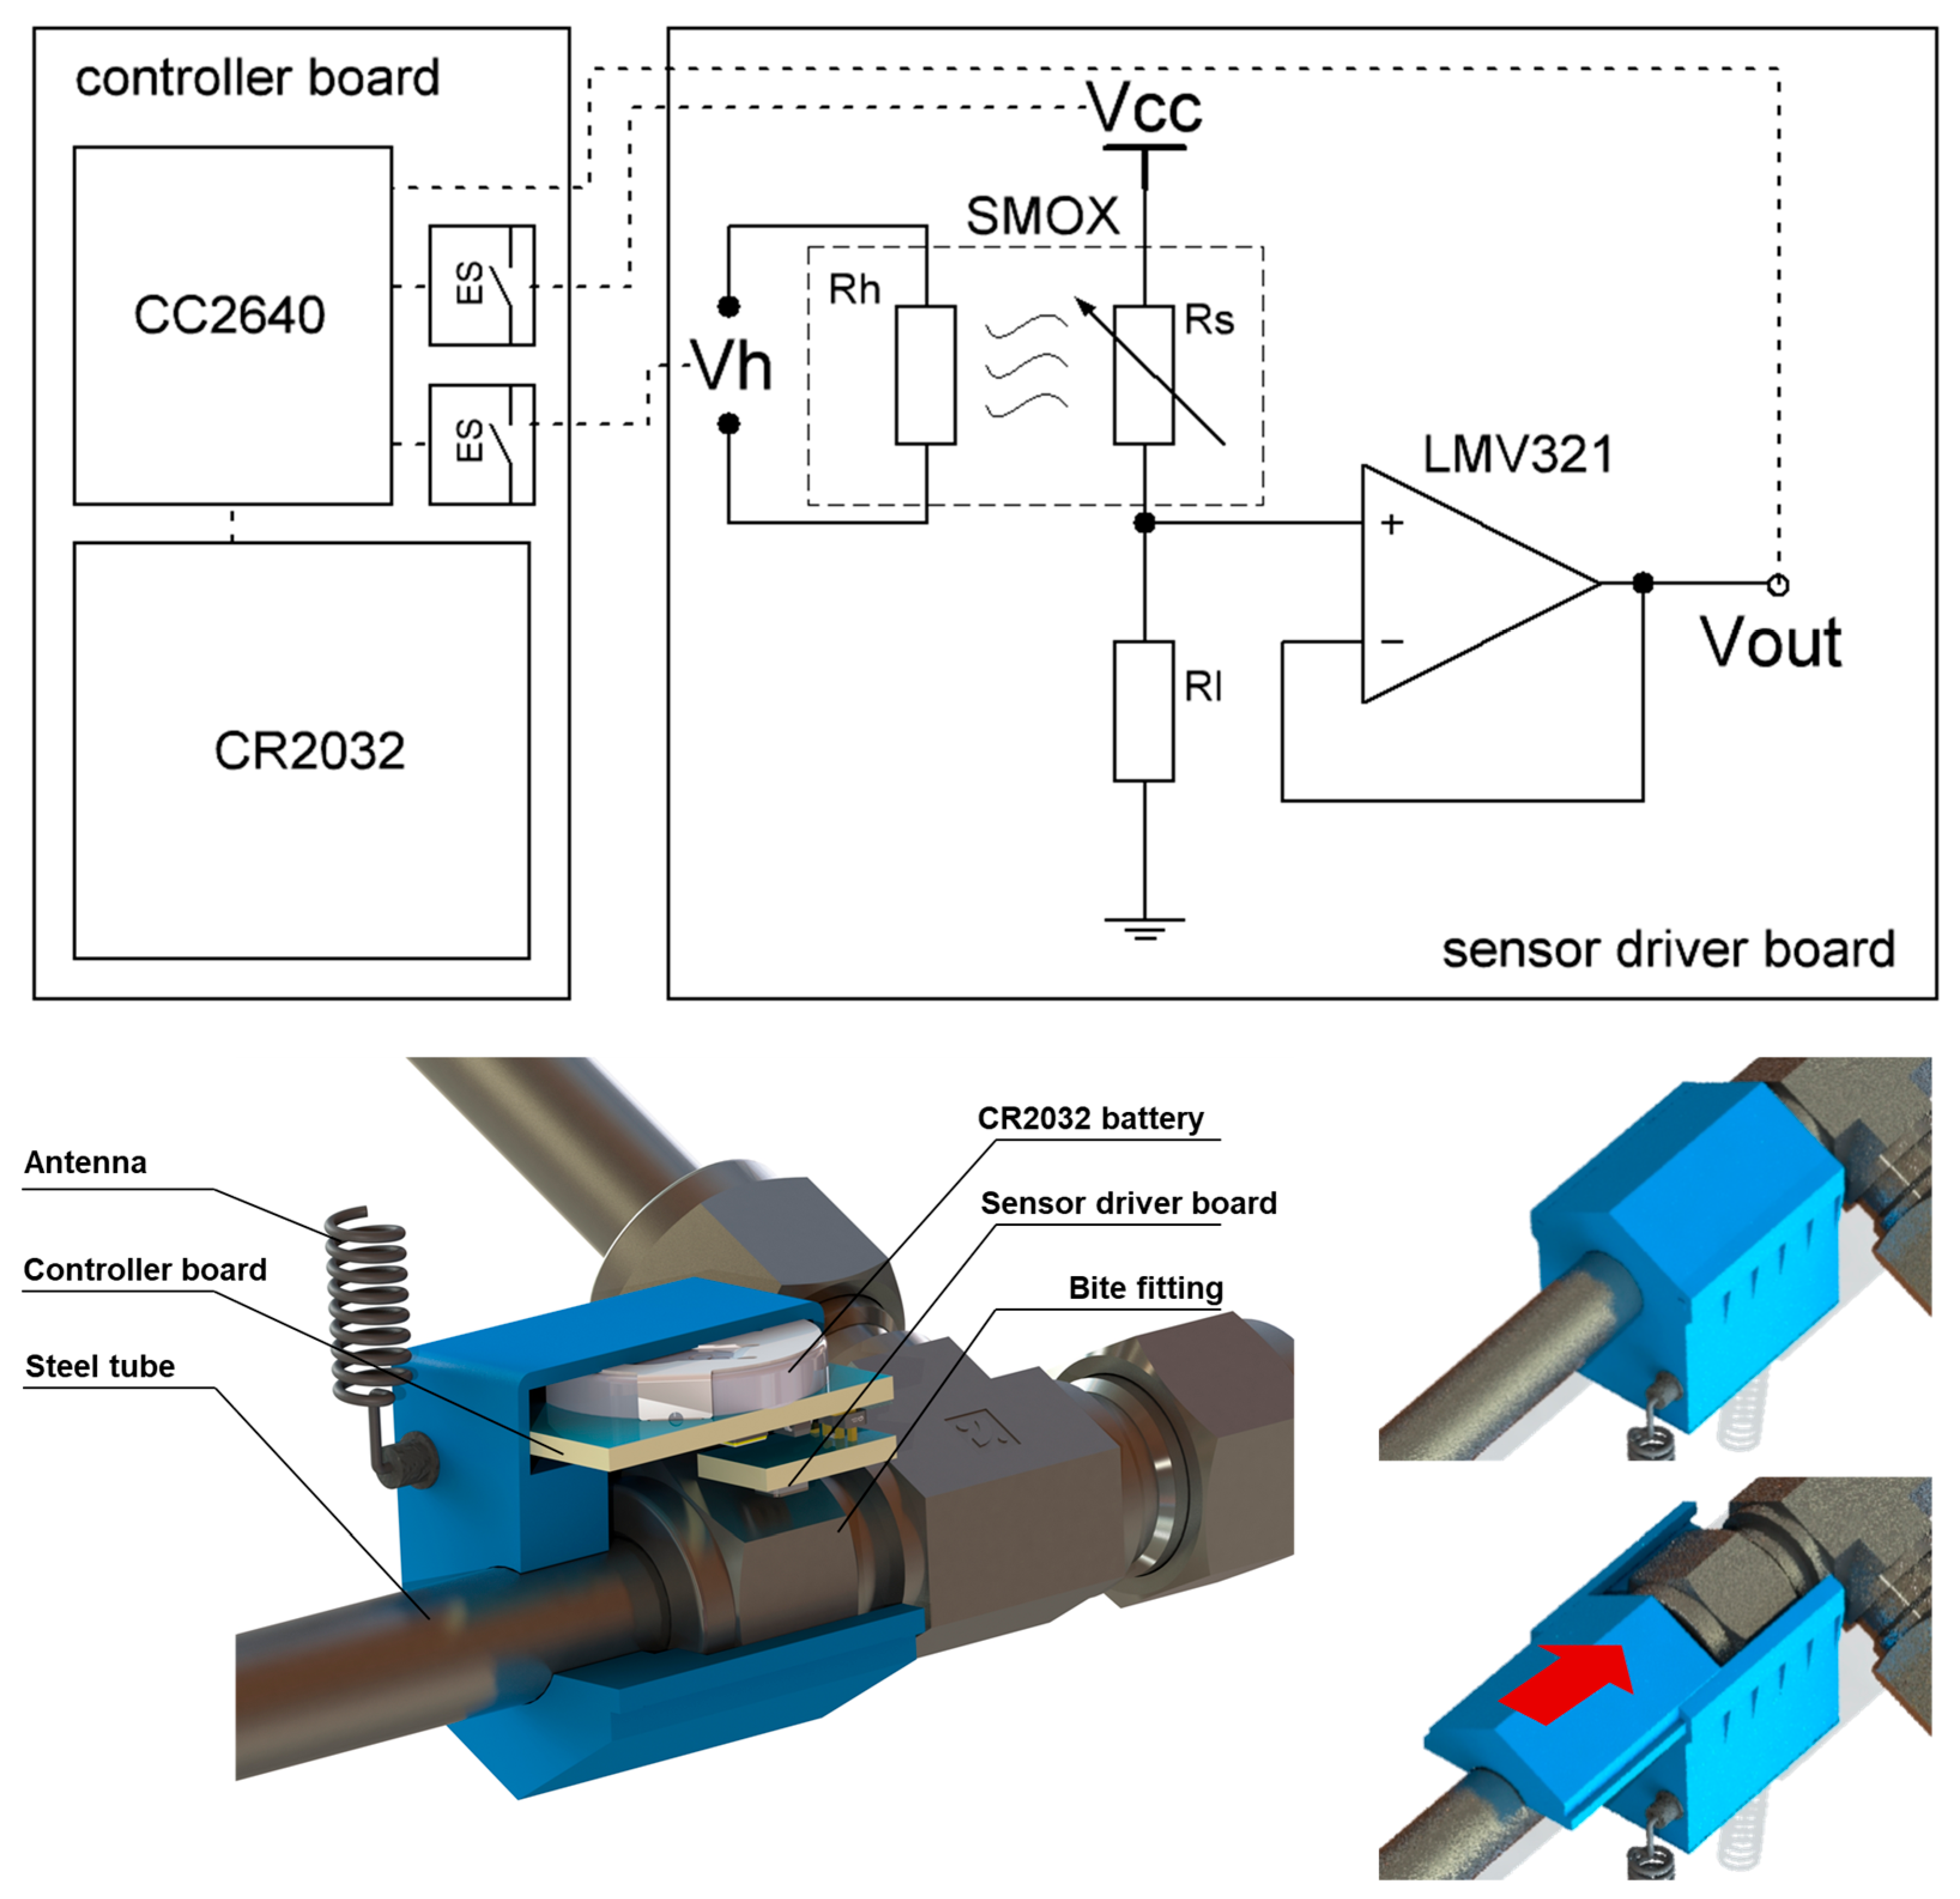
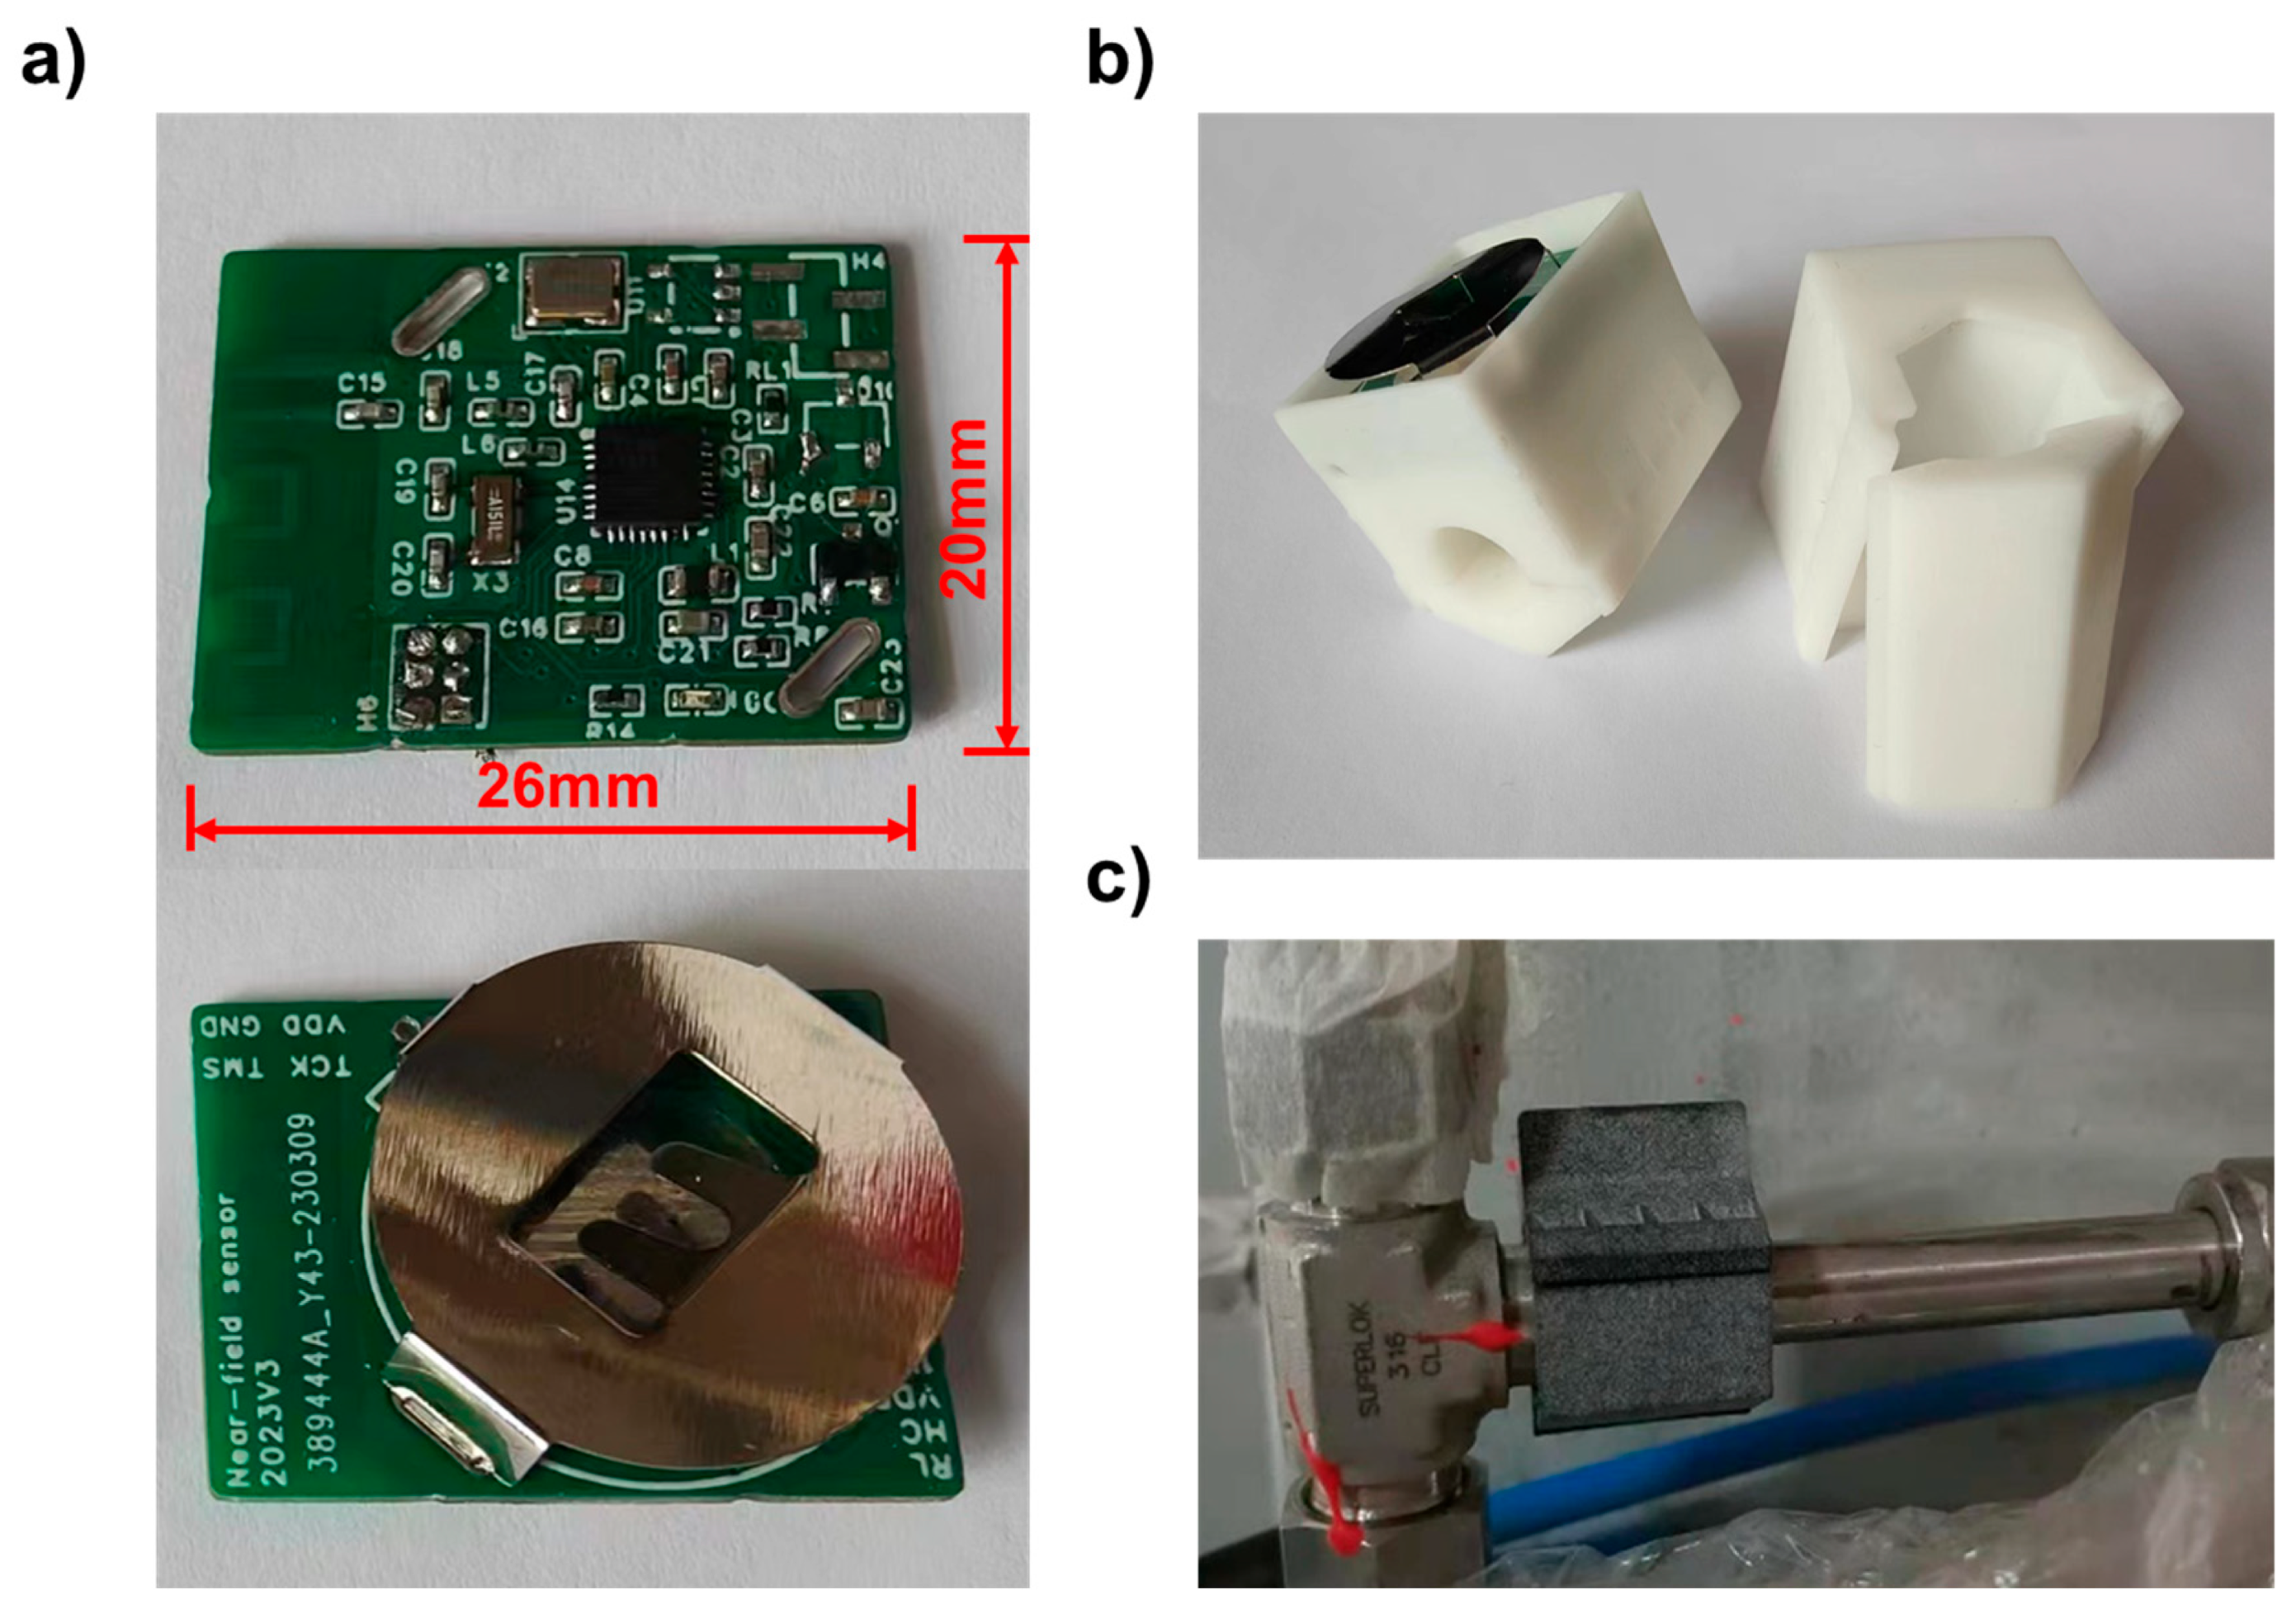
2. Near-Field Sensor Design
3. Results
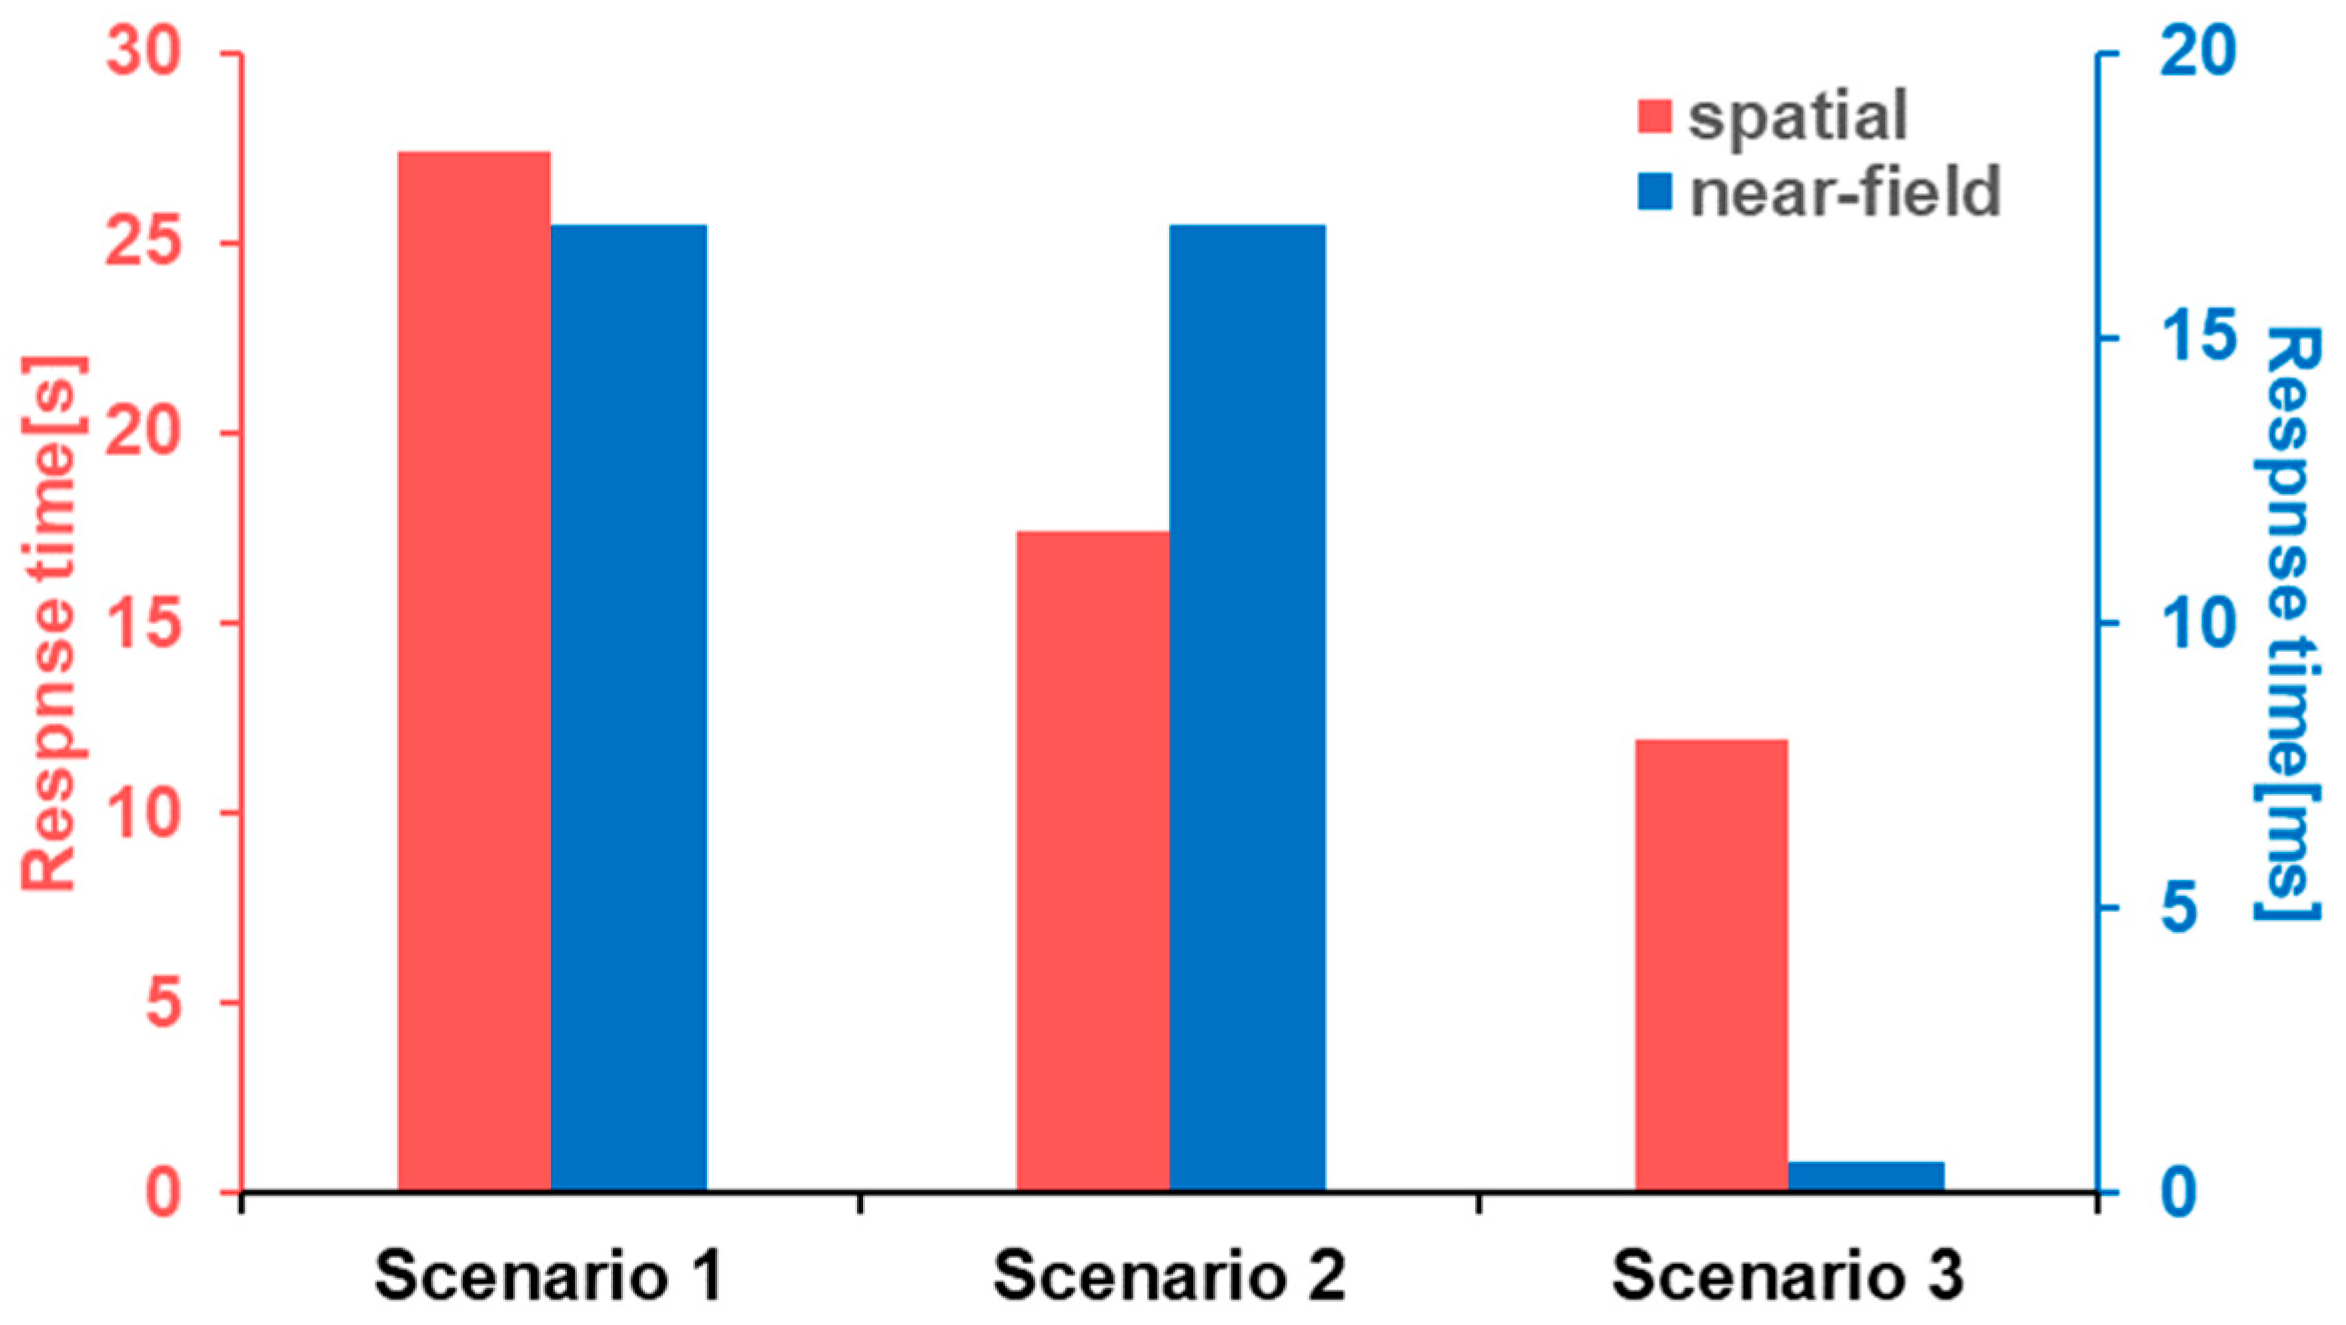
3.1. CFD Case Study
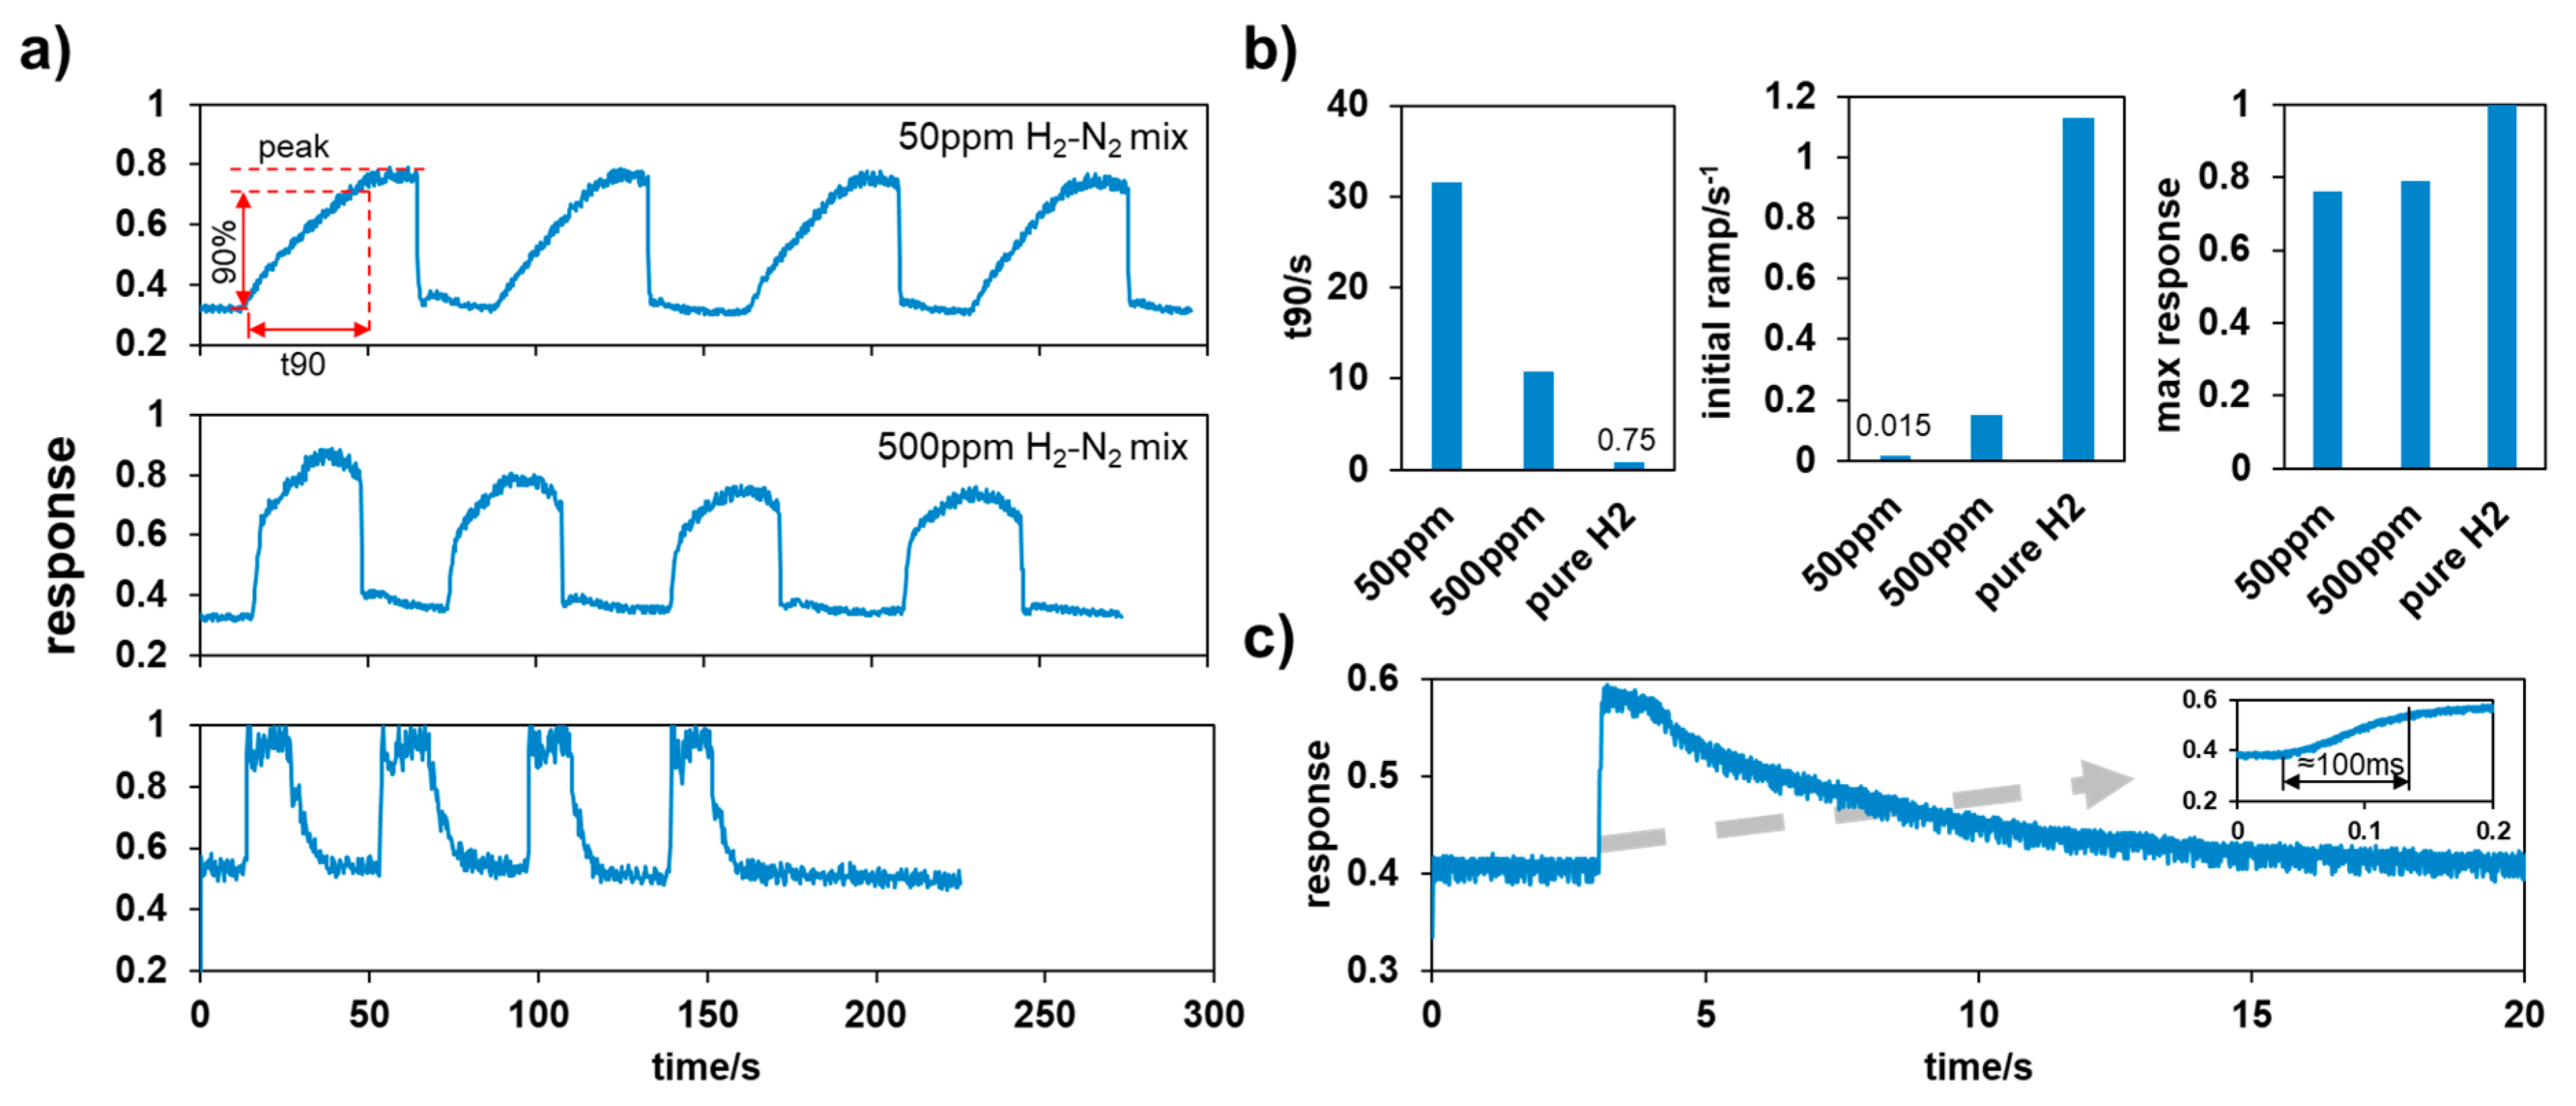
3.2. Near-Field Sensor Tests
4. Conclusions
Author Contributions
Funding
Institutional Review Board Statement
Data Availability Statement
Conflicts of Interest
References
- t.P.N.N. Laboratory. H2TOOLS. Available online: https://h2tools.org (accessed on 15 January 2024).
- Hübert, T.; Boon-Brett, L.; Black, G.; Banach, U. Hydrogen sensors—A review. Sens. Actuators B Chem. 2011, 157, 329–352. [Google Scholar] [CrossRef]
- Boon-Brett, L.; Bousek, J.; Castello, P.; Salyk, O.; Harskamp, F.; Aldea, L.; Tinaut, F. Reliability of commercially available hydrogen sensors for detection of hydrogen at critical concentrations: Part i—Testing facility and methodologies. Int. J. Hydrogen Energy 2008, 33, 7648–7657. [Google Scholar] [CrossRef]
- LaChance, J.L.; Houf, W.G.; Fluer, I.P.R.C.A.; Fluer, L.; Middleton, B. Analyses to Support Development of Risk-Informed Separation Distances for Hydrogen Codes and Standards. Journal 2009. Available online: https://www.osti.gov/servlets/purl/983689 (accessed on 15 January 2024).
- Liu, S.; He, R. Optimization of hydrogen sensor placement for hydrogen leakage monitoring in the fuel cell truck. J. Braz. Soc. Mech. Sci. Eng. 2023, 45, 193. [Google Scholar] [CrossRef]
- Somov, A.; Karpov, E.F.; Karpova, E.; Suchkov, A.; Mironov, S.; Karelin, A.; Baranov, A.; Spirjakin, D. Compact low power wireless gas sensor node with thermo compensation for ubiquitous deployment. IEEE Trans. Ind. Inform. 2015, 11, 1660–1670. [Google Scholar] [CrossRef]
- Nakano, S.; Goto, Y.; Yokosawa, K.; Tsukada, K. Hydrogen gas detection system prototype with wireless sensor networks. In Proceedings of the SENSORS, 2005 IEEE, Irvine, CA, USA, 30 October–3 November 2005; p. 4. [Google Scholar]
- Somov, A.; Baranov, A.; Savkin, D.; Spirjakin, A.; Spirjakin, R. Passerone. Development of wireless sensor network for combustible gas monitoring. Sens. Actuators A Phys. 2011, 171, 398–405. [Google Scholar] [CrossRef]
- Pan, Y.; Molin, Q.; Guo, T.; Zhang, L.; Cao, B.; Yang, J.; Wang, W.; Xue, X. Wireless passive surface acoustic wave (SAW) technology in gas sensing. Sens. Rev. 2020, 41, 135–143. [Google Scholar] [CrossRef]
- Firouz, M.S.; Mohi-Alden, K.; Omid, M. A critical review on intelligent and active packaging in the food industry: Research and development. Food Res. Int. 2021, 141, 110113. [Google Scholar] [CrossRef]
- Fathi, P.; Karmakar, N.C.; Bhattacharya, M.; Bhattacharya, S. Potential Chipless RFID Sensors for Food Packaging Applications: A Review. IEEE Sens. J. 2020, 20, 9618–9636. [Google Scholar] [CrossRef]
- Zhang, T.; Ma, L.J.; Bai, H.B.; Tong, C.G.; Dai, Q.; Yang, J. Design and fabrication of a novel core-suspended optic fiber for distributed gas sensor. In Proceedings of the SPIE—The International Society for Optical Engineering, San Francisco, CA, USA, 2–7 February 2013. [Google Scholar]
- Ashry, I.; Mao, Y.; Wang, B.; Hveding, F.; Bukhamsin, A.; Ng, T.K.; Ooi, B.S. A Review of Distributed Fiber-Optic Sensing in the Oil and Gas Industry. J. Light. Technol. 2022, 40, 1407–1431. [Google Scholar] [CrossRef]
- Zhang, S.; Xie, S.; Li, Y.; Yuan, M.; Qian, X. Detection of Gas Pipeline Leakage Using Distributed Optical Fiber Sensors: Multi-Physics Analysis of Leakage-Fiber Coupling Mechanism in Soil Environment. Sensors 2023, 23, 5430. [Google Scholar] [CrossRef] [PubMed]
- Sakamoto, J.; Sato, R.; Nakayama, J.; Kasai, N.; Shibutani, T.; Miyake, A. Leakage-type-based analysis of accidents involving hydrogen fueling stations in Japan and USA. Int. J. Hydrogen Energy 2016, 41, 21564–21570. [Google Scholar] [CrossRef]
- Wang, T.; Yang, F.; Hu, Q.; Hu, S.; Li, Y.; Ouyang, M. Experimental and simulation research on hydrogen leakage of double ferrule joints. Process Saf. Environ. Prot. 2022, 160, 839–846. [Google Scholar] [CrossRef]
- Jakubik, W.P. Surface acoustic wave-based gas sensors. Thin Solid Film. 2011, 520, 986–993. [Google Scholar] [CrossRef]
- Sahoo, T.; Kale, P. Work Function-Based Metal–Oxide–Semiconductor Hydrogen Sensor and Its Functionality: A Review. Adv. Mater. Interfaces 2021, 8, 649. [Google Scholar] [CrossRef]
- Sisman; Erkovan, M.; Kilinc, N. Chapter 5.1—Hydrogen sensors for safety applications. In Towards Hydrogen Infrastructure; Jaiswal-Nagar, D., Dixit, V., Devasahayam, S., Eds.; Elsevier: Amsterdam, The Netherlands, 2024; pp. 275–314. [Google Scholar]


| Subject | Coordinate | Jet Direction | Mass Flow Rate |
|---|---|---|---|
| Scenario 1 | (835, 500, 353) | z+ | 0.01 g/s |
| Scenario 2 | (706, 490, 778) | x− | 0.01 g/s |
| Scenario 3 | (706, 490, 278) | x− | 0.1 g/s |
| Spatial diffusion sensor | (694, 300, 1023) | / | / |
Disclaimer/Publisher’s Note: The statements, opinions and data contained in all publications are solely those of the individual author(s) and contributor(s) and not of MDPI and/or the editor(s). MDPI and/or the editor(s) disclaim responsibility for any injury to people or property resulting from any ideas, methods, instructions or products referred to in the content. |
© 2024 by the authors. Licensee MDPI, Basel, Switzerland. This article is an open access article distributed under the terms and conditions of the Creative Commons Attribution (CC BY) license (https://creativecommons.org/licenses/by/4.0/).
Share and Cite
Deng, X.; Sun, J.; Yang, F.; Ouyang, M. Design of Long-Life Wireless Near-Field Hydrogen Gas Sensor. Sensors 2024, 24, 1332. https://doi.org/10.3390/s24041332
Deng X, Sun J, Yang F, Ouyang M. Design of Long-Life Wireless Near-Field Hydrogen Gas Sensor. Sensors. 2024; 24(4):1332. https://doi.org/10.3390/s24041332
Chicago/Turabian StyleDeng, Xintao, Jinwei Sun, Fuyuan Yang, and Minggao Ouyang. 2024. "Design of Long-Life Wireless Near-Field Hydrogen Gas Sensor" Sensors 24, no. 4: 1332. https://doi.org/10.3390/s24041332
APA StyleDeng, X., Sun, J., Yang, F., & Ouyang, M. (2024). Design of Long-Life Wireless Near-Field Hydrogen Gas Sensor. Sensors, 24(4), 1332. https://doi.org/10.3390/s24041332