Abstract
Hydrogen fuel cell vehicles have gained more attention as future automobiles due to their environmental benefits and extended driving ranges. Concurrently, the global hydrogen sensor market is also experiencing substantial growth. These sensors are integrated into vehicles to detect hydrogen leakage and concentration, thereby ensuring the safety of hydrogen fuel cell vehicles. In particular, hydrogen pressure sensors, commonly installed on the manifold and regulator of vehicles, can measure hydrogen pressure and diagnose safety concerns caused by hydrogen leakage in advance. In this paper, we identify the vulnerable points of hydrogen pressure sensors when exposed to vehicle driving environments, investigate failure mechanisms, and provide process optimization techniques. Specifically, our reliability modeling verifies that the components of a printed circuit board (PCB) exposed to humid environments undergo corrosion due to ion migration, leading to the generation of extrinsic series or parallel resistances, which in turn cause fluctuations of output voltage. Through structural and elemental analysis, we pinpoint process-related factors that make components vulnerable to humidity, thereby suggesting recommendations for enhancing the manufacturing process. Based on this analysis in the development stage, we can proactively address and improve reliability and further safety-related issues for future automobiles, thus preventing real field issues.
1. Introduction
Fuel cell vehicles represent a promising future for the automotive industry that uses the power of hydrogen as a fuel. Through a chemical reaction between hydrogen and oxygen, a fuel cell generates electricity, propelling the vehicle forward. It offers environmental benefits that are similar to electric vehicles while also having the advantage of quick refueling times and extended driving ranges.
Hydrogen is the first element in the periodic table and a promising candidate for future mobility and energy supply [1]. Hydrogen gas comprises two hydrogen atoms united in a molecule. Being the smallest element, hydrogen has a low boiling point, existing as a gas at room temperature and pressure. Due to its low minimum ignition energy, it is prone to easy explosions, and its flame propagation speed is too fast, causing ignition or explosions to easily occur. Furthermore, with a lower flammability limit (LFL) of 4%, it can easily explode with even minimal static electricity and, due to its brittleness properties, it can penetrate metals, forming pin holes or cracks which can weaken vulnerable parts such as vessel and pipeline joints. Safe hydrogen production, storage, and transportation technologies are needed due to these characteristics. The key to prevent and control these aspects lies in the development of hydrogen safety systems with hydrogen sensors, whereas the global hydrogen sensor market is continuously growing along with environmentally friendly and carbon-neutral policies.
The use of hydrogen sensors in vehicles includes various applications such as near hydrogen storage containers, around hydrogen transfer pipelines, adjacent to fuel cell stacks, and within the vehicle cabin. These sensors require a wide detection range, high selectivity, long lifetime, high accuracy, rapid response time, low power consumption, low operating temperature, mass production capability, compact size, and low price. While electrochemical and catalytic technologies have matured over the last few decades and are continuously being improved, semiconductor-based, metal resistance-based, optical-based, and acoustic-based sensor technologies have recently been actively developed [2,3,4,5,6,7,8,9,10,11,12].
In this paper, we focus on resistance-based hydrogen pressure sensors which are commonly installed on the manifold or regulator in hydrogen cars in order to measure the hydrogen pressure. These types of sensors exhibit certain advantages in terms of a very wide detection range and rapid response; however, they have an intrinsic weakness in terms of selectivity [4]. By conducting a comprehensive analysis of processes, reliability, and safety, we demonstrate the failure mechanism of sensors under vehicle driving conditions and provide further process optimization.
2. Experimental
To investigate the failure mechanisms, including environmental and structural factors that induce the output voltage fluctuations of the sensor, reliability testing and structural analysis tools were utilized. The environmental factors to which the sensor is mainly exposed are defined as temperature, humidity, and vibration considering the actual driving environments. To assess the impact of these environmental factors, reliability tests were conducted using a temperature cycle chamber, temperature and humidity chamber, and a combined vibration test system.
The temperature cycle chamber allows for an environmental evaluation under conditions of rapid temperature changes, with a temperature range of −70 °C to 180 °C and a heating rate of 15 °C/min. The temperature and humidity chamber enables an assessment of the internal moisture ingress in sealed components under temperature and humidity variations, with a temperature range of −50 °C to 150 °C and a relative humidity range of 25% to 98%. The combined vibration test system allows for the simultaneous testing of vibration in the x, y, and z-axis directions along with temperature cycling.
Through these three evaluations, it is possible to determine which factors among temperature, humidity, and vibration have a significant impact on the sensor’s output voltage fluctuation, which is the focus of this study. For example, by utilizing the results from the temperature cycle chamber and the temperature and humidity chamber evaluations separately, we can decouple the effects of temperature and humidity.
Furthermore, structural analysis tools were utilized to analyze the fundamental structure of the sensor and the structural defects. A three-dimensional X-ray CT inspection system was used to detect defects through high-resolution micro-level X-ray images. The non-destructive visual analysis of features such as voids, cracks, and disconnections on the PCB was mainly performed. SEM-based EDS analysis was performed to observe the surface structure and particle shapes, as well as to conduct compositional analysis of the elements involved. An in situ focused ion beam system with an electron beam resolution of less than 1.0 nm was used for destructive analysis, including deep structure analysis, and the three-dimensional analysis of the sensor.
3. Results and Discussion
3.1. Structural Anaylsis
Before the reliability evaluations, a fundamental disassembly analysis was carried out, and the functions of the components comprising the sensor were verified. As seen in Figure 1, the sensor is primarily composed of diaphragm, gauge chip, main PCB, spring, upper PCB, and IN/OUT pins. The diaphragm serves as the inlet for receiving hydrogen pressure, while the gauge chip, in response to the hydrogen pressure (or strain), transmits the resistance change as an output signal to the main PCB. The main PCB, through a signal processing IC, compensates for the electrical input and transmits it as VOUT. The spring transfers the electrical signal from the main PCB to the upper PCB, resulting in the output voltage through the IN/OUT pins.
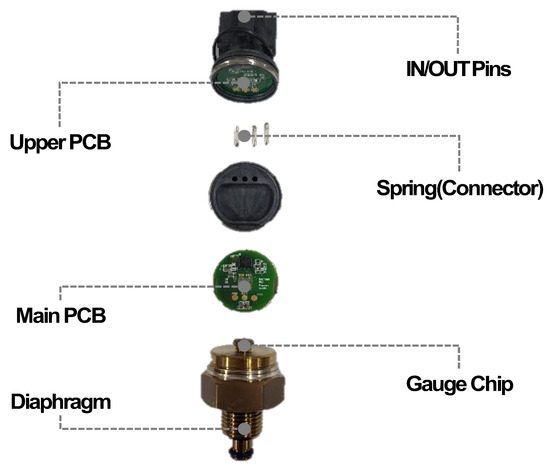
Figure 1.
Disassembly analysis of a hydrogen pressure sensor indicates that it consists of components such as diaphragm, gauge chip, main PCB, spring, upper PCB, and IN/OUT pins.
Figure 2 represents the results of an analysis conducted using a three-dimensional X-ray CT inspection system to identify structural defects or points of weakness. Aside from an intentional misalignment in the area where the gauge chip on diaphragm connects to the main PCB, no significant findings or unusual structural issues were discovered in the detailed structural analysis results.
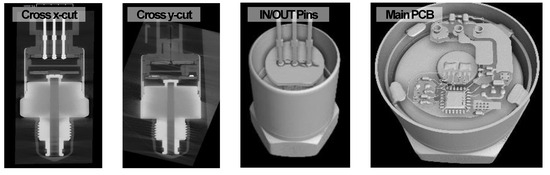
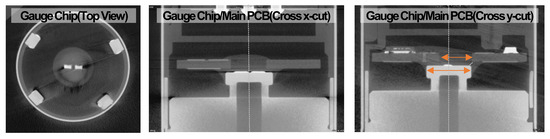
Figure 2.
The structural analysis results of three-dimensional X-ray CT indicate that there are no structural abnormalities except for the intentional misalignment.
The Si strain gauge chip is fabricated by depositing aluminum onto a silicon–glass wafer, followed by a patterning and etching processes to create the pads. It is composed of two silicon gauges and three aluminum bonding pads arranged on a glass substrate as shown in Figure 3a. The top-view SEM image in Figure 3b confirms the structure. The cross-sectional analysis of the silicon strain gauge using the in situ focused ion beam system shows that it is composed of multiple layers, as illustrated in Figure 3c. These layers include glass frit, the Si strain gauge itself, and the gauge chip pad. The mismatch in the coefficient of thermal expansion (CTE) among these multiple layers can lead to thermal residual stress as a result of temperature changes. The thermal stress can potentially cause serious issues such as Si chip cracking and debonding from the metal diaphragm [13]. To assess the impact of these thermal effects, reliability evaluation and verification follow in the measurement section.
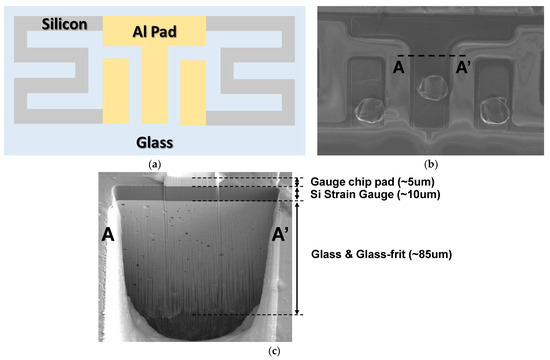
Figure 3.
(a) Top-view schematic of the gauge chip, (b) SEM image of the gauge chip, and (c) FIB cross-section image of the gauge chip.
3.2. Functional Anaylsis
Through a teardown analysis of the sensor, a functional analysis was conducted. The Wheatstone bridge-type gauge chip senses input hydrogen pressure as a resistance change, which is then transmitted to the signal processing IC as an input signal as shown in Figure 4. The output value (AOUT) processed through the IC is transmitted as the VOUT signal to external pins via a spring. Power is also connected to the pins. In Figure 5, the optical microscope results for the main PCB indicate the functional connection of each component.
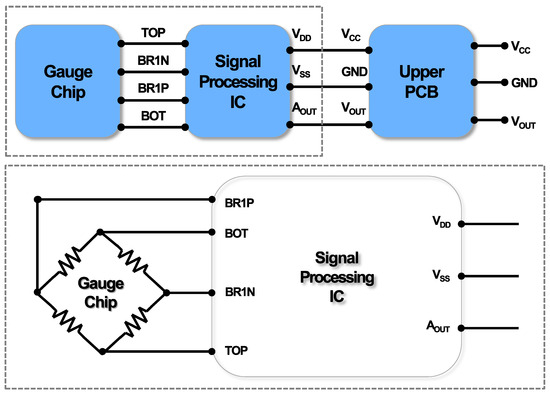
Figure 4.
Block diagram through teardown analysis includes the gauge chip, signal processing IC, and upper PCB with connections.
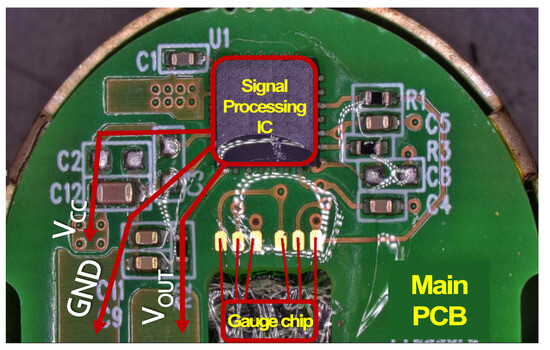
Figure 5.
Optical microscope results of the main PCB.
3.3. Measurement
The main environmental factors affecting the output voltage fluctuation of the sensor are defined as temperature, humidity, and vibration, taking into consideration actual driving conditions, and structural analysis. The sensor’s potential weak points related to these environmental factors can also be defined as follows:
The first is the bonding areas within the main PCB, including the signal processing IC and parasitic components. In cases where a conformal coating is not uniformly applied across the entire PCB surface, susceptibility to corrosion induced by moisture ingress is increased. The corrosion can lead to unexpected additional IR drop, causing voltage fluctuations in the sensor’s output.
The second point is the solder/wire connections between the gauge chip and the main PCB. The stress induced by vibrations and temperature experienced in real-world conditions can lead to cracking or disconnection, resulting in output voltage variations.
Lastly, there exists a vulnerability from the multi-layer structure of the gauge chip. When subjected to thermal stress, the various material deposition layers within the gauge chip can experience cracking or debonding between the multi-layer structure and the diaphragm due to the mismatch in the coefficient of thermal expansion (CTE) between its multiple layers. It can also lead to output fluctuations and malfunctions in the sensor.
To validate these three weak points, we performed corresponding reliability tests to identify failure mechanisms. First, in order to elucidate corrosion vulnerabilities, we conducted an evaluation under the combined cycling conditions of high and low temperatures as well as high humidity using the temperature and humidity chamber. For the solder/wire cracking and disconnection possibility, we conducted evaluations using a combined vibration test system under temperature cycling conditions, simulating real-world driving vibrations along three axes. Lastly, for the gauge chip, a temperature cycling measurement was performed using a temperature cycle chamber, swiftly transitioning between high and low temperatures at a rate of 15 °C/min. All evaluation conditions comply with ISO 16750 [14].
We conducted the three potential points-related reliability tests and measured the output voltage for each sample before and after the stress. Through a sample-to-sample comparison, we can compare the differences in output voltage values before and after the stress and plot the shift value in the output voltage before and after the stress under various pressures. In Figure 6a, it is evident that there is no significant difference in the output voltage before and after the stress due to temperature cycling, indicating a low impact of temperature stress. Similarly, in Figure 6b, the combined vibration test system shows no significant shift in output voltage before and after the stress, also indicating the absence of temperature and vibration effects.
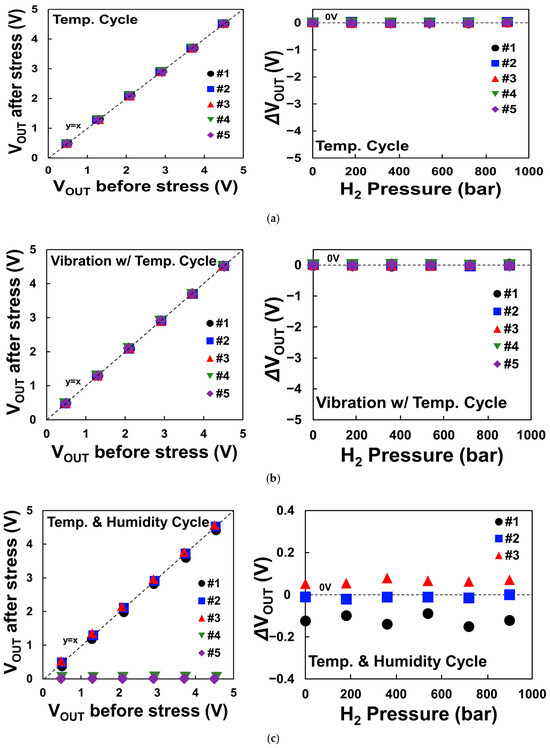
Figure 6.
Comparison of output voltage before and after stress due to (a) temperature cycling, (b) vibration with temperature cycling, and (c) temperature and humidity cycling. ΔVOUT is the result of subtracting VOUT before stress from VOUT after stress.
However, during the temperature and humidity test, some samples exhibit an increase, decrease, or even a reduction to zero in output voltage after the stress as shown in Figure 6c. This demonstrates that the hydrogen sensor is susceptible to humidity, as it can either increase or decrease its output voltage following stress. A parametric decrease, such as a decrease in output voltage, is commonly associated with normal degradation behavior. However, the results exhibit an unusual pattern of increase and decrease. In the following section, we present the root cause and the modeling developed to explain this abnormal behavior.
3.4. Failure Analysis
After the temperature and humidity cycling evaluation, a structural comparison between normal and abnormally shifted samples was carried out using an optical microscope. The normal samples show no noticeable anomalies in the top-view image of the signal processing IC and parasitic components on the main PCB, bonding area, solder/wire, and gauge chip in Figure 7a. However, in the shifted samples, we observed the phenomenon of a specific parasitic component being discolored and corroded while the other area had no significant change as shown in Figure 7b. This can be attributed to the occurrence of thermal and humidity degradation. To identify the root cause and failure mechanism behind the discoloration and corrosion, we conducted a compositional analysis of the element in the affected component using SEM-based EDS analysis, comparing the normal samples and the shifted samples in Figure 8.
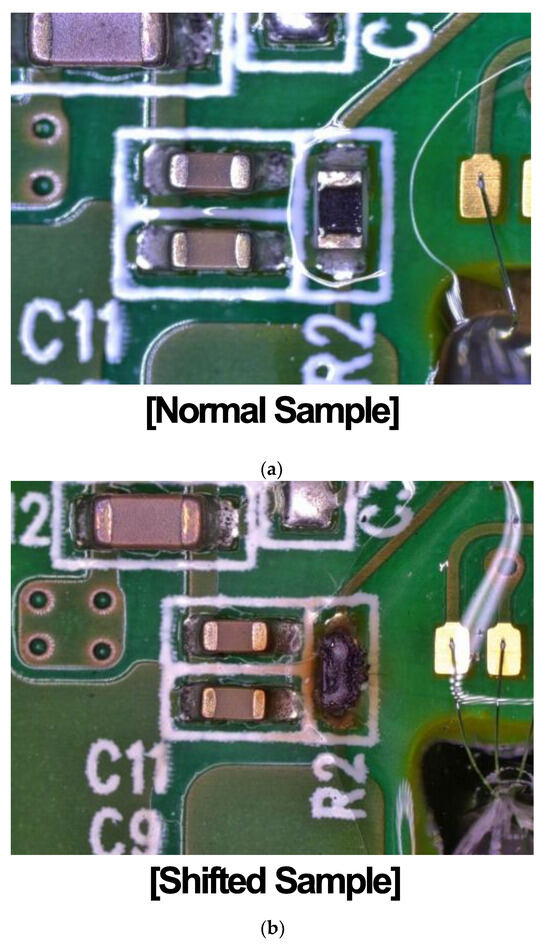
Figure 7.
Comparison of main PCB between (a) the normal sample and (b) the shifted sample.
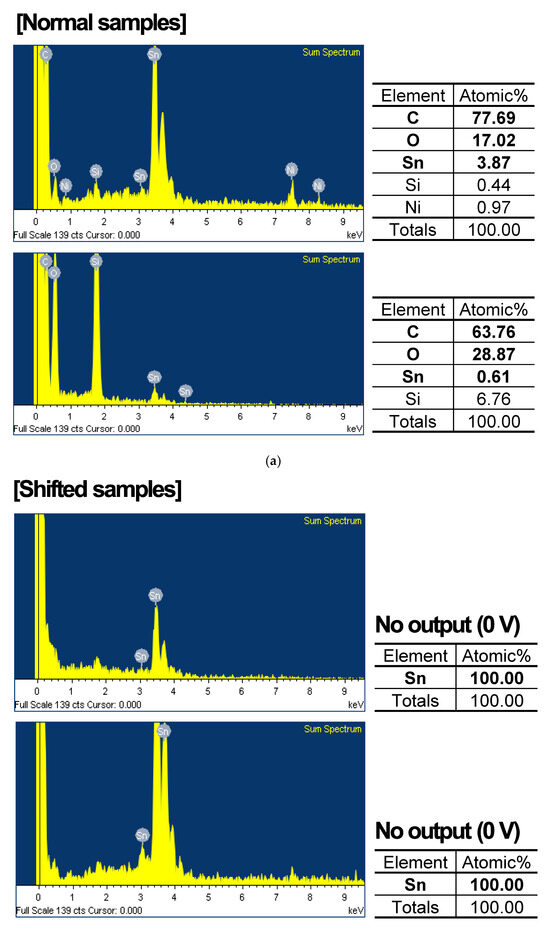
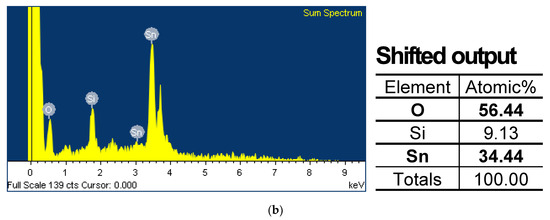
Figure 8.
EDS analysis of main PCB of (a) normal samples and (b) shifted samples after temperature and humidity cycling evaluation.
In the case of normal samples, the predominant constituents of the conformal coating, such as carbon and oxygen, were detected at levels exceeding 80%. Conversely, these elements were absent or present in significantly lower quantities in the samples with no output and the shifted samples, respectively. In particular, it is confirmed that in the samples where no output values (0 V) were observed, Sn, a metallic component within the PCB substrate, accounted for 100% of the composition. This absence of conformal coating leads to severe malfunction. However, the shifted samples show approximately 50% of the conformal coating components. This analysis indicates that uneven coating is a major factor contributing to the primary defects, resulting in output voltage fluctuation.
3.5. Modeling
The reliability test and failure analysis results demonstrate that hydrogen pressure sensors with uneven PCB conformal coatings are vulnerable to humidity, leading to output voltage fluctuations. In the other words, the ingress of moisture into the non-uniform PCB conformal coating results in the temperature and humidity degradation of the exposed circuit. The Arrhenius–Peck model can explain the physical mechanism behind the corrosion phenomenon observed in components which are exposed humidity [15].
where TTF is time-to-fail, A is constant, %RH is relative humidity, n is humidity factor, Ea is activation energy, k is Boltzmann constant, and T is temperature.
The analysis of the failure samples from system-level evaluation indicates both output degradation as well as increase as shown in Figure 9. The results are aligned with our reliability results from the temperature and humidity cycling test which also demonstrated output voltage fluctuations. This indicates that the reliability test effectively represents a potential reproduction of failures arising from vulnerabilities in the sensor. Figure 10a depicts the observation of the main PCB of a system-level failure sample using an optical microscope, revealing discoloration and corrosion. This corresponds to the outcomes seen in the shifted samples resulting from temperature and humidity cycling. Furthermore, the EDS analysis result shown in Figure 10b also confirms the presence of 100% (Sn) composition, indicating the absence of a conformal coating. These observations suggest a correlation between the absence of conformal coating and the occurrence of system-level failures.
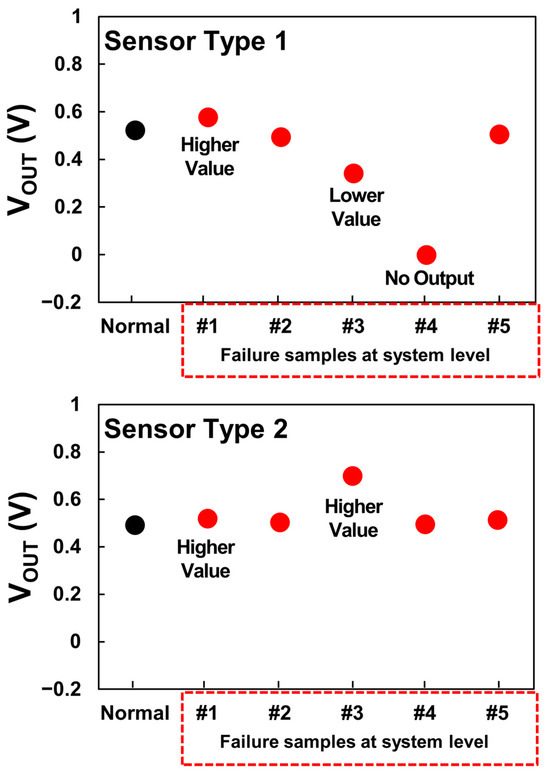
Figure 9.
Output voltage characteristics for each failure sample occurring at the system level (including cases of both higher and lower values compared to normal output).
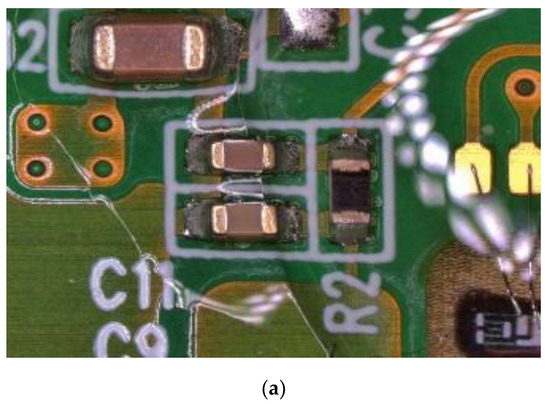
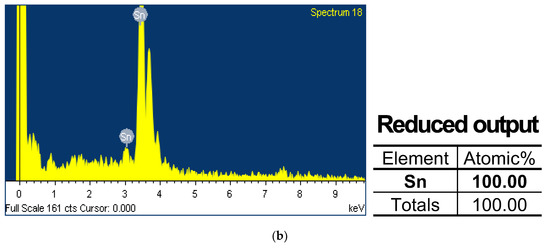
Figure 10.
(a) Optical microscope image and (b) EDS analysis results of the failure sample at system level.
Consequently, we provided a simple and easy model to explain the voltage fluctuation. After the temperature and humidity cycling test, the discolored and corroded resistor was positioned between AOUT as the output of signal processing IC and VOUT and roles as EMC protection and voltage leveling as shown in Figure 11. Once the resistance is exposed to humidity along with its surroundings, extrinsic resistances can be generated due to factors such as ion migration and corrosion [16]. As shown in Figure 11, this extrinsic resistance can be created either in series or in parallel with the resistor. Serial resistance leads to a decrease in output voltage, while parallel resistance results in an increase in output voltage. When serial and parallel resistances are randomly generated, they render the output unpredictable which depends on the amount of both serial and parallel resistance generated for each. This relationship can be expressed using the following simple equation:
where VOUT is output voltage, AOUT is output of signal processing IC, ROUT is output resistance, RP is extrinsic parallel resistance, and RS is extrinsic series resistance. Table 1 presents the results of case simulation using the versatile model, which effectively predicts both increases and decreases in output voltage. In particular, case 3, as an unexpected case, is presented as an example of an increasing scenario, and a decreasing scenario can also be simulated with a large increase in RP.
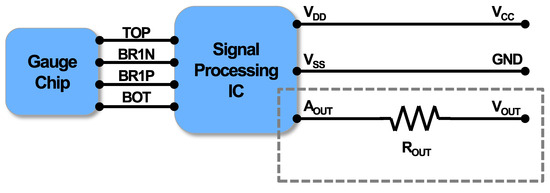
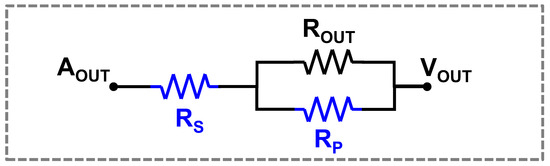
Figure 11.
A simple model using humidity-induced extrinsic resistances to explain the output voltage fluctuation.

Table 1.
Case simulation results.
Furthermore, we validated that all failures induced by such uneven conformal coatings can be prevented by improving the uniformity of the coating process and the improved samples show no issues, even in the extended reliability test which includes an additional five cycles of the temperature and humidity cycling test. Figure 12a presents the optical microscope image following an additional five cycles of the evaluation of the improved samples. When compared to the previously observed failure samples, a noticeably reduced level of discoloration and corrosion is evident. Figure 12b illustrates the EDS elemental analysis results, indicating that the composition of conformal coating elements, C and O, stands at 80%, equivalent to the earlier normal samples. Finally, upon comparing the output voltage values before and after the additional 5-cycle temperature and humidity cycling, it is confirmed that they remain at normal levels without any significant increase or decrease in Figure 12c. This observation represents the effectiveness of the improved conformal coating fabrication in enhancing reliability against humidity-induced degradation.
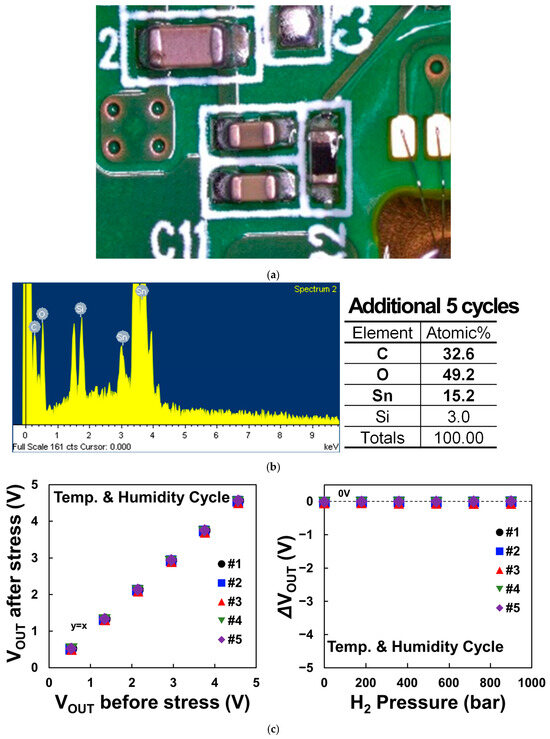
Figure 12.
(a) Optical microscope image, (b) EDS analysis results, and (c) comparison of output voltage before and after the additional temperature and humidity cycling stress of the improved samples.
4. Conclusions
The comprehensive experimental investigation encompassing both environmental and structural aspects effectively revealed the failure mechanisms and root causes underlying the output voltage fluctuations observed in hydrogen sensors. We specifically identified temperature, humidity, and vibration as the primary environmental factors affecting the sensors, considering actual field driving conditions. Notably, our findings emphasize the substantial impact of humidity on these output voltage fluctuations is significant.
Structural analysis revealed no abnormalities, except for an intentionally induced misalignment. Additionally, the analysis of the silicon strain gauge’s structure showed potential issues arising from the mismatch in the CTE among its multiple layers from temperature variations. The reliability tests confirmed vulnerabilities associated with the humidity of the sensors. Non-standard output voltage patterns were observed, including both increases and decreases over the conventional reliability models, which also aligns with and is supported by the analysis of failure samples at the system level.
Failure analysis pinpointed uneven PCB conformal coatings as a cause of humidity-induced output fluctuations. The Arrhenius–Peck model can explain the corrosion mechanism caused by humidity and temperature, which effectively provided an explanation for the observed output voltage fluctuations. Moreover, we introduced a simplified and versatile model utilizing humidity-induced extrinsic resistances to understand and predict the output voltage fluctuations. These results will provide valuable insights for enhancing the reliability and performance of hydrogen sensors, ultimately helping prevent field failures in future practical applications.
Author Contributions
Conceptualization, H.S. and H.L.; methodology, S.J.; validation, H.S.; formal analysis, H.S. and H.L.; data analysis, H.S.; writing—original draft preparation, H.S.; writing—review and editing, H.L.; visualization, H.S. All authors have read and agreed to the published version of the manuscript.
Funding
This research was funded by Ministry of Trade, Industry and Energy (MOTIE, Republic of Korea) through the Comprehensive Analysis support of Performance and Reliability on Automotive Semiconductor program (P0020671).
Institutional Review Board Statement
Not applicable.
Informed Consent Statement
Not applicable.
Data Availability Statement
Data are contained within the article.
Conflicts of Interest
The authors declare no conflicts of interest.
References
- Dominik, B.; Josef, M.; Franz, W.; Christoph, L.; Stephan, H.; Thorsten, K.; Rupert, S. MEMS-based thermal conductivity sensor for hydrogen gas detection in automotive applications. Sens. Actuators A Phys. 2020, 305, 11670. [Google Scholar]
- Boon-Brett, L.; Bousek, J.; Moretto, P. Reliability of commercially available hydrogen sensors for detection of hydrogen at critical concentrations: Part II—Selected sensor test results. Int. J. Hydrogen Energy 2009, 34, 562–571. [Google Scholar] [CrossRef]
- Sang-Do, H. Review and new trends of hydrogen gas sensor technologies. J. Korean Sens. Soc. 2010, 19, 67–86. [Google Scholar]
- Hubert, T.; Boon-Brett, L.; Black, G.; Banach, U. Hydrogen sensors—A review. Sens. Actuators B Chem. 2011, 157, 329–352. [Google Scholar] [CrossRef]
- Boon-Brett, L.; Bousek, J.; Castello, P.; Salyk, O.; Harskamp, F.; Aldea, L.; Tinaut, F. Reliability of commercially available hydrogen sensors for detection of hydrogen at critical concentrations: Part I—Testing facility and methodologies. Int. J. Hydrogen Energy 2008, 33, 7648–7657. [Google Scholar] [CrossRef]
- Isolde, S.; Michael, A. Thermal and gas-sensing properties of a micromachined thermal conductivity sensor for the detection of hydrogen in automotive applications. Sens. Actuators A 2002, 97–98, 104–108. [Google Scholar]
- Felix, M. CMOS based sensors: From a sample to real products. In Proceedings of the IEEE International Conference on Micro Electro Mechanical Systems, Tucson, AZ, USA, 13–17 January 2008; pp. 1–5. [Google Scholar]
- Jinwoong, K.; Kibeom, K.; Seung Woo, H.; Nam-Ho, B.; Myung Kyun, P.; Nam Ki, M. A hydrogen pressure sensor based on bulk-micromachined silicon strain gauges. Procedia Eng. 2016, 168, 790–793. [Google Scholar]
- Linke, S.; Dallmer, M.; Werner, R.; Moriz, W. Low energy hydrogen sensor. Int. J. Hydrogen Energy 2012, 37, 17523–17528. [Google Scholar] [CrossRef]
- Lavanya, N.; Sekar, C.; Fazio, E.; Neri, F.; Leonardi, S.G.; Neri, G. Development of a selective hydrogen leak sensor based on chemically doped SiNO2 for automotive applications. Int. J. Hydrogen Energy 2017, 42, 10645–10655. [Google Scholar] [CrossRef]
- Boon-Brett, L.; Bousek, J.; Black, G.; Moretto, P.; Castello, P.; Hubert, T.; Banach, U. Identifying performance gaps in hydrogen safety sensor technology for automotive and stationary applications. Int. J. Hydrogen Energy 2010, 35, 373–384. [Google Scholar] [CrossRef]
- Boelsma, C.; Bannenberg, L.J.; Van Setten, M.J.; Steinke, N.-J.; Van Well, A.A.; Dam, B. Hafnium—An optical hydrogen sensor spanning six orders in Pressure. Nat. Commun. 2017, 8, 15718. [Google Scholar] [CrossRef] [PubMed]
- Joon Hyub, K.; Ji-Hoon, H.; Chan Won, P.; Nam Ki, M. Enhancement of withstand voltage in silicon strain gauges using a thin alkali-free glass. Sensors 2020, 20, 3024. [Google Scholar]
- ISO 16750-4; Road Vehicles—Environmental Conditions and Testing for Electrical and Electronic Equipment. ISO: Geneva, Switzerland, 2010.
- Hallberg, O. Recent humidity accelerations, a base for testing standards. Qual. Reliab. Eng. Int. 1991, 7, 169–180. [Google Scholar] [CrossRef]
- Hualiang, H.; Xingpeng, G.; Guoan, Z.; Zehua, D. The effects of temperature and electric field on atmospheric corrosion behavior of PCB-Cu under absorbed thin electrolyte layer. Corros. Sci. 2011, 53, 1700–1707. [Google Scholar] [CrossRef]
Disclaimer/Publisher’s Note: The statements, opinions and data contained in all publications are solely those of the individual author(s) and contributor(s) and not of MDPI and/or the editor(s). MDPI and/or the editor(s) disclaim responsibility for any injury to people or property resulting from any ideas, methods, instructions or products referred to in the content. |
© 2024 by the authors. Licensee MDPI, Basel, Switzerland. This article is an open access article distributed under the terms and conditions of the Creative Commons Attribution (CC BY) license (https://creativecommons.org/licenses/by/4.0/).