
Microfluidic Paper-Based Device Incorporated with Silica Nanoparticles for Iodide Quantification in Marine Source Dietary Supplements

 ,
,  , ,
, ,  ,
,  ,
, 
Abstract
1. Introduction
2. Material and Methods
2.1. Reagents and Solutions
Preparation of Silica Powder
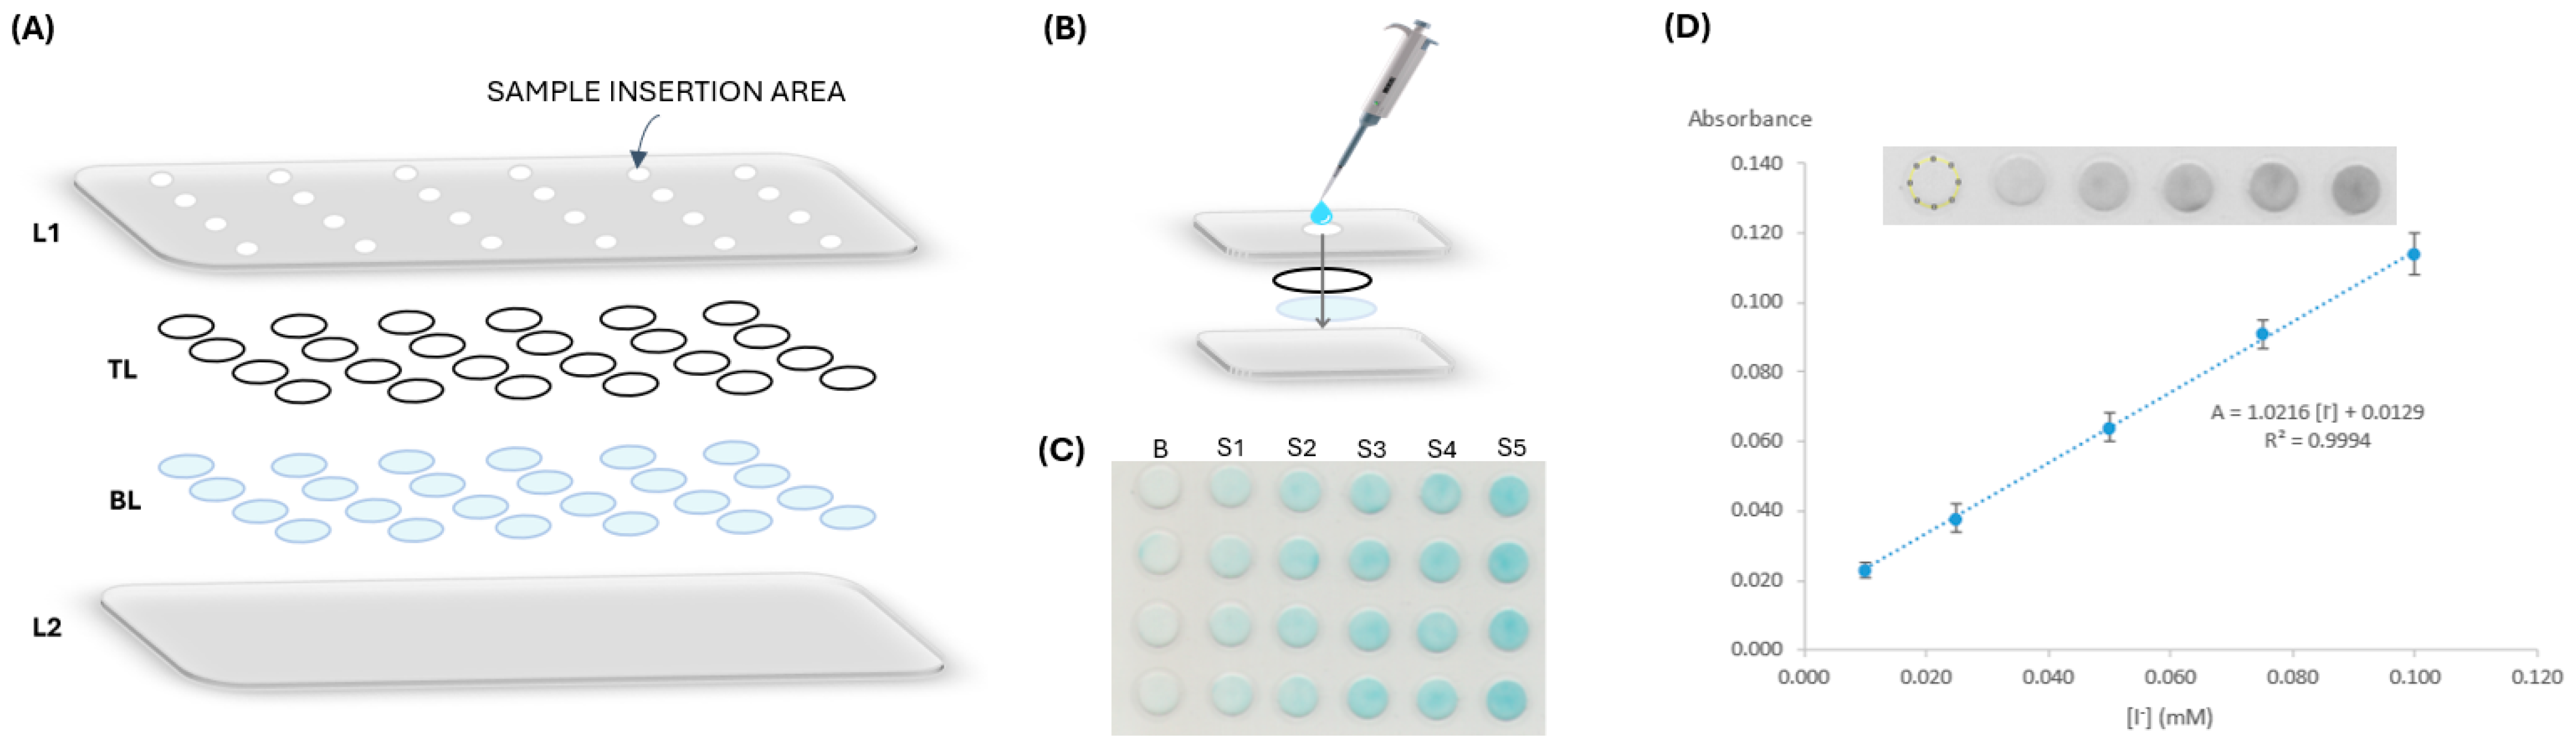
2.2. µPAD Assembly
2.3. Iodide Determination and Data Processing
2.4. Sample Preparation
2.5. Accuracy Assessment—Comparison Method
3. Results and Discussion
3.1. Preliminary Studies
3.2. µPAD Design
3.2.1. Study of the Filter Paper Type
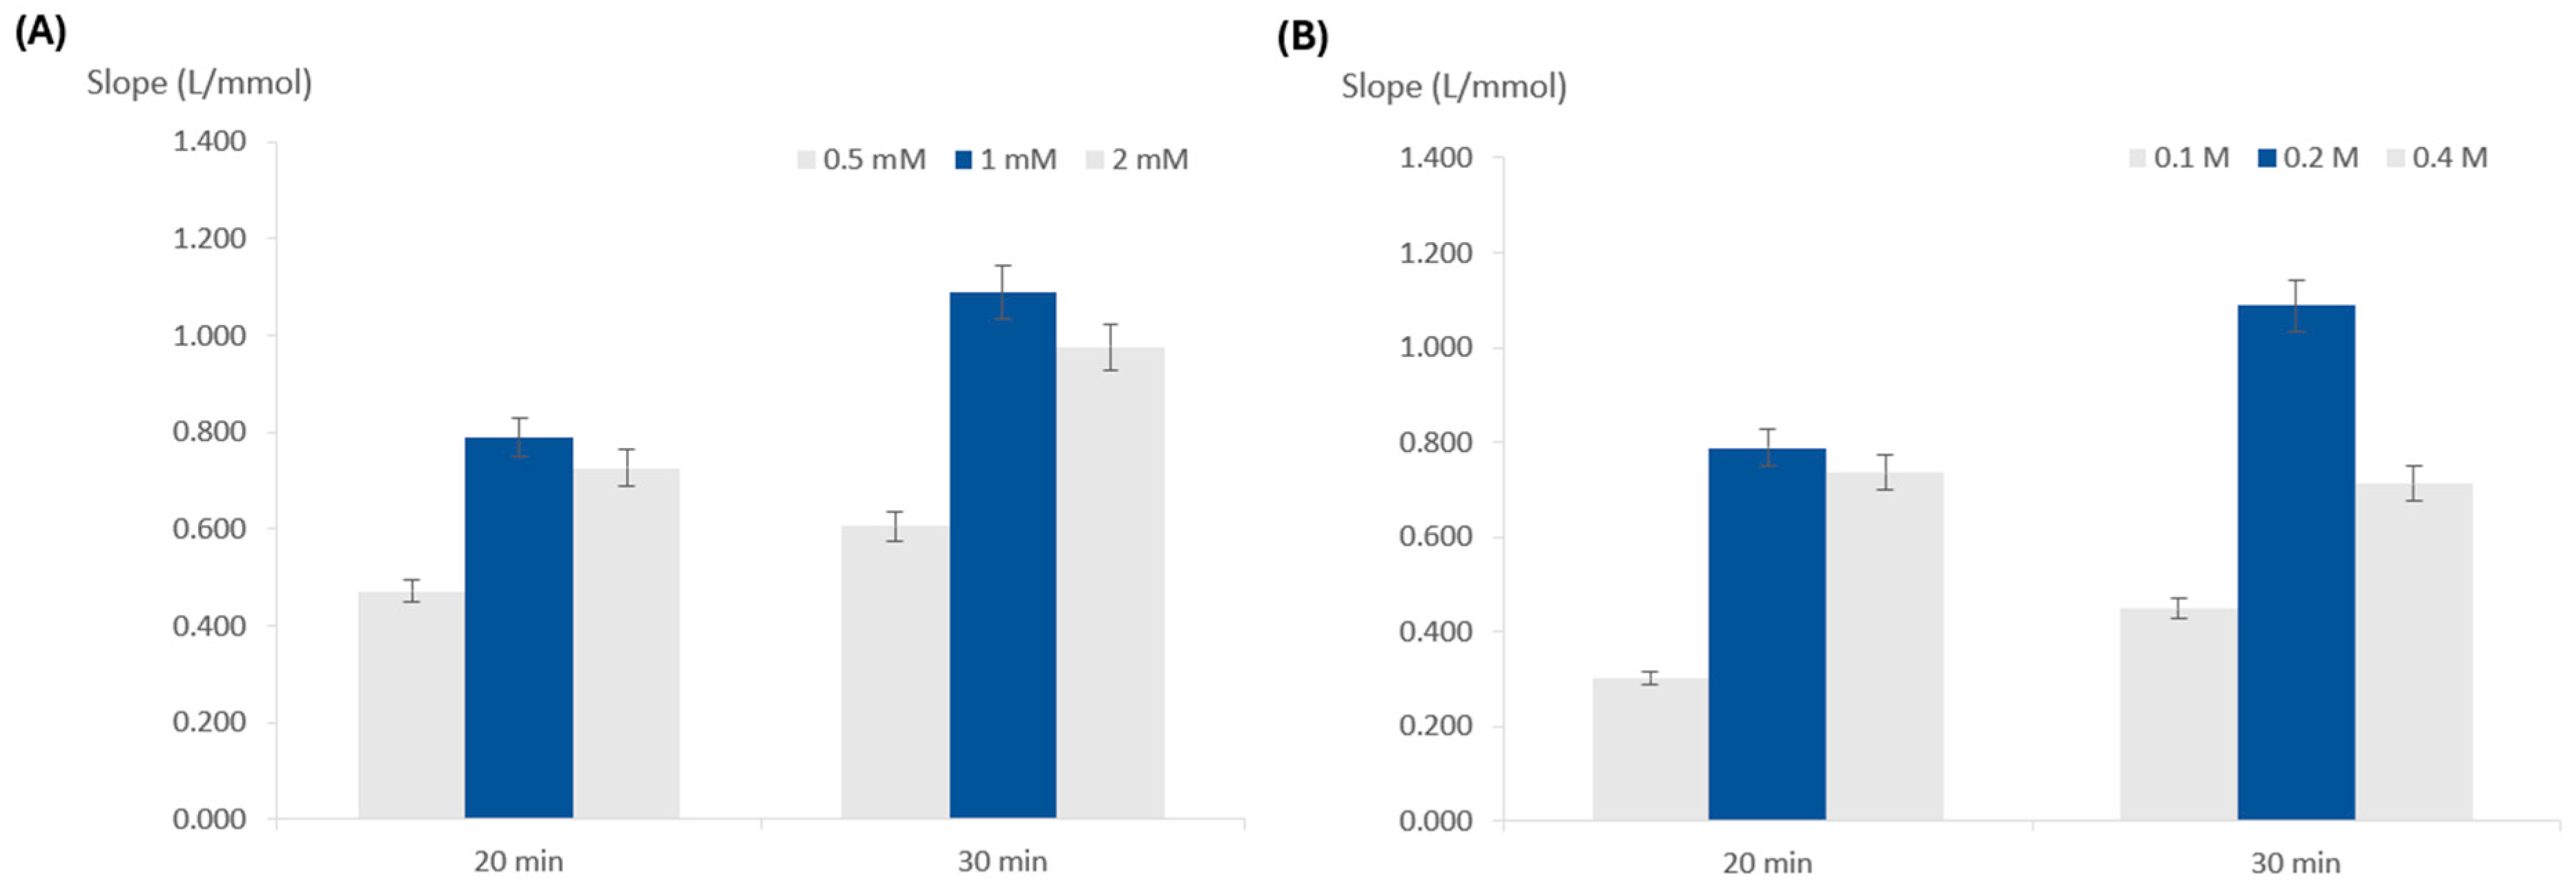
3.2.2. Influence of TMB Concentration
3.2.3. Influence of Peroxide Concentration
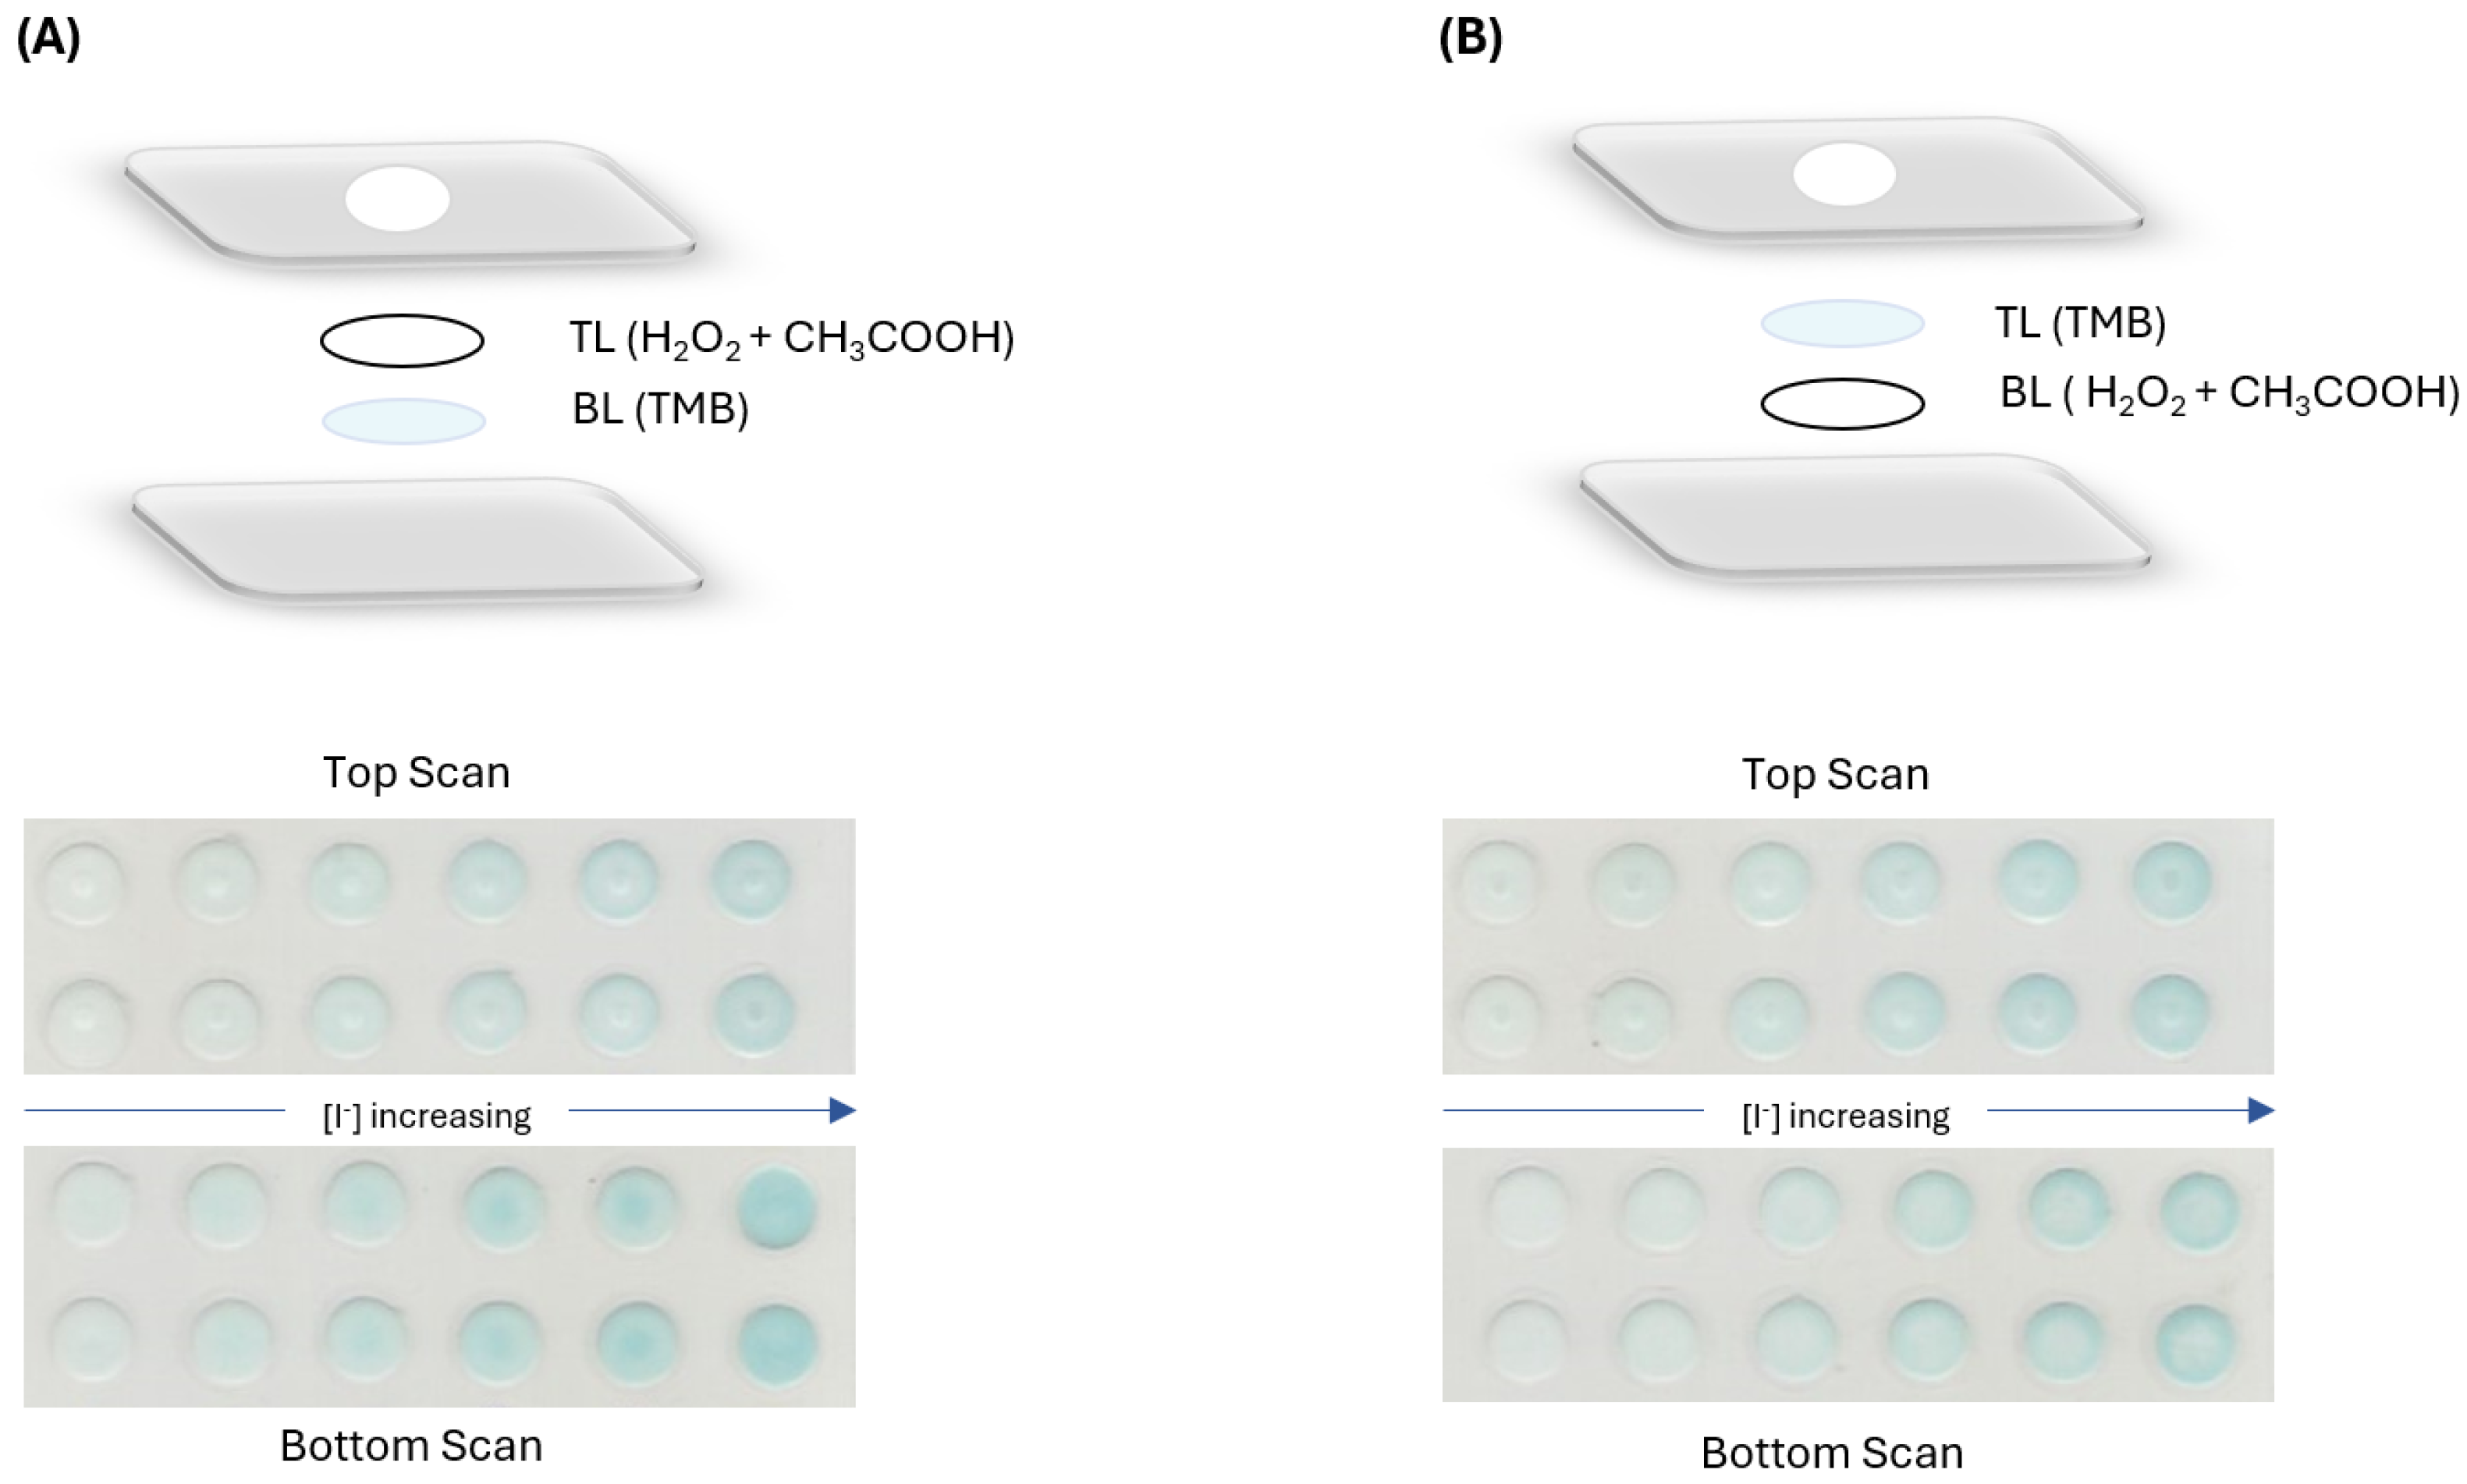
3.2.4. Order of Layers
3.2.5. Sample Volume
3.2.6. Time to Scan
3.2.7. Use of Silica for Improving Repeatability
3.2.8. Influence of pH
3.3. Assessment of Matrix Potential Interferences
3.4. Stability Studies
3.4.1. Stability of the Reaction Product
3.4.2. µPAD Stability
3.5. Features of the µPAD
3.6. Accuracy Assessment—Application to Samples
4. Conclusions
Supplementary Materials
Author Contributions
Funding
Institutional Review Board Statement
Informed Consent Statement
Data Availability Statement
Acknowledgments
Conflicts of Interest
References
- Shishehbore, M.R.; Sheibani, A.; Jokar, R. Kinetic Spectrophotometric Determination of Trace Amounts of iodide in Food Samples. Anal. Sci. 2010, 26, 497–501. [Google Scholar] [CrossRef]
- Aburto, N.J.; Abudou, M.; Candeias, V.; Tiaxiang Wu, P. Effect and Safety of Salt Iodization to Prevent Iodine Deficiency Disorders: A Systematic Review with Meta-Analyses; WHO eLibrary: Geneva, Switzerland, 2014; ISBN 9789241508285. [Google Scholar]
- Zimmermann, M.B. Iodine Deficiency. Endocr. Rev. 2009, 30, 376–408. [Google Scholar] [CrossRef] [PubMed]
- World Health Organization. Assessment of Iodine Deficiency Disorders and Monitoring Their Elimination: A Guide for Programme Managers, 3rd ed.; WHO: Geneva, Switzerland, 2007. [Google Scholar]
- Zimmermann, M.B.; Andersson, M. Assessment of Iodine Nutrition in Populations: Past, Present, and Future. Nutr. Rev. 2012, 70, 553–570. [Google Scholar] [CrossRef] [PubMed]
- Ahad, F.; Ganie, S.A. Iodine, Iodine Metabolism and Iodine Deficiency Disorders Revisited. IJEM 2010, 14, 13–17. [Google Scholar] [PubMed]
- Nunes, N.; Valente, S.; Ferraz, S.; Barreto, M.C.; de Carvalho, M.A.A.P. Validation of a Spectrophotometric Methodology for a Rapid Iodine Analysis in Algae and Seaweed Casts. Algal Res. 2019, 42, 101613. [Google Scholar] [CrossRef]
- Shelor, C.P.; Dasgupta, P.K. Review of Analytical Methods for the Quantification of Iodine in Complex Matrices. Anal. Chim. Acta 2011, 702, 16–36. [Google Scholar] [CrossRef] [PubMed]
- Sulistyarti, H.; Atikah, A.; Fardiyah, Q.; Febriyanti, S.; Asdauna, A. A Simple and Safe Spectrophotometric Method for Iodide Determination. Makara J. Sci. 2015, 19, 1. [Google Scholar] [CrossRef]
- Machado, A.; Lima, L.; Mesquita, R.B.R.; Bordalo, A.A. Improvement of the Sandell-Kolthoff Reaction Method (Ammonium Persulfate Digestion) for the Determination of Iodine in Urine Samples. Clin. Chem. Lab. Med. 2017, 55, e206–e208. [Google Scholar] [CrossRef]
- Huang, C.J.; Lee, L.H.; Cheng, C.P.; Chen, H.S.; Hwu, C.M.; Tang, K.T.; Shih, C.W.; Yeh, C.C.; Wang, F.F.; Yang, C.C. Analytical Validation of an Inductively Coupled Plasma Mass Spectrometry Method for Urinary Iodine Concentration Measurements in Taiwan. J. Formos. Med. Assoc. 2023, 122, 757–765. [Google Scholar] [CrossRef]
- Jamilan, M.A.; Abdullah, J.; Alang Ahmad, S.A.; Md Noh, M.F. Voltammetric Determination of Iodide in Iodized Table Salt Using Cetyltrimethylammonium Bromide as Ion-Pairing. J. Food Sci. Technol. 2019, 56, 3846–3853. [Google Scholar] [CrossRef]
- Machado, A.; Mesquita, R.B.R.; Oliveira, S.; Bordalo, A.A. Development of a Robust, Fast Screening Method for the Potentiometric Determination of Iodide in Urine and Salt Samples. Talanta 2017, 167, 688–694. [Google Scholar] [CrossRef]
- Limchoowong, N.; Sricharoen, P.; Techawongstien, S.; Kongsric, S.; Chanthai, S. A Green Extraction of Trace Iodine in Table Salts, Vegetables, and Food Products Prior to Analysis by Inductively Coupled Plasma Optical Emission Spectrometry. J. Braz. Chem. Soc. 2017, 28, 540–546. [Google Scholar] [CrossRef]
- Jooste, P.L.; Strydom, E. Methods for Determination of Iodine in Urine and Salt. Best Pract. Res. Clin. Endocrinol. Metab. 2010, 24, 77–88. [Google Scholar] [CrossRef] [PubMed]
- Miranda, J.L.A.; Mesquita, R.B.R.; Palacio, E.; Estela, J.M.; Cerdà, V.; Rangel, A.O.S.S. Chip-Based Spectrofluorimetric Determination of Iodine in a Multi-Syringe Flow Platform with and without In-Line Digestion—Application to Salt, Pharmaceuticals, and Algae Samples. Molecules 2022, 27, 1325. [Google Scholar] [CrossRef] [PubMed]
- Varga, I. Iodine Determination in Dietary Supplement Products by TXRF and ICP-AES Spectrometry. Microchem. J. 2007, 85, 127–131. [Google Scholar] [CrossRef]
- Nguyen, V.T.P.; Piersoel, V.; El Mahi, T. Urine Iodide Determination by Ion-Pair Reversed-Phase High Performance Liquid Chromatography and Pulsed Amperometric Detection. Talanta 2012, 99, 532–537. [Google Scholar] [CrossRef] [PubMed]
- Placer, L.; Lavilla, I.; Pena-Pereira, F.; Bendicho, C. A 3D Microfluidic Paper-Based Analytical Device with Smartphone-Assisted Colorimetric Detection for Iodine Speciation in Seaweed Samples. Sens. Actuators B Chem. 2023, 377, 133109. [Google Scholar] [CrossRef]
- Chu, T.; Chu, J.; Gao, B.; He, B. Modern Evolution of Paper-Based Analytical Devices for Wearable Use: From Disorder to Order. Analyst 2020, 145, 5388–5399. [Google Scholar] [CrossRef] [PubMed]
- Wang, C.M.; Chen, C.Y.; Liao, W.S. Enclosed Paper-Based Analytical Devices: Concept, Variety, and Outlook. Anal. Chim. Acta 2021, 1144, 158–174. [Google Scholar] [CrossRef] [PubMed]
- Kosack, C.S.; Page, A.L.; Klatser, P.R. A Guide to Aid the Selection of Diagnostic Tests. Bull. World Health Organ. 2017, 95, 639–645. [Google Scholar] [CrossRef]
- Martinez, A.W.; Phillips, S.T.; Butte, M.J.; Whitesides, G.M. Patterned Paper as a Platform for Inexpensive, Low-Volume, Portable Bioassays. Angew. Chem. Int. Ed. 2007, 46, 1318–1320. [Google Scholar] [CrossRef]
- Aguiar, J.I.S.; Ribeiro, S.O.; Leite, A.; Rangel, M.; Rangel, A.O.S.S.; Mesquita, R.B.R. Iron Determination in Natural Waters Using a Synthesised 3-Hydroxy-4-Pyridione Ligand in a Newly Developed Microfluidic Paper-Based Device. Chemosensors 2023, 11, 101. [Google Scholar] [CrossRef]
- Birch, N.C.; Stickle, D.F. Example of Use of a Desktop Scanner for Data Acquisition in a Colorimetric Assay. Clin. Chim. Acta 2003, 333, 95–96. [Google Scholar] [CrossRef] [PubMed]
- Melo, M.M.P.; Machado, A.; Rangel, A.O.S.S.; Mesquita, R.B.R. Disposable Microfluidic Paper-Based Device for On-Site Quantification of Urinary Creatinine. Chemosensors 2023, 11, 368. [Google Scholar] [CrossRef]
- Lin, J.; Ni, P.; Sun, Y.; Wang, Y.; Wang, L.; Li, Z. Highly Sensitive Colorimetric Determination of Biothiols Based on I−-H2O2-3,3′,5,5′-Tetramethylbenzidine System. Sens. Actuators B Chem. 2018, 255, 3472–3478. [Google Scholar] [CrossRef]
- Palladino, P.; Torrini, F.; Scarano, S.; Minunni, M. 3,3′,5,5′-Tetramethylbenzidine as Multi-Colorimetric Indicator of Chlorine in Water in Line with Health Guideline Values. Anal. Bioanal. Chem. 2020, 412, 7861–7869. [Google Scholar] [CrossRef] [PubMed]
- Ferreira, F.T.S.M.; Mesquita, R.B.R.; Rangel, A.O.S.S. Novel Microfluidic Paper-Based Analytical Devices (ΜPADs) for the Determination of Nitrate and Nitrite in Human Saliva. Talanta 2020, 219, 121183. [Google Scholar] [CrossRef]
- Evans, E.; Moreira Gabriel, E.F.; Benavidez, T.E.; Tomazelli Coltro, W.K.; Garcia, C.D. Modification of Microfluidic Paper-Based Devices with Silica Nanoparticles. Analyst 2014, 139, 5560–5567. [Google Scholar] [CrossRef]
- Currie, L.A. Nomenclature in Evaluation of Analytical Methods Including Detection and Quantification Capabilities (IUPAC Recommendations 1995). Pure Appl. Chem. 1995, 67, 1699–1723. [Google Scholar] [CrossRef]
- Miller, J.N.; Miller, J.C. Statistics and Chemometrics for Analytical Chemistry, 6th ed.; Prentice Hall: Hoboken, NJ, USA, 2010. [Google Scholar]
- Niu, X.; Shi, Q.; Zhu, W.; Liu, D.; Tian, H.; Fu, S.; Cheng, N.; Li, S.; Smith, J.N.; Du, D.; et al. Unprecedented Peroxidase-Mimicking Activity of Single-Atom Nanozyme with Atomically Dispersed Fe–Nx Moieties Hosted by MOF Derived Porous Carbon. Biosens. Bioelectron. 2019, 142, 111495. [Google Scholar] [CrossRef]
- Noviana, E.; Ozer, T.; Carrell, C.S.; Link, J.S.; McMahon, C.; Jang, I.; Henry, C.S. Microfluidic Paper-Based Analytical Devices: From Design to Applications. Chem. Rev. 2021, 121, 11835–11885. [Google Scholar] [CrossRef] [PubMed]
- Yao, Z.; Coatsworth, P.; Shi, X.; Zhi, J.; Hu, L.; Yan, R.; Güder, F.; Yu, H.D. Paper-Based Sensors for Diagnostics, Human Activity Monitoring, Food Safety and Environmental Detection. Sens. Diagn. 2022, 1, 312–342. [Google Scholar] [CrossRef]


| Synthetic Matrix | Tested Compounds and Concentrations | RD |
|---|---|---|
| Multivitamin mix | Calcium 3.71 mg/L | 4% |
| Magnesium 0.78 mg/L | ||
| Potassium 540 mg/L | ||
| Sodium 2.31 g/L | ||
| Chloride 6.57 mg/L | ||
| Lactic acid 0.10 g/L | ||
| Citric acid 0.40 g/L | ||
| Glucose 0.50 g/L | ||
| Sea salts (Sigma S9883) | Calcium 400 mg/L | −6% |
| Magnesium 1.32 g/L | ||
| Potassium 350 mg/L | ||
| Sodium 10.7 g/L | ||
| Chloride 19.5 g/L | ||
| Carbonate 170 mg/L | ||
| Boron 5.6 mg/L | ||
| Stroncium 8.8 mg/L |
| Dynamic range | 10–100 µM |
| Typical calibration curve (A = slope ± SD × [Iodide] mM + intercept ± SD) | A = 1.03 ± 0.13 × [Iodide] + 0.010 ± 0.001 |
| LOD | 3.0 µM |
| LOQ | 10 µM |
| Intraday repeatability, slope RSD a | 3% |
| Interday repeatability, slope RSD a | 3% |
| Time to scan | 25 min |
| Reagent consumption/μPAD | 15 mg silica powder 1.7 mg H2O2 11 mg CH3COOH 58 mg TMB |
| Sample ID | [Iodide]ISE ± SD, µM | [Iodide]μPAD ± SD, µM | RE, % |
|---|---|---|---|
| #Pharm 1 | 49.9 ± 2.8 | 47.4 ± 4.3 | −5.0 |
| #Pharm 2 | 34.3 ± 1.5 | 31.6 ± 1.1 | −8.0 |
| #Pharm 3 | 82.1 ± 3.1 | 78.5 ± 1.6 | −4.4 |
| #Pharm 4 | 48.9 ± 2.2 | 45.6 ± 0.1 | −6.8 |
| #Algae 1 | 22.9 ± 1.4 | 22.6 ± 0.7 | −1.3 |
| #Algae 2 | 52.2 ± 0.1 | 50.1 ± 1.6 | −4.1 |
| #Algae 3 | 67.4 ± 1.9 | 64.2 ± 1.8 | −4.7 |
| #Algae 4 | 11.7 ± 0.1 | 12.1 ± 1.2 | 3.3 |
| #Algae 5 | 49.5 ± 1.1 | 51.7 ± 0.6 | 4.5 |
| #Algae 6 | 79.4 ± 1.8 | 75.5 ± 1.9 | −4.9 |
| #Algae 7 | 11.7 ± 1.2 | 12.7 ± 1.1 | 7.9 |
| #Algae 8 | 50.7 ± 0.7 | 47.8 ± 1.2 | −5.6 |
| #Algae 9 | 80.5 ± 0.1 | 80.0 ± 1.3 | −0.6 |
| Method | Iodine Form | Sample | Analysis Time per Assay | LOD | Reference |
|---|---|---|---|---|---|
| Sandell–Kolthoff (spectrophotometry) | Iodine | Urine | 1 h 30 min | <25 µg/L (0.19 µM) | [10] |
| ICP-MS | Iodine | Urine | <1 h 30 min | 0.95 µg/L (7.5 × 10⁻³ µM) | [11] |
| Voltammetry | Iodide | Salt | ≈1 min | 0.3 mg/L (2.4 µM) | [12] |
| Potentiometry | Iodide, Iodate | Urine and salt | 2 min | 1.39 µM (iodide), 1.77 µM(iodate) | [13] |
| ICP-OES | Iodine | Food | 5 min | 0.049 mg/L (0.39 µM) | [14] |
| Microplate method (spectrophotometry) | Iodine | Urine | ≈1 h 30 min | n.d. 1 | [15] |
| Chip-based spectrofluorimetry | Iodine | Salt, pharmaceuticals, and algae | n.d. 1 | 0.028 µM | [16] |
| Total reflection X-ray fluorescence | Iodine | Water and dietary supplements | <15 min | 180 µg/L (1.4 µM) | [17] |
| HPLC (spectrophotometry) | Iodide | Urine | 13 min | n.d. 1 | [18] |
| µPAD (spectrophotometry) | Iodide, Iodate | Seaweed | 1 min | 9.8 µM (iodide), 0.6 µM (iodate) | [19] |
| µPAD (spectrophotometry) | Iodide | Pharmaceuticals and algae | 25 min | 3 µM | This work |
Disclaimer/Publisher’s Note: The statements, opinions and data contained in all publications are solely those of the individual author(s) and contributor(s) and not of MDPI and/or the editor(s). MDPI and/or the editor(s) disclaim responsibility for any injury to people or property resulting from any ideas, methods, instructions or products referred to in the content. |
© 2024 by the authors. Licensee MDPI, Basel, Switzerland. This article is an open access article distributed under the terms and conditions of the Creative Commons Attribution (CC BY) license (https://creativecommons.org/licenses/by/4.0/).
Share and Cite
Pereira, M.G.; Machado, A.; Leite, A.; Rangel, M.; Bordalo, A.; Rangel, A.O.S.S.; Mesquita, R.B.R. Microfluidic Paper-Based Device Incorporated with Silica Nanoparticles for Iodide Quantification in Marine Source Dietary Supplements. Sensors 2024, 24, 1024. https://doi.org/10.3390/s24031024
Pereira MG, Machado A, Leite A, Rangel M, Bordalo A, Rangel AOSS, Mesquita RBR. Microfluidic Paper-Based Device Incorporated with Silica Nanoparticles for Iodide Quantification in Marine Source Dietary Supplements. Sensors. 2024; 24(3):1024. https://doi.org/10.3390/s24031024
Chicago/Turabian StylePereira, Mafalda G., Ana Machado, Andreia Leite, Maria Rangel, Adriano Bordalo, António O. S. S. Rangel, and Raquel B. R. Mesquita. 2024. "Microfluidic Paper-Based Device Incorporated with Silica Nanoparticles for Iodide Quantification in Marine Source Dietary Supplements" Sensors 24, no. 3: 1024. https://doi.org/10.3390/s24031024
APA StylePereira, M. G., Machado, A., Leite, A., Rangel, M., Bordalo, A., Rangel, A. O. S. S., & Mesquita, R. B. R. (2024). Microfluidic Paper-Based Device Incorporated with Silica Nanoparticles for Iodide Quantification in Marine Source Dietary Supplements. Sensors, 24(3), 1024. https://doi.org/10.3390/s24031024