4.1. Implementation Details
Training. The entirety of our network is capable of being trained in an end-to-end manner utilizing extensive datasets. SiamGCN was trained utilizing pairs of images derived from both video sources and static images. The dataset utilized for training comprises ImageNet-VID [
25], ImageNet-DET [
25], GOT-10k [
26], and COCO [
27]. The size of the search region patch measures
, while the template patch measures
. In the context of the video datasets, specifically GOT-10k and ImageNet-VID, we employ a method of random selection whereby two frames are chosen from the same video sequence, ensuring that they are no more than 100 frames apart. This selection process is utilized to create the template and search region patches. Transformations are applied to the original images in the COCO and ImageNet-DET datasets to create sampled pairs. In the course of training, each epoch employs
image pairs that are uniformly sampled from the training dataset.
The backbone parameters are initialized using MobileNetV3-small [
4], which is pretrained on the ImageNet dataset [
25]. The training process is divided into two distinct stages. In the initial phase, the backbone and head are subjected to training for a duration of 20 epochs. Initially, during the first five epochs, a warm-up learning rate is implemented, transitioning from 0.001 to 0.005. Subsequently, over the following fifteen epochs, the learning rate undergoes exponential decay, decreasing from 0.005 to 0.00005. The learning rate for the backbone is established at one-tenth of the prevailing learning rate. At this stage, the ADAM optimizer [
28] with a weight decay of
is employed to facilitate rapid convergence of the model. During the subsequent phase, fine-tuning of the model is performed. The optimization process is transitioned to stochastic gradient descent (SGD), incorporating a weight decay parameter of 0.0001 and a momentum coefficient of 0.9. In the initial ten epochs of this phase, we maintain the backbone parameters in a fixed state, while ensuring that all other configurations remain consistent with those established in the preceding stage.
Testing. An offline tracking strategy is used throughout the testing phase. The object depicted in the initial frame of the video sequence serves as the template for subsequent analysis. Consequently, the target branch of the Siamese network can be pre-computed and kept constant during the tracking procedure. The search region derived from the present video frame serves as the input for the search branch. This study assessed various datasets by employing their designated official metrics, which can vary from one dataset to another. The tracker was developed using Python 3.7 and PyTorch 2.1.0. Training and testing processes were executed on a personal computer equipped with an Intel i7-12700H CPU and an Nvidia 3090Ti GPU. The training process for SiamGCN requires approximately 7 h, reflecting the computational efficiency of its lightweight architecture. SiamGCN is characterized by its simplicity as a tracker without post-processing, positional embedding, and multi-layer feature aggregation strategies.
4.2. Results and Comparisons
This research compares SiamGCN with state-of-the-art trackers on four tracking benchmarks, including VOT2018 [
29], VOT2019 [
30], LaSOT [
16], and TrackingNet [
31].
VOT2018. VOT2018 [
29] consists of 60 challenging video sequences that encompass a range of scenarios, including rapid motion and occlusion. The overall performance of the tracker was assessed through the expected average overlap (EAO), which integrates two critical components: accuracy, defined as the average overlap achieved during successful tracking, and robustness, characterized by the failure rate. The results of the comparison with leading trackers on VOT2018 are illustrated in
Table 1. Among the previously established methods, SiamBAN [
2] attained the highest expected average overlap (EAO), whereas SiamMask [
32] demonstrated the highest accuracy, with both methodologies utilizing ResNet50 for feature extraction. Our approach, characterized by its efficient design, attains the second-highest performance in terms of expected average overlap (EAO) and robustness. This is accomplished while markedly decreasing the number of parameters and FLOPs in comparison to the leading SiamBAN model. The tracker demonstrates elevated effectiveness and robustness, concurrently achieving a significant reduction in the consumption of computational resources.
VOT2019. The VOT2019 [
30] dataset also consists of 60 challenging video sequences, with 20% of these sequences being updated from VOT2018. This update introduces further complexities, especially in scenarios involving rapid motion and similar distractors. The performance of our SiamGCN is illustrated in
Table 2, showcasing metrics such as the expected average overlap (EAO), accuracy, and robustness. This comparison delineates SiamRPN++ (R) and (M), which correspond to the versions utilizing ResNet50 and the lightweight backbone MobileNetv2 for the purpose of feature extraction, respectively. In comparison to SiamRPN++ utilizing ResNet50, the implementation of MobileNetv2 led to a decrease of 11.2% in EAO, along with significant declines in accuracy and robustness. In contrast, our approach employs a lightweight backbone for feature extraction, attaining an EAO that is nearly equivalent to that of the second-best tracker, Ocean, while also exhibiting superior robustness. Furthermore, the parameters and FLOPs of SiamGCN constitute merely 2.1% and 7.7% of those of Ocean, respectively. SiamGCN effectively manages intricate scenarios, underscoring its applicability for implementation in environments with limited resources.
LaSOT. LaSOT [
16] is a large-scale long-term tracking dataset that comprises 1120 training videos and 280 test videos. It encompasses 14 distinct attributes and maintains balanced categories. The typical duration of each video is 2500 frames.
Table 3 illustrates that SiamGCN secures the top position in precision metrics while achieving second place in AUC and
PNorm. Specifically, it attains 96% of the performance level of the state-of-the-art HiT model in AUC while requiring only 21% of HiT’s parameters and 42% of its FLOPs. This outcome illustrates the robust capability of SiamGCN in managing long video sequence tracking tasks, highlighting its commendable equilibrium between performance and efficiency.
TrackingNet. TrackingNet [
31] is a large-scale dataset designed for the evaluation and development of object-tracking algorithms. The dataset comprises over 30,000 videos, which include more than 14 million meticulously annotated bounding boxes. The videos are predominantly obtained from YouTube and encompass a diverse array of real-world object categories and situations. The performance of SiamGCN was evaluated using its testing set.
Table 4 illustrates that our SiamGCN exhibits competitive performance on TrackingNet, attaining a precision rate of 66.4%, surpassing SiamFC++ and ATOM by 1.8% and 1.6%, respectively. In terms of the AUC and normalized precision
PNorm, SiamGCN achieves 71.5% and 76.8%, respectively, maintaining comparable results to HiT. Additionally, SiamGCN utilizes 79% fewer model parameters and 57% fewer FLOPs, highlighting its exceptional efficiency.
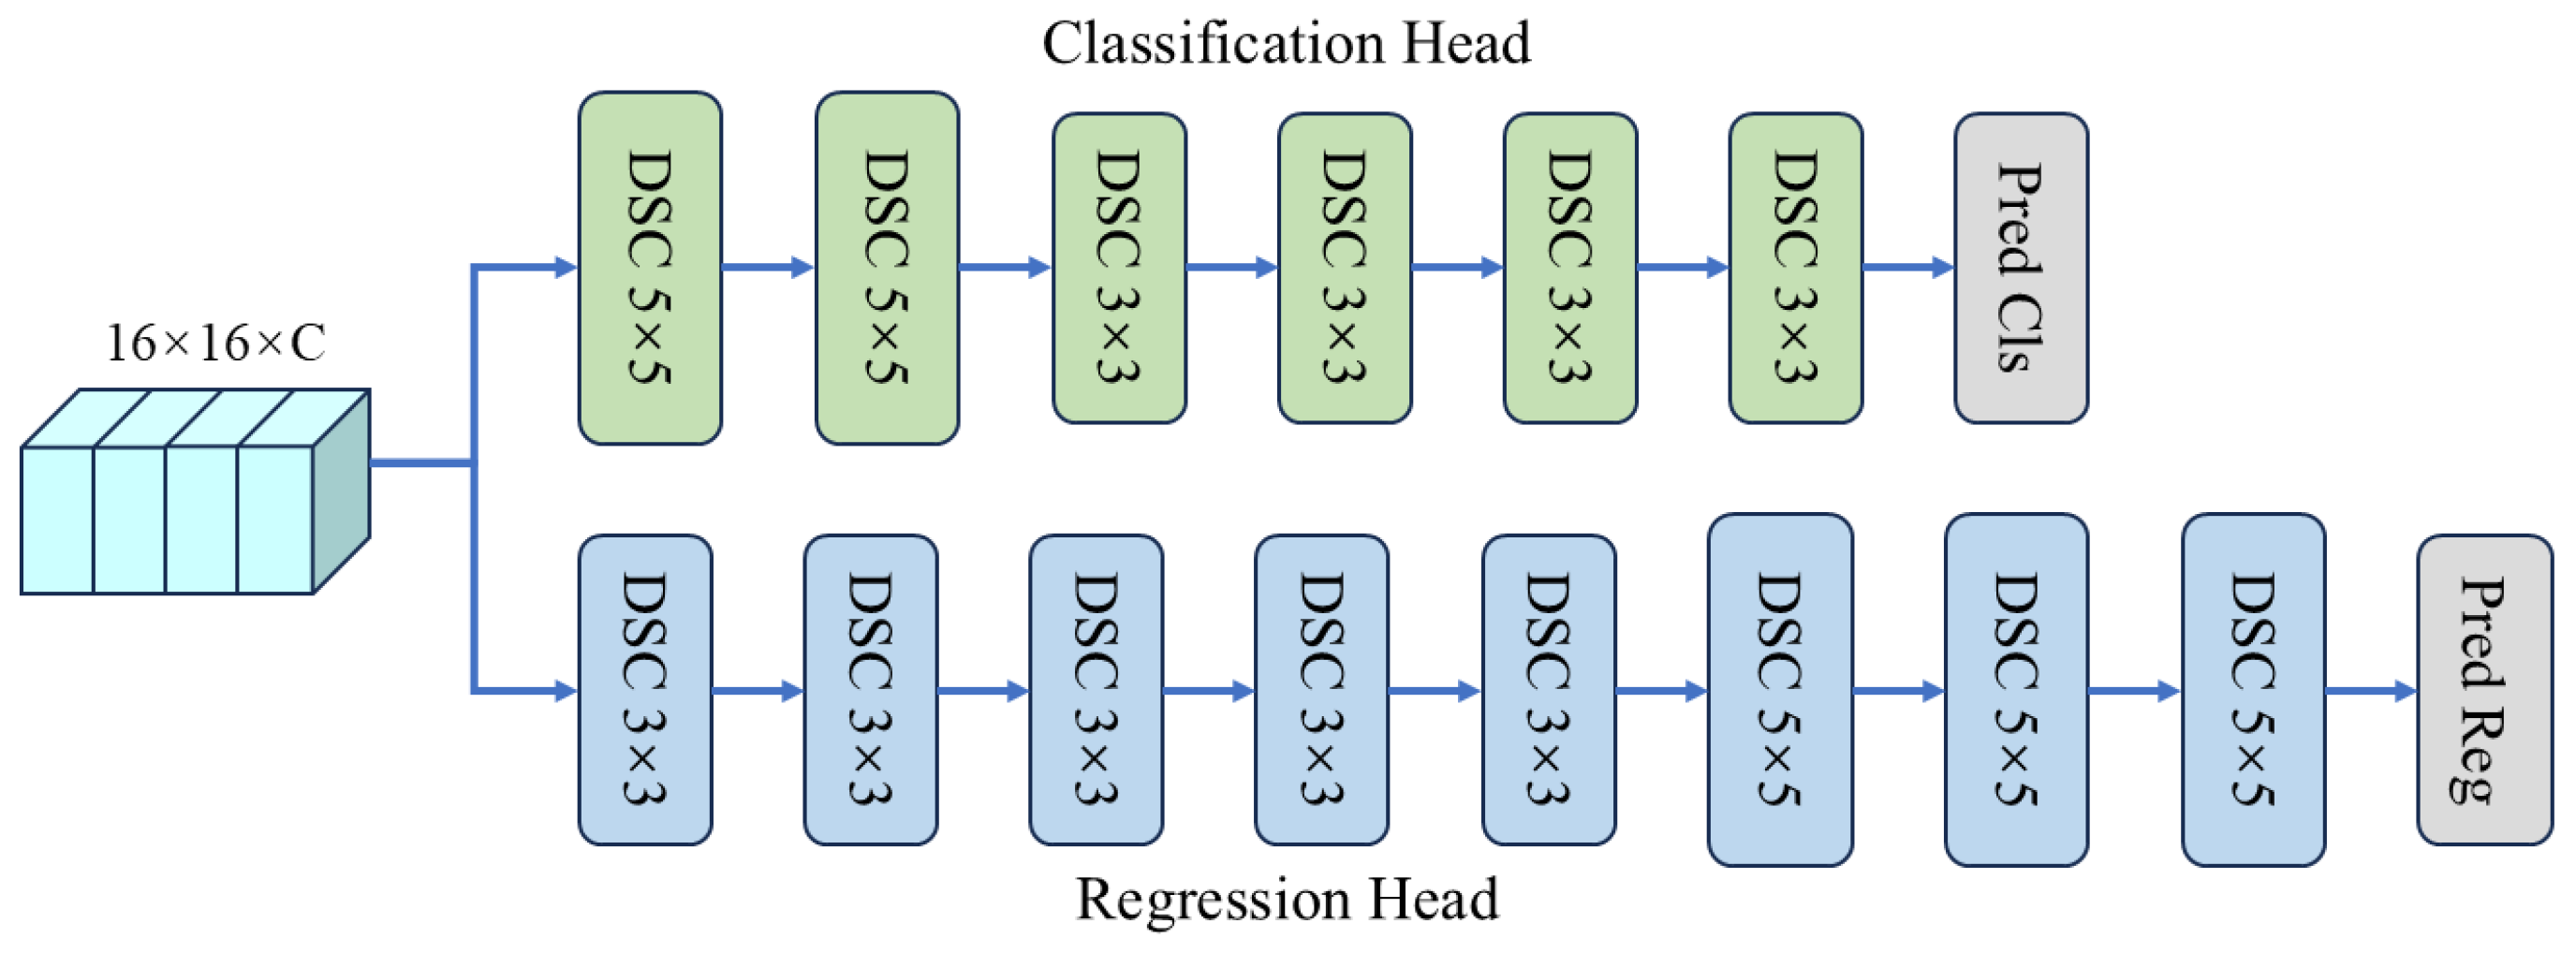
4.3. Ablation Studies
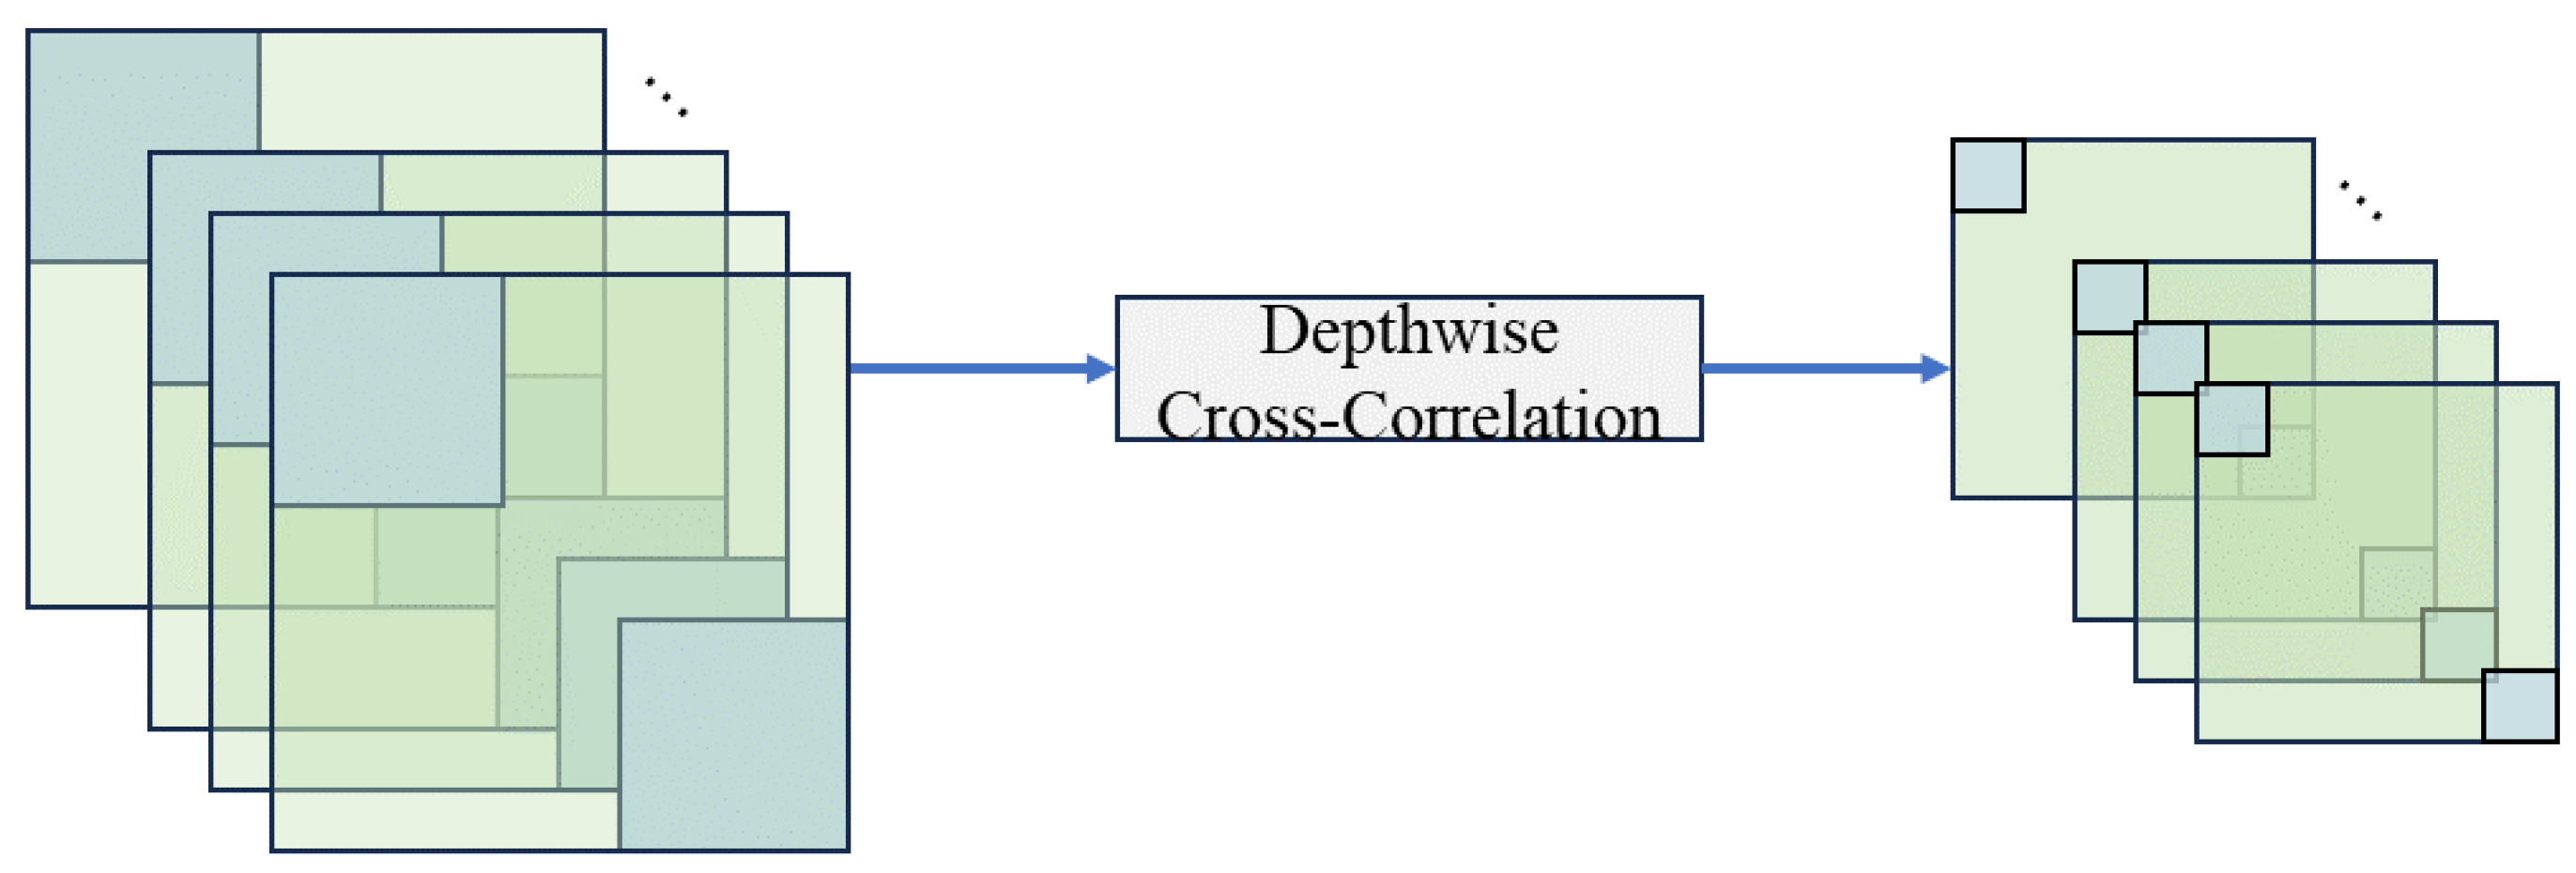
Comparison of feature fusion. This study evaluated the efficacy of the proposed global correlation method in comparison to two widely utilized correlation techniques within the context of the VOT2019 dataset. In native correlation, the central region of the template features , denoted as , is selected as the convolution kernel and is utilized in a sliding window convolution across the search region features , producing a similarity response map. Here, C is the number of feature channels, while and represent the spatial dimensions of the template and search region, respectively, determined through preprocessing steps. Depthwise correlation exhibits a distinct approach by considering each channel of the template features as an individual convolution kernel. It independently applies sliding window convolution to the corresponding channel of the search region features , generating a similarity response map.
The computational complexities of native correlation, depthwise correlation, and the global correlation module differ significantly due to their mechanisms. Native correlation calculates the local similarity by treating the entire template feature as a convolutional kernel sliding over the search region , with a complexity of . Depthwise correlation, on the other hand, simplifies the process by treating each channel of the template feature as an independent kernel, performing sliding window convolutions independently for each channel. This reduces the computational complexity to but sacrifices the ability to capture inter-channel dependencies.
In contrast, the global correlation module leverages attention mechanisms to model global interactions between the template and the search region, with a complexity of . The complexity is primarily determined by the second term , which mainly depends on the projected feature dimension d. The global correlation module achieves significant improvements in robustness and tracking accuracy by effectively capturing rich global feature dependencies. Although this introduces a modest increase in computational complexity, the use of multi-head attention mechanisms enables parallel processing, which helps optimize computational performance and ensures the module remains efficient.
The results of the comparison involving our tracker and various correlation methods are illustrated in
Table 5. In comparison to depthwise correlation and native correlation, our global correlation demonstrates enhancements in EAO of 5.5% and 7.2%, respectively, along with notable improvements in robustness. Furthermore, the global correlation module maintains a competitive computational efficiency, with FLOPs and parameter counts slightly higher than those of depthwise correlation but significantly lower than those of native correlation. This balance between superior tracking accuracy and computational cost demonstrates the module’s effectiveness and practicality for real-world applications. These findings indicate that global correlation exhibits superiority across multiple dimensions.
Comparison of different backbones. This study evaluated the performance of various backbone networks utilizing the VOT2019 dataset, as illustrated in
Table 6. In order to optimize both efficiency and accuracy within the tracking model, the output feature stride of all the backbone networks was modified to 16. The evaluations were performed on a personal computer equipped with an Intel Core i7-12700 CPU and an NVIDIA GeForce RTX 3090 Ti GPU. FasterNet [
39] exhibited remarkable performance on GPU platforms; however, its performance on CPU systems was comparatively subpar. This discrepancy suggests that the optimizations implemented in FasterNet are predominantly tailored for GPU utilization rather than CPU execution.
In comparison, MobileNetV3 [
4] demonstrated stable and consistent performance across both GPU and CPU platforms. Designed specifically for mobile and edge devices, MobileNetV3 achieves a practical trade-off between accuracy and computational efficiency by incorporating depthwise separable convolutions, squeeze-and-excitation modules, and the optimized hard-swish activation function. Although FasterNet and MobileNetV3 demonstrated similar outcomes and exhibited strong performance on GPUs, the markedly inferior performance of FasterNet on CPUs makes it impractical for implementation on edge devices. Given these considerations, MobileNetV3 was selected as the backbone for the SiamGCN model to ensure high tracking accuracy and efficient operation on resource-constrained platforms.
Comparison of loss function. To assess the impact of different loss function configurations on tracking performance, we conducted experiments with varying weights for the classification and regression losses on the VOT2019 benchmark. The results are summarized in
Table 7.
The configuration serves as the baseline, providing balanced performance and acting as a reference for further tuning. Increasing the regression weight to improves localization accuracy and robustness, achieving the best overall performance. Conversely, emphasizing classification with leads to a decline in performance, highlighting that excessive focus on classification compromises bounding box precision. Adjusting the weights to also yields competitive results, highlighting the importance of striking a balance between classification and regression contributions to achieve optimal tracking performance. These findings demonstrate that slightly increasing the weight of the regression branch can effectively improve the tracker’s performance.


