1. Introduction
Radiation therapy (RT) for cancer has become increasingly complex with modalities such as volumetric modulated arc therapy, image-guided therapy, and intraoperative RT. FLASH RT (FRT) delivers an ultra-high dose of radiation within a fraction of a second, as opposed to conventional treatment delivery, which takes minutes. Studies suggest that ultra-high dose rate (UHDR) RT more effectively spares healthy tissue compared to conventional treatment for equivalent administered doses [
1,
2,
3]. Thus, FRT has the potential to significantly shorten treatment times and mitigate adverse effects related to toxicity in healthy tissues [
1,
2,
4,
5,
6].
UHDR beams have many parameters, including dose per pulse (DPP), pulse repetition frequency (PRF), mean dose rate, and pulse width (PW), but the parameters involved in creating the healthy tissue-sparing effect remain unknown because of inconsistent dose reporting in different studies. A reliable detector would help researchers understand the FLASH effect by accurately measuring beam parameters as well as the dose delivered in real time.
Various detectors are under study for potential use in FRT dosimetry, such as beam current transformers (BCTs), ion chambers, and scintillator detectors [
7,
8,
9,
10]. The BCTs are capable of real-time measurements and can reliably monitor the beam at the exit of the accelerator. However, they do not allow for in vivo dosimetry, do not provide spatial information about the beam structure, and can only be used with charged particle beams [
7]. Ion chambers are the standard dosimeters used in conventional RT, but they are subject to large changes in sensitivity because of ion recombination when used at UHDR [
9,
11,
12]. In UHDR, the higher dose rate leads to higher ion density and increases the likelihood of recombination before the charges are collected by the electrodes. Finally, scintillator detectors are promising candidates for FLASH dosimetry due to their real-time measurement capability, dose linearity, and dose rate independence [
13,
14,
15,
16,
17,
18,
19]. Another important property of a radiation detector dedicated to FRT is its radiation resistance and its behavior under a large, cumulated dose. Inorganic scintillators are more radiation resistant than organic scintillators [
20].
In this study, we examined the response of an innovative inorganic ZnS:Ag powder scintillator detector under UHDR electron beams. The linearity of the dosimeter response with increasing dose, DPP, and mean instantaneous dose rate was validated. We also investigated the dependence of the ZnS:Ag scintillator on PW and PRF. Once the detector’s properties were determined, we determined its stability and reproducibility and compared the stem signal with that of an organic scintillator.
2. Materials and Methods
2.1. Detector Design
To construct the detector, a ZnS:Ag powder (Eljen, Sweetwater, TX, USA) in a polyethylene terephthalate tube (Nordson Medical, Westlake, OH, USA) was coupled to an 8 m Eska GH-4001-P polymethyl methacrylate (PMMA) optical fiber (Mitsubishi Rayon Corporation, Tokyo, Japan) light guide. The powder typical particle size was 8 μm and it was mixed with Norland optical adhesive (Norland Products Inc., Jamesburg, NJ, USA) in a 1:100 mass ratio. The scintillator volume formed a cylinder measuring 0.2 mm in length and 1.0 mm in diameter. One end of the polished optical fiber was dipped into Norland optical adhesive and inserted into the tubing to connect with the scintillator volume. The other end of the optical fiber was connected to a Shamrock 163 spectrometer (Andor Technology, Belfast, Northern Ireland). The spectrometer was connected to a Lucas S charge-coupled device (CCD) (Andor Technology). For each acquisition, the whole field of the CCD camera was used, with an area of 6.58 mm × 4.96 mm. The camera’s elements were 10 × 10 μm
2 each. The scintillator was placed at a 20 mm depth, with 100 mm of backscatter in all acquisitions (
Figure 1). In this study, the surface-to-source distance (SSD) refers to the distance between the surface of the setup and the head of the irradiator. Electron beams of 9 MeV produced by a Mobetron FLASH electron linear accelerator (IntraOp, Sunnyvale, CA, USA) were used for all the irradiations [
21]. For each spectrum acquired with the spectrometer, we determined the area under the curve (AUC), which represented the signal response of the detector. The parameters used for each experiment are presented in
Table 1 [
22].
2.2. Beam Parameter Variations
2.2.1. Variation in PRF and Linearity of Dose
To investigate the mean dose rate dependence of the detector, we changed the PRF for 2 SSDs (
Table 1). The mean dose rate tested ranged from 27 to 1008 Gy/s. The PW and the number of pulses were the same for both acquisitions. To assess the linearity of the signal to integrated dose, we incrementally increased the number of pulses delivered in a single acquisition. The number of pulses was between 1 and 120, corresponding to doses of 1.51 to 180 Gy.
2.2.2. Variation in DPP
The DPP dependency of the detector was evaluated by changing PW but keeping the same SSD and PRF. The DPP value varied between 0.5 and 4.0 µs. The DPP dependency was also evaluated by varying the SSD from 0 to 150 mm at a fixed PW and PRF.
2.2.3. PW and Instantaneous Dose Rate
To evaluate the relationship between the PW and the instantaneous dose rate, the DPP was matched to 0.5 Gy and 1 Gy at different PW by varying the SSD.
2.3. Scintillator Intensity and Stability Assessment
We aimed to characterize the signal intensity of the scintillator powder by comparing its scintillation spectrum to that of BCF-12, a well-known plastic scintillator. A BCF-12 scintillator with a diameter of 1 mm and a length of 2 mm was coupled to 8 m of clear PMMA fiber. The stem signal was measured by shifting the scintillator volume out of the field while exposing the same length of clear fiber. From the spectrum, we calculated the AUC ratios for both BCF-12 and ZnS:Ag.
For 10 consecutive days, the detector was irradiated daily, involving 5 acquisitions of 5 pulses at 9 MeV with a PW of 4 µs, SSD of 20 mm, and DPP of 5.6 Gy. The standard deviation of these daily measurements was calculated to assess the daily stability of the detector. Additionally, the stability was evaluated by computing the standard deviation of 10 consecutive measurements taken under the same experimental conditions. A rest period of 15 min was observed between each measurement to ensure accuracy and consistency. The BCTs measurements were used to validate the stability of the output of the linear accelerator.
3. Results
3.1. Beam Parameter Variation
3.1.1. Variation in PRF and Linearity to Dose
We first investigated the dependence of our detector’s signal on PRF.
Figure 2 shows the difference in the percentage of the signal at the lowest PRF setting (5 Hz) as a function of PRF for DPPs of 5.6 Gy and 3.7 Gy. The absolute difference remained under 0.5% across all PRF values tested. At a DPP of 5.6 Gy, the detector signal was always lower than the reference at PRF = 5 Hz. The maximum absolute variation was 0.4% at 90 Hz, whereas the maximum absolute variation for DPP = 3.7 Gy was 0.2%. The mean dose rate tested ranged from 27 to 1008 Gy/s.
After the PRF dependence study, we evaluated the detector signal as we increased the number of pulses delivered.
Figure 3 shows the detector signal as a function of the number of pulses. The total delivered dose is indicated at the top of the graph. The signal was found to be linear to the integrated dose with an R
2 greater than 0.99 for both PRF values tested (30 and 120 Hz).
3.1.2. Variation in DPP
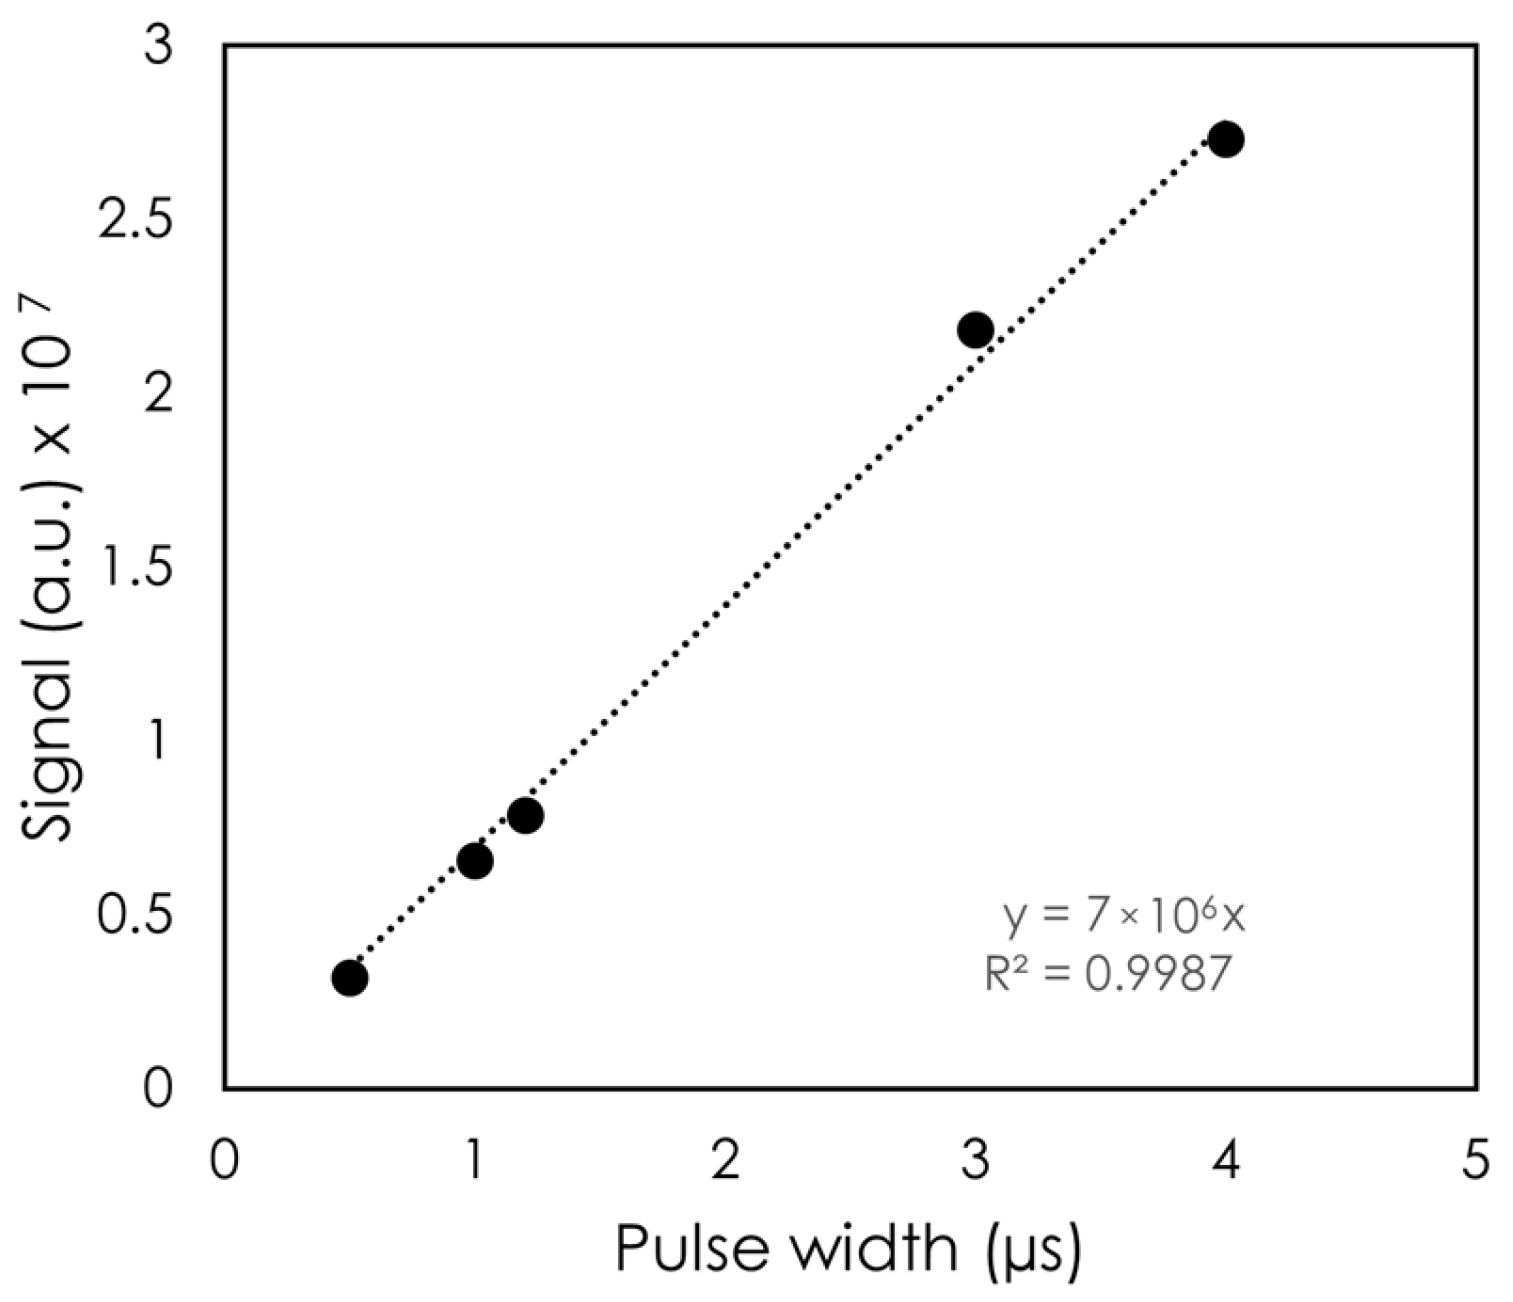
The DPP was first varied by changing the PW.
Figure 4 shows the signal as a function of PW. Across the PW values tested, the variation in signal was found to be linear with PW, with R
2 > 0.99. The largest PW was 4 μs, which corresponded to a DPP of 4.5 Gy for this setup, and the shortest PW tested was 0.5 μs (DPP = 0.5 Gy).
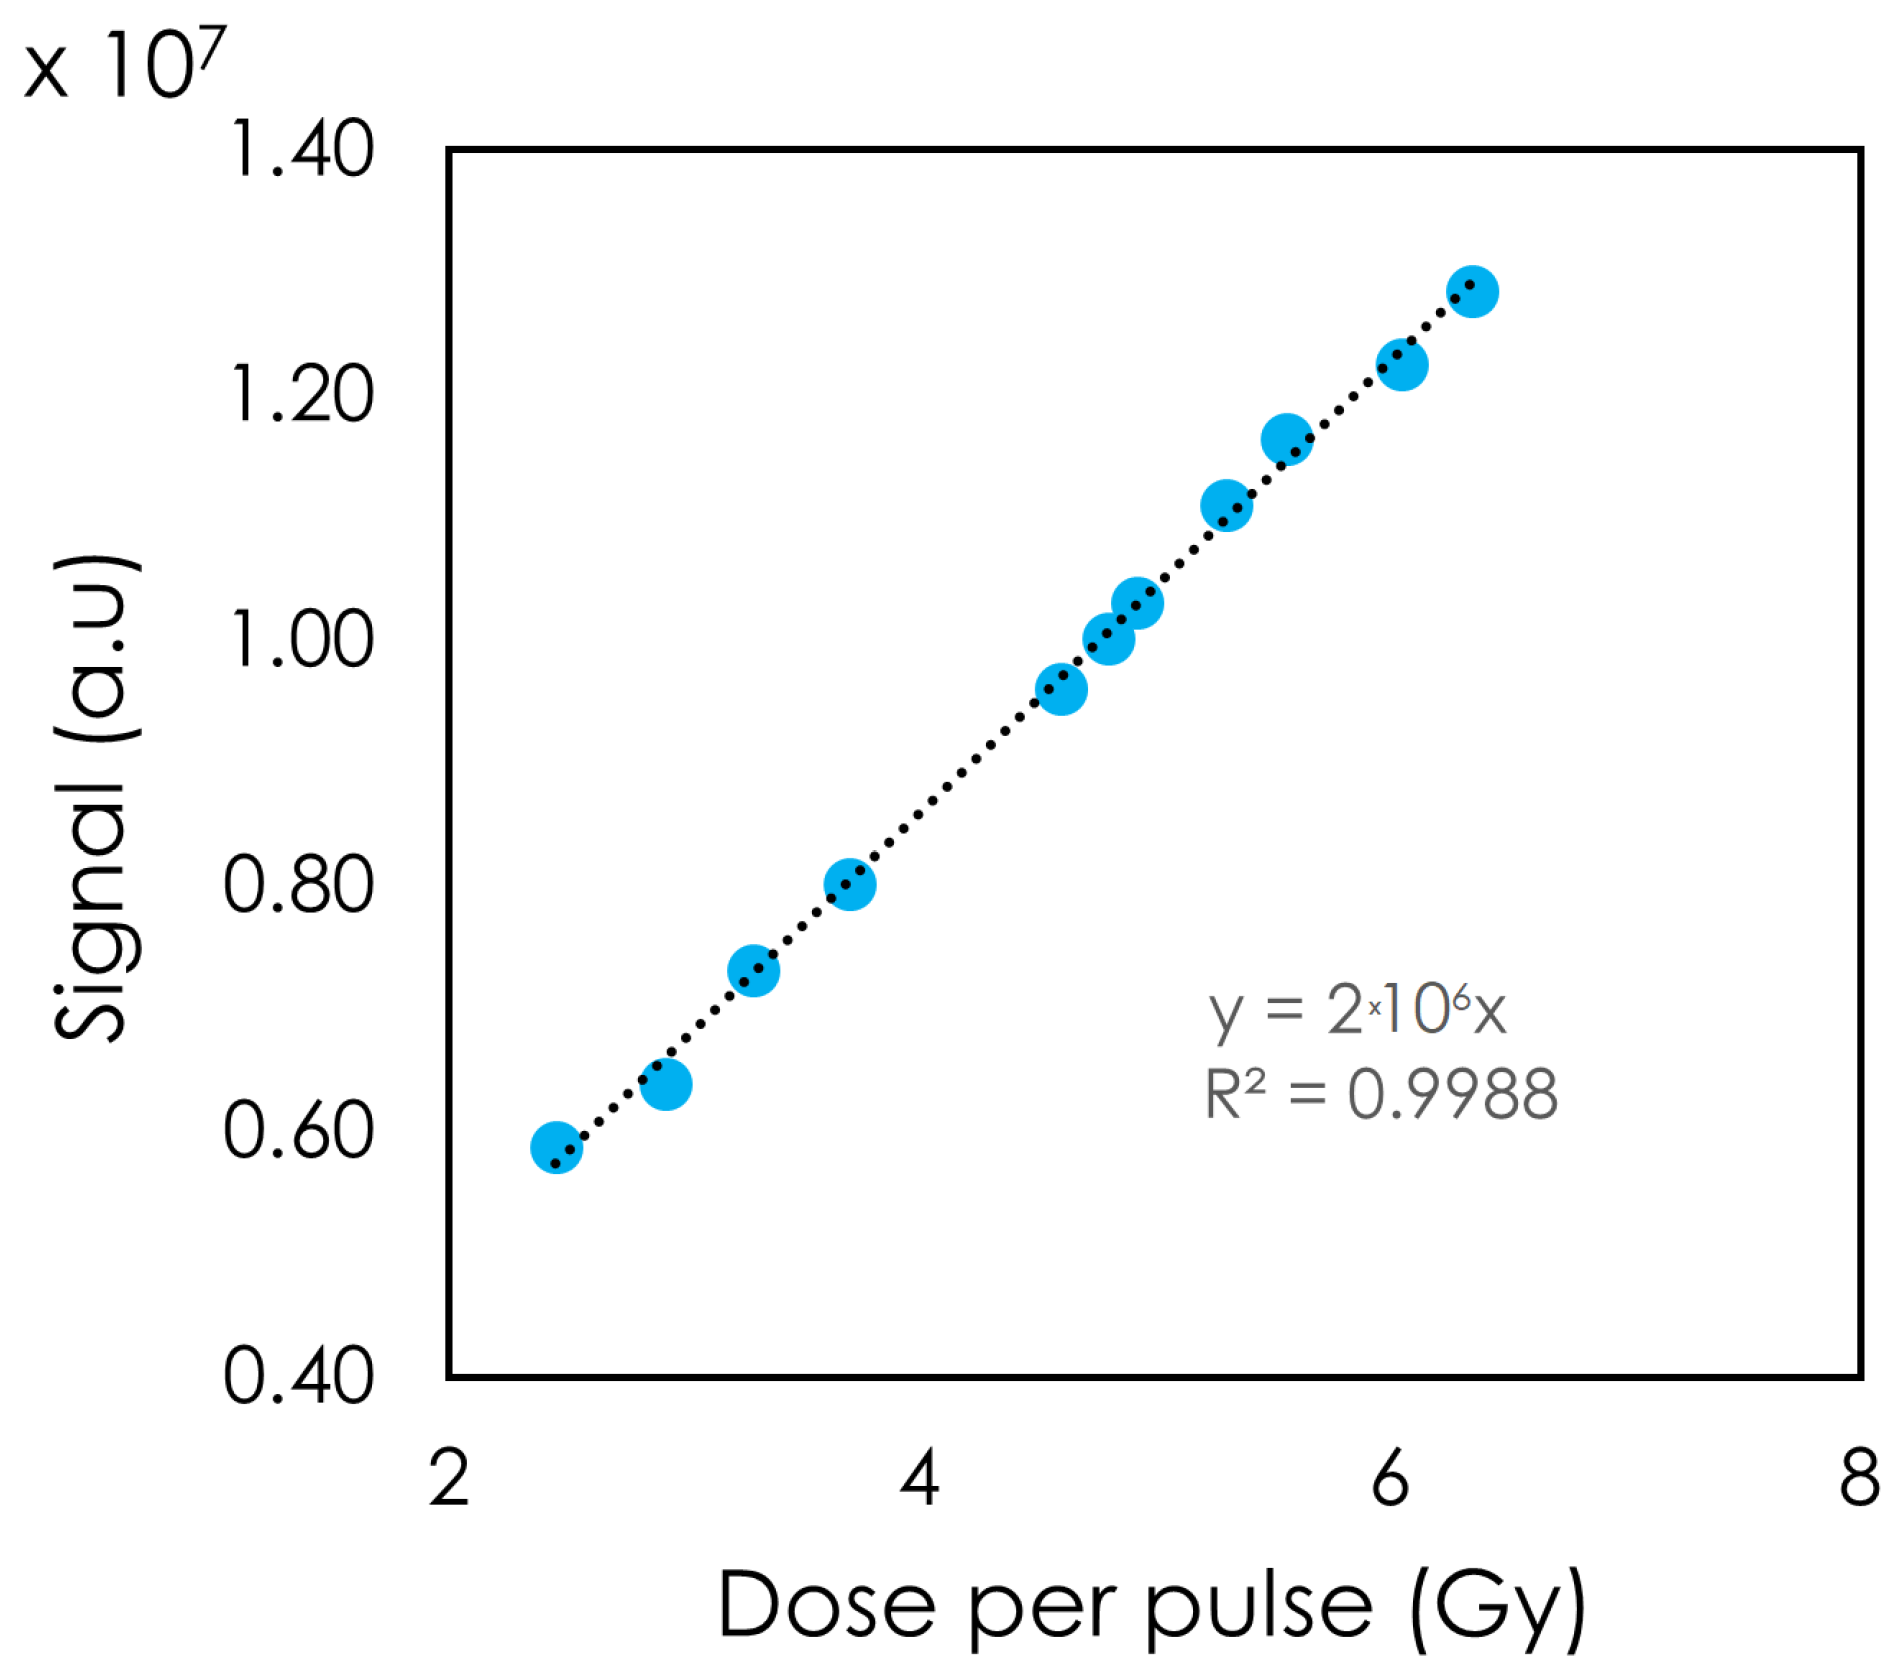
The detector’s response was also tested by varying the DPP (
Figure 5). A linear relation between the DPP and the detector’s light response was observed. DPPs of 2.45 to 6.35 Gy were achieved with a PW of 4 μs. At DPP = 2.45 Gy, the signal moved slightly away from the linear trendline.
3.1.3. PW and Instantaneous Dose Rate
In
Figure 6, the dose sensitivity is displayed as a function of PW for matched DPPs of 0.5 and 1.0 Gy. All variations in sensitivity were within ±2% for both DPP values studied. The largest variation was 1.8% at PW = 2 μs for DPP = 0.5 Gy, while at DPP = 1.0 Gy, the maximum variation of 1.4% occurred at PW = 1.2 μs. The standard deviations at DPP = 1 Gy are smaller than at DPP = 0.5 Gy. As the PW increased, the normalized sensitivity of the detector at a DPP of 1 Gy was always higher than at PW = 0.5 μs.
3.2. Scintillator Intensity and Stability
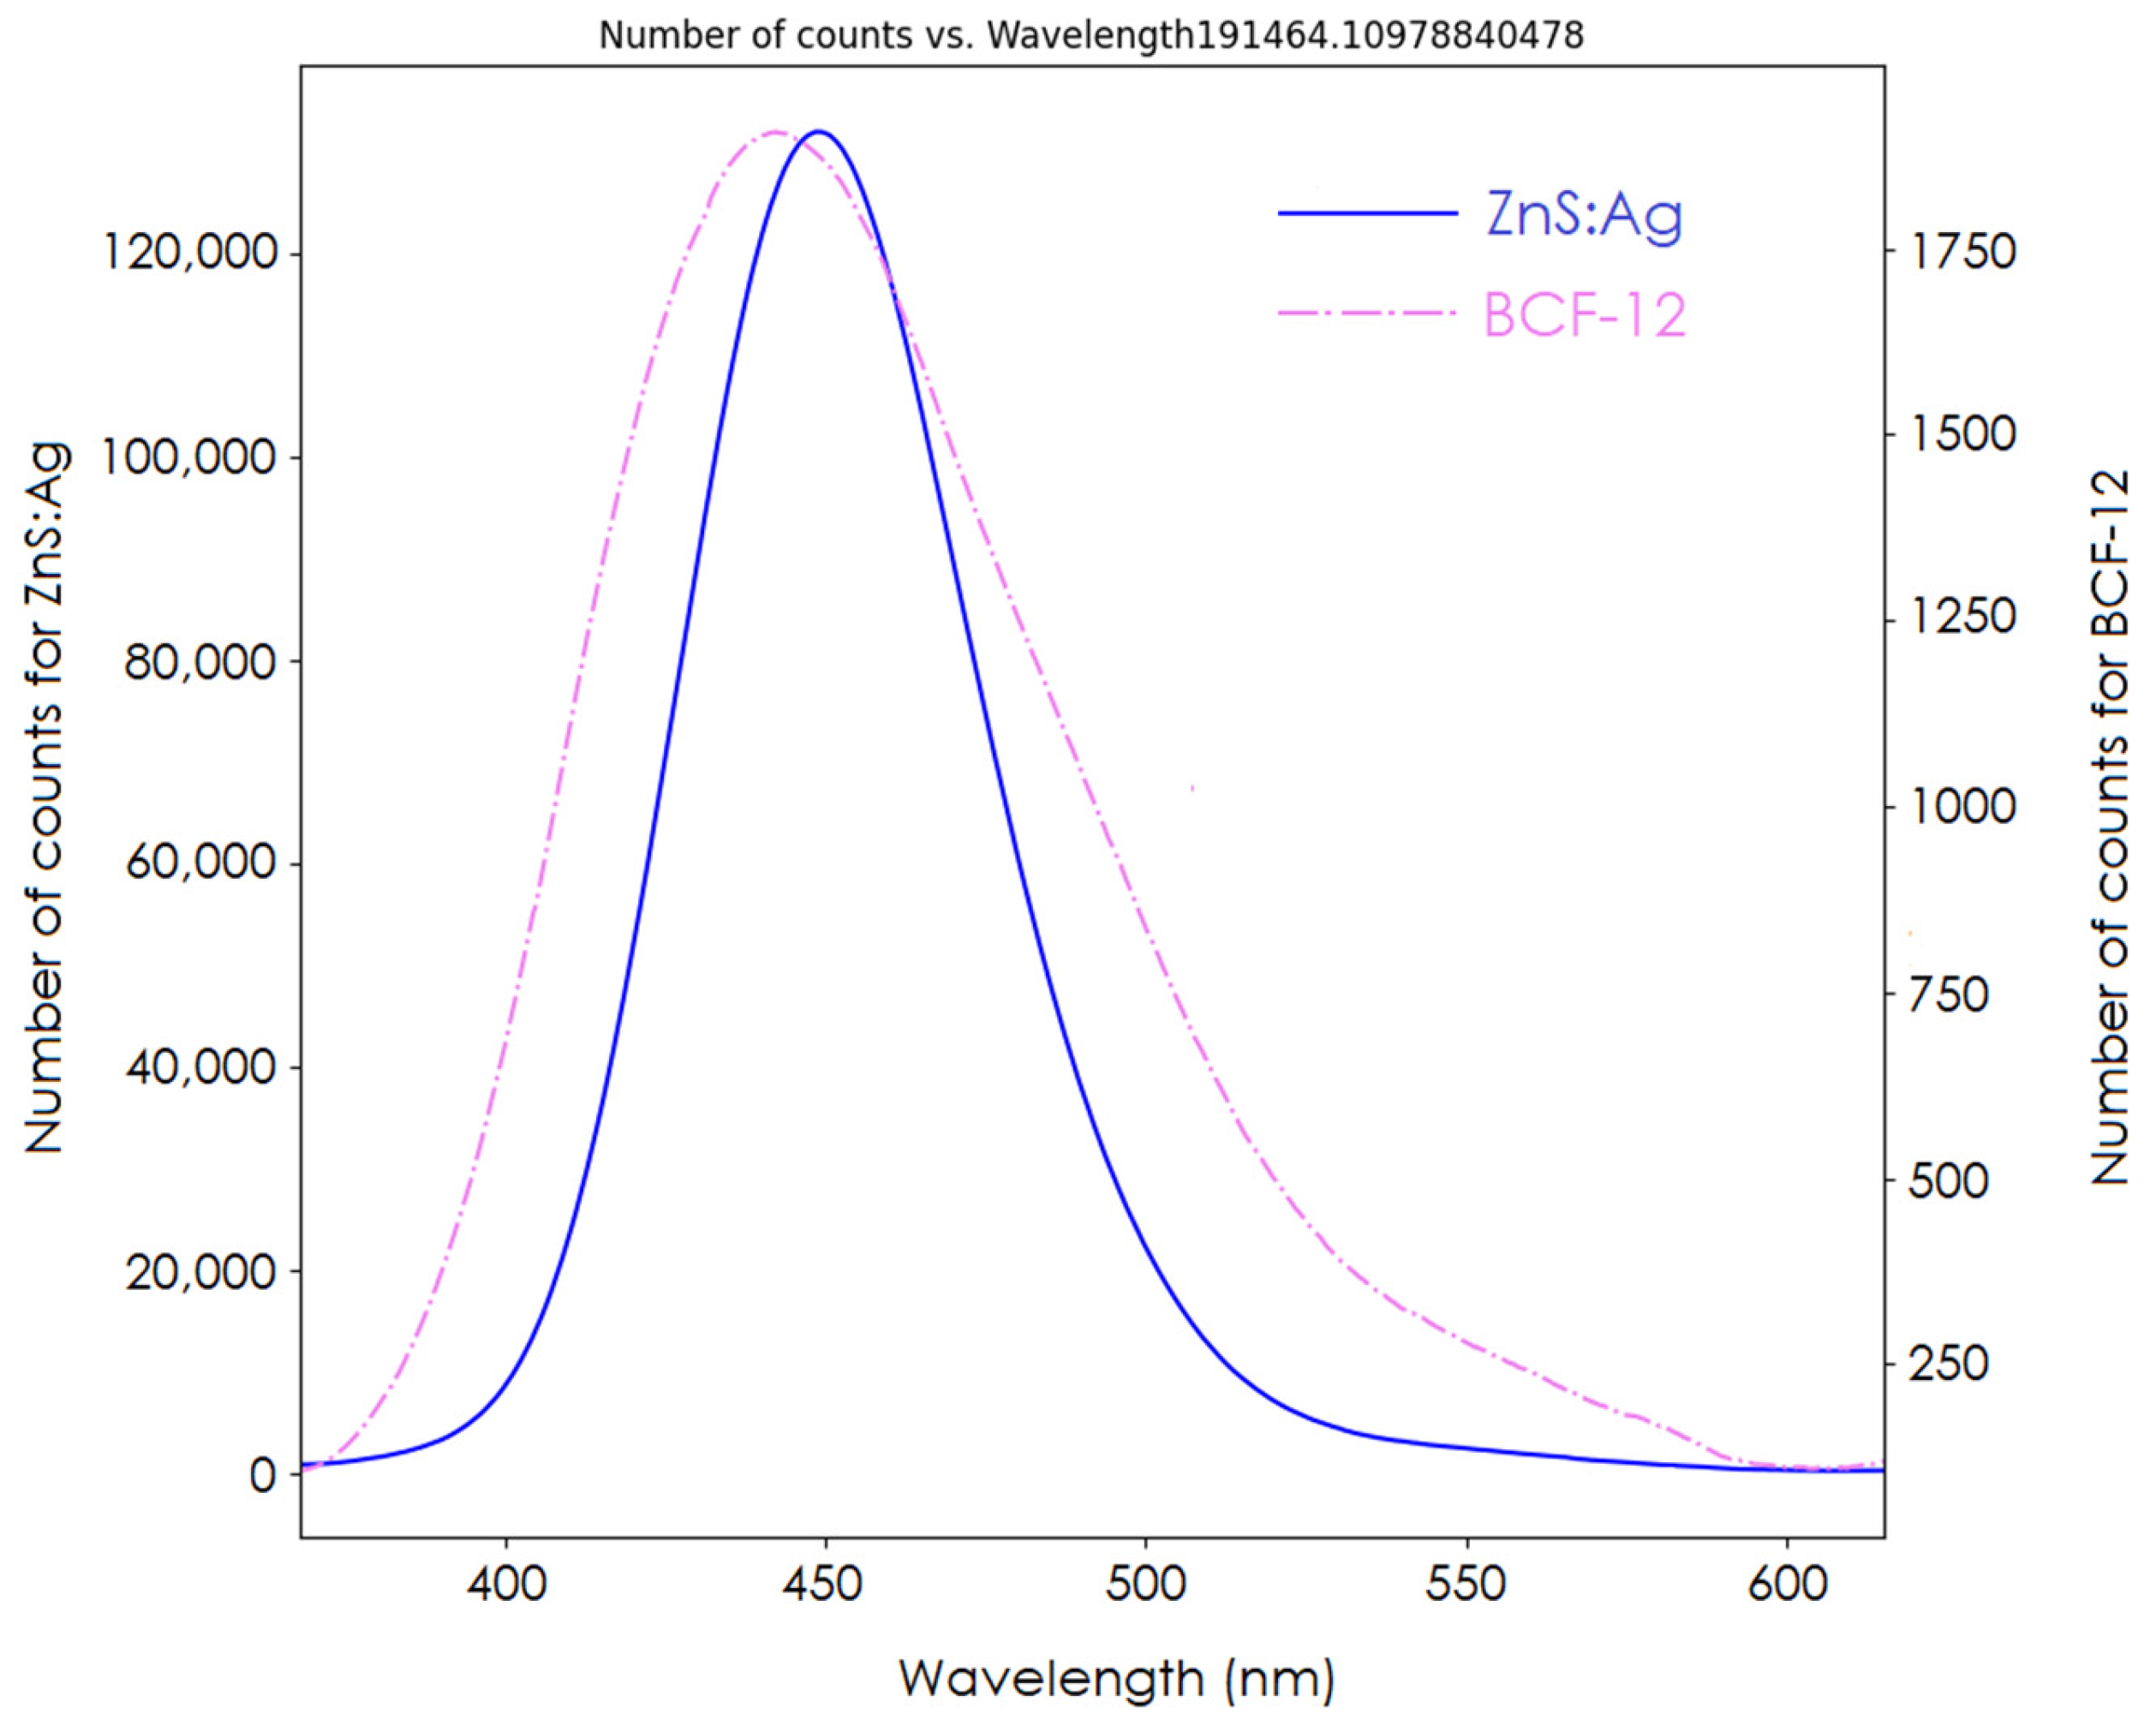
The spectrum of our detector is shown in
Figure 7. The signal ratios between the clear PMMA fiber signal and the BCF-12 and ZnS:Ag scintillators were 4.1 and 208.5, respectively. Comparison of the AUCs of both spectra showed that the inorganic ZnS:Ag scintillator had a signal yield 54 times that of the BCF-12 organic scintillator. From the acquired spectrum, the BCF-12 scintillator had an emission peak at 435 nm, shorter than that of the ZnS:Ag scintillator (450 nm).
Regarding the reproducibility of the inorganic detector,
Figure 8A displays the normalized sensitivity of the detector for all daily irradiations. The daily toroid signals are displayed in
Figure 8B. All daily measurements were confined within ±1.5%. The highest deviations found were 1.2% for the detector’s normalized signal and −1.4% for the toroid signal.
Stability measurements are presented in
Figure 9. Again, all the data points were within 1.5% of variation. We found stability of 0.83% for the inorganic detector. The standard deviation of the toroid signal was lower (0.47%) than the stability of the detector.
4. Discussion
We characterized an inorganic detector for FRT using ZnS:Ag powder as the scintillating volume. The data suggest that the ZnS:Ag detector was not dependent on the mean dose rate from 27 to 1008 Gy/s. The detector’s linearity response to the integrated dose was tested up to 180 Gy, the maximum dose that could be delivered to the detector in a single acquisition by our specific setup.
Varying the DPP via the PW or the SSD showed the detector’s linear response to dose.
Figure 4 illustrates the linearity to PW, which in our setup translated to a higher DPP and a higher integrated dose. Changing the PW did not change the instantaneous dose rate, whereas changing the SSD did. The detector showed a linear response to DPP up to 6.35 Gy. At the lowest DPP (highest SSD), the signal deviated from the linear trendline. One possible explanation for this observation is that our fields were not collimated. As a result, with a high SSD, more clear fiber was exposed. Although we expected a greater stem signal with increasing SSD, no noticeable change in the inorganic scintillator’s spectrum was observed. This can be attributed to the high signal from the scintillator compared to the stem effect.
Other scintillation detectors show signal saturation; for instance, saturation starts at 1.5 Gy for the Exradin W2 (Standard Imaging) and at 3.5 Gy for cerium-doped lutetium (LYSO) [
23,
24]. Liu et al. (2024) suspected that the saturation originates from the photodetector rather than the scintillator itself. While the actual saturation point of the scintillator is unknown for the W2 system, correction for the stem effect is necessary with this scintillator. The reproducibility of the detector was found to be similar to the Medscint detector characterized by Baikalov et al. The advantage of using an inorganic scintillator is that it does not require this correction. A slower inorganic scintillator (Al
2O
3:C,Mg) has shown a decrease in light response with increasing PRF [
25]. To avoid this PRF dependence, the scintillator needs to have a decay time shorter than the minimal inter-pulse time of the FLASH unit. In our case, the minimal inter-pulse time was 8 ms. The ZnS:Ag scintillator has a decay time of around 200 ns, which is low enough to avoid the decrease in light with increasing PRF. Di Martino et al. observed saturation with the clinical DoseVue 100 series point scintillator starting from 1 Gy/pulse [
26].
When the dose was matched for each DPP and PW by changing the SSD, the sensitivity for DPP = 1.0 Gy was always higher than at PW = 0.5 μs. All sensitivity data were still within the uncertainty of 2%, which could be attributed to general variation in the linac output. We observed that the normalized sensitivity of the detector did not depend on the instantaneous dose rate between 250 and 2000 kGy/s. In addition, the stability and the reproducibility of our detector was comparable to the long-term and short-term stability of the same linac reported by Moeckli et al. during the commissioning process [
27]. They found that the short-term stability for the 9 MeV electron beam of the Mobetron at commissioning was 0.8%, and the long-term stability over a period of 3 months was 1.7% for UHDR [
25]. Beddar (2005) reported a standard deviation of 0.9% for a 9 MeV electron beam in conventional mode with the same unit after 20 daily quality assurance trials [
28].
This study was limited by the beam parameters of the FLASH Mobetron. The limits in terms of PRF and PW were reached in this study. The beam’s energy dependency was not tested. Further tests with a wide range of beam energies will be needed for this detector because of the inorganic nature of ZnS:Ag.
5. Conclusions
In this study, we constructed a detector with an inorganic ZnS:Ag scintillator powder and characterized its dependence on different beam parameters. No dependence was found on PFR. The scintillator response was linear to the dose up to 180 Gy and to the DPP up to 6.36 Gy. This scintillator’s properties thus make it promising for the construction of detectors dedicated to UHDR beams. In addition, its powder state offers flexibility in terms of the desired shape of the detector. Future research should focus on validating the energy dependence and the radiation hardness of this scintillator.
Author Contributions
Conceptualization, D.T. and S.B.; Data curation, D.T.; Formal analysis, D.T.; Funding acquisition, S.B.; Investigation, D.T.; Methodology, D.T. and S.B.; Project administration, D.T. and S.B.; Resources, S.B.; Supervision, S.B.; Writing—original draft, D.T.; Writing—review and editing, D.T. and S.B. All authors have read and agreed to the published version of the manuscript.
Funding
This research received no external funding.
Institutional Review Board Statement
Not applicable.
Informed Consent Statement
Not applicable.
Data Availability Statement
Data are contained within the article.
Acknowledgments
We would like to thank Amy Ninetto of the Research Medical Library at MD Anderson Cancer Center for editing the manuscript.
Conflicts of Interest
The authors declare no conflicts of interest.
References
- Favaudon, V.; Caplier, L.; Monceau, V.; Pouzoulet, F.; Sayarath, M.; Fouillade, C.; Poupon, M.F.; Brito, I.; Hupe, P.; Bourhis, J.; et al. Ultrahigh dose-rate FLASH irradiation increases the differential response between normal and tumor tissue in mice. Sci. Transl. Med. 2014, 6, 245ra93. [Google Scholar] [CrossRef]
- Valdes Zayas, A.; Kumari, N.; Liu, K.; Neill, D.; Delahoussaye, A.; Goncalves Jorge, P.; Geyer, R.; Lin, S.H.; Bailat, C.; Bochud, F.; et al. Independent Reproduction of the FLASH Effect on the Gastrointestinal Tract: A Multi-Institutional Comparative Study. Cancers 2023, 15, 2121. [Google Scholar] [CrossRef] [PubMed]
- Natarajan, S.; Levy, K.; Wang, J.H.; Chow, S.; Eggold, J.; Loo, P.; Manjappa, R.; Lartey, F.M.; Schüler, E.; Skinner, L.; et al. FLASH irradiation enhances the therapeutic index of abdominal radiotherapy in mice. Cancer Res. 2020, 80, 5351. [Google Scholar] [CrossRef]
- Levy, K.; Natarajan, S.; Wang, J.; Chow, S.; Eggold, J.T.; Loo, P.E.; Manjappa, R.; Melemenidis, S.; Lartey, F.M.; Schuler, E.; et al. Abdominal FLASH irradiation reduces radiation-induced gastrointestinal toxicity for the treatment of ovarian cancer in mice. Sci. Rep. 2020, 10, 21600. [Google Scholar] [CrossRef] [PubMed]
- Bourhis, J.; Montay-Gruel, P.; Jorge, P.G.; Bailat, C.; Petit, B.; Ollivier, J.; Jeanneret-Sozzi, W.; Ozsahin, M.; Bochud, F.; Moeckli, R.; et al. Clinical translation of FLASH radiotherapy: Why and how? Radiother. Oncol. 2019, 139, 11–17. [Google Scholar] [CrossRef]
- Montay-Gruel, P.; Petersson, K.; Jaccard, M.; Boivin, G.; Germond, J.F.; Petit, B.; Doenlen, R.; Favaudon, V.; Bochud, F.; Bailat, C.; et al. Irradiation in a flash: Unique sparing of memory in mice after whole brain irradiation with dose rates above 100 Gy/s. Radiother. Oncol. 2017, 124, 365–369. [Google Scholar] [CrossRef]
- Liu, K.; Palmiero, A.; Chopra, N.; Velasquez, B.; Li, Z.; Beddar, S.; Schüler, E. Dual beam-current transformer design for monitoring and reporting of electron ultra-high dose rate (FLASH) beam parameters. J. Appl. Clin. Med. Phys. 2023, 24, e13891. [Google Scholar] [CrossRef]
- Kranzer, R.; Poppinga, D.; Weidner, J.; Schüller, A.; Hackel, T.; Looe, H.K.; Poppe, B. Ion collection efficiency of ionization chambers in ultra-high dose-per-pulse electron beams. Med. Phys. 2021, 48, 819–830. [Google Scholar] [CrossRef] [PubMed]
- McManus, M.; Romano, F.; Lee, N.D.; Farabolini, W.; Gilardi, A.; Royle, G.; Palmans, H.; Subiel, A. The challenge of ionisation chamber dosimetry in ultra-short pulsed high dose-rate Very High Energy Electron beams. Sci. Rep. 2020, 10, 9089. [Google Scholar] [CrossRef]
- Hart, A.; Giguère, C.; Bateman, J.; Korysko, P.; Farabolini, W.; Rieker, V.; Esplen, N.; Corsini, R.; Dosanjh, M.; Beaulieu, L.; et al. Plastic scintillator dosimetry of ultrahigh dose-rate 200 MeV electrons at CLEAR. IEEE Sens. J. 2024, 24, 14229–14237. [Google Scholar] [CrossRef]
- Subiel, A.; Romano, F. Recent developments in absolute dosimetry for FLASH radiotherapy. Brit J. Radiol. 2023, 96, 20220560. [Google Scholar] [CrossRef]
- Petersson, K.; Jaccard, M.; Germond, J.-F.; Buchillier, T.; Bochud, F.; Bourhis, J.; Vozenin, M.-C.; Bailat, C. High dose-per-pulse electron beam dosimetry—A model to correct for the ion recombination in the Advanced Markus ionization chamber. Med. Phys. 2017, 44, 1157–1167. [Google Scholar] [CrossRef] [PubMed]
- Beddar, A.S.; Mackie, T.R.; Attix, F.H. Water-equivalent plastic scintillation detectors for high-energy beam dosimetry: I. Physical characteristics and theoretical consideration. Phys. Med. Biol. 1992, 37, 1883–1900. [Google Scholar] [CrossRef] [PubMed]
- Beddar, A.S.; Mackie, T.R.; Attix, F.H. Water-Equivalent Plastic Scintillation Detectors for High-Energy Beam Dosimetry: 2. Properties and Measurements. Phys. Med. Biol. 1992, 37, 1901–1913. [Google Scholar] [CrossRef] [PubMed]
- Thrower, S.; Prajapati, S.; Holmes, S.; Schüler, E.; Beddar, S. Characterization of the Plastic Scintillator Detector System Exradin W2 in a High Dose Rate Flattening-Filter-Free Photon Beam. Sensors 2022, 22, 6785. [Google Scholar] [CrossRef]
- Carrasco, P.; Jornet, N.; Jordi, O.; Lizondo, M.; Latorre-Musoll, A.; Eudaldo, T.; Ruiz, A.; Ribas, M. Characterization of the Exradin W1 scintillator for use in radiotherapy. Med. Phys. 2015, 42, 297–304. [Google Scholar] [CrossRef] [PubMed]
- Galavis, P.E.; Hu, L.; Holmes, S.; Das, I.J. Characterization of the plastic scintillation detector Exradin W2 for small field dosimetry. Med. Phys. 2019, 46, 2468–2476. [Google Scholar] [CrossRef]
- Dimitriadis, A.; Patallo, I.S.; Billas, I.; Duane, S.; Nisbet, A.; Clark, C.H. Characterisation of a plastic scintillation detector to be used in a multicentre stereotactic radiosurgery dosimetry audit. Radiat. Phys. Chem. 2017, 140, 373–378. [Google Scholar] [CrossRef]
- Jacqmin, D.J.; Miller, J.R.; Barraclough, B.A.; Labby, Z.E. Commissioning an Exradin W2 plastic scintillation detector for clinical use in small radiation fields. J. Appl. Clin. Med. Phys. 2022, 23, e13728. [Google Scholar] [CrossRef] [PubMed]
- Yanagida, T.; Kato, T.; Nakauchi, D.; Kawaguchi, N. Fundamental aspects, recent progress and future prospects of inorganic scintillators. Jpn. J. Appl. Phys. 2023, 62, 010508. [Google Scholar] [CrossRef]
- Palmiero, A.; Liu, K.; Colnot, J.; Chopra, N.; Neill, D.; Connell, L.; Velasquez, B.; Koong, A.C.; Lin, S.H.; Balter, P.; et al. On the acceptance, commissioning, and quality assurance of electron FLASH units. Med. Phys. 2024. [Google Scholar] [CrossRef] [PubMed]
- Baikalov, A.; Tho, D.; Liu, K.; Bartzsch, S.; Beddar, S.; Schüler, E. Characterization of a novel time-resolved, real-time scintillation dosimetry system for ultra-high dose rate radiation therapy applications. arXiv 2024, arXiv:2403.03142v1. [Google Scholar]
- Liu, K.; Holmes, S.; Schüler, E.; Beddar, S. A comprehensive investigation of the performance of a commercial scintillator system for applications in electron FLASH radiotherapy. Med. Phys. 2024, 51, 4504–4512. [Google Scholar] [CrossRef] [PubMed]
- Morrocchi, M.; Pensavalle, J.H.; Ciarrocchi, E.; Di Martino, F.; Felici, G.; Galante, F.; Gasparini, A.; Grasso, L.; Linsalata, S.; Massa, M.; et al. Experimental characterization and Monte Carlo simulation of scintillator detectors in online electron FLASH radiotherapy dosimetry. J. Instrum. 2022, 17, P09005. [Google Scholar] [CrossRef]
- Vanreusel, V.; Gasparini, A.; Galante, F.; Mariani, G.; Pacitti, M.; Cociorb, M.; Giammanco, A.; Reniers, B.; Reulens, N.; Shonde, T.B.; et al. Point scintillator dosimetry in ultra-high dose rate electron "FLASH" radiation therapy: A first characterization. Phys. Med. 2022, 103, 127–137. [Google Scholar] [CrossRef]
- Di Martino, F.; Barca, P.; Barone, S.; Bortoli, E.; Borgheresi, R.; De Stefano, S.; Di Francesco, M.; Faillace, L.; Giuliano, L.; Grasso, L.; et al. FLASH Radiotherapy With Electrons: Issues Related to the Production, Monitoring, and Dosimetric Characterization of the Beam. Front. Phys. 2020, 8, 570697. [Google Scholar] [CrossRef]
- Moeckli, R.; Gonçalves Jorge, P.; Grilj, V.; Oesterle, R.; Cherbuin, N.; Bourhis, J.; Vozenin, M.C.; Germond, J.F.; Bochud, F.; Bailat, C. Commissioning of an ultra-high dose rate pulsed electron beam medical LINAC for FLASH RT preclinical animal experiments and future clinical human protocols. Med. Phys. 2021, 48, 3134–3142. [Google Scholar] [CrossRef] [PubMed]
- Beddar, A.S. Stability of a mobile electron linear accelerator system for intraoperative radiation therapy. Med. Phys. 2005, 32, 3128–3131. [Google Scholar] [CrossRef]
| Disclaimer/Publisher’s Note: The statements, opinions and data contained in all publications are solely those of the individual author(s) and contributor(s) and not of MDPI and/or the editor(s). MDPI and/or the editor(s) disclaim responsibility for any injury to people or property resulting from any ideas, methods, instructions or products referred to in the content. |
© 2024 by the authors. Licensee MDPI, Basel, Switzerland. This article is an open access article distributed under the terms and conditions of the Creative Commons Attribution (CC BY) license (https://creativecommons.org/licenses/by/4.0/).


