
Damage Localization and Severity Assessment in Composite Structures Using Deep Learning Based on Lamb Waves

 ,
,  , ,
, , 

Abstract
1. Introduction
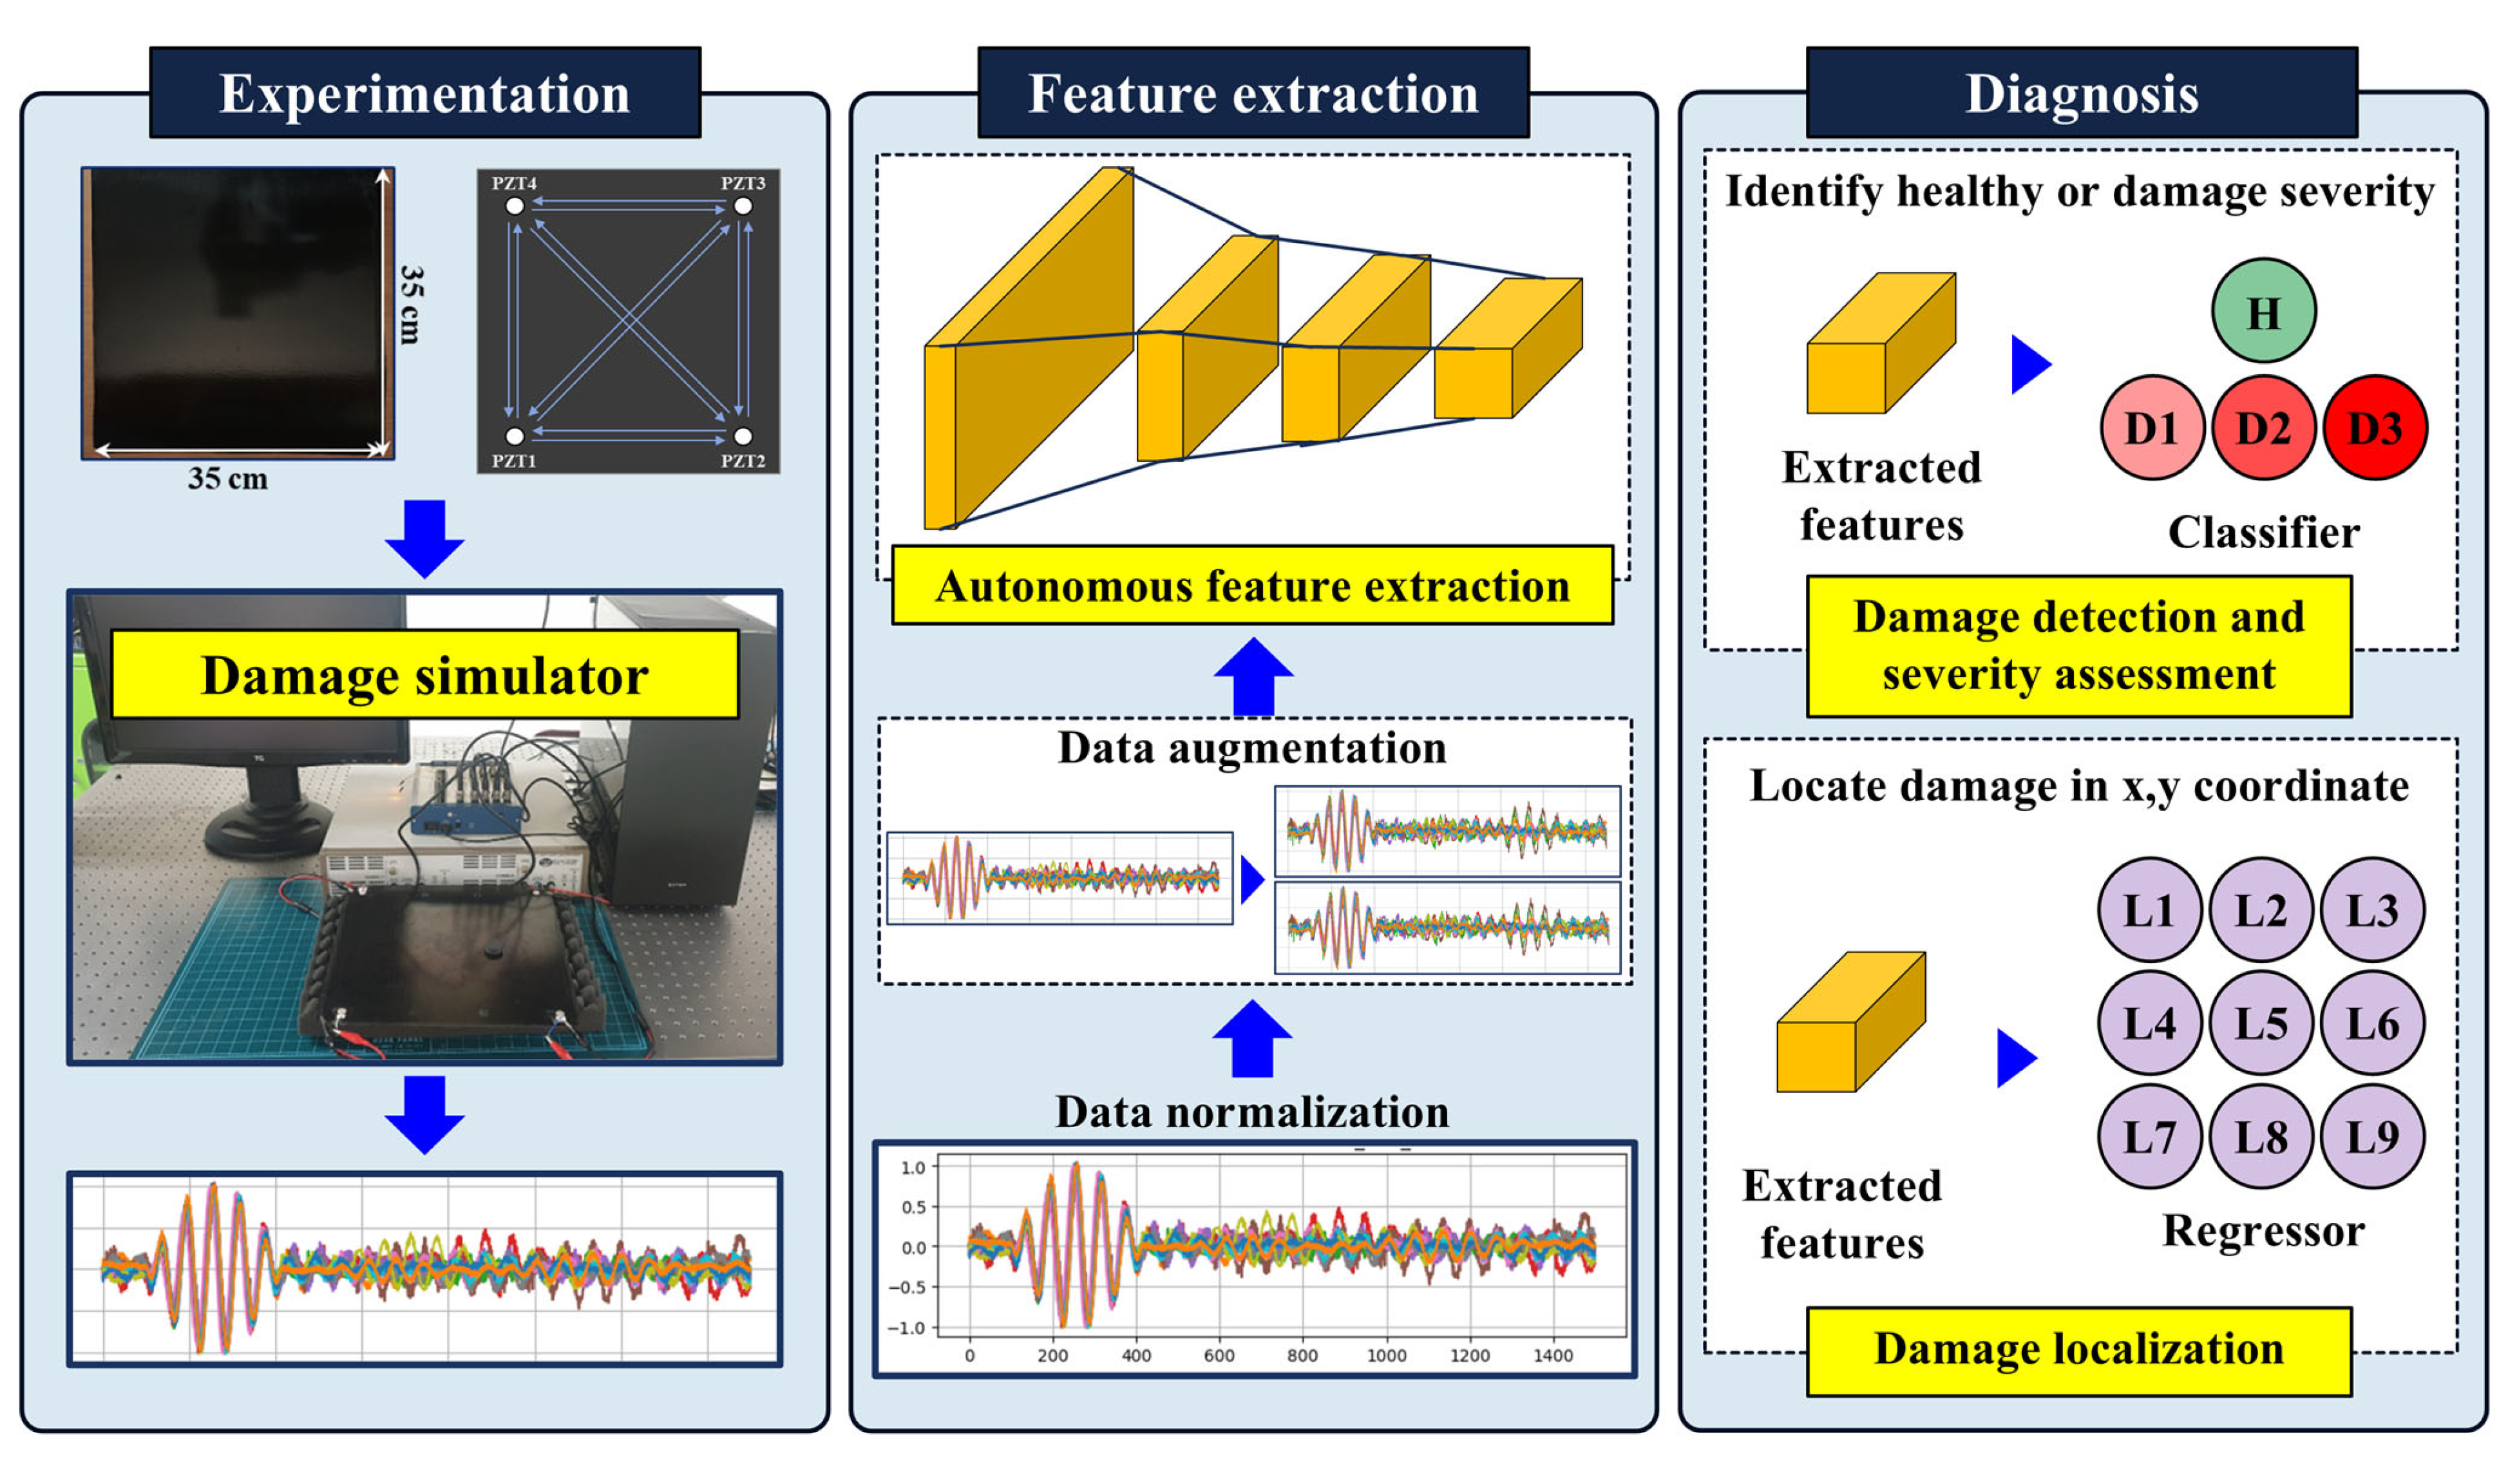
2. Methods
2.1. Experimentation
2.1.1. Composite Fabrication
2.1.2. Lamb Wave Testing
2.2. Data Pre-Processing
2.2.1. Data Normalization
2.2.2. Data Augmentation
2.3. Deep Learning
2.3.1. Artificial Neural Networks

2.3.2. Convolutional Neural Network
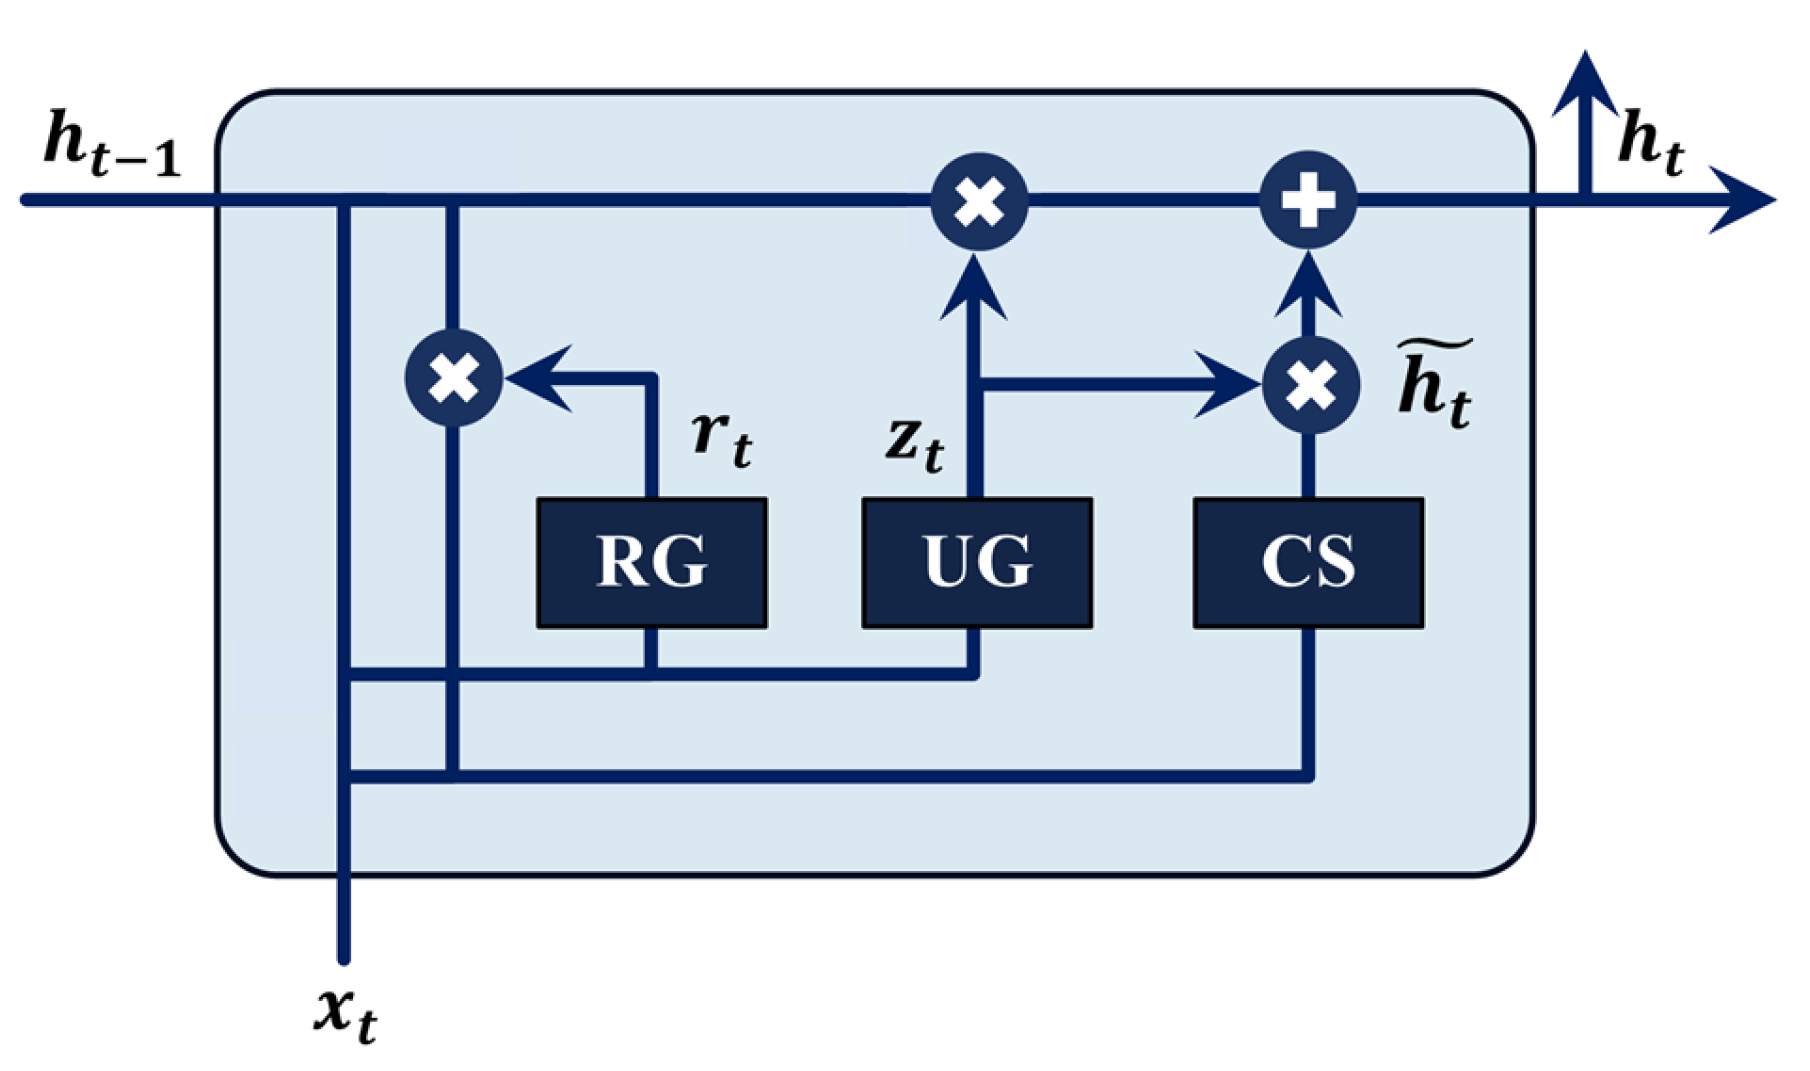
2.3.3. Gated Recurrent Unit
3. Results and Discussion
3.1. Damage Detection and Severity Assessment
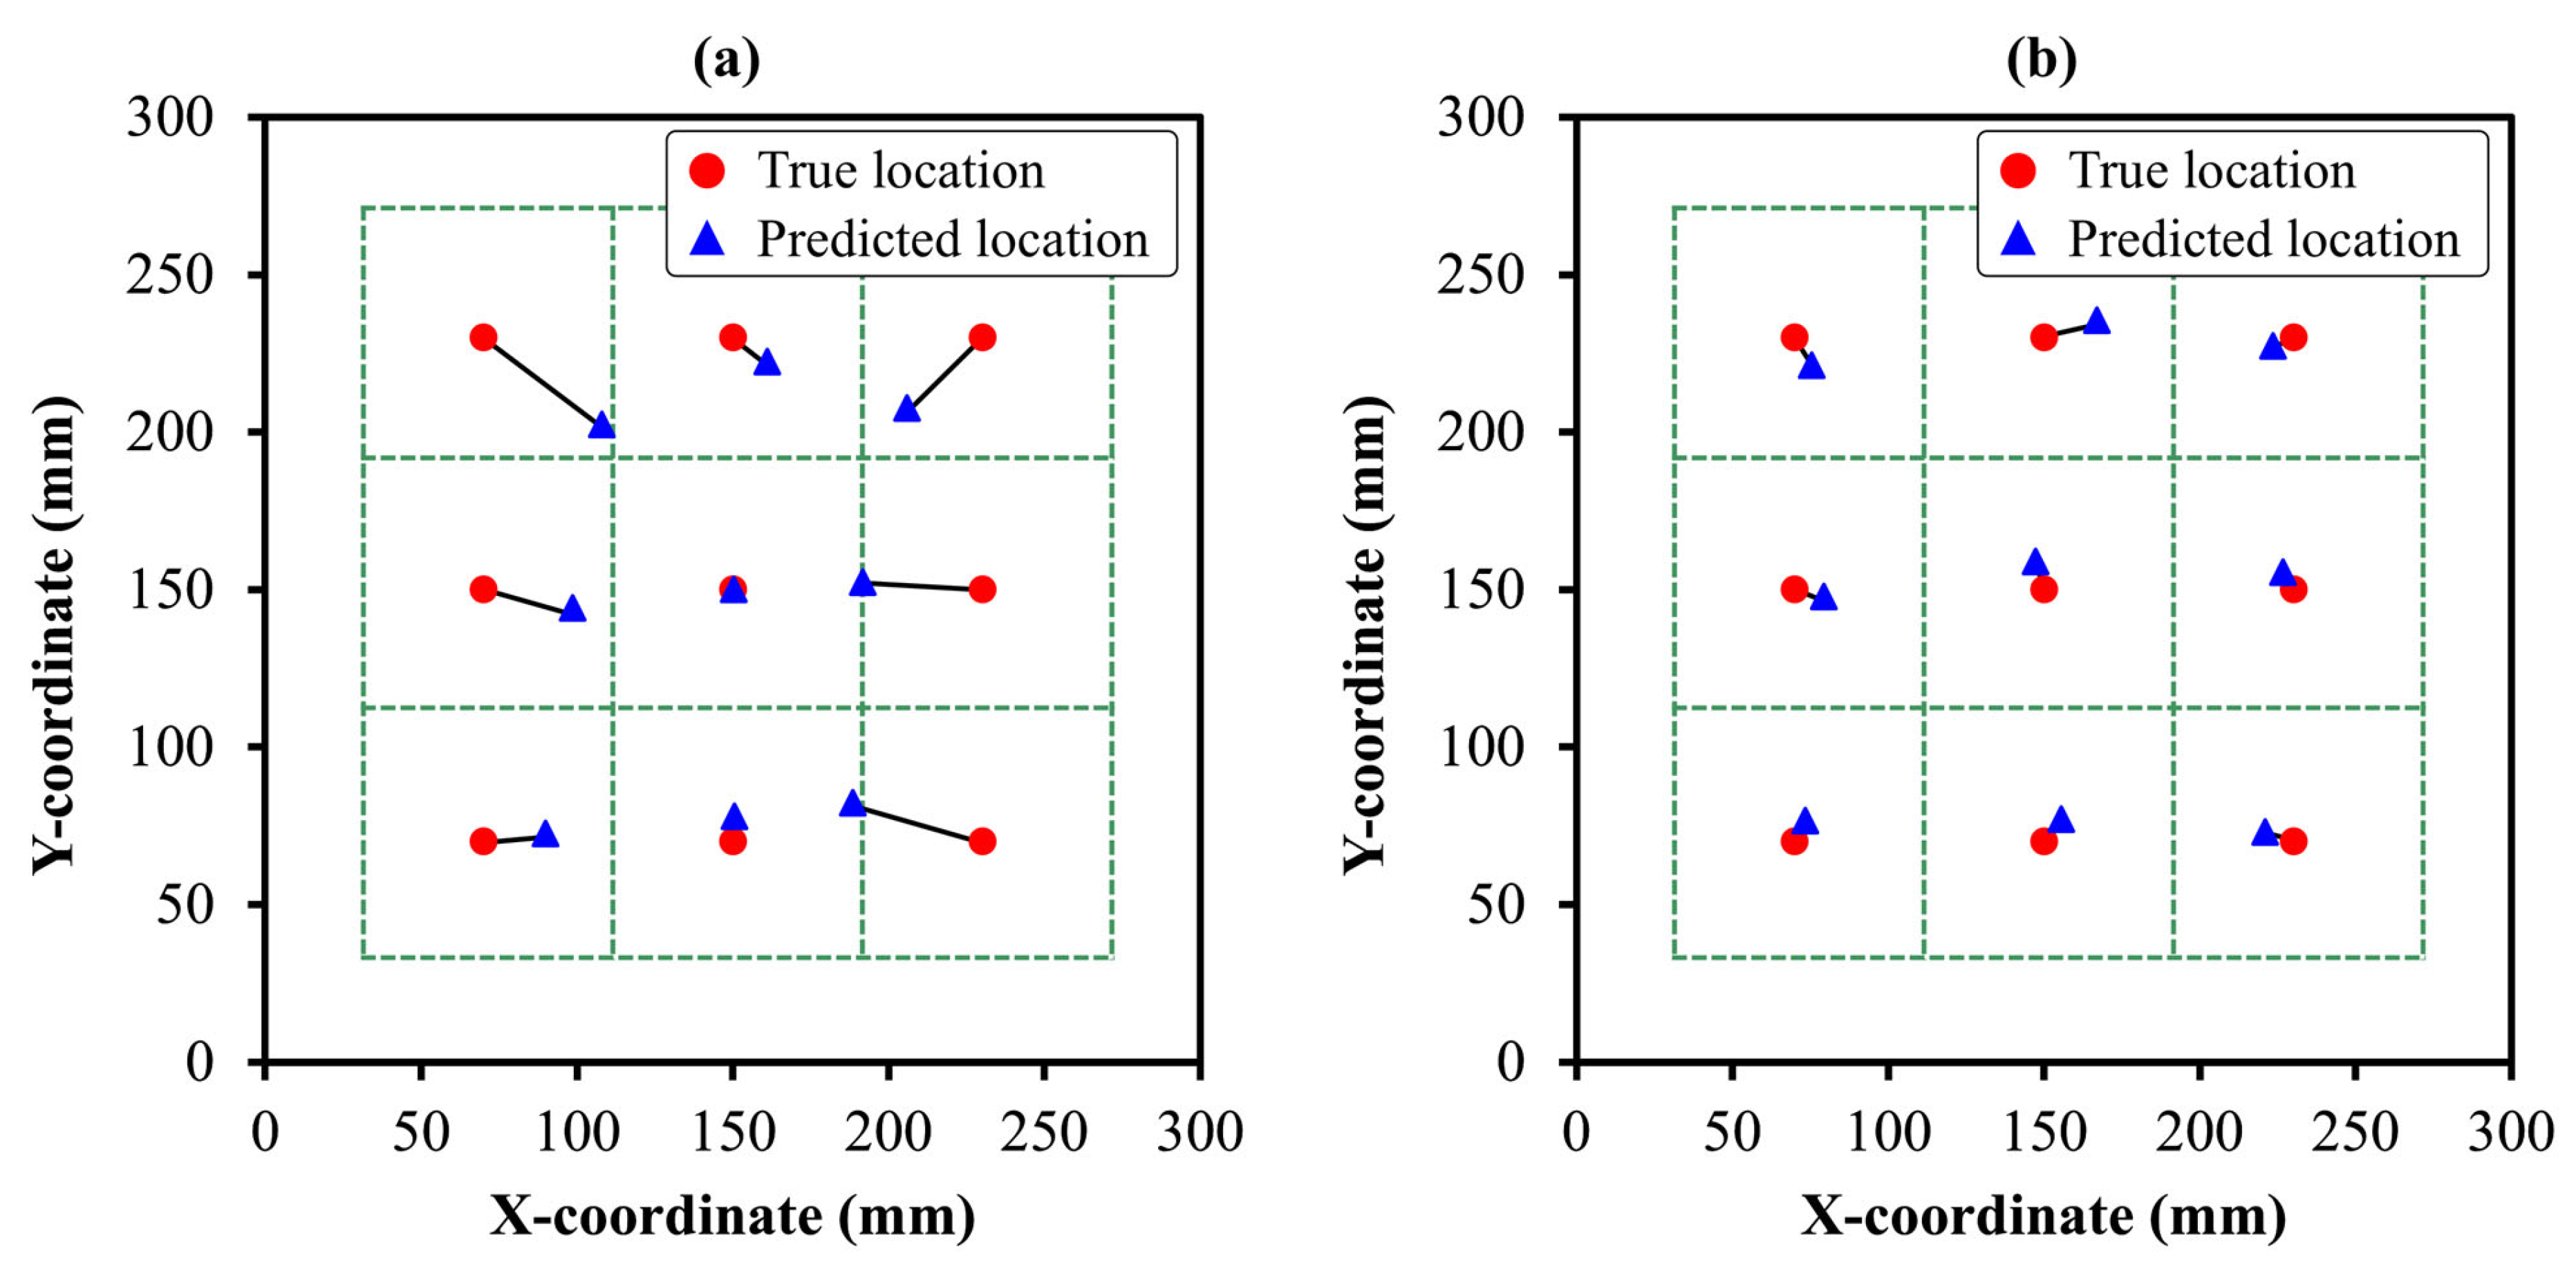
3.2. Damage Localization
4. Conclusions
Author Contributions
Funding
Institutional Review Board Statement
Informed Consent Statement
Data Availability Statement
Conflicts of Interest
References
- Galos, J. Thin-Ply Composite Laminates: A Review. Compos. Struct. 2020, 236, 111920. [Google Scholar] [CrossRef]
- An, H.; Zhang, Y.; Deng, Q.; Long, T.; Youn, B.D.; Kim, H.S. Integrated Optimization of Ply Number, Layer Thickness, and Fiber Angle for Variable-Stiffness Composites Using Dynamic Multi-Fidelity Surrogate Model. Thin-Walled Struct. 2025, 206, 112392. [Google Scholar] [CrossRef]
- Thionnet, A.; Chou, H.Y.; Bunsell, A. Fibre Break Processes in Unidirectional Composites. Compos. Part A Appl. Sci. Manuf. 2014, 65, 148–160. [Google Scholar] [CrossRef]
- Xu, X.; Liu, C. Physics-Guided Deep Learning for Damage Detection in CFRP Composite Structures. Compos. Struct. 2024, 331, 117889. [Google Scholar] [CrossRef]
- Duchene, P.; Chaki, S.; Ayadi, A.; Krawczak, P. A Review of Non-Destructive Techniques Used for Mechanical Damage Assessment in Polymer Composites. J. Mater. Sci. 2018, 53, 7915–7938. [Google Scholar] [CrossRef]
- Segers, J.; Hedayatrasa, S.; Poelman, G.; Van Paepegem, W.; Kersemans, M. Nonlinear Local Wave-Direction Estimation for in-Sight and out-of-Sight Damage Localization in Composite Plates. NDT E Int. 2021, 119, 102412. [Google Scholar] [CrossRef]
- Hu, Y.; Zhu, Y.; Tu, X.; Lu, J.; Li, F. Dispersion Curve Analysis Method for Lamb Wave Mode Separation. Struct. Health Monit. 2020, 19, 1590–1601. [Google Scholar] [CrossRef]
- Pasquali, M.; Lacarbonara, W. Delamination Detection in Composite Laminates Using High-Frequency P- and S-Waves—Part I: Theory and Analysis. Compos. Struct. 2015, 134, 1095–1108. [Google Scholar] [CrossRef]
- Wilson, C.L.; Chang, F.K. Monitoring Fatigue-Induced Transverse Matrix Cracks in Laminated Composites Using Built-in Acousto-Ultrasonic Techniques. Struct. Health Monit. 2016, 15, 335–350. [Google Scholar] [CrossRef]
- Yang, Z.; Ren, Y.; Shi, Q.; Cui, D.; Liu, J. Detection of Debonding Defects in Carbon Fiber-Reinforced Polymer (CFRP)–Rubber Bonded Structures Based on Active Lamb Wave Energy Analysis. Sensors 2024, 24, 5567. [Google Scholar] [CrossRef]
- Bellam Muralidhar, N.K.; Gräßle, C.; Rauter, N.; Mikhaylenko, A.; Lammering, R.; Lorenz, D.A. Damage Identification in Fiber Metal Laminates Using Bayesian Analysis with Model Order Reduction. Comput. Methods Appl. Mech. Eng. 2023, 403, 115737. [Google Scholar] [CrossRef]
- Yang, B.; Xuan, F.-Z.; Xiang, Y.; Li, D.; Zhu, W.; Tang, X.; Xu, J.; Yang, K.; Luo, C. Lamb Wave-Based Structural Health Monitoring on Composite Bolted Joints under Tensile Load. Materials 2017, 10, 652. [Google Scholar] [CrossRef] [PubMed]
- Hua, J.; Lin, J.; Zeng, L. High-Resolution Damage Detection Based on Local Signal Difference Coefficient Model. Struct. Health Monit. 2015, 14, 20–34. [Google Scholar] [CrossRef]
- Gao, F.; Shao, Y.; Hua, J.; Zeng, L.; Lin, J. Enhanced Wavefield Imaging Method for Impact Damage Detection in Composite Laminates via Laser-Generated Lamb Waves. Measurement 2021, 173, 108639. [Google Scholar] [CrossRef]
- Xiao, F.; Mao, Y.; Tian, G.; Chen, G.S. Partial-Model-Based Damage Identification of Long-Span Steel Truss Bridge Based on Stiffness Separation Method. Struct. Control Health Monit. 2024, 2024, 5530300. [Google Scholar] [CrossRef]
- Azad, M.M.; Cheon, Y.; Raouf, I.; Khalid, S.; Kim, H.S. Intelligent Computational Methods for Damage Detection of Laminated Composite Structures for Mobility Applications: A Comprehensive Review. Arch. Comput. Methods Eng. 2024, 1–29. [Google Scholar] [CrossRef]
- Azad, M.M.; Rehman Shah, A.U.; Prabhakar, M.N.; Kim, H.S. Deep Learning-Based Fracture Mode Determination in Composite Laminates. J. Comput. Struct. Eng. Inst. Korea 2024, 37, 225–232. [Google Scholar] [CrossRef]
- Wu, J.; Xu, X.; Liu, C.; Deng, C.; Shao, X. Lamb Wave-Based Damage Detection of Composite Structures Using Deep Convolutional Neural Network and Continuous Wavelet Transform. Compos. Struct. 2021, 276, 114590. [Google Scholar] [CrossRef]
- Lee, H.; Lim, H.J.; Skinner, T.; Chattopadhyay, A.; Hall, A. Automated Fatigue Damage Detection and Classification Technique for Composite Structures Using Lamb Waves and Deep Autoencoder. Mech. Syst. Signal Process. 2022, 163, 108148. [Google Scholar] [CrossRef]
- Tran-Ngoc, H.; Khatir, S.; Ho-Khac, H.; De Roeck, G.; Bui-Tien, T.; Abdel Wahab, M. Efficient Artificial Neural Networks Based on a Hybrid Metaheuristic Optimization Algorithm for Damage Detection in Laminated Composite Structures. Compos. Struct. 2021, 262, 113339. [Google Scholar] [CrossRef]
- Zara, A.; Belaidi, I.; Khatir, S.; Oulad Brahim, A.; Boutchicha, D.; Abdel Wahab, M. Damage Detection in GFRP Composite Structures by Improved Artificial Neural Network Using New Optimization Techniques. Compos. Struct. 2023, 305, 116475. [Google Scholar] [CrossRef]
- Corbetta, M.; Sbarufatti, C.; Giglio, M.; Saxena, A.; Goebel, K. A Bayesian Framework for Fatigue Life Prediction of Composite Laminates under Co-Existing Matrix Cracks and Delamination. Compos. Struct. 2018, 187, 58–70. [Google Scholar] [CrossRef]
- Cantero-Chinchilla, S.; Chiachío, J.; Chiachío, M.; Chronopoulos, D.; Jones, A. A Robust Bayesian Methodology for Damage Localization in Plate-like Structures Using Ultrasonic Guided-Waves. Mech. Syst. Signal Process. 2019, 122, 192–205. [Google Scholar] [CrossRef]
- Doan, D.D.; Ramasso, E.; Placet, V.; Zhang, S.; Boubakar, L.; Zerhouni, N. An Unsupervised Pattern Recognition Approach for AE Data Originating from Fatigue Tests on Polymer–Composite Materials. Mech. Syst. Signal Process. 2015, 64–65, 465–478. [Google Scholar] [CrossRef]
- Vo-Duy, T.; Ho-Huu, V.; Dang-Trung, H.; Nguyen-Thoi, T. A Two-Step Approach for Damage Detection in Laminated Composite Structures Using Modal Strain Energy Method and an Improved Differential Evolution Algorithm. Compos. Struct. 2016, 147, 42–53. [Google Scholar] [CrossRef]
- Lu, S.; Jiang, M.; Jia, L.; Sui, Q.; Sai, Y. CFRP Damage Identification System Based on FBG Sensors and ELM Method. Opt. Rev. 2015, 22, 46–51. [Google Scholar] [CrossRef]
- An, H.; Youn, B.D.; Kim, H.S. A Methodology for Sensor Number and Placement Optimization for Vibration-Based Damage Detection of Composite Structures under Model Uncertainty. Compos. Struct. 2022, 279, 114863. [Google Scholar] [CrossRef]
- Zhuang, L.; Luo, K.; Yang, Z. A Multimodal Gated Recurrent Unit Neural Network Model for Damage Assessment in CFRP Composites Based on Lamb Waves and Minimal Sensing. IEEE Trans. Instrum. Meas. 2024, 73, 3506911. [Google Scholar] [CrossRef]
- Soman, R.; Ostachowicz, W. Kalman Filter Based Neutral Axis Tracking for Damage Detection in Composites Structures under Changing Axial Loading Conditions. Compos. Struct. 2018, 206, 517–525. [Google Scholar] [CrossRef]
- Sarr, C.A.T.; Chataigner, S.; Gaillet, L.; Godin, N. Nondestructive Evaluation of FRP-Reinforced Structures Bonded Joints Using Acousto-Ultrasonic: Towards Diagnostic of Damage State. Constr. Build. Mater. 2021, 313, 125499. [Google Scholar] [CrossRef]
- Li, Z.; Wang, Z.; Li, Y.; Han, S. SN-SAE: A New Damage Diagnosis Method for CFRP Using Lamb Wave. Meas. Sci. Technol. 2023, 34, 095020. [Google Scholar] [CrossRef]
- Lu, S.; Jiang, M.; Sui, Q.; Sai, Y.; Jia, L. Damage Identification System of CFRP Using Fiber Bragg Grating Sensors. Compos. Struct. 2015, 125, 400–406. [Google Scholar] [CrossRef]
- Tavares, A.; Di Lorenzo, E.; Cornelis, B.; Peeters, B.; Desmet, W.; Gryllias, K. Machine Learning Approaches to Damage Detection in Composite Structures Combining Experimental and Simulation Domains. Mech. Syst. Signal Process. 2024, 215, 111412. [Google Scholar] [CrossRef]
- Azad, M.M.; Kim, S.; Kim, H.S. Autonomous Data-Driven Delamination Detection in Laminated Composites with Limited and Imbalanced Data. Alex. Eng. J. 2024, 107, 770–785. [Google Scholar] [CrossRef]
- Zhang, B.; Hong, X.; Liu, Y. Multi-Task Deep Transfer Learning Method for Guided Wave-Based Integrated Health Monitoring Using Piezoelectric Transducers. IEEE Sens. J. 2020, 20, 14391–14400. [Google Scholar] [CrossRef]
- Zhao, G.; Wang, B.; Hao, W.; Luo, Y.; Chen, H. Localization and Characterization of Delamination in Laminates Using the Local Wavenumber Method. Compos. Struct. 2020, 238, 111972. [Google Scholar] [CrossRef]
- Zhang, G.; Kundu, T.; Deymier, P.A.; Runge, K. Defect Localization in Plate Structures Using the Geometric Phase of Lamb Waves. Ultrasonics 2025, 145, 107492. [Google Scholar] [CrossRef]
- Kim, S.; Azad, M.M.; Song, J.; Kim, H. Delamination Detection Framework for the Imbalanced Dataset in Laminated Composite Using Wasserstein Generative Adversarial Network-Based Data Augmentation. Appl. Sci. 2023, 13, 11837. [Google Scholar] [CrossRef]
- Taylor, L.; Nitschke, G. Improving Deep Learning with Generic Data Augmentation. In Proceedings of the 2018 IEEE Symposium Series on Computational Intelligence (SSCI), Bangalore, India, 18–21 November 2018; IEEE: Piscataway, NJ, USA, 2018; pp. 1542–1547. [Google Scholar]
- Farias, S.V.; Saotome, O.; Campos Velho, H.F.; Shiguemori, E.H. A Damage Detection Method Using Neural Network Optimized by Multiple Particle Collision Algorithm. J. Sensors 2021, 2021, 9998187. [Google Scholar] [CrossRef]
- Malekian, A.; Chitsaz, N. Concepts, Procedures, and Applications of Artificial Neural Network Models in Streamflow Forecasting. In Advances in Streamflow Forecasting; Elsevier: Amsterdam, The Netherlands, 2021; pp. 115–147. [Google Scholar]
- Kiranyaz, S.; Avci, O.; Abdeljaber, O.; Ince, T.; Gabbouj, M.; Inman, D.J. 1D Convolutional Neural Networks and Applications: A Survey. Mech. Syst. Signal Process. 2021, 151, 107398. [Google Scholar] [CrossRef]
- Peng, P.; Zhao, X.; Pan, X.; Ye, W. Gas Classification Using Deep Convolutional Neural Networks. Sensors 2018, 18, 157. [Google Scholar] [CrossRef] [PubMed]
- Liu, M.; Wang, Z.; Jiang, P.; Yan, G. Temperature Compensation Method for Piezoresistive Pressure Sensors Based on Gated Recurrent Unit. Sensors 2024, 24, 5394. [Google Scholar] [CrossRef]
- Salem, F.M. Gated RNN: The Gated Recurrent Unit (GRU) RNN. In Recurrent Neural Networks; Springer International Publishing: Cham, Switzerland, 2022; pp. 85–100. [Google Scholar]


| Layer | Output Shape | Parameters | Optimized Hyperparameters |
|---|---|---|---|
| Input | (None, 1500, 12) | - | - |
| Conv1D | (None, 1498, 16) | 592 | Filters: 16, Kernel Size: 3, Activation: ReLU |
| MaxPooling1D | (None, 749, 16) | - | Pool Size: 2 |
| Conv1D | (None, 747, 32) | 1568 | Filters: 32, Kernel Size: 3, Activation: ReLU |
| MaxPooling1D | (None, 373, 32) | - | Pool Size: 2 |
| Conv1D | (None, 371, 64) | 6208 | Filters: 64, Kernel Size: 3, Activation: ReLU |
| MaxPooling1D | (None, 185, 64) | - | Pool Size: 2 |
| Flatten | (None, 11840) | - | - |
| Dense | (None, 64) | 757,824 | Units: 64, Activation: ReLU |
| Dense (Severity) | (None, 4) | 260 | Activation: Sigmoid |
| Dense (Localization) | (None, 2) | 130 | Activation: Linear |
Disclaimer/Publisher’s Note: The statements, opinions and data contained in all publications are solely those of the individual author(s) and contributor(s) and not of MDPI and/or the editor(s). MDPI and/or the editor(s) disclaim responsibility for any injury to people or property resulting from any ideas, methods, instructions or products referred to in the content. |
© 2024 by the authors. Licensee MDPI, Basel, Switzerland. This article is an open access article distributed under the terms and conditions of the Creative Commons Attribution (CC BY) license (https://creativecommons.org/licenses/by/4.0/).
Share and Cite
Azad, M.M.; Munyaneza, O.; Jung, J.; Sohn, J.W.; Han, J.-W.; Kim, H.S. Damage Localization and Severity Assessment in Composite Structures Using Deep Learning Based on Lamb Waves. Sensors 2024, 24, 8057. https://doi.org/10.3390/s24248057
Azad MM, Munyaneza O, Jung J, Sohn JW, Han J-W, Kim HS. Damage Localization and Severity Assessment in Composite Structures Using Deep Learning Based on Lamb Waves. Sensors. 2024; 24(24):8057. https://doi.org/10.3390/s24248057
Chicago/Turabian StyleAzad, Muhammad Muzammil, Olivier Munyaneza, Jaehyun Jung, Jung Woo Sohn, Jang-Woo Han, and Heung Soo Kim. 2024. "Damage Localization and Severity Assessment in Composite Structures Using Deep Learning Based on Lamb Waves" Sensors 24, no. 24: 8057. https://doi.org/10.3390/s24248057
APA StyleAzad, M. M., Munyaneza, O., Jung, J., Sohn, J. W., Han, J.-W., & Kim, H. S. (2024). Damage Localization and Severity Assessment in Composite Structures Using Deep Learning Based on Lamb Waves. Sensors, 24(24), 8057. https://doi.org/10.3390/s24248057