
Synthetic Imaging Radar Data Generation in Various Clutter Environments Using Novel UWB Log-Periodic Antenna


Abstract
1. Introduction
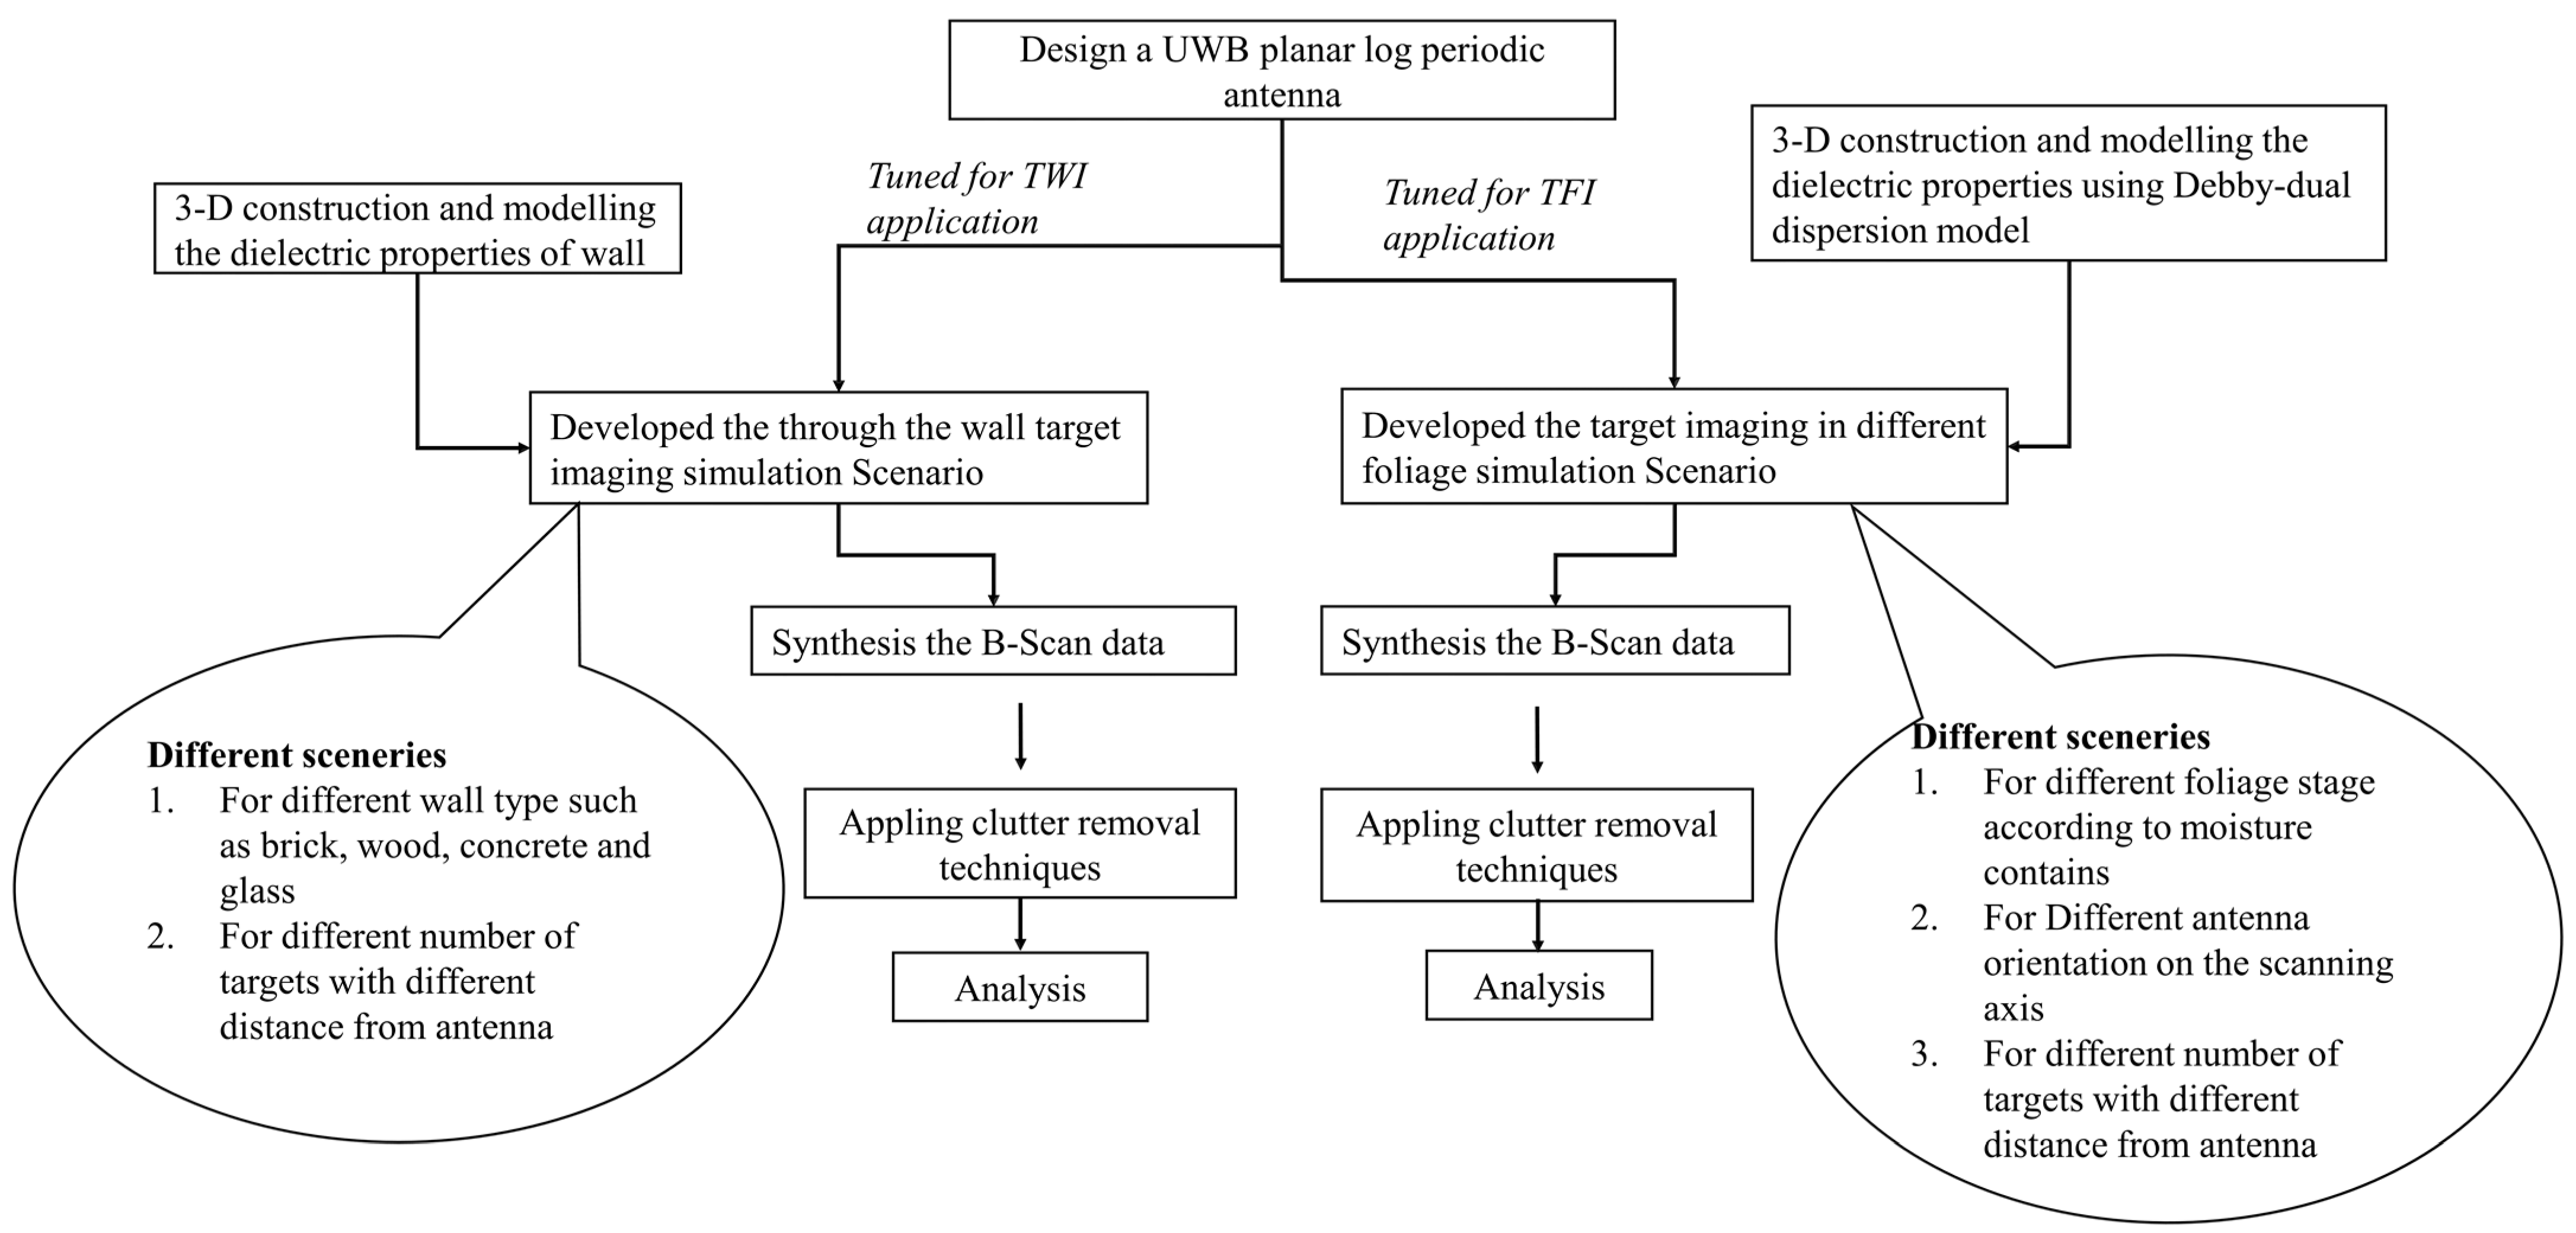
2. Methodology
- Designing a high gain, stable radiation pattern and compact UWB printed planar antenna. Antenna design and analysis are discussed in Section 3.
- Scaling the design for two different applications, i.e., for TWI and TFI, via simply scaling the size of the antenna.
- Modeling different clutter environments for TWI and TFI applications. This step is described and discussed in detail in Section 4. After modeling the environments, synthetic data is generated using different clutter scenarios such as wall types, foliage moisture, number of targets, target positions, and antenna orientation.
- Lastly, post-processing to reduce the effect of clutters for the successful detection of targets. A detailed analysis of this step is discussed in Section 5.
3. Antenna Design
4. Environment Modeling and Simulation
4.1. Modeling and Simulation: Through-the-Wall Imaging
4.2. Foliage Environment
5. Post-Processing and Target Detection
5.1. Target Detection in Through-the-Wall Imagery
5.2. Target Detection in Through-the-Foliage Imagery
- The proposed antenna design is suitable for use in generation of synthetic TWI and TFI data.
- The clutter models are a simpler approximation of a real-world clutter environment.
- The synthetic data generated in the case of TWI and TFI are credible and could be used in development of novel clutter removal or target detection algorithms.
6. Conclusions
Author Contributions
Funding
Institutional Review Board Statement
Informed Consent Statement
Data Availability Statement
Conflicts of Interest
References
- Wang, S.; Liu, G.; Jing, G.; Feng, Q.; Liu, H.; Guo, Y. State-of-the-Art Review of Ground Penetrating Radar (GPR) Applications for Railway Ballast Inspection. Sensors 2022, 22, 2450. [Google Scholar] [CrossRef] [PubMed]
- Paun, M. Through-Wall Imaging Using Low-Cost Frequency-Modulated Continuous Wave Radar Sensors. Remote Sens. 2024, 16, 1426. [Google Scholar] [CrossRef]
- Noyman, Y.; Shmulevich, I. Ground Surface Sensing through Plant Foliage Using an FM-CW Radar. Comput. Electron. Agric. 1996, 15, 181–193. [Google Scholar] [CrossRef]
- Liang, J.; Liang, Q. Sense-Through-Foliage Target Detection Using UWB Radar Sensor Networks. Pattern Recognit. Lett. 2010, 31, 1412–1421. [Google Scholar] [CrossRef]
- Cuccaro, A.; Dell’Aversano, A.; Basile, B.; Solimene, R. Microwave Radar Imaging as a Tool for Medical Diagnostics. In Proceedings of the 4th International Electronic Conference on Applied Sciences, Online, 27 October–10 November 2023; p. 303. [Google Scholar]
- Ventura, A.; Pajewski, L. Electromagnetic Modelling and Simulation of a High-Frequency Ground Penetrating Radar Antenna over a Concrete Cell with Steel Rods. Ground Penetrating Radar 2018, 1, 52–70. [Google Scholar]
- Stadler, S.; Schennen, S.; Hiller, T.; Igel, J. Realistic Simulation of GPR for Landmine and IED Detection Including Antenna Models, Soil Dispersion and Heterogeneity. Surf. Geophys. 2024, 22, 188–205. [Google Scholar] [CrossRef]
- Warren, C.; Giannopoulos, A. Creating FDTD Models of Commercial GPR Antennas Using Taguchi’ s Optimisation Method. Geophysics 2011, 76, G37–G47. [Google Scholar] [CrossRef]
- Benedetto, A.; Tosti, F.; Pajewski, L.; D’Amico, F.; Kusayanagi, W. FDTD Simulation of the GPR Signal for Effective Inspection of Pavement Damages. In Proceedings of the 15th IEEE International Conference on Ground Penetrating Radar, Brussels, Belgium, 30 June–4 July 2014; pp. 513–518. [Google Scholar]
- Loewer, M.; Igel, J. FDTD Simulation of GPR with a Realistic Multi-Pole Debye Description of Lossy and Dispersive Media. In Proceedings of the 2016 16th IEEE International Conference on Ground Penetrating Radar (GPR), Hong Kong, 13–16 June 2016; pp. 1–5. [Google Scholar]
- Shangguan, P.; Al-Qadi, I.L. Calibration of FDTD Simulation of GPR Signal for Asphalt Pavement Compaction Monitoring. IEEE Trans. Geosci. Remote Sens. 2015, 53, 1538–1548. [Google Scholar] [CrossRef]
- Solla, M.; Asorey-Cacheda, R.; Núñez-Nieto, X.; Conde-Carnero, B. Evaluation of Historical Bridges through Recreation of GPR Models with the FDTD Algorithm. NDT E Int. 2016, 77, 19–27. [Google Scholar] [CrossRef]
- Alvarez, J.K.; Sutjipto, S.; Kodagoda, S. Validated Ground Penetrating Radar Simulation Model for Estimating Rebar Location in Infrastructure Monitoring. In Proceedings of the 2017 12th IEEE Conference on Industrial Electronics and Applications (ICIEA), Siem Reap, Cambodia, 18–20 June 2017; pp. 1460–1465. [Google Scholar] [CrossRef]
- Warren, C.; Giannopoulos, A.; Diamanti, N.; Annan, P. An Extension Module to Embed Commercially Sensitive Antenna Models in gprMax. In Proceedings of the 2015 8th International Workshop on Advanced Ground Penetrating Radar (IWAGPR, Florence, Italy, 7–10 July 2015; pp. 1–3. [Google Scholar]
- Tahar, Z.; Dérobert, X.; Benslama, M. An Ultra-Wideband Modified Vivaldi Antenna Applied to Ground and through the Wall Imaging. Prog. Electromagn. Res. C 2018, 86, 111–122. [Google Scholar] [CrossRef]
- Bhattacharyya, K.; Goswami, S.; Sarmah, K.; Baruah, S. A Linear-Scaling Technique for Designing a THz Antenna from a GHz Microstrip Antenna or Slot Antenna. Optik 2019, 199, 163331. [Google Scholar] [CrossRef]
- Hariyadi, T.; Munir, A.; Bayu Suksmono, A.; Adi, K.; Setiawan, A.D. Unidirectional Broadband Microstrip Antenna for through Walls Radar Application. In Proceedings of the 2011 International Conference on Electrical Engineering and Informatics, Bandung, Indonesia, 17–19 July 2011; pp. 1–4. [Google Scholar] [CrossRef]
- Saeidi, T.; Alhawari, A.R.H.; Almawgani, A.H.M.; Alsuwian, T.; Imran, M.A.; Abbasi, Q. High Gain Compact UWB Antenna for Ground Penetrating Radar Detection and Soil Inspection. Sensors 2022, 22, 5183. [Google Scholar] [CrossRef] [PubMed]
- Sun, H.H.; Lee, Y.H.; Yucel, A.C.; Ow, G.; Yusof, M.L.M. Compact Dual-Polarized Vivaldi Antenna for Ground Penetrating Radar (GPR) Application. In Proceedings of the 2020 IEEE International Symposium on Antennas and Propagation and North American Radio Science Meeting, Montreal, QC, Canada, 5–10 July 2020; Volume 1, pp. 25–26. [Google Scholar] [CrossRef]
- Davis, M.E. Foliage Penetration Radar: Detection and Characterisation of Objects Under Trees; Scitech Publication: Raleigh, NC, USA, 2011; ISBN 978-1-61353-135-8. [Google Scholar]
- Comite, D.; Galli, A.; Catapano, I.; Soldovieri, F. The Role of the Antenna Radiation Pattern in the Performance of a Microwave Tomographic Approach for GPR Imaging. IEEE J. Sel. Top. Appl. Earth Obs. Remote Sens. 2017, 10, 4337–4347. [Google Scholar] [CrossRef]
- Yang, Z.; Jingjian, H.; Weiwei, W.; Naichang, Y. A Printed LPDA Antenna Fed by a Microstrip Line to Double Sided Parallel Strip Line from Backside. Int. J. Antennas Propag. 2017, 1–7. [Google Scholar] [CrossRef]
- Bozdag, G.; Kustepeli, A. Subsectional Tapered Fed Printed LPDA Antenna with a Feeding Point Patch. IEEE Antennas Wirel. Propag. Lett. 2016, 15, 437–440. [Google Scholar] [CrossRef]
- Verma, P.K.; Gaikwad, A.N.; Singh, D.; Nigam, M.J. Analysis of Clutter Reduction Techniques for through Wall Imaging in UWB Range. Prog. Electromagn. Res. B 2009, 17, 29–48. [Google Scholar] [CrossRef]
- Liu, L.; Chen, Q.; Han, Y.; Xu, H.; Li, J.; Wang, B. Improved Clutter Removal by Robust Principal Component Analysis for Chaos Through-Wall Imaging Radar. Electronics 2019, 9, 25. [Google Scholar] [CrossRef]
- Chandra, R.; Gaikwad, A.N.; Singh, D.; Nigam, M.J. An Approach to Remove the Clutter and Detect the Target for Ultra-Wideband through-Wall Imaging. J. Geophys. Eng. 2008, 5, 412–419. [Google Scholar] [CrossRef]
- Kabourek, V.; Mazánek, M. Clutter Reduction Based on Principal Component Analysis Technique for Hidden Objects Detection. Radio Eng. 2012, 21, 464–470. [Google Scholar]
- Shetty, A.K.; Rangula, M.; Kandasamy, K.; Srihari, P. A Novel Compact Wideband Planar Antenna Design for FOPEN Radar Applications. In Proceedings of the 2023 IEEE Microwaves, Antennas, and Propagation Conference (MAPCON), Ahmedabad, India, 11 December 2023; pp. 1–5. [Google Scholar]
- Nagulpelli, A.S.; Varun, D. Bandwidth Enhanced UHF- Discone Antenna for FOPEN Radar. In Proceedings of the 2019 IEEE 5th International Conference for Convergence in Technology (I2CT), Bombay, India, 29–31 March 2019; pp. 1–5. [Google Scholar]
- Shinde, S.S.; Khanaourkar, M.M.; Tamang, M. Design of UWB UHF Printed Dipole Antenna Array for Foliage Penetrating(FOPEN)Radar. In Proceedings of the 2018 Second International Conference on Intelligent Computing and Control Systems (ICICCS), Madurai, India, 14–15 June 2018; pp. 516–518. [Google Scholar] [CrossRef]
- Wang, Y.; Fathy, A.E. Design of a Compact Tapered Slot Vivaldi Antenna Array for See Through Concrete Wall UWB Applications. In Proceedings of the XXIXth URSI General Assembly, Chicago, IL, USA, 7–16 August 2008. [Google Scholar]
- Li, G.; Zhang, F.; Wang, B. Compact VHF/UHF Ultra wideband Discone Antenna with Consistent Pattern. Sensors 2024, 24, 6147. [Google Scholar] [CrossRef]
- Nijhawan, P.; Kumar, A.; Dwivedi, Y. A Flexible Corrugated Vivaldi Antenna for Radar and See-through Wall Applications. In Proceedings of the 2018 3rd International Conference on Microwave and Photonics (ICMAP), Dhanbad, India, 9–11 February 2018; pp. 1–2. [Google Scholar]
- Sun, H.-H.; Cheng, W.; Fan, Z. Learning to Remove Clutter in Real-World GPR Images Using Hybrid Data. IEEE Trans. Geosci. Remote Sens. 2022, 60, 1–14. [Google Scholar] [CrossRef]
- Jason Weber & Joseph Penn Arbaro—Tree Generation for Povray 2015. Available online: https://arbaro.souceforge.net (accessed on 5 December 2024).
- Trivedi, D.; Gotra, S.; Phartiyal, G.S.; Singh, D. Modeling and Analysis of Foliage Environment Using Wideband Radar System. In Proceedings of the 2023 IEEE Conference on Antenna Measurements and Applications (CAMA), Genoa, Italy, 15–17 November 2023; pp. 1052–1056. [Google Scholar] [CrossRef]
- Fawwaz, T.U.; Mohamed, A. El-rayes Microwave Dielectric Spectrum of Vegetation—Part II: Dual-Dispersion Model. IEEE Trans. Geosci. Remote Sens. 1987, GE-25, 550–557. [Google Scholar]
- Klein, L.M. Considerations for Detection of Dismounts with FOPEN Radar; Sandia National Laboratories: Albuquerque, NM, USA, 2019; pp. 1–25. [Google Scholar]


| Parameters | Antenna_1 (mm) | Antenna_2 (mm) |
|---|---|---|
| L1 | 40 | 80 |
| L2 | 36 | 72 |
| W1 | 4.5 | 9 |
| W2 | 4.05 | 8.1 |
| D1 | 7 | 14 |
| D2 | 6.3 | 12.6 |
| LS | 104 | 208 |
| Fw1 | 4 | 8 |
| Fw2 | 0.5 | 1 |
| Fw3 | 0.5 | 1 |
| d | 0.8 | 1.6 |
| FL1 | 59 | 118 |
| FL2 | 42.5 | 85 |
| WS | 90 | 180 |
| Reference | Application | Structure Type | Size | Gain (dBi) | Bandwidth (MHz) |
|---|---|---|---|---|---|
| [28] | L-band foliage penetration (FOPEN) | 2 dielectric layers and 3 metallic layers | 41λ × 0.41λ × 0.0038λ | >2.31 | 550 |
| [29] | UHF band foliage penetration (FOPEN) | 3-D discone structure | Cylindrical volume with 600 mm (D) and 700 mm (H) | >0.5 | 20 and 16 |
| [30] | UHF band foliage penetration (FOPEN) | Planar array structure | 1200 × 2438 mm2 | >7 | 500 |
| [32] | Not specified | 3-D discone structure | Cylindrical volume with 0.227 λ0 (D) and 0.096 λ0 (H) | >0.2 | 2280 |
| [33] | S-band TWI | Vivaldi antenna | 58.9 × 48 mm2 | 5 to 6 | 1240 |
| [31] | S-band TWI | 1 × 8 Vivaldi antenna array | 480 × 210 mm2 | >12 | 3000 |
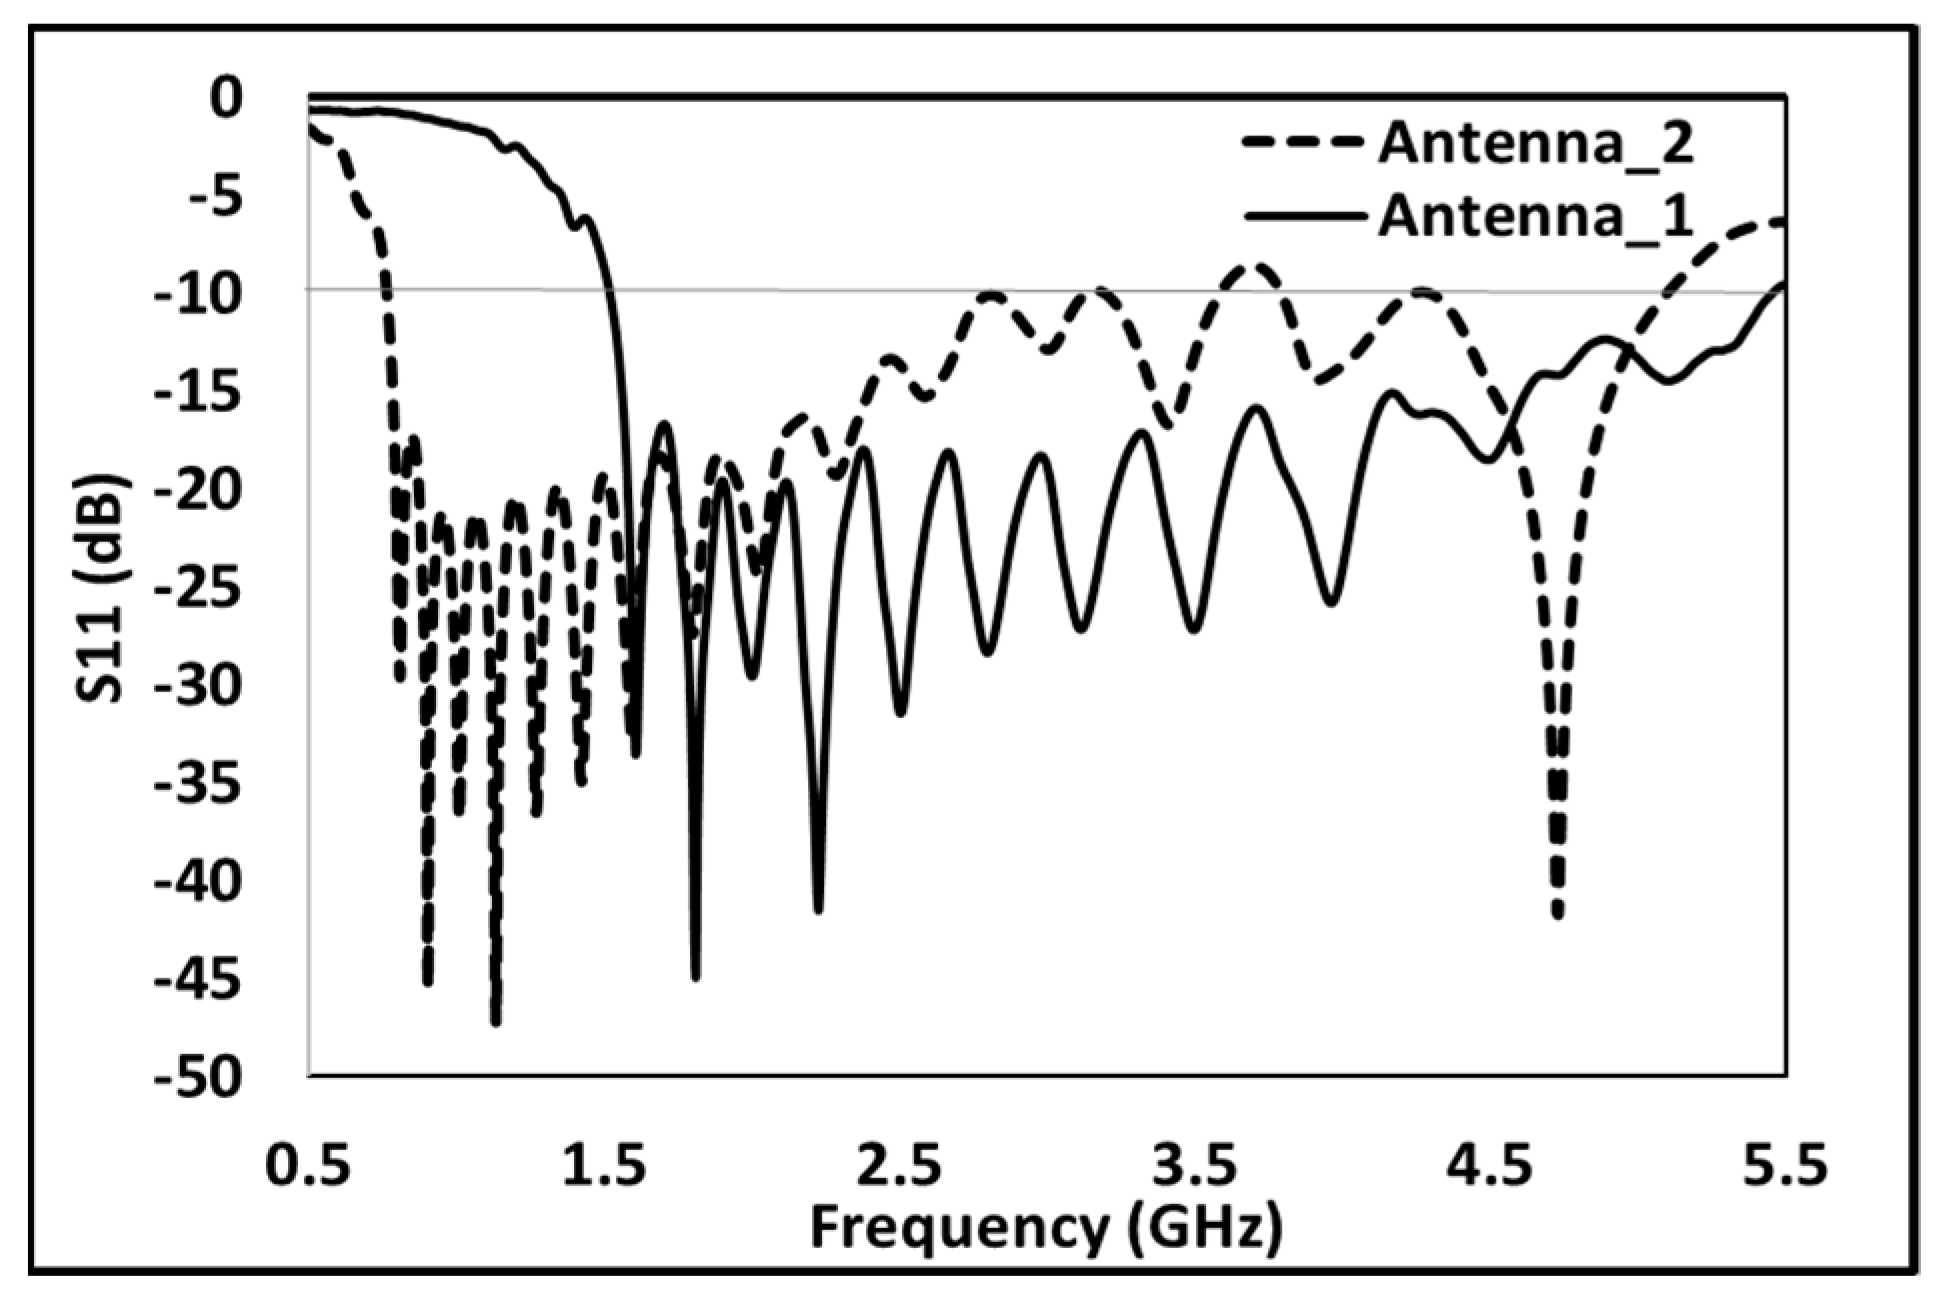
| Antenna_2 | UHF to L band TFI | Planar log-periodic | 180 × 208 mm2 | >2.31 | 2000 |
| Antenna_1 | L to S-band TWI | Planar log-periodic | 90 × 104 mm2 | >0.5 | 4000 |
| Sr. No. | Type of Wall | Number of Targets | Distance of Target from the Antenna in cm | Cross Range Bin |
|---|---|---|---|---|
| 1 | Brick | 1 | 150 | 10 |
| 2 | Brick | 2 | 150, 150 | 4, 10 |
| 3. | Brick | 2 | 150, 200 | 4, 10 |
| 4. | Brick | 1 | 150 | 6 |
| 5. | Wood | 1 | 150 | 6 |
| 6. | Glass | 1 | 150 | 6 |
| 7. | Concrete | 1 | 150 | 6 |
| Sr. No. | Dielectric of Foliage | Antenna Orientation | Number of Targets | Distance of Target from Antenna in cm | Cross Range Bin |
|---|---|---|---|---|---|
| 1 | 15 + 6i | Horizontally placed | 1 | 150 | 4 |
| 2 | 15 + 6i | Horizontally placed | 2 | 150, 150 | 4, 9 |
| 3. | 15 + 6i | Horizontally placed | 2 | 150, 175 | 4, 9 |
| 4. | 15 + 6i | Vertically placed | 1 | 150 | 4 |
| 5. | 15 + 6i | Vertically placed | 2 | 150, 150 | 4, 9 |
| 6. | 15 + 6i | Vertically placed | 2 | 150, 175 | 4, 9 |
| 7. | 10 + 4i | Horizontally placed | 1 | 150 | 4 |
| 8. | 20 + 8i | Horizontally placed | 1 | 150 | 4 |
Disclaimer/Publisher’s Note: The statements, opinions and data contained in all publications are solely those of the individual author(s) and contributor(s) and not of MDPI and/or the editor(s). MDPI and/or the editor(s) disclaim responsibility for any injury to people or property resulting from any ideas, methods, instructions or products referred to in the content. |
© 2024 by the authors. Licensee MDPI, Basel, Switzerland. This article is an open access article distributed under the terms and conditions of the Creative Commons Attribution (CC BY) license (https://creativecommons.org/licenses/by/4.0/).
Share and Cite
Trivedi, D.; Phartiyal, G.S.; Kumar, A.; Singh, D. Synthetic Imaging Radar Data Generation in Various Clutter Environments Using Novel UWB Log-Periodic Antenna. Sensors 2024, 24, 7903. https://doi.org/10.3390/s24247903
Trivedi D, Phartiyal GS, Kumar A, Singh D. Synthetic Imaging Radar Data Generation in Various Clutter Environments Using Novel UWB Log-Periodic Antenna. Sensors. 2024; 24(24):7903. https://doi.org/10.3390/s24247903
Chicago/Turabian StyleTrivedi, Deepmala, Gopal Singh Phartiyal, Ajeet Kumar, and Dharmendra Singh. 2024. "Synthetic Imaging Radar Data Generation in Various Clutter Environments Using Novel UWB Log-Periodic Antenna" Sensors 24, no. 24: 7903. https://doi.org/10.3390/s24247903
APA StyleTrivedi, D., Phartiyal, G. S., Kumar, A., & Singh, D. (2024). Synthetic Imaging Radar Data Generation in Various Clutter Environments Using Novel UWB Log-Periodic Antenna. Sensors, 24(24), 7903. https://doi.org/10.3390/s24247903