
Distributed Passive Positioning and Sorting Method for Multi-Network Frequency-Hopping Time Division Multiple Access Signals


Abstract
1. Introduction
2. Signal Model
2.1. Transmitted Signal Model
2.2. Received Signal Model
3. Proposed Method
3.1. Method Framework
3.2. Wideband Channelized Reception
3.3. Parameter Estimation
3.3.1. Detection Using an Adaptive Threshold
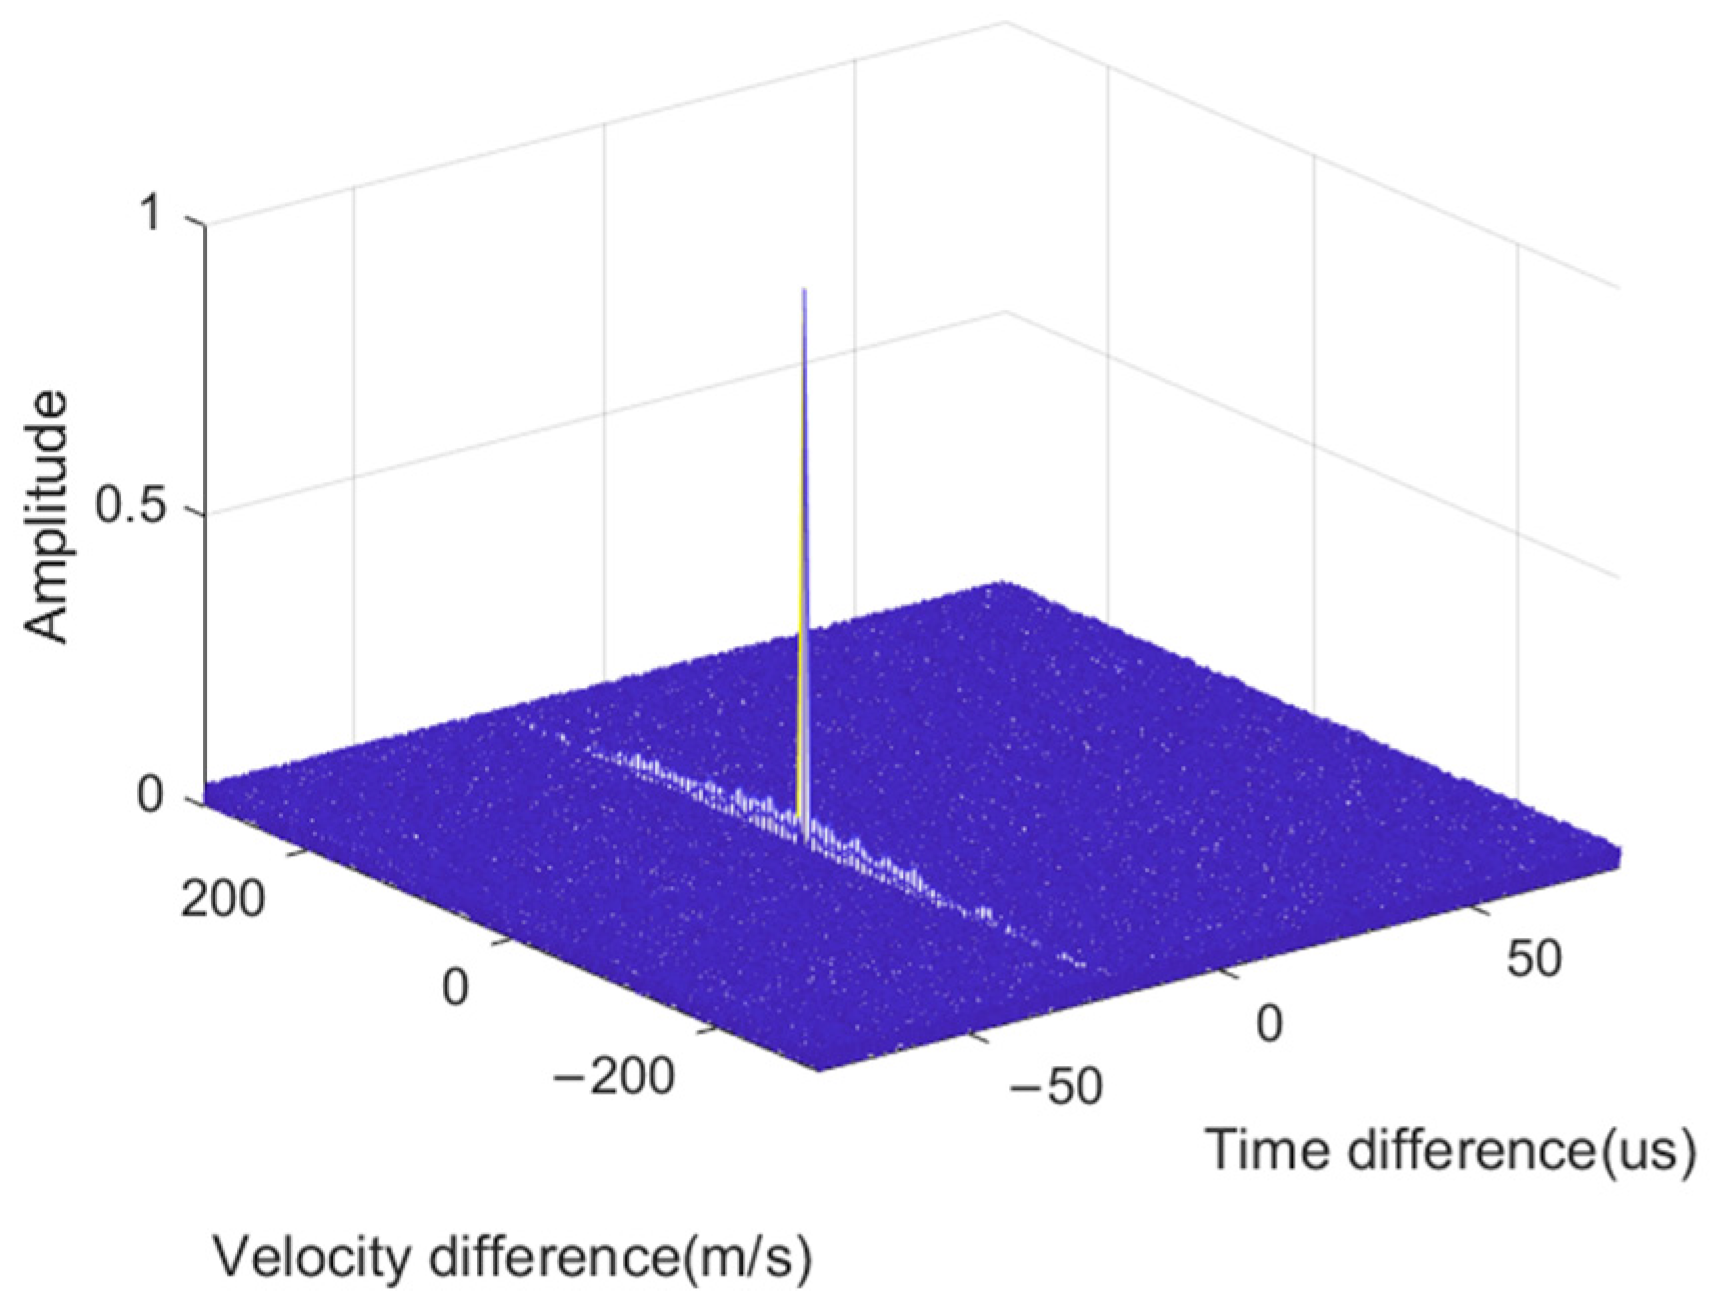
3.3.2. Accurate Estimation of the TDOA and the VDOA
3.4. Location Estimation Based on the TDOA and the VDOA
3.5. Multi-Network Signal Sorting
- (1)
- Randomly select samples as the initial cluster centers;
- (2)
- Obtain the distance between each sample and the cluster center, and divide it into the class with the closest distance;
- (3)
- Calculate and update the corresponding cluster center value of each category;
- (4)
- Repeat the above process until the cluster center no longer changes.
- (1)
- Treat each data point in the data set as a class;
- (2)
- According to the cosine similarity method, solve the similarity of all classes;
- (3)
- Obtain the class with the closest similarity and classify the two into one class;
- (4)
- Repeat the above process until the number of clusters is U.
4. Numerical Results
4.1. Experiment 1
4.2. Experiment 2
4.3. Experiment 3
4.4. Experiment 4
5. Conclusions
Author Contributions
Funding
Data Availability Statement
Conflicts of Interest
References
- Li, S.; Li, T. Frequency hopping signal detection over the short-wave channel. Acta Electron. Sin. 2019, 47, 623–629. [Google Scholar]
- Lin, M.; Tian, Y.; Zhang, X.; Huang, Y. Parameter estimation of frequency-hopping signal in UCA based on deep learning and spatial time–frequency distribution. IEEE Sens. J. 2023, 23, 7460–7474. [Google Scholar] [CrossRef]
- Bai, L.; Wang, J.; Chen, X. Ambiguity function analysis and side peaks suppression of Link16 signal based passive radar. J. Syst. Eng. Electron. 2023, 34, 1526–1536. [Google Scholar] [CrossRef]
- Motie, S.; Zayyani, H.; Salman, M.; Bekrani, M. Self UAV localization using multiple base stations base on TDOA measurements. IEEE Wirel. Commun. Lett. 2024, 13, 2432–2436. [Google Scholar] [CrossRef]
- Wang, H.; Zhang, B.; Wang, H.; Wang, H.; Wu, B.; Guo, D. Hopping time estimation of frequency-hopping signals based on HMM-enhanced Bayesian compressive sensing with missing observations. IEEE Commun. Lett. 2022, 26, 2180–2184. [Google Scholar] [CrossRef]
- Wang, Y.; Liao, H.; Yuan, S.; Liu, N. A learning-based signal parameter extraction approach for multi-source frequency-hopping signal sorting. IEEE Signal Process. Lett. 2023, 30, 1162–1166. [Google Scholar] [CrossRef]
- Yang, Y.; Zheng, J.; Liu, H.; Ho, K.C.; Yang, Z.; Gao, S. Optimal sensor placement and velocity configuration for TDOA-FDOA localization and tracking of a moving source. IEEE Trans. Aerosp. Electron. Syst. 2024; early access. [Google Scholar]
- Hu, D.; Huang, Z.; Chen, X.; Lu, J. A moving source localization method using TDOA, FDOA and doppler rate measurements. IEICE Trans. Commun. 2016, 99, 758–766. [Google Scholar] [CrossRef]
- Xiao, X.; Guo, F.; Feng, D. Low-complexity methods for joint delay and Doppler estimation of unknown wideband signals. IET Radar Sonar Navig. 2018, 12, 398–406. [Google Scholar] [CrossRef]
- Xiao, X.; Guo, F. Joint estimation of time delay, doppler velocity and doppler rate of unknown wideband signals. Circuits Syst. Signal Process. 2019, 38, 85–104. [Google Scholar] [CrossRef]
- Xia, N.; Xiang, R.; Xing, B.; Gao, D. TDOA based direct positioning of co-channel signals using cyclic cross-spectral functions. IEEE Commun. Lett. 2024, 28, 303–307. [Google Scholar]
- Yao, S.; Ouyang, X.; He, Q. Unambiguous TDOA estimation algorithm of narrowband frequency hopping signal. Acta Electron. 2019, 47, 798–805. [Google Scholar]
- Ouyang, X.; He, Q.; Yang, Y.; Wan, Q. TDOA/FDOA estimation algorithm of frequency-hopping signals based on CAF coherent integration. IET Commun. 2020, 14, 331–336. [Google Scholar] [CrossRef]
- Ouyang, X.; Yao, S.; Yang, Y.; Wan, Q. Coherent and non-coherent integration TDOA/FDOA estimation method of frequency-hopping signals. Syst. Eng. Electron. 2021, 43, 1184–1190. [Google Scholar]
- Liu, Y.; Chen, C.; Wang, Y.; Liu, C. Range-independent TDOA localization using stepwise accuracy enhancement under speed uncertainty. IEEE Signal Process. Lett. 2023, 30, 1372–1376. [Google Scholar] [CrossRef]
- Joseph, L.; Thoma, G. Frequency-hopped signal source identification in frequency-selective channels. IEEE Trans. Aerosp. Electron. Syst. 2019, 55, 3316–3329. [Google Scholar]
- Li, H.; Guo, Y.; Qi, Z.; Su, L. Blind detection of multi-frequency hopping signals under complex electromagnetic environment. J. Huazhong Univ. Sci. Technol. (Nat. Sci. Ed.) 2020, 48, 13–19. [Google Scholar]
- Zhao, X.; Nie, F.; Wang, R.; Li, X. Robust fuzzy K-Means clustering with shrunk patterns learning. IEEE Trans. Neural Netw. Learn. Syst. 2023, 35, 3001–3013. [Google Scholar] [CrossRef]
- Pan, R.; Zhong, C.; Qian, J. Balanced fair K-Means clustering. IEEE Trans. Ind. Inform. 2024, 20, 5914–5923. [Google Scholar] [CrossRef]
- Lee, K.; Oh, S. Detection of frequency-hopping signals with deep learning. IEEE Commun. Lett. 2020, 24, 1042–1046. [Google Scholar] [CrossRef]
- Wang, Z.; Zhang, B.; Zhu, Z.; Gong, K. Signal sorting algorithm of hybrid frequency hopping network station based on neural network. IEEE Access 2021, 9, 35924–35931. [Google Scholar] [CrossRef]
- Chen, T.; Yang, B.; Guo, L. Radar pulse stream clustering based on MaskRCNN instance segmentation network. IEEE Signal Process. Lett. 2023, 30, 1022–1026. [Google Scholar] [CrossRef]
- Lang, P.; Fu, X.; Dong, J.; Yang, H.; Yang, J. A novel radar signals sorting method via residual graph convolutional network. IEEE Signal Process. Lett. 2023, 30, 753–757. [Google Scholar] [CrossRef]
- Wang, Y.; Li, Y.; Sun, Q.; Li, Y. A novel underdetermined blind source separation algorithm of frequency-hopping signals via time-frequency analysis. IEEE Trans. Circuits Syst. II Express Briefs 2023, 70, 4286–4290. [Google Scholar] [CrossRef]
- Wan, M.; Zhang, Y.; Bai, Y.; Sun, Y.; Yu, Q.; Wang, Q. A real-time radar signal sorting method under Bayesian framework with dynamic cluster merging. IEEE Sens. J. 2024, 24, 27859–27869. [Google Scholar] [CrossRef]
- Zhi, K.; Pan, G.; Ren, H.; Wang, K. Power scaling law analysis and phase shift optimization of RIS-aided massive MIMO systems with statistical CSI. IEEE Trans. Commun. 2022, 70, 3558–3574. [Google Scholar] [CrossRef]
- Zhi, K.; Pan, G.; Ren, H.; Chai, K.; Elkashlan, M. Active RIS versus passive RIS: Which is superior with the same power budget? IEEE Commun. Lett. 2022, 26, 1150–1154. [Google Scholar] [CrossRef]
- Kang, X.; Wang, D.; Shao, Y.; Ma, M.; Zhang, T. An efficient hybrid multi-station TDOA and single-station AOA localization method. IEEE Trans. Wirel. Commun. 2023, 22, 5657–5670. [Google Scholar] [CrossRef]
- Cheng, D.; Huang, J.; Zhang, S.; Xia, S.; Wang, G.; Xie, J. K-means clustering with natural density peaks for discovering arbitrary-shaped clusters. IEEE Trans. Neural Netw. Learn. Syst. 2024, 35, 11077–11090. [Google Scholar] [CrossRef]


| Parameters | Numerical Values |
|---|---|
| Length of a single time slot | 3.9 ms |
| Number of data pulses | 300 |
| Width of a pulse | 6.4 µs |
| Interval between adjacent pulses | 13 µs |
| Symbol rate | 5 MHz |
| Interval between adjacent pulses | |
| Frequency-hopping interval | 5 MHz |
| Frequency points | 21 |
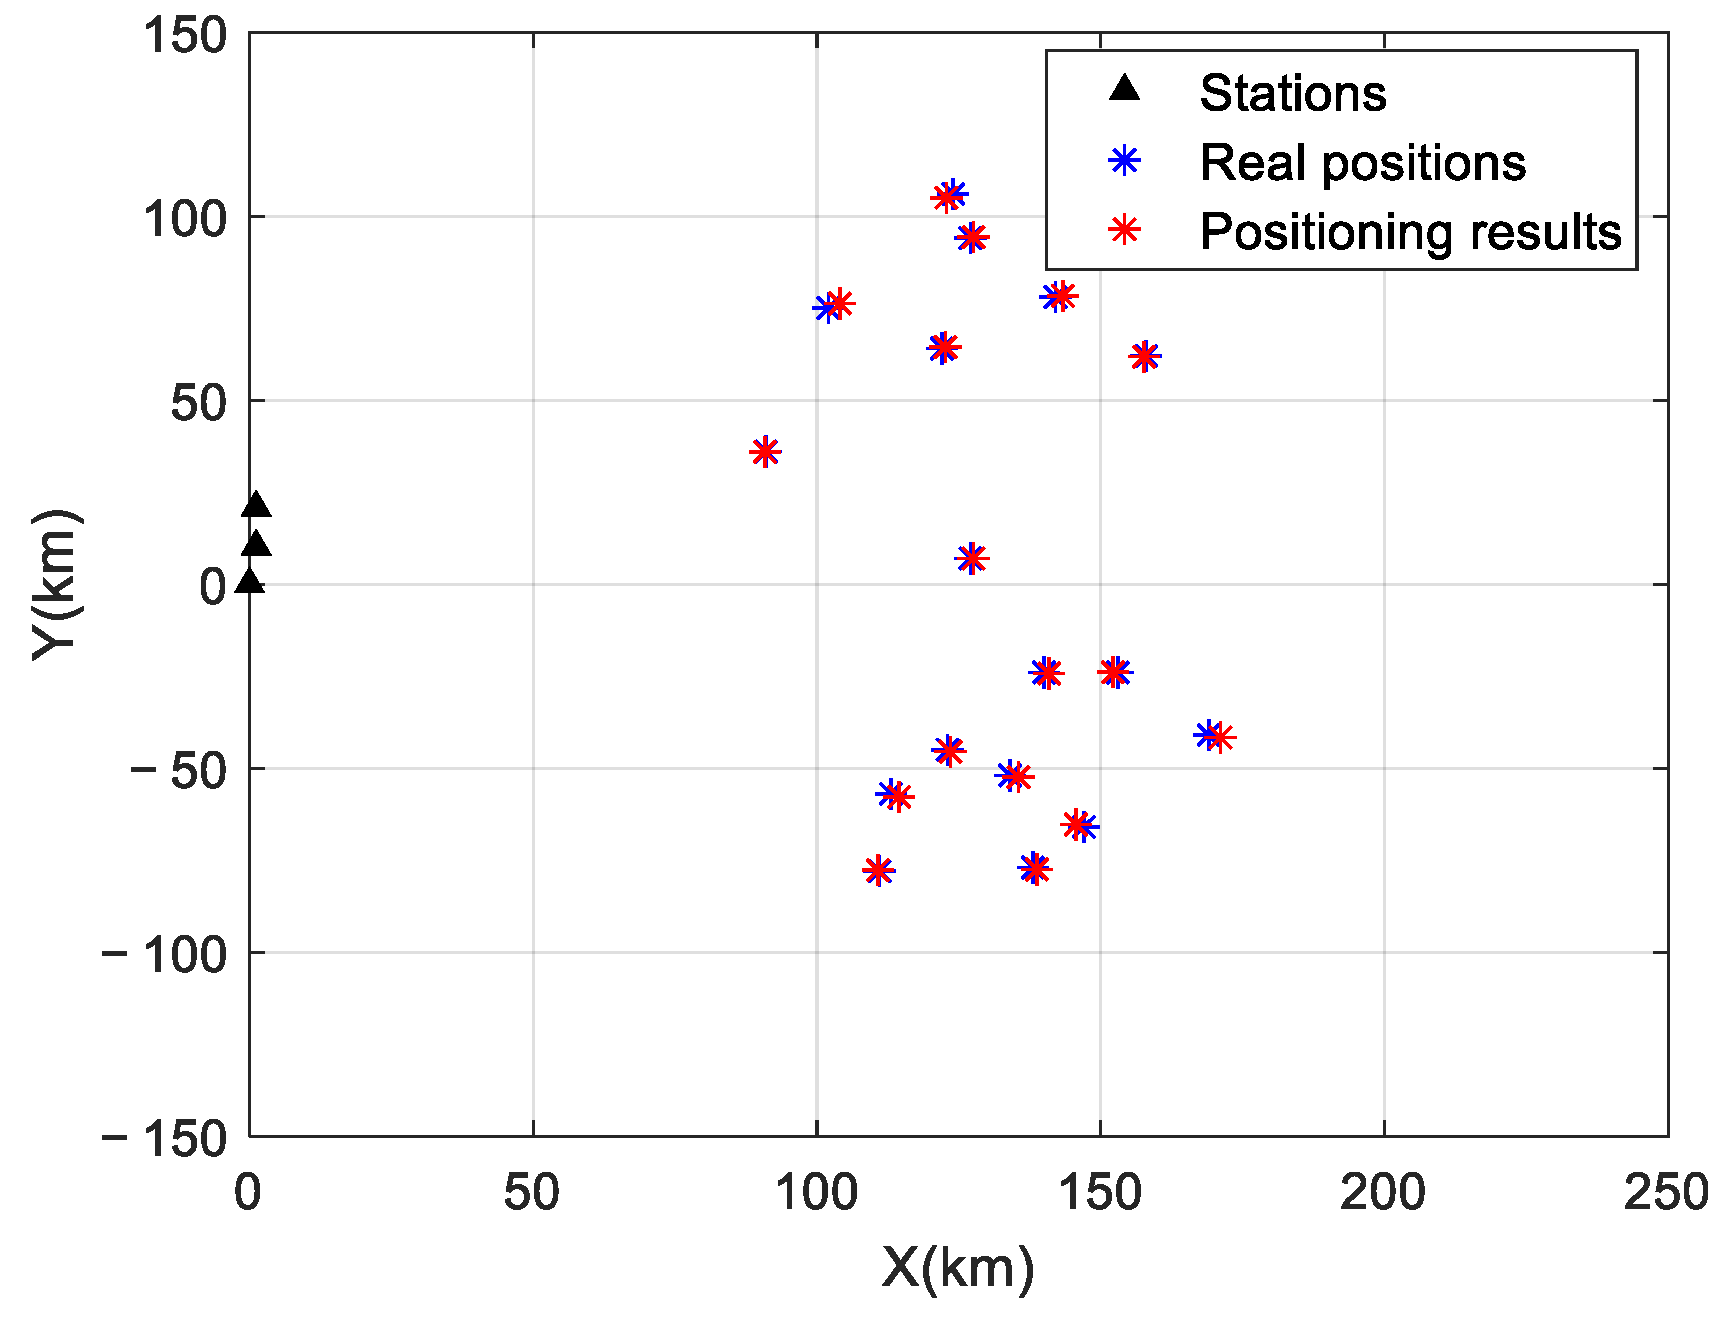
| Network Number | Coordinates of Radiation Sources (km) | Velocities of Radiation Sources (m/s) |
|---|---|---|
| 1 | (102, 75), (124, 106), (142, 78) | 270, 300, 260 |
| 2 | (127, 94), (159, 90), (122, 64), (158, 62) | 280, 220, 310, 240 |
| 3 | (123, −45), (140, −24), (147, −66), (169, −41) | −290, −285, −280, −300 |
| 4 | (113, −57), (111, −78), (134, −52), (138, −77) | 260, 240, 270, 280 |
| 5 | (91,36), (127,7), (153, -24) | −245, −250, −230, −220 |
| Radiation Source | 1 | 2 | 3 | 4 | 5 | 6 | 7 | 8 | 9 |
| (ns) | 0.20 | 0.14 | 0.07 | 0.01 | 0.12 | 0.18 | 0.13 | 0.04 | 0.13 |
| (ns) | 0.04 | 0.09 | 0.20 | 0.15 | 0.15 | 0.10 | 0.03 | 0.20 | 0.10 |
| (m/s) | 6.95 | 10.45 | 6.83 | 8.48 | 5.82 | 7.88 | 3.43 | 4.10 | 7.52 |
| (m/s) | 3.50 | 5.87 | 4.52 | 8.79 | 6.54 | 8.43 | 9.84 | 8.61 | 10.70 |
| position error (%R) | 0.16 | 0.07 | 0.08 | 0.16 | 0.04 | 0.37 | 0.05 | 0.18 | 0.03 |
| Radiation source | 10 | 11 | 12 | 13 | 14 | 15 | 16 | 17 | 18 |
| (ns) | 0.12 | 0.16 | 0.17 | 0.07 | 0.08 | 0.20 | 0.09 | 0.11 | 0.18 |
| (ns) | 0.03 | 0.20 | 0.09 | 0.13 | 0.10 | 0.08 | 0.11 | 0.10 | 0.05 |
| (m/s) | 3.52 | 8.27 | 7.94 | 5.82 | 11.20 | 6.37 | 4.56 | 9.57 | 7.91 |
| (m/s) | 8.60 | 4.66 | 4.37 | 6.77 | 5.38 | 7.82 | 2.82 | 3.58 | 5.89 |
| position error (%R) | 0.05 | 0.04 | 0.22 | 0.14 | 0.35 | 0.08 | 0.23 | 0.11 | 0.09 |
Disclaimer/Publisher’s Note: The statements, opinions and data contained in all publications are solely those of the individual author(s) and contributor(s) and not of MDPI and/or the editor(s). MDPI and/or the editor(s) disclaim responsibility for any injury to people or property resulting from any ideas, methods, instructions or products referred to in the content. |
© 2024 by the authors. Licensee MDPI, Basel, Switzerland. This article is an open access article distributed under the terms and conditions of the Creative Commons Attribution (CC BY) license (https://creativecommons.org/licenses/by/4.0/).
Share and Cite
Mao, J.; Luo, F.; Hu, X. Distributed Passive Positioning and Sorting Method for Multi-Network Frequency-Hopping Time Division Multiple Access Signals. Sensors 2024, 24, 7168. https://doi.org/10.3390/s24227168
Mao J, Luo F, Hu X. Distributed Passive Positioning and Sorting Method for Multi-Network Frequency-Hopping Time Division Multiple Access Signals. Sensors. 2024; 24(22):7168. https://doi.org/10.3390/s24227168
Chicago/Turabian StyleMao, Jiaqi, Feng Luo, and Xiaoquan Hu. 2024. "Distributed Passive Positioning and Sorting Method for Multi-Network Frequency-Hopping Time Division Multiple Access Signals" Sensors 24, no. 22: 7168. https://doi.org/10.3390/s24227168
APA StyleMao, J., Luo, F., & Hu, X. (2024). Distributed Passive Positioning and Sorting Method for Multi-Network Frequency-Hopping Time Division Multiple Access Signals. Sensors, 24(22), 7168. https://doi.org/10.3390/s24227168