
Investigating Nanoscale Interactions of Host–Guest Complexes Formed Between CB[7] and Atenolol by Quantum Chemistry and Ultrasensitive Vibrational Spectroscopy

 ,
,  ,
,  ,
,  , , and
Abstract
1. Introduction
2. Materials and Methods
2.1. DFT Computations
2.2. Synthesis and Characterization of Colloidal Silver Nanoparticles
2.3. Samples Preparation for SERS Analysis
3. Results
3.1. DFT Calculations
3.2. Synthesis and Characterization of SERS Substrates
3.3. SERS Measurements
4. Discussion
5. Conclusions
Supplementary Materials
Author Contributions
Funding
Institutional Review Board Statement
Informed Consent Statement
Data Availability Statement
Conflicts of Interest
References
- Alešković, M.; Šekutor, M. Overcoming Barriers with Non-Covalent Interactions: Supramolecular Recognition of Adamantyl Cucurbit[n]Uril Assemblies for Medical Applications. RSC Med. Chem. 2024, 15, 433–471. [Google Scholar] [CrossRef] [PubMed]
- Cheng, G.; Luo, J.; Liu, Y.; Chen, X.; Wu, Z.; Chen, T. Cucurbituril-Oriented Nanoplatforms in Biomedical Applications. ACS Appl. Bio Mater. 2020, 3, 8211–8240. [Google Scholar] [CrossRef]
- Sanku, R.K.K.; Karakus, O.O.; Ilies, M.; Ilies, M.A. Inclusion Complexes in Drug Delivery and Drug Targeting: Formation, Characterization, and Biological Applications. In Targeted Nanosystems for Therapeutic Applications: New Concepts, Dynamic Properties, Efficiency, and Toxicity; American Chemical Society: Washington, DC, USA, 2019; pp. 187–221. [Google Scholar]
- Yin, H.; Zhang, X.; Wei, J.; Lu, S.; Bardelang, D.; Wang, R. Recent Advances in Supramolecular Antidotes. Theranostics 2021, 11, 1513–1526. [Google Scholar] [CrossRef] [PubMed]
- Biedermann, F.; Nau, W.M. Noncovalent Chirality Sensing Ensembles for the Detection and Reaction Monitoring of Amino Acids, Peptides, Proteins, and Aromatic Drugs. Angew. Chemie Int. Ed. 2014, 53, 5694–5699. [Google Scholar] [CrossRef] [PubMed]
- Borisov, Y.A.; Kiselev, S.S. Structuring of Molecules of Water and Hydroxonium Ion in the Cucurbit[7]Uril Portal. Theoretical Study of Structure, Electronic Properties and Energy. Comput. Theor. Chem. 2021, 1197, 113141. [Google Scholar] [CrossRef]
- He, S.; Sun, X.; Zhang, H. Influence of the Protonation State on the Binding Mode of Methyl Orange with Cucurbiturils. J. Mol. Struct. 2016, 1107, 182–188. [Google Scholar] [CrossRef]
- Ma, F.; Zheng, X.; Xie, J.; Li, Z. Binding Properties of Cucurbit[7]Uril to Neutral and Protonated Amino Acids: A Theoretical Study. Int. J. Quantum Chem. 2021, 121, e26491. [Google Scholar] [CrossRef]
- Nau, W.M.; Florea, M.; Assaf, K.I. Deep Inside Cucurbiturils: Physical Properties and Volumes of Their Inner Cavity Determine the Hydrophobic Driving Force for Host–Guest Complexation. Isr. J. Chem. 2011, 51, 559–577. [Google Scholar] [CrossRef]
- Das, D.; Assaf, K.I.; Nau, W.M. Applications of Cucurbiturils in Medicinal Chemistry and Chemical Biology. Front. Chem. 2019, 7. [Google Scholar] [CrossRef]
- Miskolczy, Z.; Megyesi, M.; Biczók, L.; Prabodh, A.; Biedermann, F. Kinetics and Mechanism of Cation-Induced Guest Release from Cucurbit[7]Uril. Chem. A Eur. J. 2020, 26, 7433–7441. [Google Scholar] [CrossRef]
- Miskolczy, Z.; Megyesi, M.; Biczók, L. Kinetics of Base-Promoted Transformation of Berberrubine-Cucurbit[7]Uril Inclusion Complex: Active Role of Alkali Cations. J. Mol. Liq. 2023, 385, 122354. [Google Scholar] [CrossRef]
- Kim, J.; Jung, I.-S.; Kim, S.-Y.; Lee, E.; Kang, J.-K.; Sakamoto, S.; Yamaguchi, K.; Kim, K. New Cucurbituril Homologues: Syntheses, Isolation, Characterization, and X-Ray Crystal Structures of Cucurbit[ n ]Uril ( n = 5, 7, and 8). J. Am. Chem. Soc. 2000, 122, 540–541. [Google Scholar] [CrossRef]
- Dračínský, M.; Hurtado, C.S.; Masson, E.; Kaleta, J. Stuffed Pumpkins: Mechanochemical Synthesis of Host–Guest Complexes with Cucurbit[7]Uril. Chem. Commun. 2021, 57, 2132–2135. [Google Scholar] [CrossRef] [PubMed]
- Mandadapu, V.; Day, A.I.; Ghanem, A. Cucurbituril: Chiral Applications. Chirality 2014, 26, 712–723. [Google Scholar] [CrossRef]
- Masson, E.; Ling, X.; Joseph, R.; Kyeremeh-Mensah, L.; Lu, X. Cucurbituril Chemistry: A Tale of Supramolecular Success. RSC Adv. 2012, 2, 1213–1247. [Google Scholar] [CrossRef]
- Nau, W.M.; Scherman, O. The World of Cucurbiturils—From Peculiarity to Commodity. Isr. J. Chem. 2011, 51, 492–494. [Google Scholar] [CrossRef]
- Cao, L.; Hettiarachchi, G.; Briken, V.; Isaacs, L. Cucurbit[7]Uril Containers for Targeted Delivery of Oxaliplatin to Cancer Cells. Angew. Chemie Int. Ed. 2013, 52, 12033–12037. [Google Scholar] [CrossRef]
- Zhao, Y.; Buck, D.P.; Morris, D.L.; Pourgholami, M.H.; Day, A.I.; Collins, J.G. Solubilisation and Cytotoxicity of Albendazole Encapsulated in Cucurbit[n]Uril. Org. Biomol. Chem. 2008, 6, 4509. [Google Scholar] [CrossRef]
- Miskolczy, Z.; Megyesi, M.; Tárkányi, G.; Mizsei, R.; Biczók, L. Inclusion Complex Formation of Sanguinarinealkaloid with Cucurbit[7]Uril: Inhibition of Nucleophilic Attack and Photooxidation. Org. Biomol. Chem. 2011, 9, 1061–1070. [Google Scholar] [CrossRef]
- El-Sheshtawy, H.S.; Chatterjee, S.; Assaf, K.I.; Shinde, M.N.; Nau, W.M.; Mohanty, J. A Supramolecular Approach for Enhanced Antibacterial Activity and Extended Shelf-Life of Fluoroquinolone Drugs with Cucurbit[7]Uril. Sci. Rep. 2018, 8, 13925. [Google Scholar] [CrossRef]
- Gamal-Eldin, M.A.; Macartney, D.H. Cucurbit[7]Uril Host−guest Complexations of Steroidal Neuromuscular Blocking Agents in Aqueous Solution. Can. J. Chem. 2014, 92, 243–249. [Google Scholar] [CrossRef]
- Li, W.; Li, S.; Wyman, I.W.; Macartney, D.H.; Zhang, Q.; Zheng, Y.; Wang, R. Supramolecular Encapsulation of Vitamin B 6 by Macrocyclic Nanocontainer Cucurbit[7]Uril. J. Nanomater. 2015, 2015. [Google Scholar] [CrossRef]
- Jallinoja, V.I.J.; Carney, B.D.; Bhatt, K.; Abbriano, C.H.; Schlyer, D.J.; Yazaki, P.J.; Houghton, J.L. Investigation of Copper-64-Based Host–Guest Chemistry Pretargeted Positron Emission Tomography. Mol. Pharm. 2022, 19, 2268–2278. [Google Scholar] [CrossRef]
- Jallinoja, V.I.J.; Carney, B.D.; Zhu, M.; Bhatt, K.; Yazaki, P.J.; Houghton, J.L. Cucurbituril–Ferrocene: Host–Guest Based Pretargeted Positron Emission Tomography in a Xenograft Model. Bioconjug. Chem. 2021, 32, 1554–1558. [Google Scholar] [CrossRef] [PubMed]
- Sasmal, R.; Das Saha, N.; Pahwa, M.; Rao, S.; Joshi, D.; Inamdar, M.S.; Sheeba, V.; Agasti, S.S. Synthetic Host–Guest Assembly in Cells and Tissues: Fast, Stable, and Selective Bioorthogonal Imaging via Molecular Recognition. Anal. Chem. 2018, 90, 11305–11314. [Google Scholar] [CrossRef]
- Yang, X.; Varini, K.; Godard, M.; Gassiot, F.; Sonnette, R.; Ferracci, G.; Pecqueux, B.; Monnier, V.; Charles, L.; Maria, S.; et al. Preparation and In Vitro Validation of a Cucurbit[7]Uril-Peptide Conjugate Targeting the LDL Receptor. J. Med. Chem. 2023, 66, 8844–8857. [Google Scholar] [CrossRef]
- Kim, K.L.; Sung, G.; Sim, J.; Murray, J.; Li, M.; Lee, A.; Shrinidhi, A.; Park, K.M.; Kim, K. Supramolecular Latching System Based on Ultrastable Synthetic Binding Pairs as Versatile Tools for Protein Imaging. Nat. Commun. 2018, 9, 1712. [Google Scholar] [CrossRef] [PubMed]
- Bockus, A.T.; Smith, L.C.; Grice, A.G.; Ali, O.A.; Young, C.C.; Mobley, W.; Leek, A.; Roberts, J.L.; Vinciguerra, B.; Isaacs, L.; et al. Cucurbit[7]Uril–Tetramethylrhodamine Conjugate for Direct Sensing and Cellular Imaging. J. Am. Chem. Soc. 2016, 138, 16549–16552. [Google Scholar] [CrossRef]
- Wagner, B.D.; Stojanovic, N.; Day, A.I.; Blanch, R.J. Host Properties of Cucurbit[7]Uril: Fluorescence Enhancement of Anilinonaphthalene Sulfonates. J. Phys. Chem. B 2003, 107, 10741–10746. [Google Scholar] [CrossRef]
- Koner, A.L.; Nau, W.M. Cucurbituril Encapsulation of Fluorescent Dyes. Supramol. Chem. 2007, 19, 55–66. [Google Scholar] [CrossRef]
- Barooah, N.; Mohanty, J.; Bhasikuttan, A.C. Cucurbituril-Based Supramolecular Assemblies: Prospective on Drug Delivery, Sensing, Separation, and Catalytic Applications. Langmuir 2022, 38, 6249–6264. [Google Scholar] [CrossRef] [PubMed]
- Hu, C.; Grimm, L.; Prabodh, A.; Baksi, A.; Siennicka, A.; Levkin, P.A.; Kappes, M.M.; Biedermann, F. Covalent Cucurbit[7]Uril–Dye Conjugates for Sensing in Aqueous Saline Media and Biofluids. Chem. Sci. 2020, 11, 11142–11153. [Google Scholar] [CrossRef] [PubMed]
- Kumar, N.M.; Gruhs, P.; Casini, A.; Biedermann, F.; Moreno-Alcántar, G.; Picchetti, P. Electrochemical Detection of Drugs via a Supramolecular Cucurbit[7]Uril-Based Indicator Displacement Assay. ACS Sensors 2023, 8, 2525–2532. [Google Scholar] [CrossRef] [PubMed]
- Hu, C.; Jochmann, T.; Chakraborty, P.; Neumaier, M.; Levkin, P.A.; Kappes, M.M.; Biedermann, F. Further Dimensions for Sensing in Biofluids: Distinguishing Bioorganic Analytes by the Salt-Induced Adaptation of a Cucurbit[7]Uril-Based Chemosensor. J. Am. Chem. Soc. 2022, 144, 13084–13095. [Google Scholar] [CrossRef] [PubMed]
- Hennig, A.; Bakirci, H.; Nau, W.M. Label-Free Continuous Enzyme Assays with Macrocycle-Fluorescent Dye Complexes. Nat. Methods 2007, 4, 629–632. [Google Scholar] [CrossRef]
- Bailey, D.M.; Hennig, A.; Uzunova, V.D.; Nau, W.M. Supramolecular Tandem Enzyme Assays for Multiparameter Sensor Arrays and Enantiomeric Excess Determination of Amino Acids. Chem. A Eur. J. 2008, 14, 6069–6077. [Google Scholar] [CrossRef]
- Truxal, A.E.; Cao, L.; Isaacs, L.; Wemmer, D.E.; Pines, A. Directly Functionalized Cucurbit[7]Uril as a Biosensor for the Selective Detection of Protein Interactions by 129 Xe HyperCEST NMR. Chem. A Eur. J. 2019, 25, 6108–6112. [Google Scholar] [CrossRef]
- Geng, Q.-X.; Cong, H.; Tao, Z.; Lindoy, L.F.; Wei, G. Cucurbit[7]Uril-Improved Recognition by a Fluorescent Sensor for Cadmium and Zinc Cations. Supramol. Chem. 2016, 28, 784–791. [Google Scholar] [CrossRef]
- Magna, G.; Stefanelli, M.; Pomarico, G.; Naitana, M.L.; Monti, D.; Di Natale, C.; Paolesse, R. Chiral Recognition with Broad Selective Sensor Arrays. Chemosensors 2022, 10, 308. [Google Scholar] [CrossRef]
- Chen, X.; Hu, N.; Wei, H.; Wang, H. Chiral Fluorescent Recognition by Naphthalimide. J. Fluoresc. 2020, 30, 679–685. [Google Scholar] [CrossRef]
- Aav, R.; Mishra, K. The Breaking of Symmetry Leads to Chirality in Cucurbituril-Type Hosts. Symmetry (Basel). 2018, 10, 98. [Google Scholar] [CrossRef]
- Hennig, A.; Nau, W.M. Interaction of Cucurbit[7]Uril With Protease Substrates: Application to Nanosecond Time-Resolved Fluorescence Assays. Front. Chem. 2020, 8. [Google Scholar] [CrossRef] [PubMed]
- Grybinik, S.; Bosakova, Z. An Overview of Chiral Separations of Pharmaceutically Active Substances by HPLC (2018–2020). Monatshefte für Chemie Chem. Mon. 2021, 152, 1033–1043. [Google Scholar] [CrossRef] [PubMed]
- Al-Sulaimi, S.; Kushwah, R.; Abdullah Alsibani, M.; El Jery, A.; Aldrdery, M.; Ashraf, G.A. Emerging Developments in Separation Techniques and Analysis of Chiral Pharmaceuticals. Molecules 2023, 28, 6175. [Google Scholar] [CrossRef] [PubMed]
- Ali, I.; Suhail, M.; Alothman, Z.A.; Alwarthan, A. Chiral Separation and Modeling of Baclofen, Bupropion, and Etodolac Profens on Amylose Reversed Phase Chiral Column. Chirality 2017, 29, 386–397. [Google Scholar] [CrossRef]
- Hembury, G.A.; Borovkov, V.V.; Inoue, Y. Chirality-Sensing Supramolecular Systems. Chem. Rev. 2008, 108, 1–73. [Google Scholar] [CrossRef]
- Ariga, K.; Richards, G.J.; Ishihara, S.; Izawa, H.; Hill, J.P. Intelligent Chiral Sensing Based on Supramolecular and Interfacial Concepts. Sensors 2010, 10, 6796–6820. [Google Scholar] [CrossRef]
- Yuan, L.; Wang, R.; Macartney, D.H. Chiroptic Behaviour of a Chiral Guest in an Achiral Cucurbit[7]Uril Host. Tetrahedron Asymmetry 2007, 18, 483–487. [Google Scholar] [CrossRef]
- Rekharsky, M.V.; Yamamura, H.; Inoue, C.; Kawai, M.; Osaka, I.; Arakawa, R.; Shiba, K.; Sato, A.; Ko, Y.H.; Selvapalam, N.; et al. Chiral Recognition in Cucurbituril Cavities. J. Am. Chem. Soc. 2006, 128, 14871–14880. [Google Scholar] [CrossRef]
- Shewale, M.N.; Lande, D.N.; Gejji, S.P. Encapsulation of Benzimidazole Derivatives within Cucurbit[7]Uril: Density Functional Investigations. J. Mol. Liq. 2016, 216, 309–317. [Google Scholar] [CrossRef]
- Koner, A.L.; Ghosh, I.; Saleh, N.; Nau, W.M. Supramolecular Encapsulation of Benzimidazole-Derived Drugs by Cucurbit[7]Uril. Can. J. Chem. 2011, 89, 139–147. [Google Scholar] [CrossRef]
- Assaf, K.I.; Nau, W.M. Cucurbiturils: From Synthesis to High-Affinity Binding and Catalysis. Chem. Soc. Rev. 2015, 44, 394–418. [Google Scholar] [CrossRef] [PubMed]
- McInnes, F.J.; Anthony, N.G.; Kennedy, A.R.; Wheate, N.J. Solid State Stabilisation of the Orally Delivered Drugs Atenolol, Glibenclamide, Memantine and Paracetamol through Their Complexation with Cucurbit[7]Uril. Org. Biomol. Chem. 2010, 8, 765. [Google Scholar] [CrossRef]
- Maia, P.P.; Guimarães, L.; Nascimento, C.S. Elucidation of the Enantiomer Migration Order of Atenolol by Theoretical Calculations. Struct. Chem. 2024, 35, 1589–1594. [Google Scholar] [CrossRef]
- Farcaș, A.; Iacoviță, C.; Vințeler, E.; Chiș, V.; Știufiuc, R.; Lucaciu, C.M.; Farcas, A.; Iacovita, C.; Vinteler, E.; Chis, V.; et al. The Influence of Molecular Structure Modifications on Vibrational Properties of Some Beta Blockers: A Combined Raman and DFT Study. J. Spectrosc. 2016, 2016, 1–9. [Google Scholar] [CrossRef]
- Știufiuc, G.F.; Toma, V.; Onaciu, A.; Chiș, V.; Lucaciu, C.M.; Știufiuc, R.I. Proving Nanoscale Chiral Interactions of Cyclodextrins and Propranolol Enantiomers by Means of SERS Measurements Performed on a Solid Plasmonic Substrate. Pharmaceutics 2021, 13, 1594. [Google Scholar] [CrossRef] [PubMed]
- Stiufiuc, R.; Iacovita, C.; Lucaciu, C.M.; Stiufiuc, G.; Nicoara, R.; Oltean, M.; Chis, V.; Bodoki, E. Adsorption Geometry of Propranolol Enantiomers on Silver Nanoparticles. J. Mol. Struct. 2013, 1031, 201–206. [Google Scholar] [CrossRef]
- Bodoki, E.; Oltean, M.; Bodoki, A.; Ştiufiuc, R. Chiral Recognition and Quantification of Propranolol Enantiomers by Surface Enhanced Raman Scattering through Supramolecular Interaction with β-Cyclodextrin. Talanta 2012, 101, 53–58. [Google Scholar] [CrossRef]
- Stiufiuc, R.; Iacovita, C.; Stiufiuc, G.; Bodoki, E.; Chis, V.; Lucaciu, C.M. Surface Mediated Chiral Interactions between Cyclodextrins and Propranolol Enantiomers: A SERS and DFT Study. Phys. Chem. Chem. Phys. 2015, 17, 1281–1289. [Google Scholar] [CrossRef]
- Iacovita, C.; Toma, V.; Vedeanu, N.S.; Știufiuc, R.-I.; Lucaciu, C.M. Microwave, Ultrasound-Assisted, and Room Temperature One-Pot Synthesis of Silver and Gold Colloids Using Beta-Cyclodextrin as a Reducing and Capping Agent for SERS Applications. Appl. Sci. 2024, 14, 8215. [Google Scholar] [CrossRef]
- Smith, E.; Dent, G. Modern Raman Spectroscopy—A Practical Approach; Wiley: Hoboken, NJ, USA, 2004; ISBN 9780471496687. [Google Scholar]
- Bergin, F.J.; Shurvell, H.F. Industrial Applications of IR and Raman Spectroscopy. Anal. Proc. 1989, 26, 263. [Google Scholar] [CrossRef]
- Vankeirsbilck, T.; Vercauteren, A.; Baeyens, W.; Van der Weken, G.; Verpoort, F.; Vergote, G.; Remon, J. Applications of Raman Spectroscopy in Pharmaceutical Analysis. TrAC Trends Anal. Chem. 2002, 21, 869–877. [Google Scholar] [CrossRef]
- Ali, A.; Nawaz, H.; Irfan Majeed, M.; Ghamkhar, M. Quantitative Analysis of Solid Dosage Forms of Atenolol by Raman Spectroscopy. Drug Dev. Ind. Pharm. 2024, 50, 619–627. [Google Scholar] [CrossRef] [PubMed]
- Sigle, D.O.; Kasera, S.; Herrmann, L.O.; Palma, A.; de Nijs, B.; Benz, F.; Mahajan, S.; Baumberg, J.J.; Scherman, O.A. Observing Single Molecules Complexing with Cucurbit[7]Uril through Nanogap Surface-Enhanced Raman Spectroscopy. J. Phys. Chem. Lett. 2016, 7, 704–710. [Google Scholar] [CrossRef] [PubMed]
- Chen, Y.; Klimczak, A.; Galoppini, E.; Lockard, J.V. Structural Interrogation of a Cucurbit[7]Uril-Ferrocene Host–Guest Complex in the Solid State: A Raman Spectroscopy Study. RSC Adv. 2013, 3, 1354–1358. [Google Scholar] [CrossRef]
- Kasera, S.; Herrmann, L.O.; del Barrio, J.; Baumberg, J.J.; Scherman, O.A. Quantitative Multiplexing with Nano-Self-Assemblies in SERS. Sci. Rep. 2014, 4, 6785. [Google Scholar] [CrossRef]
- Taylor, R.W.; Lee, T.-C.; Scherman, O.A.; Esteban, R.; Aizpurua, J.; Huang, F.M.; Baumberg, J.J.; Mahajan, S. Precise Subnanometer Plasmonic Junctions for SERS within Gold Nanoparticle Assemblies Using Cucurbit[ n ]Uril “Glue”. ACS Nano 2011, 5, 3878–3887. [Google Scholar] [CrossRef]
- Tao, C.; An, Q.; Zhu, W.; Yang, H.; Li, W.; Lin, C.; Xu, D.; Li, G. Cucurbit[n]Urils as a SERS Hot-Spot Nanocontainer through Bridging Gold Nanoparticles. Chem. Commun. 2011, 47, 9867. [Google Scholar] [CrossRef]
- Kasera, S.; Biedermann, F.; Baumberg, J.J.; Scherman, O.A.; Mahajan, S. Quantitative SERS Using the Sequestration of Small Molecules Inside Precise Plasmonic Nanoconstructs. Nano Lett. 2012, 12, 5924–5928. [Google Scholar] [CrossRef]
- Chio, W.-I.K.; Liu, J.; Jones, T.; Perumal, J.; Dinish, U.S.; Parkin, I.P.; Olivo, M.; Lee, T.-C. SERS Multiplexing of Methylxanthine Drug Isomers via Host–Guest Size Matching and Machine Learning. J. Mater. Chem. C 2021, 9, 12624–12632. [Google Scholar] [CrossRef]
- Dapprich, S.; Komáromi, I.; Byun, K.S.; Morokuma, K.; Frisch, M.J. A New ONIOM Implementation in Gaussian98. Part I. The Calculation of Energies, Gradients, Vibrational Frequencies and Electric Field Derivatives. J. Mol. Struct. Theochem 1999, 461–462, 1–21. [Google Scholar] [CrossRef]
- Leopold, N.; Lendl, B. A New Method for Fast Preparation of Highly Surface-Enhanced Raman Scattering (SERS) Active Silver Colloids at Room Temperature by Reduction of Silver Nitrate with Hydroxylamine Hydrochloride. J. Phys. Chem. B 2003, 107, 5723–5727. [Google Scholar] [CrossRef]
- Trefry, J.C.; Monahan, J.L.; Weaver, K.M.; Meyerhoefer, A.J.; Markopolous, M.M.; Arnold, Z.S.; Wooley, D.P.; Pavel, I.E. Size Selection and Concentration of Silver Nanoparticles by Tangential Flow Ultrafiltration for SERS-Based Biosensors. J. Am. Chem. Soc. 2010, 132, 10970–10972. [Google Scholar] [CrossRef]
- Anders, C.B.; Baker, J.D.; Stahler, A.C.; Williams, A.J.; Sisco, J.N.; Trefry, J.C.; Wooley, D.P.; Pavel Sizemore, I.E. Tangential Flow Ultrafiltration: A “Green” Method for the Size Selection and Concentration of Colloidal Silver Nanoparticles. J. Vis. Exp. 2012, 4167. [Google Scholar] [CrossRef]
- Știufiuc, G.F.; Toma, V.; Buse, M.; Mărginean, R.; Morar-Bolba, G.; Culic, B.; Tetean, R.; Leopold, N.; Pavel, I.; Lucaciu, C.M.C.M.; et al. Solid Plasmonic Substrates for Breast Cancer Detection by Means of SERS Analysis of Blood Plasma. Nanomaterials 2020, 10, 1212. [Google Scholar] [CrossRef]
- Schneider, C.A.; Rasband, W.S.; Eliceiri, K.W. NIH Image to ImageJ: 25 Years of Image Analysis. Nat. Methods 2012, 9, 671–675. [Google Scholar] [CrossRef]
- Calkin, H.L. United States Patent Office. Palimpsest (Iowa. City). 1969, 50, 369–373. [Google Scholar] [CrossRef]
- Corey, R.B.; Pauling, L. Molecular Models of Amino Acids, Peptides, and Proteins. Rev. Sci. Instrum. 1953, 24, 621–627. [Google Scholar] [CrossRef]
- Chio, W.-I.K.; Moorthy, S.; Perumal, J.; Dinish, U.S.; Parkin, I.P.; Olivo, M.; Lee, T.-C. Dual-Triggered Nanoaggregates of Cucurbit[7]Uril and Gold Nanoparticles for Multi-Spectroscopic Quantification of Creatinine in Urinalysis. J. Mater. Chem. C 2020, 8, 7051–7058. [Google Scholar] [CrossRef]
- Mahajan, S.; Lee, T.-C.; Biedermann, F.; Hugall, J.T.; Baumberg, J.J.; Scherman, O.A. Raman and SERS Spectroscopy of Cucurbit[n]Urils. Phys. Chem. Chem. Phys. 2010, 12, 10429. [Google Scholar] [CrossRef]
- Cozar, I.B.; Szabó, L.; Leopold, N.; Chiş, V.; David, L. Raman, Sers and Dft Study of Atenolol and Metoprolol Cardiovascular Drugs. Rom. Reports Phys. 2010, 55, 772–781. [Google Scholar]
- Al-Burtomani, S.K.S.; Suliman, F.O. Inclusion Complexes of Norepinephrine with β-Cyclodextrin, 18-Crown-6 and Cucurbit[7]Uril: Experimental and Molecular Dynamics Study. RSC Adv. 2017, 7, 9888–9901. [Google Scholar] [CrossRef]
- Onaciu, A.; Toma, V.; Moldovan, C.; Țigu, A.B.; Cenariu, D.; Culic, C.; Borșa, R.M.; David, L.; Știufiuc, G.F.; Tetean, R.; et al. Nanoscale Investigation of DNA Demethylation in Leukemia Cells by Means of Ultrasensitive Vibrational Spectroscopy. Sensors 2022, 23, 346. [Google Scholar] [CrossRef] [PubMed]
- Borșa, R.-M.; Toma, V.; Onaciu, A.; Moldovan, C.-S.; Mărginean, R.; Cenariu, D.; Știufiuc, G.-F.; Dinu, C.-M.; Bran, S.; Opriș, H.-O.; et al. Developing New Diagnostic Tools Based on SERS Analysis of Filtered Salivary Samples for Oral Cancer Detection. Int. J. Mol. Sci. 2023, 24, 12125. [Google Scholar] [CrossRef]
- Munteanu, V.C.; Munteanu, R.A.; Gulei, D.; Mărginean, R.; Schițcu, V.H.; Onaciu, A.; Toma, V.; Știufiuc, G.F.; Coman, I.; Știufiuc, R.I. New Insights into the Multivariate Analysis of SER Spectra Collected on Blood Samples for Prostate Cancer Detection: Towards a Better Understanding of the Role Played by Different Biomolecules on Cancer Screening: A Preliminary Study. Cancers 2022, 14, 3227. [Google Scholar] [CrossRef]
- Pal, S.; Kundu, T.K. Stability Analysis and Frontier Orbital Study of Different Glycol and Water Complex. ISRN Phys. Chem. 2013, 2013, 1–16. [Google Scholar] [CrossRef]
- Lü, J.; Lin, J.-X.; Cao, M.-N.; Cao, R. Cucurbituril: A Promising Organic Building Block for the Design of Coordination Compounds and Beyond. Coord. Chem. Rev. 2013, 257, 1334–1356. [Google Scholar] [CrossRef]


| Conformer | ΔG (kcal/mol) | Boltzmann Factor | Boltzmann Populations (%) |
|---|---|---|---|
| R-Ate U | 0.851 | 0.238 | 9.60% |
| R-Ate Z | 0.000 | 1.000 | 40.40% |
| S-Ate U | 0.851 | 0.238 | 9.60% |
| S-Ate Z | 0.000 | 1.000 | 40.40% |
| Experimental SERS Vibrational Band (cm−1) | Calculated Raman Vibrational Band (cm−1) | Molecular Group Vibration of R/S-Ate and CB[7] Individual Spectra (Literature) | Molecular Group Vibration of R/S-Ate and CB[7] Individual Spectra (DFT Computations) |
|---|---|---|---|
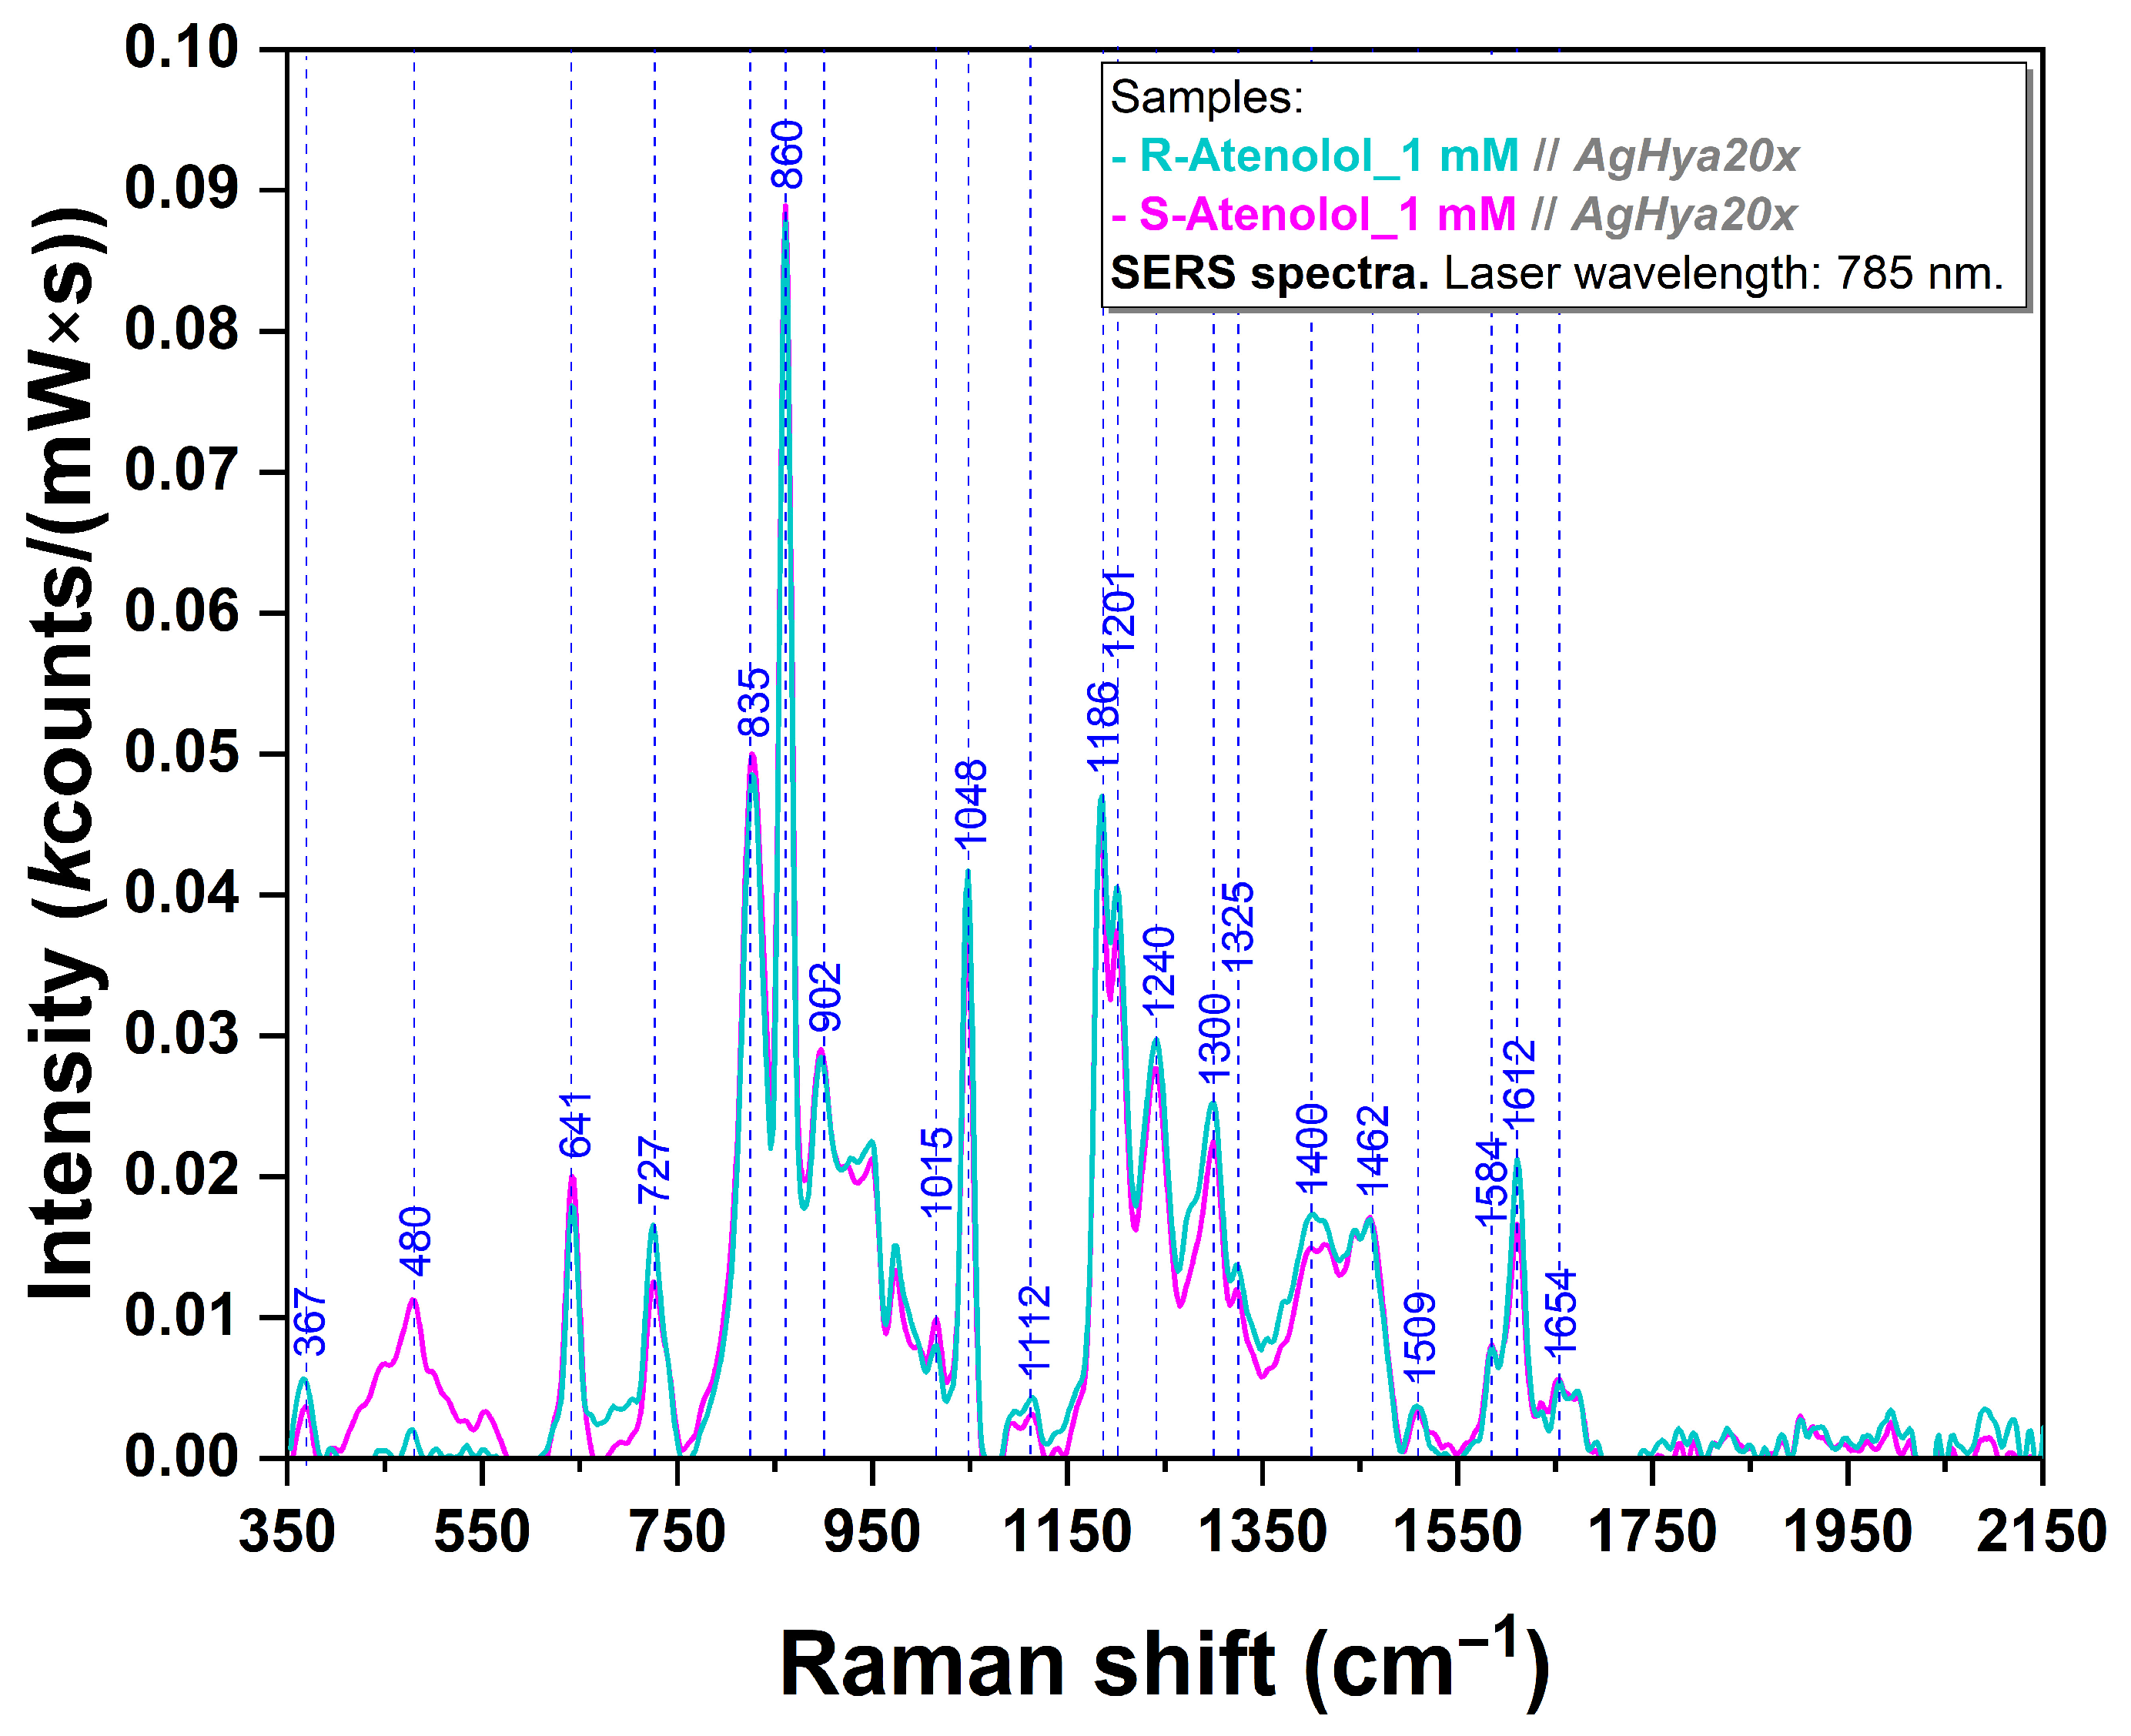
| 367 | 368 | ρ(N5H2), ρ(C18H2) [56] | γ(ring-O), δ(CCNH2) |
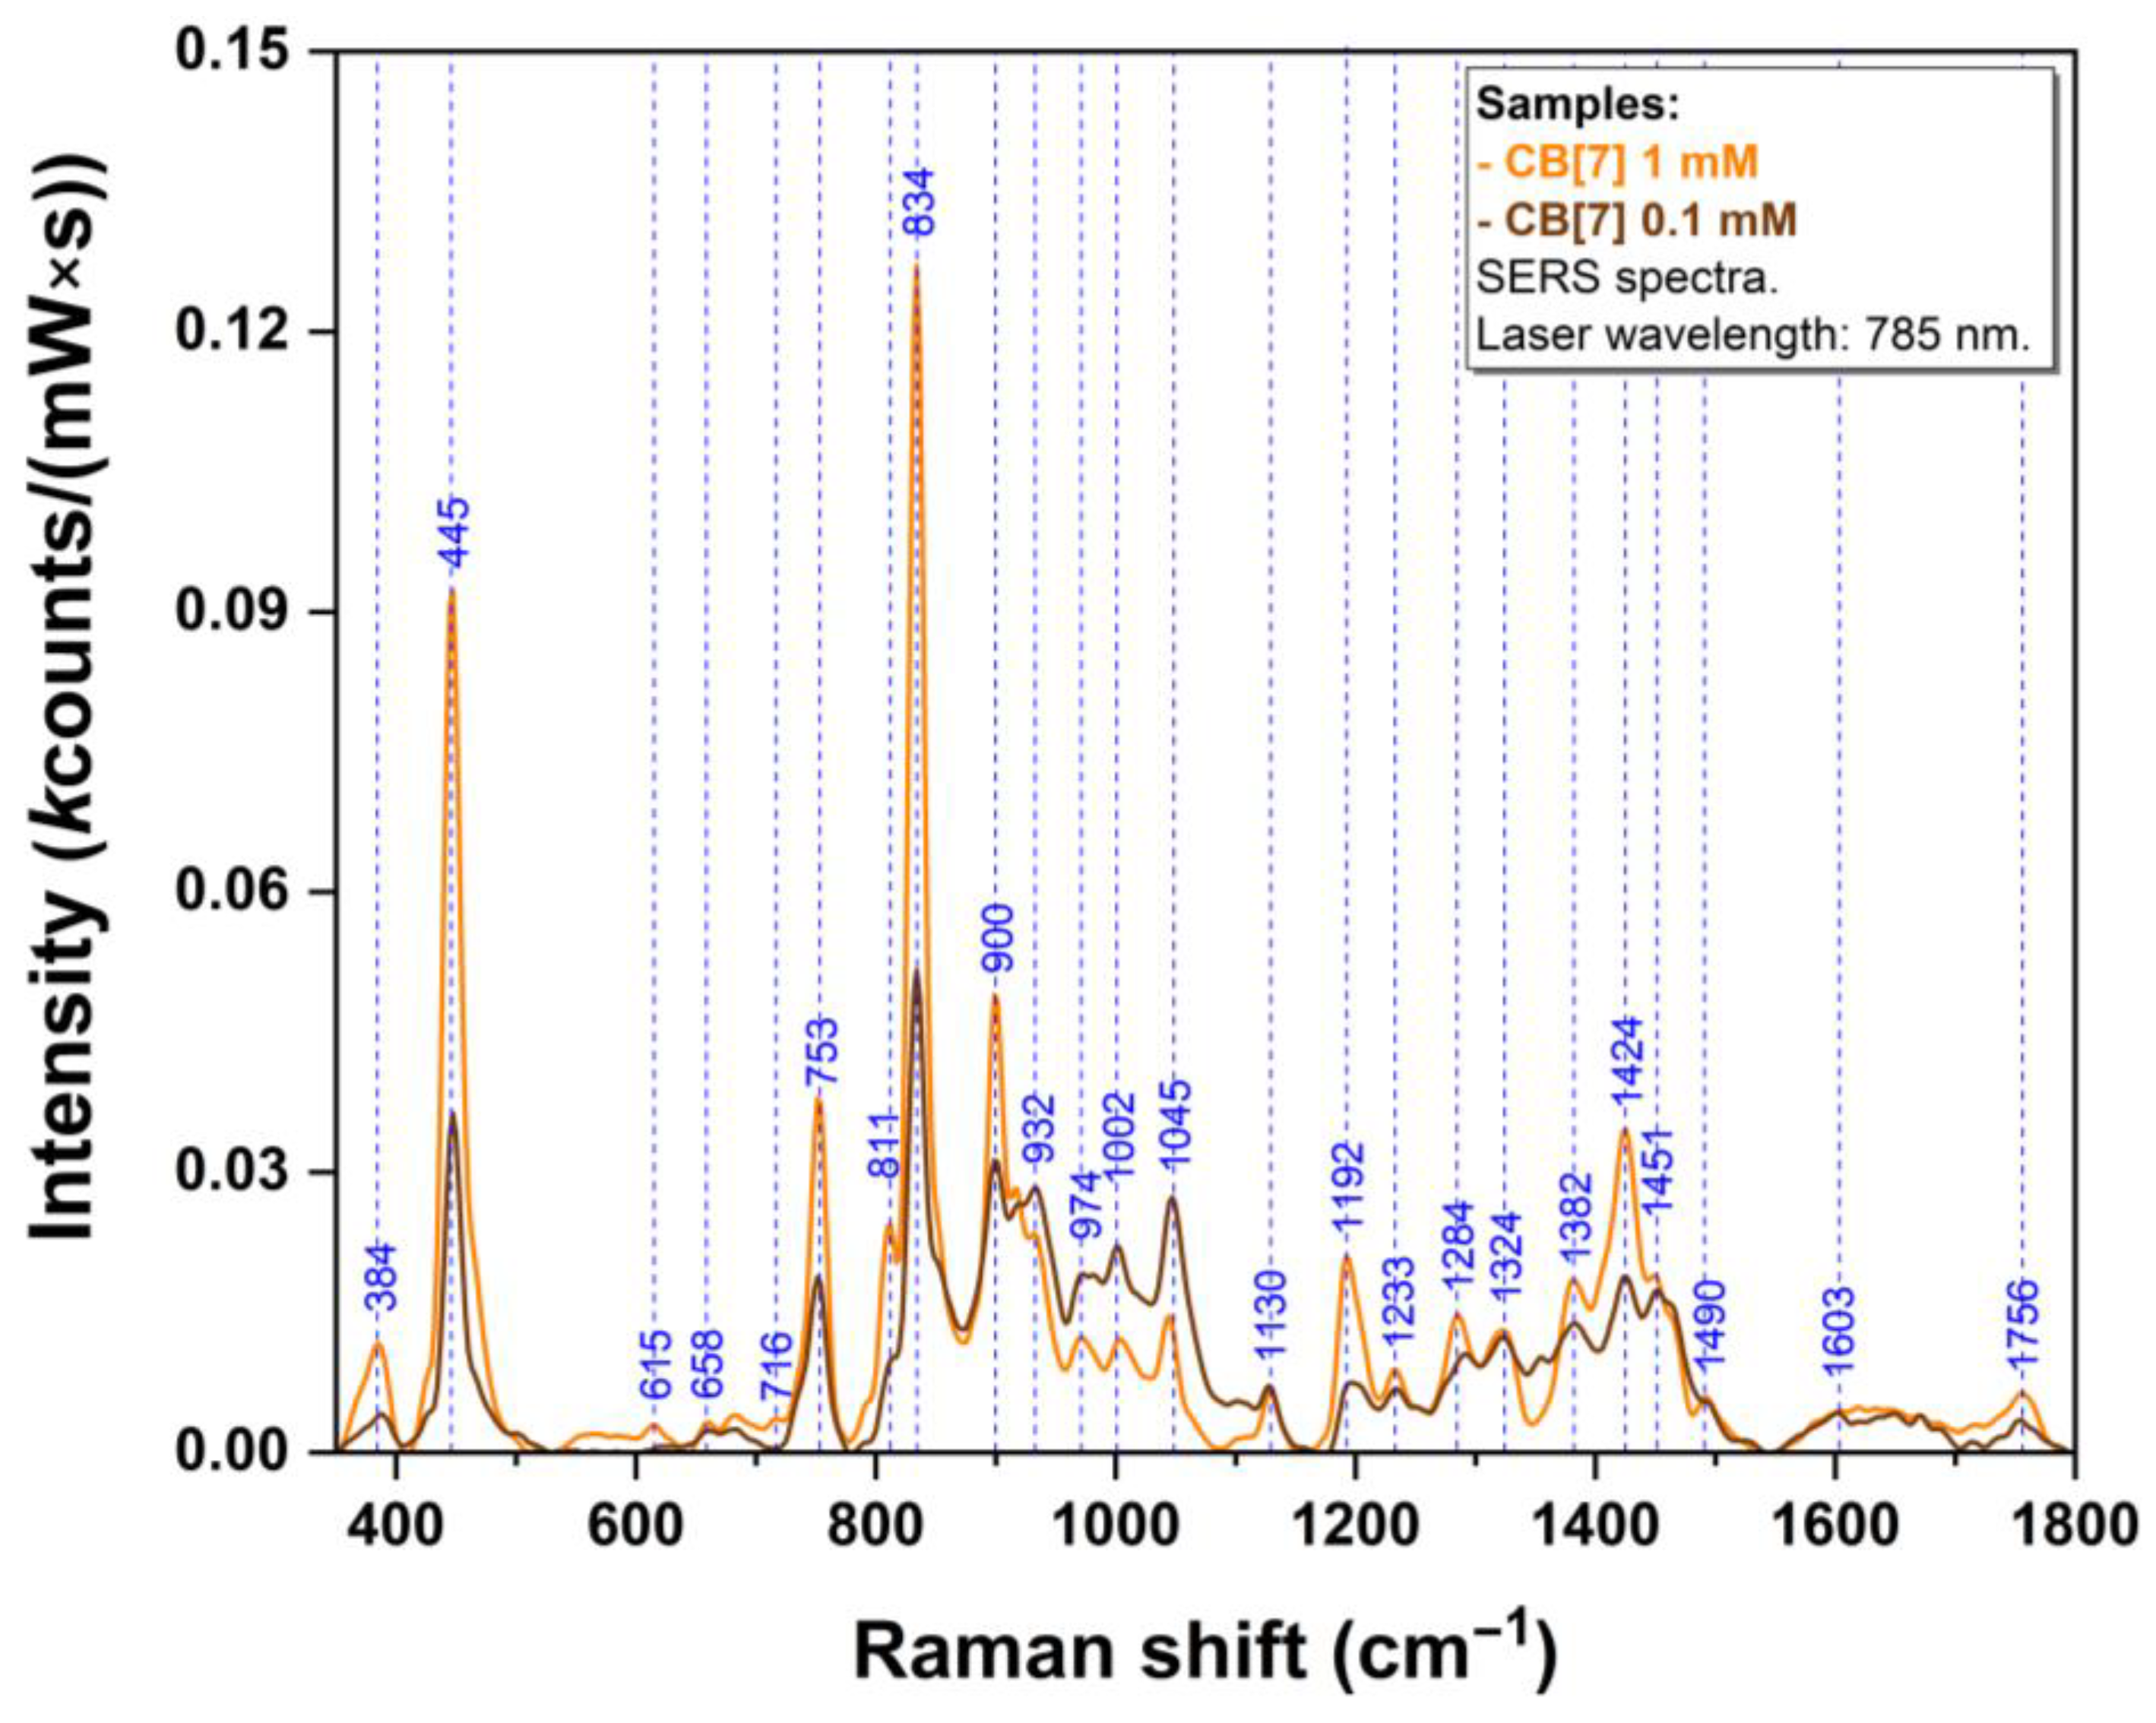
| 445 | 434 | σ (ring) [66,67,81,82] | Vertical δ(N-C-N) |
| 480 | - | ρ(C9H2) [56] | - |
| 641 | 653 | in plane ring deformation, δ(CCC ring), τ(N5H2) [56,65,83] | δ(CCC ring), τ(NH2) |
| 658 | 660 | τ(HC–CH) [82] | Vertical scissoring |
| 727 | 742 | ω(CCC ring), ρ(N5H2), δ(NH) [56,65] | γ(ring) |
| 753 | 753 | - | γ(C=O) in CB[7] |
| 834/835 | 832/841 | γ(CH ring), ρ(N5H2), δ(CCC ring) in R/S-Ate [56,83,84] Ring breathing, δ(C–N–C), ρ(CH2) in CB[7] [66,81,82] | γ(ring) in R/S-Ate δ(N-C-N) in CB[7] |
| 860 | 863 | ν(C7C9) in R/S-Ate [56,65,83] | ρ(CH3), β(NH) in R/S-Ate |
| 900/902 | 898/886 | Ring deformation in R/S-Ate [84] β(C–N–C), τ(N–C–C–N), ν(C–C) in CB[7] [82] | Ring breathing in R/S-Ate ρ(CH2) in CB[7] |
| 974 | 950/968 | - | ν(CC)ring, ρ(CH2) in CB[7] |
| 1045/1048 | 1052/1054 | ρ(N5H2) in R/S-Ate [56] | ν(O-CH2), ρ(CH3) in R/S-Ate horizontal scissoring in CB[7] |
| 1186 | 1179 | ν(C13C18), ω(C18H2), ν(CCC) [56,65] | ν(Cring-O), δ(CCC ring), ω(CH2) |
| 1192 | 1207 | - | ν(H2C-N) |
| 1201 | 1196 | ν(C6O7), δ(CH ring), ν(CC ring), δ(CH2), δ(CCC) [65,83] | τ(CH2), δ(OH) |
| 1233 | 1247 | - | ν(C-N) in CB[7] |
| 1240 | 1250 | δ(O10H2), δ(C11H2), δ(N12H2), ν(O1C12), δ(CCC ring) [56,83] | ω(CH2) |
| 1300 | 1305 | δ(C19N5H40), ω(C18H2) [56] | δ(OCNH2), δ(CCC ring) |
| 1324/1325 | 1341/1326 | δ(CH2),ν(CH), δ(CH3), ν(CH3), δ(C8H23), ω(C11H3) in R/S-Ate [56,83] | ν(CN), τ(CH2) in CB[7] |
| 1382 | 1402 | - | γ(CH), ω(CH2), ν(CN) |
| 1400 | - | ν(CN), νas(CN)[84] | - |
| 1424 | 1425/1444 | δ(CH3), δ(C11H2), δ(C8H2), δ(C18H2), δ(N5H2), v(CCC) in R/S-Ate [56,65,83] νas(CN) in CB[7] [82] | δ(COH), ω(CH2) in R/S-Ate β(CH2) in CB[7] |
| 1462 | 1464 | - | δ(CH3) |
| 1584 | 1572 | - | β(NH2) |
| 1612 | 1615 | ν(CC ring), δ(CH ring), δ(NH2) [56,65,83] | ν(CC ring) |
| 1756 | 1757 | - | In plane ν(C=O) |
| Experimental SERS Vibrational Band (cm−1) | Calculated Raman Vibrational Band (cm−1) | Molecular Group Vibration of R/S-Ate@CB[7] Complexes (DFT Computations) |
|---|---|---|
| 394 | 395 | ρ(ring), deformation(methythyl-amino-propoxy) in R/S-Ate |
| 449 | 433 | δ(N-C-N) in CB[7] δ(H3C-CH-CH3), ρ(N5H2) in R-Ate γ(ring), δ(H3C-CH-CH3) in S-Ate |
| 641 | 644 | vertical scissoring in CB[7] σ (ring), β(OH) in R/S-Ate |
| 719 | 704/706 | δ(NCN),ρ(CH2) in R/S-Ate |
| 753 | 745/744 | γ(C=O) in CB[7] in plane ring deformation in R-Ate γ(ring) in S-Ate |
| 835 | 830 | δ(NCN) in CB[7] |
| 860 | 856/858 | Ring breathing, δ(H2C-CO-NH2) in R/S-Ate |
| 902 | 888 | ρ(CH2) in CB[7] |
| 1048 | 1040/1041 | Horizontal scissoring in CB[7] |
| 1201 | 1213/1205 | ν(Cring-O) in R-Ate ν(Cring-CH2) in S-Ate |
| 1236 | 1233 | ν(C-N) in CB[7] |
| 1287 | 1295/1296 | in plane ring deformation, τ(CH2), ω(CH2) in R/S-Ate |
| 1325 | 1327 | ν(C-N), τ(CH2) in CB[7] |
| 1385 | 1397 | γ(CH), w(CH2), ν(CN) in CB[7] |
| 1426 | 1425/1424 | ν(CC ring) in R/S-Ate β(CH2) in CB[7] |
| 1610 | 1596 | ν(CC ring) in R/S-Ate |
| 1637 | 1630/1632 | ν(CC ring) in R/S-Ate |
Disclaimer/Publisher’s Note: The statements, opinions and data contained in all publications are solely those of the individual author(s) and contributor(s) and not of MDPI and/or the editor(s). MDPI and/or the editor(s) disclaim responsibility for any injury to people or property resulting from any ideas, methods, instructions or products referred to in the content. |
© 2024 by the authors. Licensee MDPI, Basel, Switzerland. This article is an open access article distributed under the terms and conditions of the Creative Commons Attribution (CC BY) license (https://creativecommons.org/licenses/by/4.0/).
Share and Cite
Onaciu, A.; Toma, V.; Borșa, R.-M.; Chiș, V.; Știufiuc, G.-F.; Culic, C.; Lucaciu, C.-M.; Știufiuc, R.-I. Investigating Nanoscale Interactions of Host–Guest Complexes Formed Between CB[7] and Atenolol by Quantum Chemistry and Ultrasensitive Vibrational Spectroscopy. Sensors 2024, 24, 7156. https://doi.org/10.3390/s24227156
Onaciu A, Toma V, Borșa R-M, Chiș V, Știufiuc G-F, Culic C, Lucaciu C-M, Știufiuc R-I. Investigating Nanoscale Interactions of Host–Guest Complexes Formed Between CB[7] and Atenolol by Quantum Chemistry and Ultrasensitive Vibrational Spectroscopy. Sensors. 2024; 24(22):7156. https://doi.org/10.3390/s24227156
Chicago/Turabian StyleOnaciu, Anca, Valentin Toma, Rareș-Mario Borșa, Vasile Chiș, Gabriela-Fabiola Știufiuc, Carina Culic, Constantin-Mihai Lucaciu, and Rareș-Ionuț Știufiuc. 2024. "Investigating Nanoscale Interactions of Host–Guest Complexes Formed Between CB[7] and Atenolol by Quantum Chemistry and Ultrasensitive Vibrational Spectroscopy" Sensors 24, no. 22: 7156. https://doi.org/10.3390/s24227156
APA StyleOnaciu, A., Toma, V., Borșa, R.-M., Chiș, V., Știufiuc, G.-F., Culic, C., Lucaciu, C.-M., & Știufiuc, R.-I. (2024). Investigating Nanoscale Interactions of Host–Guest Complexes Formed Between CB[7] and Atenolol by Quantum Chemistry and Ultrasensitive Vibrational Spectroscopy. Sensors, 24(22), 7156. https://doi.org/10.3390/s24227156