
Depth Video-Based Secondary Action Recognition in Vehicles via Convolutional Neural Network and Bidirectional Long Short-Term Memory with Spatial Enhanced Attention Mechanism


Abstract
1. Introduction
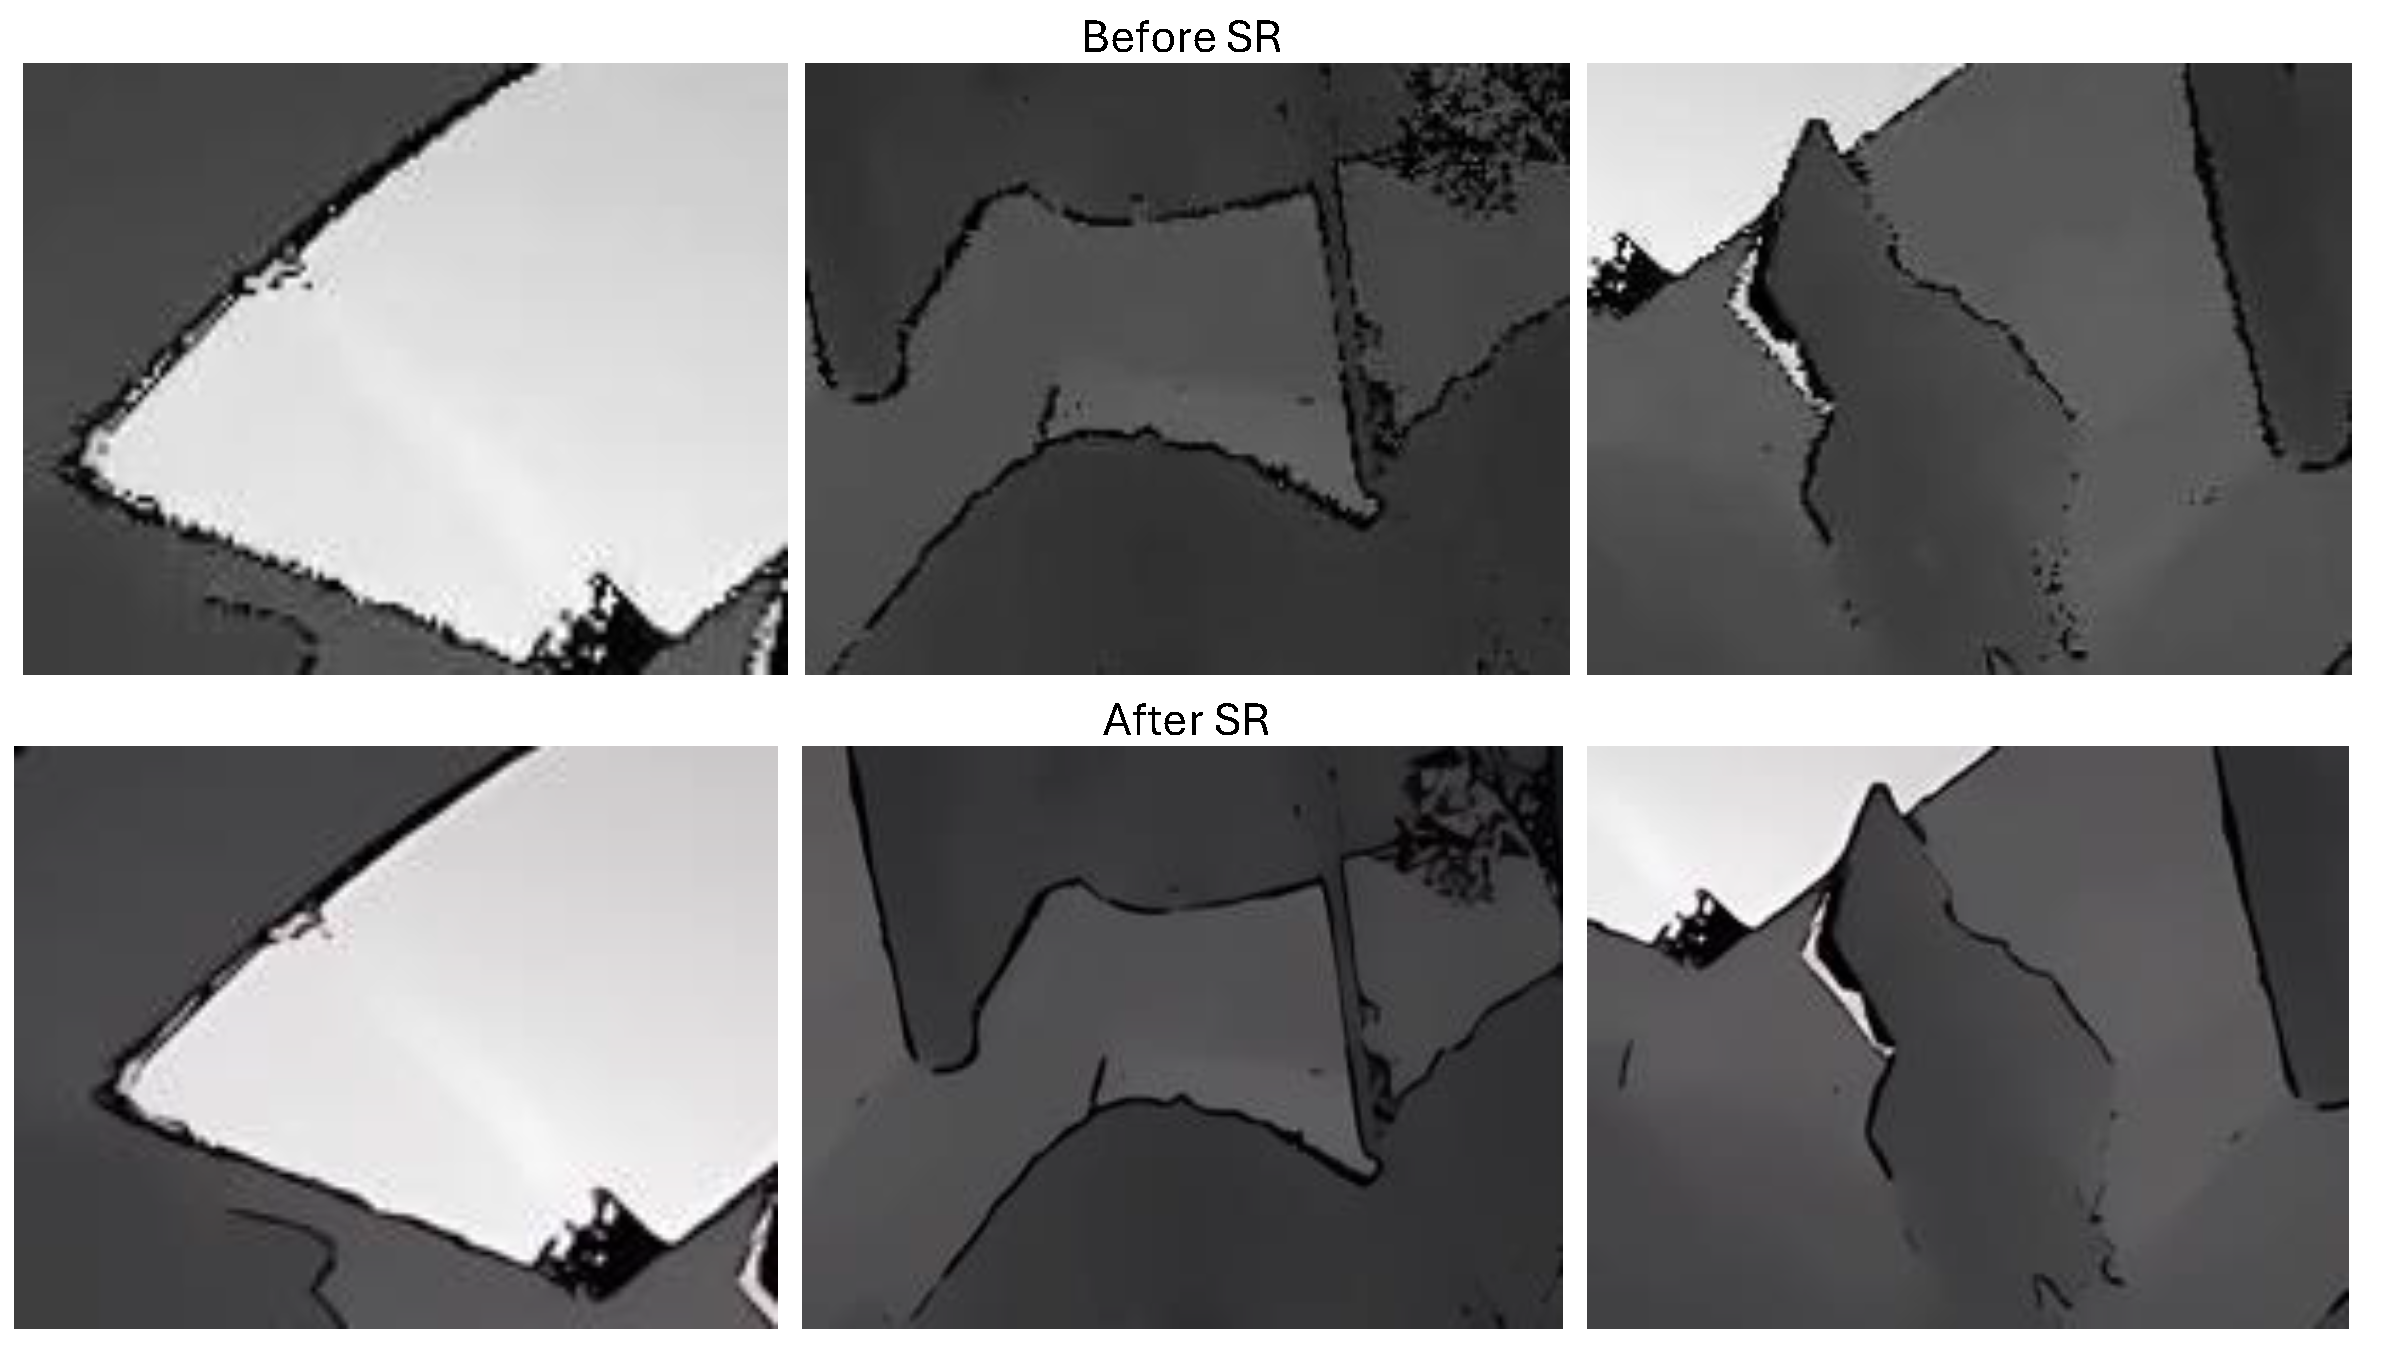
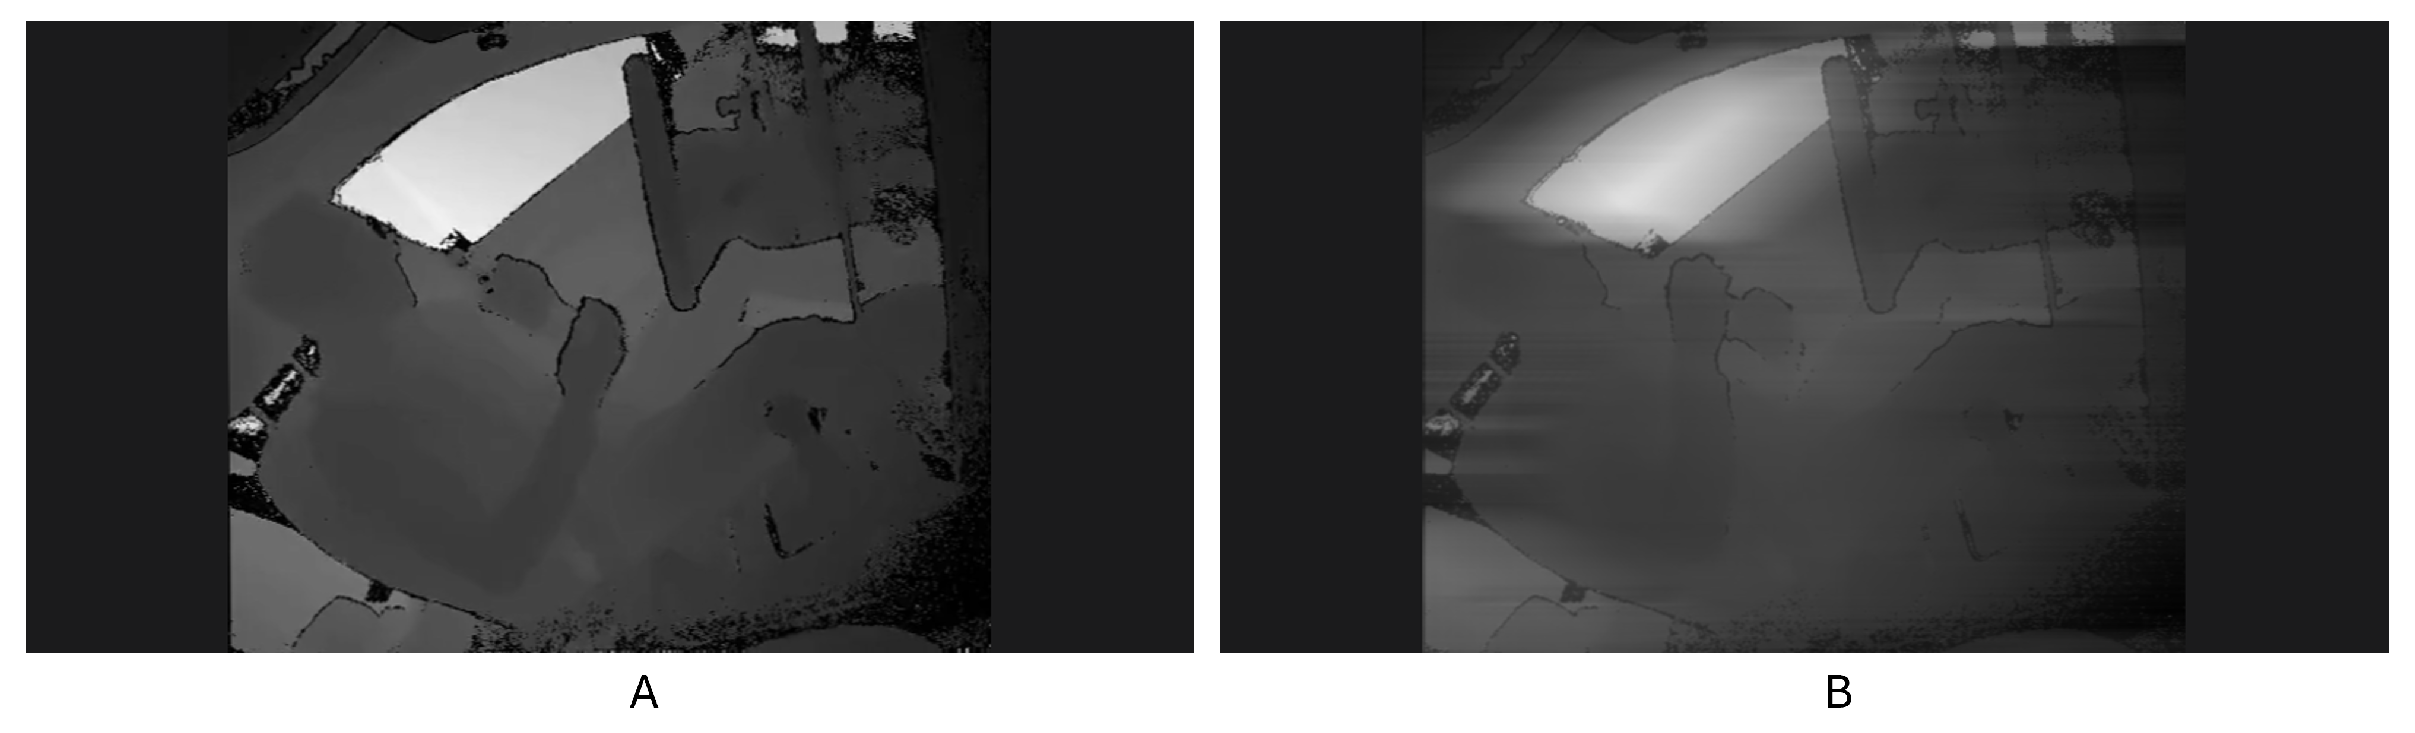
- We utilize the Real Enhanced Super-Resolution Generative Adversarial Network (real-ESRGAN) [7] to effectively reduce noise in depth videos. This approach significantly improves the visual clarity and quality of the depth images, making them more suitable for detailed analysis and further processing.
- We propose the CNN-SEAM+Bi-LSTM model, which exploits the spatial strengths of CNN augmented by SEAM to intensify the focus on critical segments within the video frames. This spatial enhancement is complemented by the temporal learning capabilities of Bi-LSTM networks, which analyze and interpret the temporal sequences across video frames for more accurate predictions and recognitions.
- We demonstrate the effectiveness of our proposed CNN-SEAM+Bi-LSTM model for Secondary Action Recognition on the published Drive&Act [9] dataset using cross validation. Furthermore, on this benchmark dataset, we perform a comprehensive comparison with the state-of-the-art model.
- We conducted ablation experiments of SAR in depth videos and RGB videos in different lighting conditions using the CNN-SEAM+Bi-LSTM model. Our experiments demonstrated that this model is better than conventional RGB videos for SAR in depth videos.
2. Related Work
2.1. Depth Sensor in Human Action Recognition
2.2. Actions Recognition in Vehicles
2.3. Attention Mechanism in Action Recognition
3. System Description
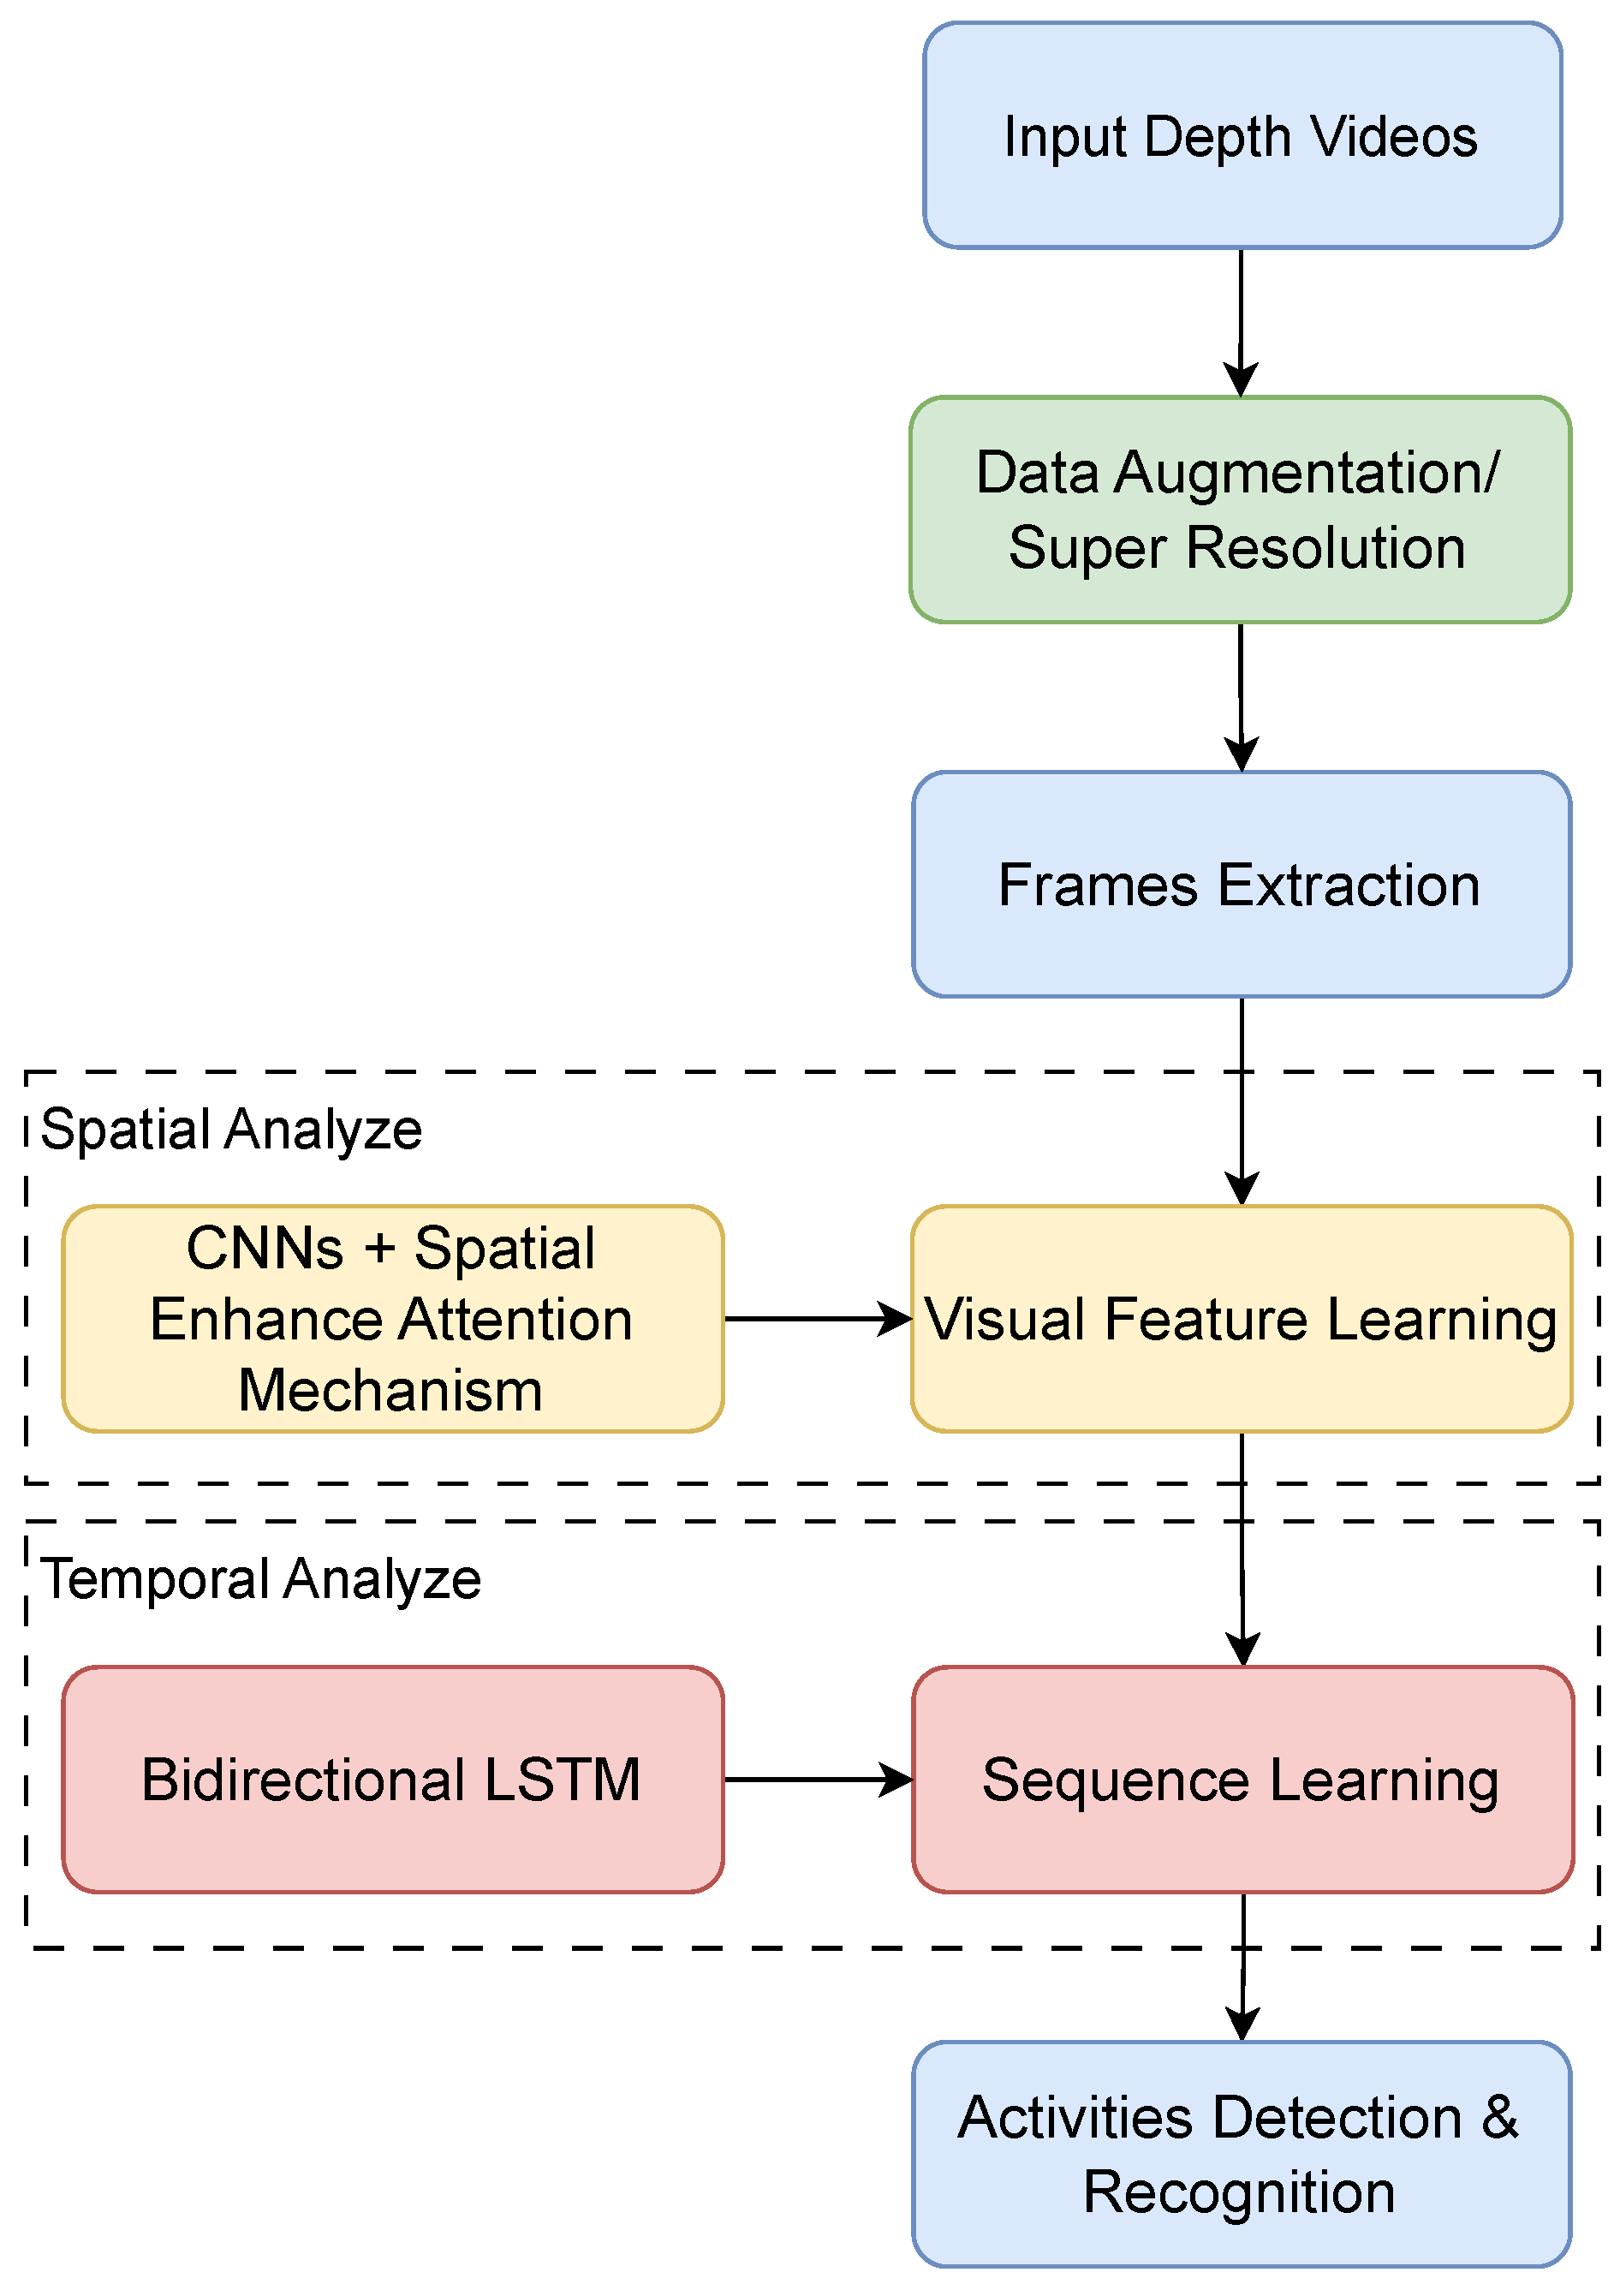
3.1. Overall System Description
3.2. Data Preprocessing
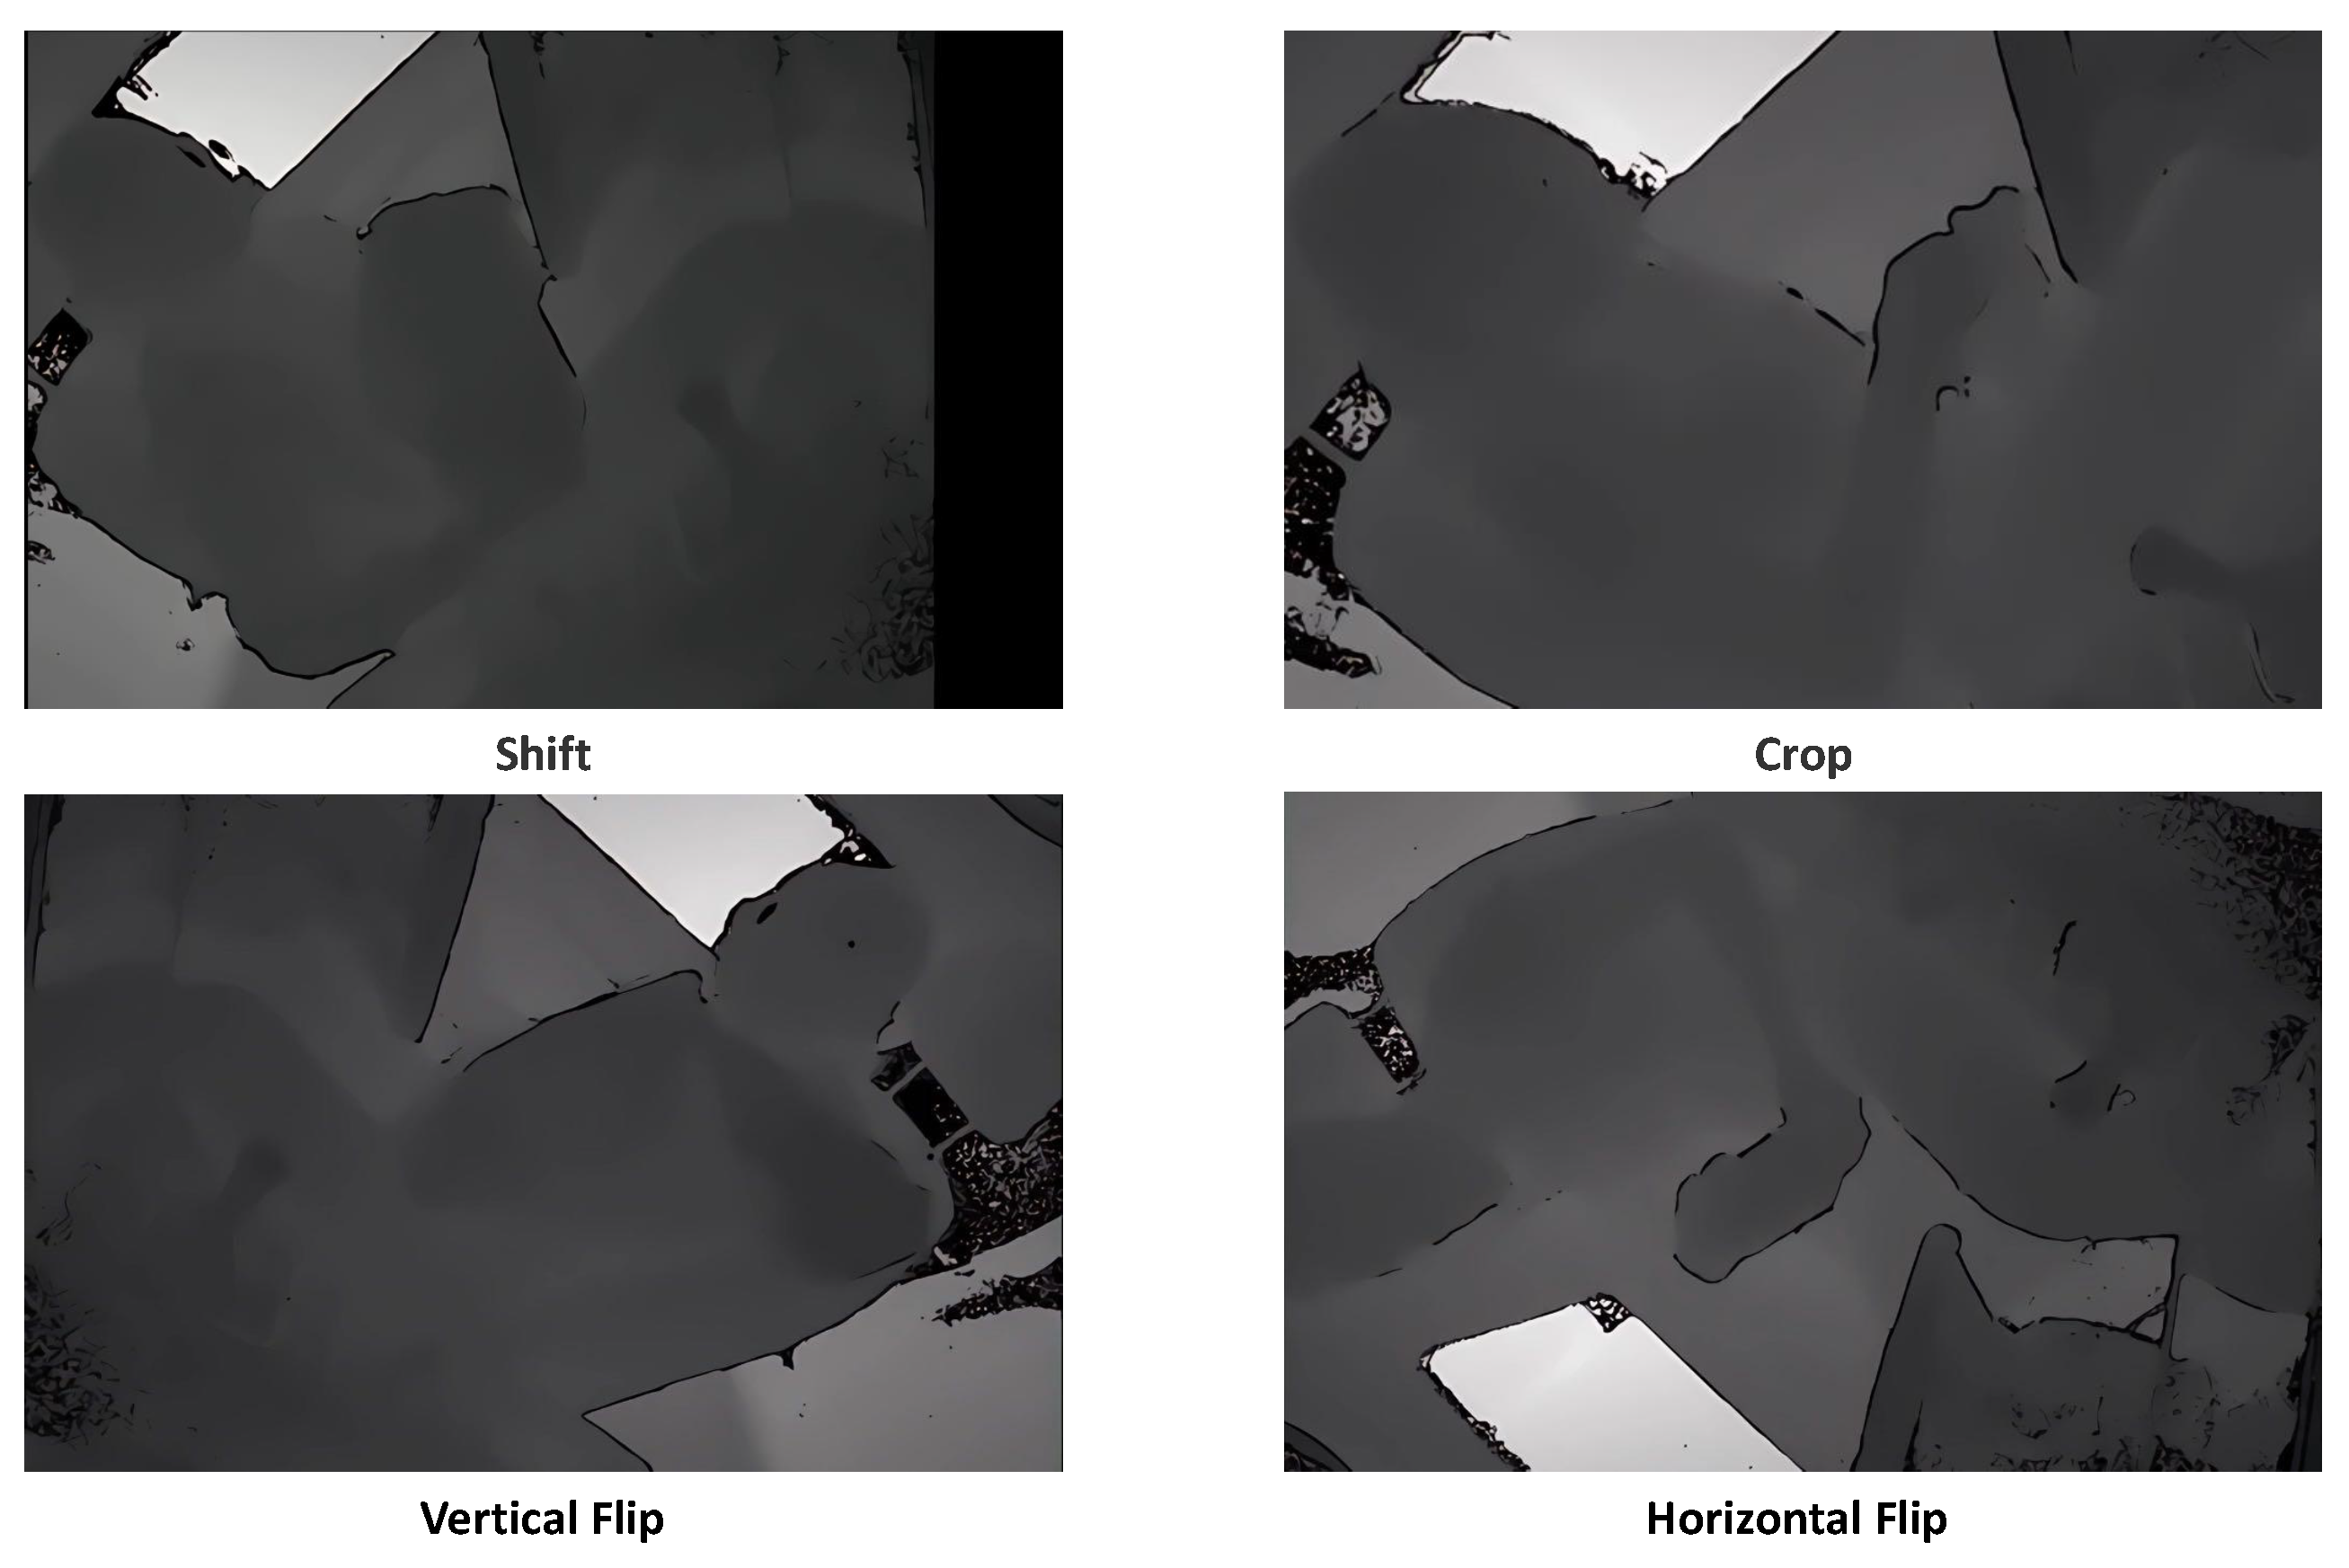
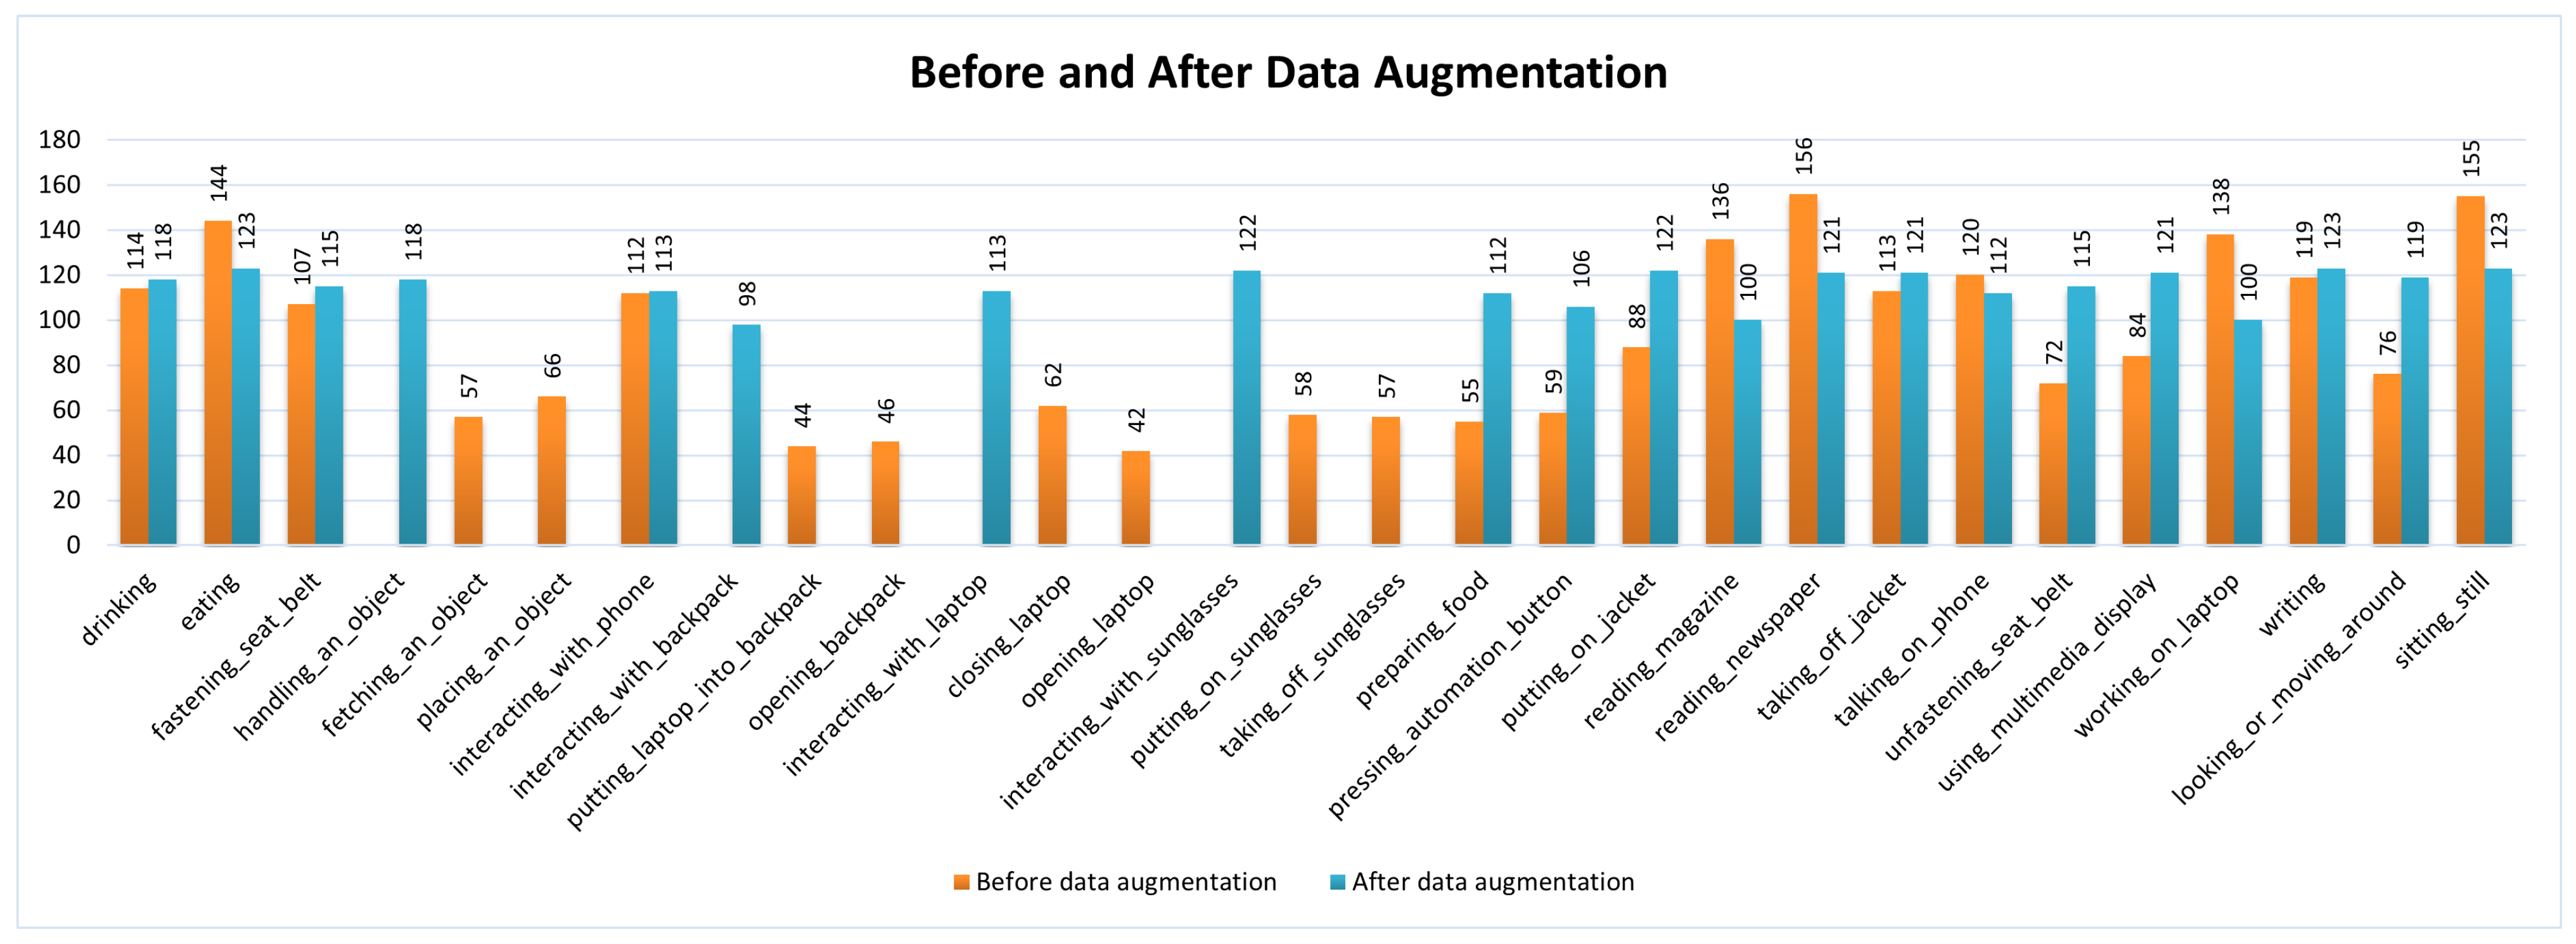
3.2.1. Data Augmentation
3.2.2. Super-Resolution
3.3. Detailed Model Description for SAR
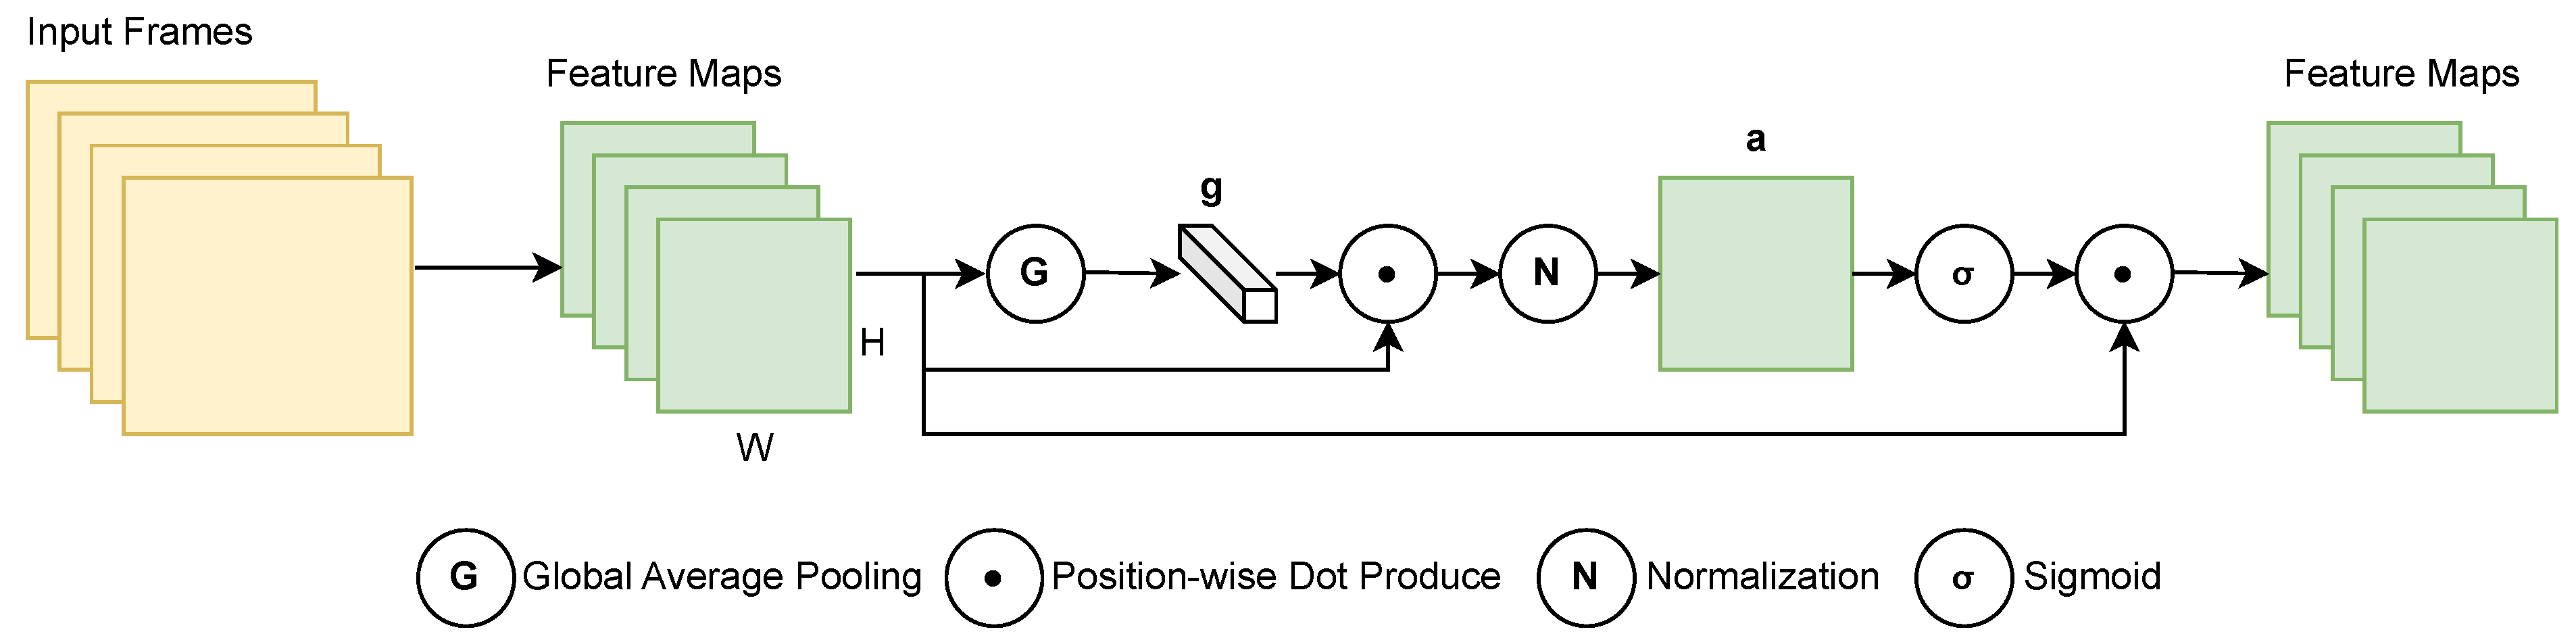
3.3.1. CNN-SEAM Spatial Feature Extraction
3.3.2. Temporal Feature Extraction
4. Experimental Settings
4.1. Equipment
4.2. Dataset
4.3. Experimental Configuration
4.4. Evaluation Metrics
5. Experimental Results and Discussion
5.1. Model Evaluation with K-Fold Cross Validation
5.2. Model Evaluation with DA and SR Techniques
5.3. Model Performance Comparisons for SAR
5.4. Ablation Experiments on RGB and Depth Datasets
6. Additional Experiments
6.1. Model Performance on Other Datasets
6.2. Performance of the Model in the Case of Vehicle Shaking
7. Conclusions and Future Work
Author Contributions
Funding
Institutional Review Board Statement
Informed Consent Statement
Data Availability Statement
Conflicts of Interest
References
- Kong, Y.; Fu, Y. Human Action Recognition and Prediction: A Survey. Int. J. Comput. Vis. 2022, 130, 1366–1401. [Google Scholar] [CrossRef]
- Sun, Z.; Ke, Q.; Rahmani, H.; Bennamoun, M.; Wang, G.; Liu, J. Human Action Recognition from Various Data Modalities: A Review. IEEE Trans. Pattern Anal. Mach. Intell. 2022, 45, 3200–3225. [Google Scholar] [CrossRef]
- Mahjoub, A.B.; Atri, M. Human Action Recognition Using RGB Data. In Proceedings of the 2016 11th International Design & Test Symposium (IDT), Hammamet, Tunisia, 18–20 December 2016; pp. 83–87. [Google Scholar]
- Zhang, J.; Li, W.; Ogunbona, P.O.; Wang, P.; Tang, C. RGB-D-based Action Recognition Datasets: A Survey. Pattern Recognit. 2016, 60, 86–105. [Google Scholar] [CrossRef]
- Zhang, C.; Tian, Y. RGB-D Camera-based Daily Living Activity Recognition. J. Comput. Vis. Image Process. 2012, 2, 12. [Google Scholar]
- Kim, D.; Choi, J. Indirect Time-of-flight Depth Sensor with Two-step Comparison Scheme for Depth Frame Difference Detection. Sensors 2019, 19, 3674. [Google Scholar] [CrossRef]
- Wang, X.; Xie, L.; Dong, C.; Shan, Y. Real-ESRGAN: Training real-world blind super-resolution with pure synthetic data. In Proceedings of the IEEE/CVF International Conference on Computer Vision, Montreal, BC, Canada, 11–17 October 2021; pp. 1905–1914. [Google Scholar]
- Ullah, A.; Ahmad, J.; Muhammad, K.; Sajjad, M.; Baik, S.W. Action Recognition in Video Sequences using Deep Bi-Directional LSTM With CNN Features. IEEE Access 2018, 6, 1155–1166. [Google Scholar] [CrossRef]
- Martin, M.; Roitberg, A.; Haurilet, M.; Horne, M.; Reiß, S.; Voit, M.; Stiefelhagen, R. Drive&Act: A Multi-modal Dataset for Fine-grained Driver Behavior Recognition in Autonomous Vehicles. In Proceedings of the IEEE/CVF International Conference on Computer Vision, Seoul, Republic of Korea, 27–28 October 2019. [Google Scholar]
- Popescu, A.C.; Mocanu, I.; Cramariuc, B. Fusion mechanisms for human activity recognition using automated machine learning. IEEE Access 2020, 8, 143996–144014. [Google Scholar] [CrossRef]
- Basak, H.; Kundu, R.; Singh, P.K.; Ijaz, M.F.; Woźniak, M.; Sarkar, R. A Union of Deep Learning and Swarm-Based Optimization for 3D Human Action Recognition. Sci. Rep. 2022, 12, 5494. [Google Scholar] [CrossRef] [PubMed]
- Shahroudy, A.; Liu, J.; Ng, T.T.; Wang, G. NTU RGB+ D: A Large Scale Dataset for 3D Human Activity Analysis. In Proceedings of the IEEE Conference on Computer Vision and Pattern Recognition, Las Vegas, NV, USA, 27–30 June 2016; pp. 1010–1019. [Google Scholar]
- Batool, M.; Alotaibi, S.S.; Alatiyyah, M.H.; Alnowaiser, K.; Aljuaid, H.; Jalal, A.; Park, J. Depth sensors-based action recognition using a modified K-ary entropy classifier. IEEE Access 2023, 11, 58578–58595. [Google Scholar] [CrossRef]
- Yu, B.X.B.; Liu, Y.; Zhang, X.; Zhong, S.h.; Chan, K.C.C. MMNet: A Model-Based Multimodal Network for Human Action Recognition in RGB-D Videos. IEEE Trans. Pattern Anal. Mach. Intell. 2023, 45, 3522–3538. [Google Scholar] [CrossRef]
- Ahn, D.; Kim, S.; Hong, H.; Ko, B.C. Star-Transformer: A Spatio-Temporal Cross Attention Transformer for Human Action Recognition. In Proceedings of the IEEE/CVF Winter Conference on Applications of Computer Vision, Waikoloa, HI, USA, 2–7 January 2023; pp. 3330–3339. [Google Scholar]
- Ohn-Bar, E.; Martin, S.; Tawari, A.; Trivedi, M.M. Head, eye, and hand patterns for driver activity recognition. In Proceedings of the 2014 22nd International Conference on Pattern Recognition, Stockholm, Sweden, 24–28 August 2014; pp. 660–665. [Google Scholar]
- Xu, L.; Fujimura, K. Real-Time Driver Activity Recognition with Random Forests. In Proceedings of the 6th International Conference on Automotive User Interfaces and Interactive Vehicular Applications, Seattle, WA, USA, 17–19 September 2014; pp. 1–8. [Google Scholar]
- Braunagel, C.; Kasneci, E.; Stolzmann, W.; Rosenstiel, W. Driver-Activity Recognition in the Context of Conditionally Autonomous Driving. In Proceedings of the 2015 IEEE 18th International Conference on Intelligent Transportation Systems, Gran Canaria, Spain, 15–18 September 2015; pp. 1652–1657. [Google Scholar]
- Wang, H.; Kläser, A.; Schmid, C.; Liu, C.L. Action Recognition by Dense Trajectories. In Proceedings of the CVPR 2011, Colorado Springs, CO, USA, 20–25 June 2011; pp. 3169–3176. [Google Scholar] [CrossRef]
- Wang, H.; Schmid, C. Action Recognition with Improved Trajectories. In Proceedings of the 2013 IEEE International Conference on Computer Vision, Sydney, Australia, 1–8 December 2013; pp. 3551–3558. [Google Scholar] [CrossRef]
- Yao, G.; Lei, T.; Zhong, J. A Review of Convolutional-Neural-Network-Based Action Recognition. Pattern Recognit. Lett. 2019, 118, 14–22. [Google Scholar] [CrossRef]
- Islam, M.M.; Nooruddin, S.; Karray, F.; Muhammad, G. Human Activity Recognition Using Tools of Convolutional Neural Networks: A State of the Art Review, Data Sets, Challenges, and Future Prospects. Comput. Biol. Med. 2022, 149, 106060. [Google Scholar] [CrossRef] [PubMed]
- Xing, Y.; Lv, C.; Wang, H.; Cao, D.; Velenis, E.; Wang, F.Y. Driver Activity Recognition for Intelligent Vehicles: A Deep Learning Approach. IEEE Trans. Veh. Technol. 2019, 68, 5379–5390. [Google Scholar] [CrossRef]
- Krizhevsky, A.; Sutskever, I.; Hinton, G.E. ImageNet Classification with Deep Convolutional Neural Networks. Commun. ACM 2017, 60, 84–90. [Google Scholar] [CrossRef]
- Szegedy, C.; Liu, W.; Jia, Y.; Sermanet, P.; Reed, S.; Anguelov, D.; Erhan, D.; Vanhoucke, V.; Rabinovich, A. Going Deeper with Convolutions. In Proceedings of the IEEE Conference on Computer Vision and Pattern Recognition, Boston, MA, USA, 7–12 June 2015; pp. 1–9. [Google Scholar]
- He, K.; Zhang, X.; Ren, S.; Sun, J. Deep Residual Learning for Image Recognition. In Proceedings of the IEEE Conference on Computer Vision and Pattern Recognition, Las Vegas, NV, USA, 27–30 June 2016; pp. 770–778. [Google Scholar]
- Saranya, D.; Nalinipriya, G.; Kanagavalli, N.; Arunkumar, S.; Kavitha, G. Deep CNN Models for Driver Activity Recognition for Intelligent Vehicles. Int. J. 2020, 8, 7146–7150. [Google Scholar]
- Nel, F.; Ngxande, M. Driver Activity Recognition Through Deep Learning. In Proceedings of the 2021 Southern African Universities Power Engineering Conference/Robotics and Mechatronics/Pattern Recognition Association of South Africa (SAUPEC/RobMech/PRASA), Potchefstroom, South Africa, 27–29 January 2021; pp. 1–6. [Google Scholar] [CrossRef]
- Peng, K.; Roitberg, A.; Yang, K.; Zhang, J.; Stiefelhagen, R. TransDARC: Transformer-based Driver Activity Recognition with Latent Space Feature Calibration. In Proceedings of the2022 IEEE/RSJ International Conference on Intelligent Robots and Systems (IROS), Kyoto, Japan, 23–27 October 2022; pp. 278–285. [Google Scholar] [CrossRef]
- Roitberg, A.; Peng, K.; Schneider, D.; Yang, K.; Koulakis, M.; Martinez, M.; Stiefelhagen, R. Is My Driver Observation Model Overconfident? Input-guided Calibration Networks for Reliable and Interpretable Confidence Estimates. IEEE Trans. Intell. Transp. Syst. 2022, 23, 25271–25286. [Google Scholar] [CrossRef]
- Liu, D.; Yamasaki, T.; Wang, Y.; Mase, K.; Kato, J. Toward Extremely Lightweight Distracted Driver Recognition with Distillation-based Neural Architecture Search and Knowledge Transfer. IEEE Trans. Intell. Transp. Syst. 2022, 24, 764–777. [Google Scholar] [CrossRef]
- Tanama, C.; Peng, K.; Marinov, Z.; Stiefelhagen, R.; Roitberg, A. Quantized Distillation: Optimizing Driver Activity Recognition Models for Resource-Constrained Environments. In Proceedings of the 2023 IEEE/RSJ International Conference on Intelligent Robots and Systems (IROS), Detroit, MI, USA, 1–5 October 2023; pp. 5479–5486. [Google Scholar]
- Liu, S.; Wang, Y.; Yu, Q.; Liu, H.; Peng, Z. CEAM-YOLOv7: Improved YOLOv7 Based on Channel Expansion and Attention Mechanism for Driver Distraction Behavior Detection. IEEE Access 2022, 10, 129116–129124. [Google Scholar] [CrossRef]
- Niu, Z.; Zhong, G.; Yu, H. A Review on the Attention Mechanism of Deep Learning. Neurocomputing 2021, 452, 48–62. [Google Scholar] [CrossRef]
- Guo, M.H.; Xu, T.X.; Liu, J.J.; Liu, Z.N.; Jiang, P.T.; Mu, T.J.; Zhang, S.H.; Martin, R.R.; Cheng, M.M.; Hu, S.M. Attention Mechanisms in Computer Vision: A Survey. Comput. Vis. Media 2022, 8, 331–368. [Google Scholar] [CrossRef]
- Wang, K.; He, J.; Zhang, L. Attention-Based Convolutional Neural Network for Weakly Labeled Human Activities’ Recognition With Wearable Sensors. IEEE Sens. J. 2019, 19, 7598–7604. [Google Scholar] [CrossRef]
- Xu, S.; Zhang, L.; Tang, Y.; Han, C.; Wu, H.; Song, A. Channel Attention for Sensor-Based Activity Recognition: Embedding Features into all Frequencies in DCT Domain. IEEE Trans. Knowl. Data Eng. 2023, 35, 12497–12512. [Google Scholar] [CrossRef]
- Mekruksavanich, S.; Jitpattanakul, A. Hybrid Convolution Neural Network with Channel Attention Mechanism for Sensor-Based Human Activity Recognition. Sci. Rep. 2023, 13, 12067. [Google Scholar] [CrossRef] [PubMed]
- Lu, L.; Di, H.; Lu, Y.; Zhang, L.; Wang, S. Spatio-Temporal Attention Mechanisms Based Model for Collective Activity Recognition. Signal Process. Image Commun. 2019, 74, 162–174. [Google Scholar] [CrossRef]
- Jegham, I.; Alouani, I.; Khalifa, A.B.; Mahjoub, M.A. Deep Learning-Based Hard Spatial Attention for Driver In-Vehicle Action Monitoring. Expert Syst. Appl. 2023, 219, 119629. [Google Scholar] [CrossRef]
- Li, X.; Hu, X.; Yang, J. Spatial Group-wise Enhance: Improving Semantic Feature Learning in Convolutional Networks. arXiv 2019, arXiv:1905.09646. [Google Scholar]
- Goodfellow, I.; Pouget-Abadie, J.; Mirza, M.; Xu, B.; Warde-Farley, D.; Ozair, S.; Courville, A.; Bengio, Y. Generative Adversarial Networks. Commun. ACM 2020, 63, 139–144. [Google Scholar] [CrossRef]
- O’Shea, K.; Nash, R. An Introduction to Convolutional Neural Networks. arXiv 2015, arXiv:1511.08458. [Google Scholar]
- Choi, M.; Kim, H.; Han, B.; Xu, N.; Lee, K.M. Channel Attention is All You Need for Video Frame Interpolation. In Proceedings of the AAAI Conference on Artificial Intelligence, New York, NY, USA, 7–12 February 2020; Volume 34, pp. 10663–10671. [Google Scholar]
- Liu, T.; Luo, R.; Xu, L.; Feng, D.; Cao, L.; Liu, S.; Guo, J. Spatial Channel Attention for Deep Convolutional Neural Networks. Mathematics 2022, 10, 1750. [Google Scholar] [CrossRef]
- Ioffe, S.; Szegedy, C. Batch normalization: Accelerating deep network training by reducing internal covariate shift. In Proceedings of the International Conference on Machine Learning, Lille, France, 6–11 July 2015; pp. 448–456. [Google Scholar]
- Sherstinsky, A. Fundamentals of Recurrent Neural Network (RNN) and Long Short-term Memory (LSTM) Network. Phys. D Nonlinear Phenom. 2020, 404, 132306. [Google Scholar] [CrossRef]
- Berrar, D. Cross-validation. In Encyclopedia of Bioinformatics and Computational Biology, 2nd ed.; Elsevier: Amsterdam, The Netherlands, 2019. [Google Scholar]
- Fushiki, T. Estimation of prediction error by using K-fold cross-validation. Stat. Comput. 2011, 21, 137–146. [Google Scholar] [CrossRef]
- Shi, X.; Chen, Z.; Wang, H.; Yeung, D.Y.; Wong, W.K.; Woo, W.C. Convolutional LSTM Network: A Machine Learning Approach for Precipitation Nowcasting. Adv. Neural Inf. Process. Syst. 2015, 28, 1–9. [Google Scholar]
- Donahue, J.; Anne Hendricks, L.; Guadarrama, S.; Rohrbach, M.; Venugopalan, S.; Saenko, K.; Darrell, T. Long-term Recurrent Convolutional Networks for Visual Recognition and Description. In Proceedings of the IEEE Conference on Computer Vision and Pattern Recognition, Boston, MA, USA, 7–12 June 2015; pp. 2625–2634. [Google Scholar]
- An, G.; Zhou, W.; Wu, Y.; Zheng, Z.; Liu, Y. Squeeze-and-Excitation on Spatial and Temporal Deep Feature Space for Action Recognition. In Proceedings of the 2018 14th IEEE International Conference on Signal Processing (ICSP), Beijing, China, 12–16 August 2018; pp. 648–653. [Google Scholar]
- Holzbock, A.; Tsaregorodtsev, A.; Dawoud, Y.; Dietmayer, K.; Belagiannis, V. A Spatio-temporal Multilayer Perceptron for Gesture Recognition. In Proceedings of the 2022 IEEE Intelligent Vehicles Symposium (IV), Aachen, Germany, 4–9 June 2022; pp. 1099–1106. [Google Scholar]
- Schuldt, C.; Laptev, I.; Caputo, B. Recognizing human actions: A local SVM approach. In Proceedings of the 17th International Conference on Pattern Recognition (ICPR 2004), Cambridge, UK, 26–26 August 2004; Volume 3, pp. 32–36. [Google Scholar]
- Kuehne, H.; Jhuang, H.; Garrote, E.; Poggio, T.; Serre, T. HMDB: A large video database for human motion recognition. In Proceedings of the 2011 International Conference on Computer Vision, Barcelona, Spain, 6–13 November 2011; pp. 2556–2563. [Google Scholar] [CrossRef]
- Soomro, K. UCF101: A dataset of 101 human actions classes from videos in the wild. arXiv 2012, arXiv:1212.0402. [Google Scholar]


| Parameter | Value |
|---|---|
| Number of action categories | 21 |
| Average videos per action category | 123 |
| Average number of frames per video | 95 |
| Resolution of the video | |
| Average frames per second (FPS) of the video | 30 |
| Specifications | Microsoft Kinect for Xbox One |
|---|---|
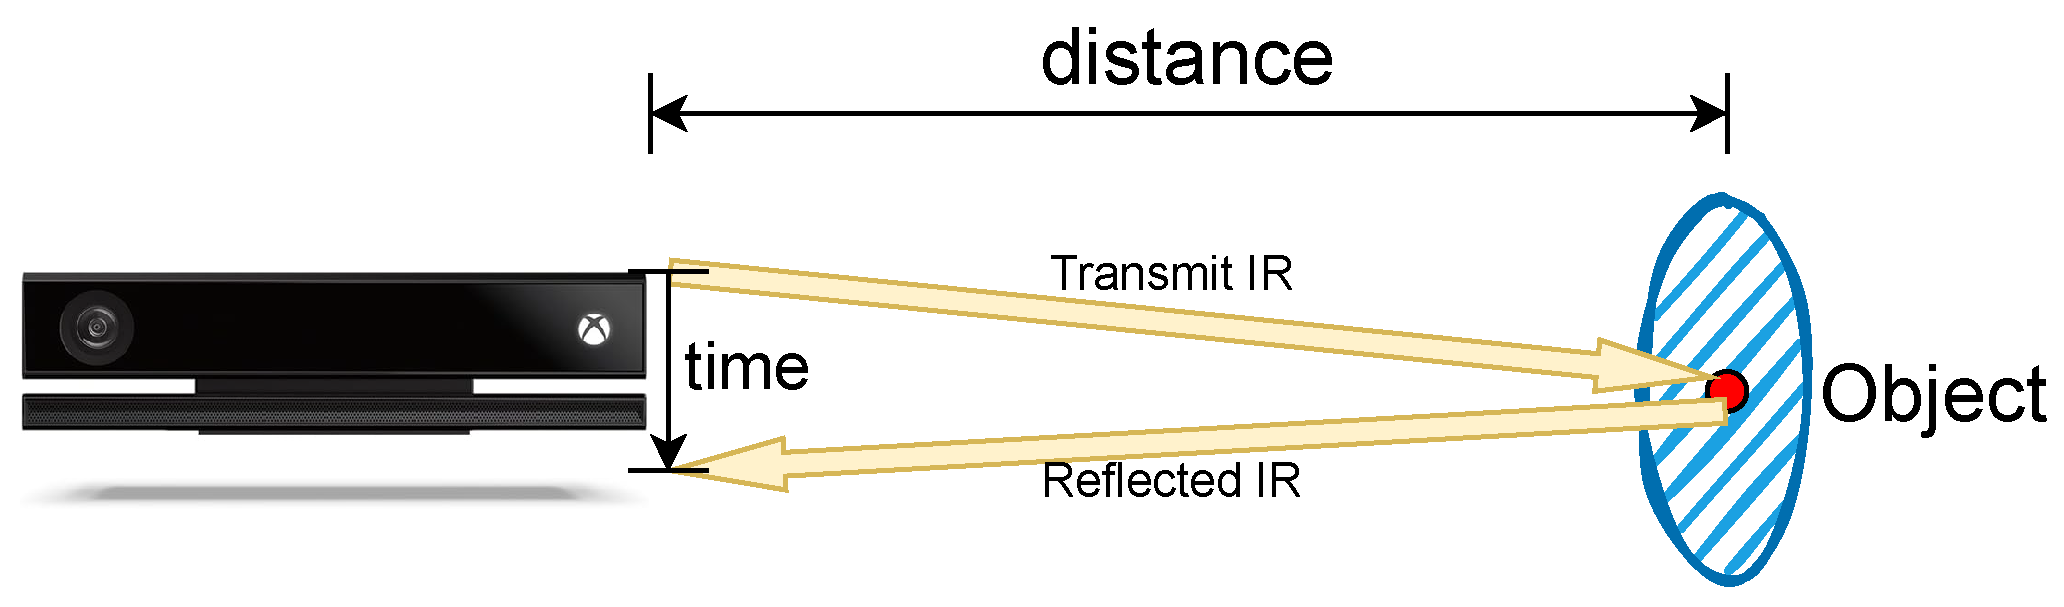
| Depth sensor type | Time of Flight (ToF) |
| RGB camera resolution | 1920 × 1080, 30 fps |
| IR camera resolution | 512 × 424, 30 fps |
| Field of view of RGB camera | 84.1° × 53.8° |
| Field of view of depth camera | 70.6° × 60° |
| Operative measuring range | 0.5 m–4.5 m |
| Skeleton joints defined | 25 joints |
| Maximum skeletal tracking | 6 |
| Name | Parameter |
|---|---|
| GPU | Quadro RTX 5000, 16,384 MB |
| System | Windows 11 |
| Operating memory | 16 GB |
| Environment configuration | Python-3.8.19 tensorflow-2.13.0 |
| Name | Value |
|---|---|
| Patience | 15 |
| Loss function | categorical cross-entropy |
| Optimizer | Adam |
| Metrics | accuracy |
| Epochs | 60 |
| Batch size | 4 |
| Shuffle | True |
| Validation split | 20% |
| Fold-n | Overall Average Test Loss | Overall Average Accuracy (%) |
|---|---|---|
| Fold-1 | 0.57 | 83.40 |
| Fold-2 | 0.82 | 79.05 |
| Fold-3 | 0.59 | 83.16 |
| Fold-4 | 0.51 | 86.07 |
| Fold-5 | 0.44 | 87.73 |
| Average | 0.59 | 83.88 |
| Action | Original Data (%) | After DA (%) | After SR (%) |
|---|---|---|---|
| Overall | 69.27 | 74.36 | 83.88 |
| Drinking | 66.67 | 78.72 | 91.53 |
| Eating | 90.91 | 88.64 | 91.06 |
| Fastening Seat Belt | 53.12 | 51.35 | 72.17 |
| Interacting with Phone | 83.72 | 94.74 | 90.27 |
| Handling an Object | 54.78 | 43.71 | 77.97 |
| - Fetching an Object | 61.82 | - | - |
| - Placing an Object | 47.73 | - | - |
| Interacting with Backpack | 60.72 | 81.58 | 95.92 |
| - Opening Backpack | 50.00 | - | - |
| - Putting Laptop into Backpack | 71.43 | - | - |
| Interacting with Laptop | 39.17 | 42.86 | 69.39 |
| - Closing Laptop | 55.56 | - | - |
| - Opening Laptop | 23.08 | - | - |
| Interacting with Sunglasses | 20.71 | 75.00 | 83.61 |
| - Putting on Sunglasses | 12.00 | - | - |
| - Taking off Sunglasses | 29.41 | - | - |
| Preparing Food | 60.00 | 70.00 | 78.30 |
| Pressing Automation Button | 78.57 | 92.11 | 86.89 |
| Putting on Jacket | 46.43 | 57.14 | 61.68 |
| Reading Magazine | 97.00 | 100.00 | 97.52 |
| Reading Newspaper | 92.68 | 93.18 | 87.60 |
| Taking off Jacket | 70.00 | 65.52 | 86.09 |
| Talking on Phone | 91.67 | 78.95 | 92.56 |
| Unfastening Seat Belt | 39.13 | 46.15 | 56.00 |
| Using Multimedia Display | 92.31 | 86.21 | 95.93 |
| Working on Laptop | 92.11 | 87.80 | 92.44 |
| Writing | 79.31 | 80.00 | 93.50 |
| Looking or Moving Around (e.g., searching) | 17.65 | 50.00 | 53.57 |
| Sitting Still | 100.00 | 97.87 | 97.32 |
| Model | Accuracy |
|---|---|
| CNN+Bi-LSTM | 72.12% |
| CNN-SEAM+Bi-LSTM (ours) | 83.88% |
| Model | 64 Units | 128 Units | 256 Units | 512 Units |
|---|---|---|---|---|
| One-layer LSTM | 78.36% | 78.98% | 81.47% | 78.48% |
| Two-layer LSTM | 77.99% | 80.11 % | 78.48% | 77.38% |
| Bi-LSTM | 80.59% | 82.29% | 83.88% | 83.37% |
| Model | Number of CNN Layers | Accuracy |
|---|---|---|
| CNN-SEAM+Bi-LSTM | 3 layers | 80.92% |
| 4 layers | 83.88% | |
| 5 layers | 76.56% |
| Model | Year | Accuracy (%) |
|---|---|---|
| ConvLSTM [50] | 2015 | 56.87 |
| LRCN [51] | 2015 | 66.23 |
| CNN+Deep BiLSTM [8] | 2017 | 69.43 |
| SE-LRCN [52] | 2018 | 70.12 |
| I3D [9] | 2019 | 60.97 |
| TransDARC [29] | 2021 | 8.01 |
| st-mlp [53] | 2022 | 22.58 |
| Distillation-Based Neural Architecture [31] | 2022 | 65.69 |
| Mobilenet [32] | 2023 | 39.77 |
| Quantized Distillation [32] | 2023 | 48.17 |
| Knowledge Distillation [32] | 2023 | 48.56 |
| CNN-SEAM+Bi-LSTM (ours) | - | 83.88 |
| Action | Depth Videos (%) | RGB Videos (%) | RGB Videos (Dark) (%) |
|---|---|---|---|
| Overall | 83.88 | 65.87 | 58.36 |
| Drinking | 91.53 | 48.28 | 55.17 |
| Eating | 91.06 | 86.36 | 81.82 |
| Fastening Seat Belt | 72.17 | 40.74 | 29.63 |
| Handling an Object | 77.97 | 46.05 | 42.49 |
| Interacting with Phone | 90.27 | 89.80 | 89.80 |
| Interacting with Backpack | 95.92 | 62.07 | 62.07 |
| Interacting with Laptop | 69.39 | 48.28 | 34.48 |
| Interacting with Sunglasses | 83.61 | 27.59 | 6.90 |
| Preparing Food | 78.30 | 50.00 | 35.71 |
| Pressing Automation Button | 86.89 | 89.66 | 86.21 |
| Putting on Jacket | 61.68 | 71.76 | 69.70 |
| Reading Magazine | 97.52 | 93.75 | 100.00 |
| Reading Newspaper | 87.60 | 90.24 | 75.61 |
| Taking off Jacket | 86.09 | 25.00 | 31.25 |
| Talking on Phone | 92.56 | 96.97 | 66.67 |
| Unfastening Seat Belt | 56.00 | 41.18 | 23.53 |
| Using Multimedia Display | 95.93 | 93.94 | 78.79 |
| Working on Laptop | 92.44 | 100.00 | 85.37 |
| Writing | 93.50 | 70.97 | 70.97 |
| Looking or Moving Around (e.g., searching) | 53.57 | 34.78 | 17.39 |
| Sitting Still | 97.32 | 95.74 | 97.87 |
| Model | Datasets | Number of Categories | Accuracy |
|---|---|---|---|
| CNN-SEAM+Bi-LSTM | KTH [54] | 6 | 65.60% |
| UCF50 [55] | 50 | 89.24% | |
| UCF101 [56] | 101 | 85.06% |
| Model | Datasets | Accuracy |
|---|---|---|
| CNN-SEAM+Bi-LSTM | Before adding shaking effects | 83.88% |
| After adding shaking effects | 81.34% |
Disclaimer/Publisher’s Note: The statements, opinions and data contained in all publications are solely those of the individual author(s) and contributor(s) and not of MDPI and/or the editor(s). MDPI and/or the editor(s) disclaim responsibility for any injury to people or property resulting from any ideas, methods, instructions or products referred to in the content. |
© 2024 by the authors. Licensee MDPI, Basel, Switzerland. This article is an open access article distributed under the terms and conditions of the Creative Commons Attribution (CC BY) license (https://creativecommons.org/licenses/by/4.0/).
Share and Cite
Shao, W.; Bouazizi, M.; Tomoaki, O. Depth Video-Based Secondary Action Recognition in Vehicles via Convolutional Neural Network and Bidirectional Long Short-Term Memory with Spatial Enhanced Attention Mechanism. Sensors 2024, 24, 6604. https://doi.org/10.3390/s24206604
Shao W, Bouazizi M, Tomoaki O. Depth Video-Based Secondary Action Recognition in Vehicles via Convolutional Neural Network and Bidirectional Long Short-Term Memory with Spatial Enhanced Attention Mechanism. Sensors. 2024; 24(20):6604. https://doi.org/10.3390/s24206604
Chicago/Turabian StyleShao, Weirong, Mondher Bouazizi, and Ohtuski Tomoaki. 2024. "Depth Video-Based Secondary Action Recognition in Vehicles via Convolutional Neural Network and Bidirectional Long Short-Term Memory with Spatial Enhanced Attention Mechanism" Sensors 24, no. 20: 6604. https://doi.org/10.3390/s24206604
APA StyleShao, W., Bouazizi, M., & Tomoaki, O. (2024). Depth Video-Based Secondary Action Recognition in Vehicles via Convolutional Neural Network and Bidirectional Long Short-Term Memory with Spatial Enhanced Attention Mechanism. Sensors, 24(20), 6604. https://doi.org/10.3390/s24206604