1. Introduction
The IoT is present in many elements of our lives, including homes, cars, trains, streets, transportation, agriculture, and businesses. However, the increasing interconnectedness of these devices has raised concerns regarding the security and trustworthiness of IoT communications. As IoT systems become more complex and extensive, ensuring secure and reliable interactions among devices becomes a paramount requirement [
1]. Trust and reputation management mechanisms play a pivotal role in establishing the reliability and integrity of IoT ecosystems. The rapid growth of such attacks is partly due to the proliferation of IoT technologies in areas such as smart grids, environmental monitoring, patient monitoring systems, smart manufacturing, and logistics [
2]. The design of IoT devices entails several automated processes that enable them to self-configure. The devices discover and connect to networks autonomously using protocols like UPnP or mDNS, minimizing the need for manual intervention during setup. Plug-and-play capabilities enable these devices to establish connections instantly upon powering up or connecting, automatically identifying network protocols, and initiating operations without requiring explicit configuration. Additionally, these devices can be configured dynamically to obtain IP addresses and network settings, thereby ensuring adaptability within various environments. In addition to the configuration data they get from centralized servers and the cloud, they adjust the setting details based on specific deployment scenarios through auto-provisioning mechanisms. Furthermore, advanced IoT systems may incorporate machine learning algorithms for autonomously optimizing configurations over time, adapting to changing user behavior. The combination of automated processes allows IoT devices to configure themselves more efficiently and effectively, so user intervention is minimized, and their usability can be enhanced in a variety of network environments.
IoT systems are susceptible to a wide range of security attacks, and of those that prevent legitimate IoT network users from accessing their services, Denial-of-Service (DoS) is one of the most common. As a result, firms and organizations suffer huge monetary losses by violating Service Level Agreement (SLA) terms. Therefore, to ensure that systems, devices, and data are secured and protected effectively, robust techniques and mechanisms to counter attacks against IoT networks are needed [
3]. In addition, DoS poses a danger to many IoT systems, including smart cities, healthcare applications, and agriculture systems. Attackers can exploit vulnerabilities in IoT devices, such as smart lights, door locks, and smart TVs, to launch DoS attacks against them [
3]. One common attack type is distributed DoS (DDoS), one of which occurred on Friday, 21 October 2016, when many IoT devices were attacked. The attackers targeted IoT security vulnerabilities and hacked the IoT network, affecting access to customer data and disrupting services and applications. The companies sustained huge damage [
4]. Many researchers in the literature have mentioned the urgency of the need to address the security of IoT systems and networks against DoS attacks, and some have proposed several DoS defense techniques to detect such attacks. Defenses against DoS attacks tend to include multiple verifications, network traffic filtration, and inspection of attacks. Most of these frameworks still have limitations, such as the use of traditional techniques and the lack of strict security requirements [
3]. Very few studies have employed machine learning techniques in the Intrusion Detection System (IDS) to detect DoS attacks in IoT networks [
3].
It has recently become possible to use the IoT paradigm to build smart environments that aim to maximize the comfort and efficiency of human life. A billion IoT smart nodes interconnect without human interaction through self-organized and heterogeneous communication networks. Various fields have been improved using IoT-based systems in recent years, including healthcare, agriculture, supply chains, education, transportation, and traffic monitoring. Of the 17 billion connected devices worldwide, 7 billion are IoT devices, a number that is expected to rise to more than 22 billion within the next few years [
4]. Unfortunately, most of these connected devices offer inadequate security and privacy protection, triggering many security and privacy concerns in IoT networks. In turn, node heterogeneity has raised security concerns, one of the most challenging aspects of the IoT [
5]. However, IoT device security cannot be achieved by employing security methods like IDS, access control, and authentication [
6].
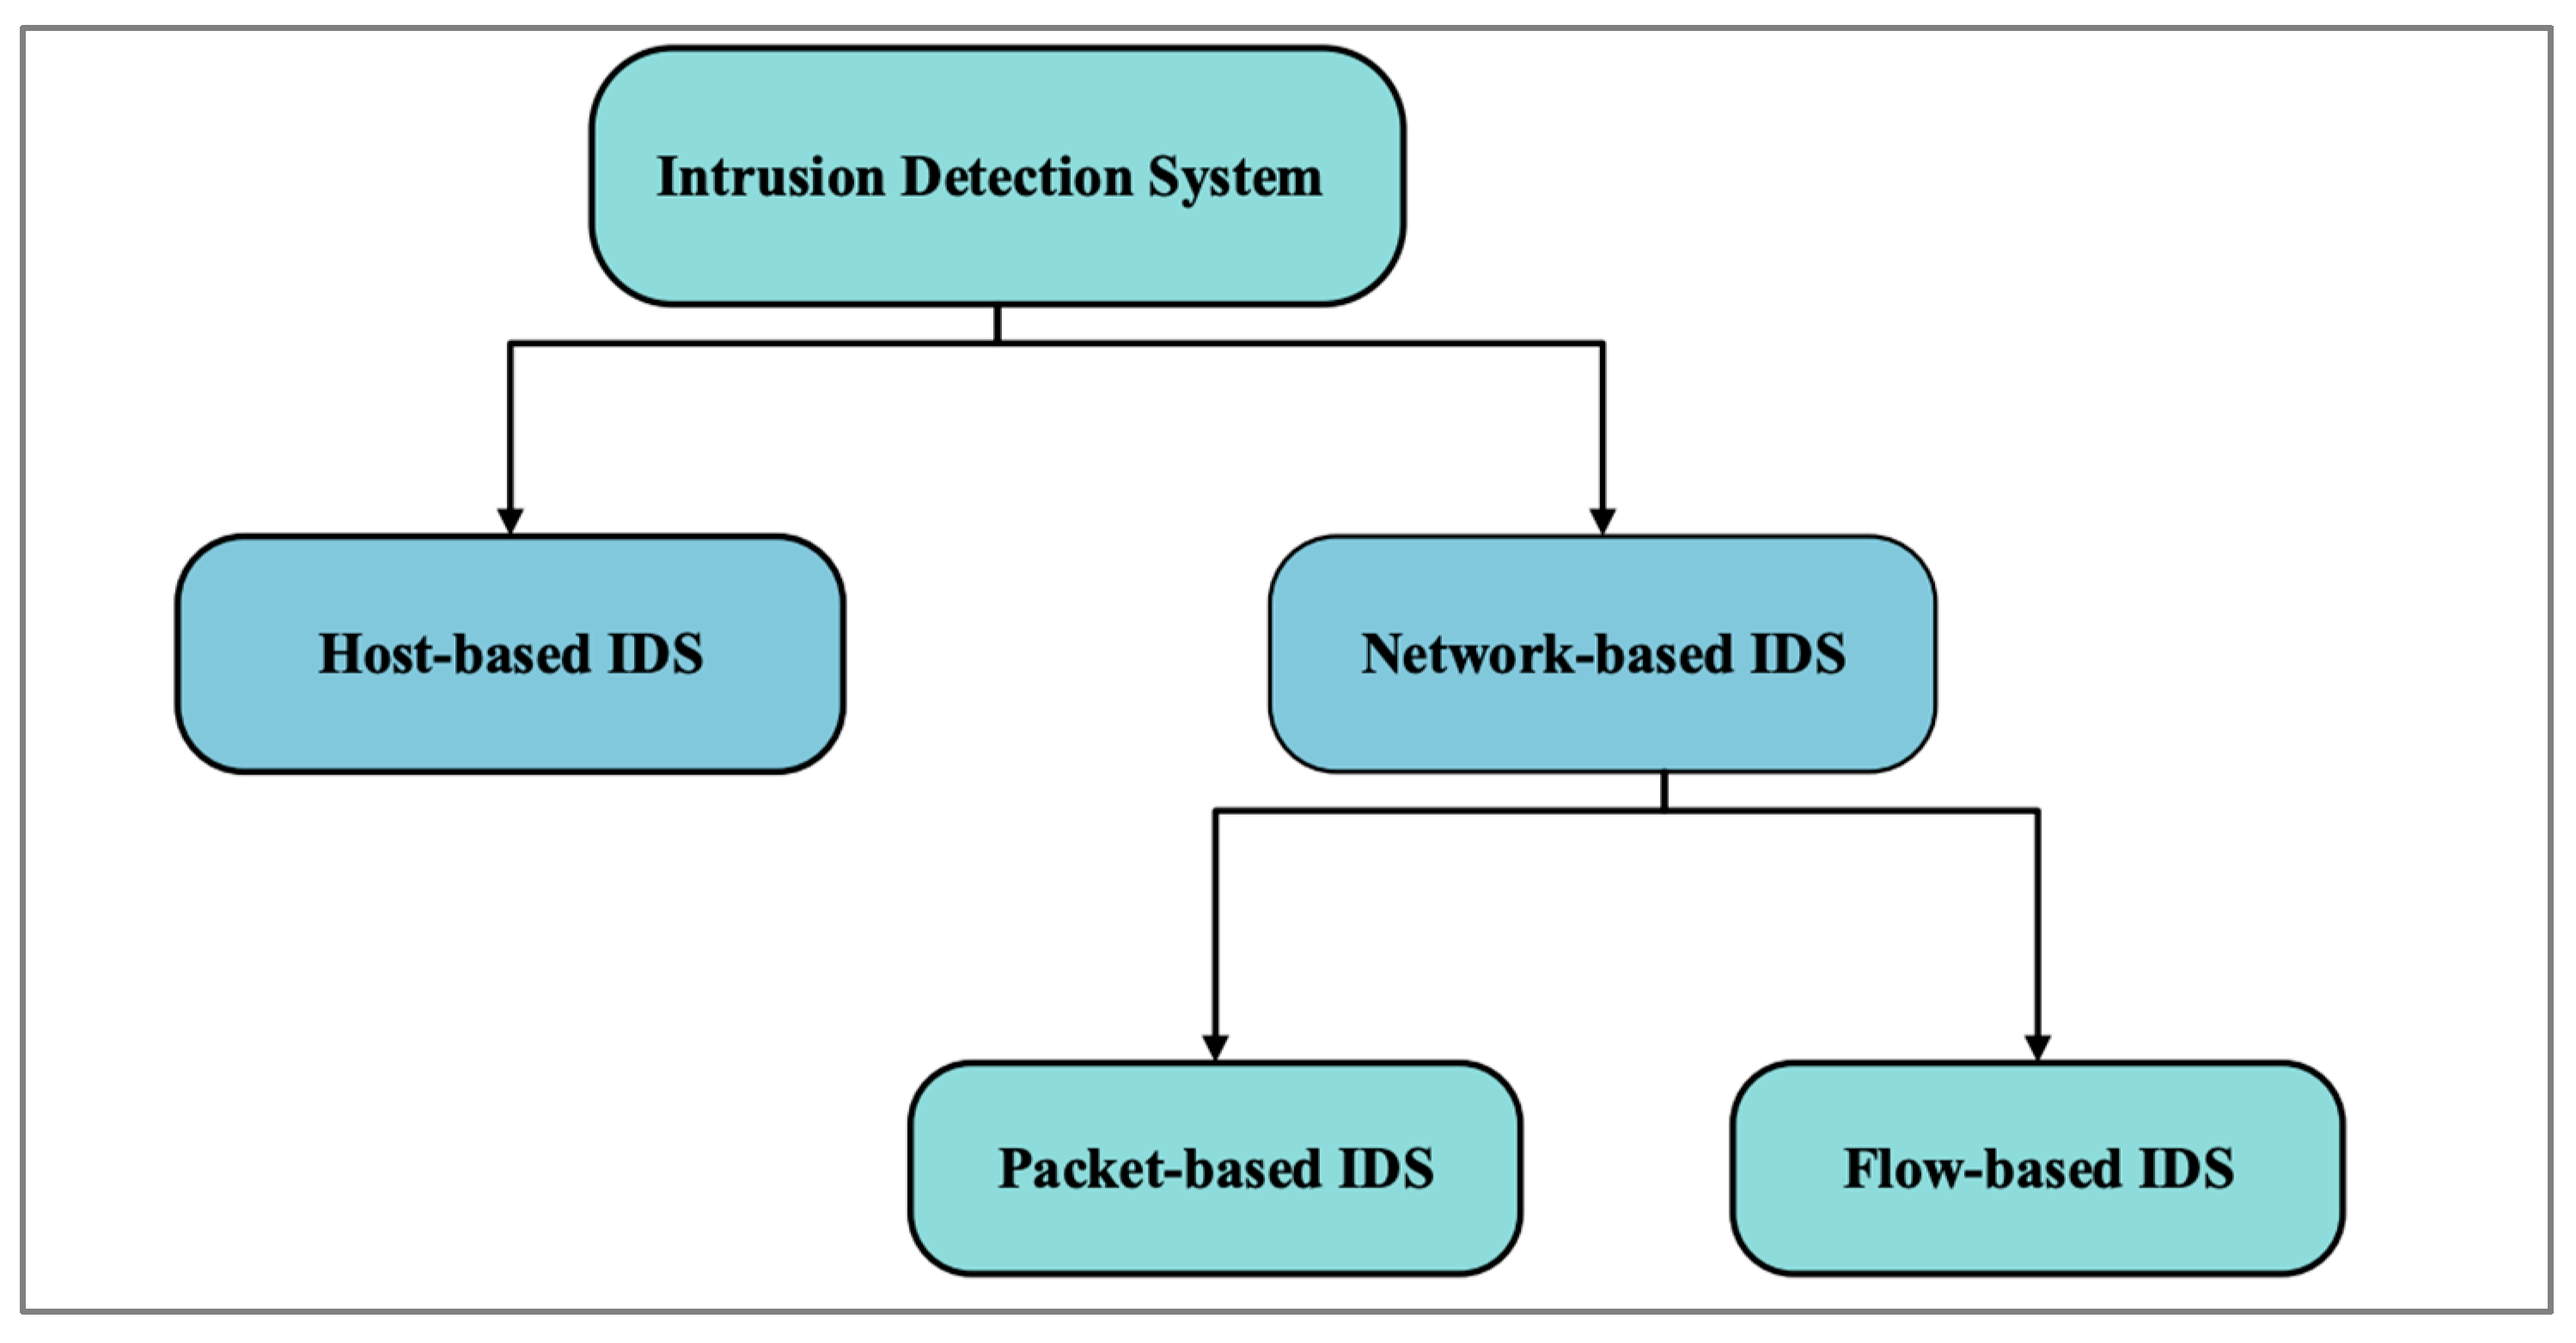
Therefore, researchers are concerned with securing these devices. The intrusion detection field has received heavy research attention worldwide in order to resolve this issue. IDSs designed specifically for IoT environments are crucial for mitigating IoT-related security attacks. An IDS is a security mechanism that works mostly at the network layer of an IoT system. For an IoT system to be fully effective, the IDS must be able to analyze packets of data at different layers of the IoT network with different protocol stacks, generate responses in real time and adapt to a variety of technologies based on the IoT environment [
3]. Smart environments that rely on the IoT require IDSs with a high data volume, high performance and fast response time. As a result, conventional IDSs may not be completely suitable for IoT environments [
7]. However, designing an efficient IDS for IoT devices remains a challenge for a number of reasons: detection systems for IoT environments must be extremely lightweight and use minimal storage space and computing power [
8]. Also, for detection and classification, the number of features must be kept as simple as possible [
8]. Using all features in the design of an IDS can introduce redundant and irrelevant features. To achieve effective IDS performance, feature optimization is necessary. Moreover, many of the existing datasets are outdated and may be inefficient at capturing the behavioral patterns of modern cyberattacks. However, little information is available about recent attacks or their patterns [
7]. So, finding suitable datasets to train and test the detection system is challenging [
7]. Therefore, this paper aims to:
Propose an IDS defense mechanism based on anomaly detection and machine earning (ML) techniques in order to prevent hackers from successfully attacking IoT networks.
Select the most relevant and important features using the CFS algorithm and GA and compare them.
Determine the optimal ML classifier model for detecting and classifying DoS traffic in IoT networks by evaluating four types of supervised classifier algorithms, KNN, SVM, DT, and RF. Then, apply a confusion matrix to analyze the results.
This paper builds upon our previous study about the threats to IoT, in which we found that DoS attacks pose the most threat to IoT networks and that detection techniques are required to address this challenge [
9].
3. Existing Work
Verma et al. [
3] discussed the role of anomaly-based IDS in securing IoT against DoS attacks. A performance evaluation of seven ML classification algorithms is conducted, including RF, adaboost, gradient-boosted machines, extremely randomized trees, classification and regression trees, and multi-layer perceptron. To determine the optimal parameters of classifiers, they used random search algorithms. Various factors are taken into account when measuring classifier performance, including accuracy, specificity, sensitivity, false positive rate, and area under the receiver operating characteristic curve. The CIDDS-001, UNSW-NB15, and NSL-KDD datasets are used to benchmark all classifiers. To find significant differences among classifiers, Friedman and Nmenyi post-host tests are applied to the statistical analysis of performance measures. Furthermore, the authors evaluated all of the classifiers’ response times using the Raspberry Pi hardware device. Based on the performance results and statistical tests, they found that classification and regression trees, as well as extreme gradient-boosting classifiers, are optimal for building anomaly-based IDS that are tailored to the IoT environment.
Khatib et al. [
6] presented ML solutions that detect and protect systems from abnormal states. Furthermore, several ML classifiers were used to analyze the effect of data oversampling on ML models. They also studied the binary and multiclass cases and compared the different techniques used after resampling and balancing the dataset using the SMOTE method. The results showed that when employing this kind of data to identify cyberattacks on IoT network traffic, Linear Discriminant Analysis (LDA), RF, DT, the approaches performed better than others since they were able to predict assaults with a higher degree of accuracy. Also, it was found that the DT, RF, and Nystrom-SVM techniques performed better in the binary case, which is the first time the same technique has been applied for detecting attacks in IoT network traffic. They noticed that when they trained their algorithms with balanced data, they were able to detect attacks more efficiently.
Khammassi et al. [
12] presented a feature selection approach for IDS to produce a subset of features suitable for classifying the KDD99 and UNSW-NB15 datasets. There are three stages in the proposed approach: preprocessing, feature selection, and classification. During the preprocessing phase, redundant records are eliminated, the datasets are resampled, and attribute values are modified to make them compatible with Logistic Regression (LR) classifiers. The feature selection stage uses the Genetic Algorithm-Logistic Regression (GA-LR) wrapper, which involves an interaction between a GA-based feature search and an LR-based learning algorithm. Optimal subsets are selected by maximizing the accuracy of classification and minimizing features. As a result of the GA-LR wrapper, the best subset of features is used for classification. Three decision tree classifiers—C4.5, RF, and NBTree—are used to assess and compare the produced feature subsets against other current methods throughout the classification step. With only 18 features in the KDD99 dataset, the experimental results showed a 99.90% classification accuracy, a 99.81% detection rate (DR), and a 0.105% false alarm rate (FAR). In addition, the selected subset offers a good DR of 99.98% for the DoS category. For UNSW-NB15, the lowest FAR was 6.39%, and the classification accuracy was good in comparison to other approaches with a subset of 20 features. As a result of these findings, the UNSW-NB15 dataset is more complex than the KDD99 dataset. To improve the accuracy of classification for the new IDS benchmark, they suggest trying other approaches.
Mukherjee et al. [
13] proposed to identify anomalies in smart devices and IoT systems. A supervised learning model was used to predict anomalies in historical data, which could be incorporated into real-world scenarios, preventing future anomalies and attacks. ML models are used to predict anomalies on 350 K datasets, and their performance is compared with the state of the art. Two different approaches are used based on the dataset analysis. Initially, the classification algorithms were applied to the entire dataset, and after excluding data points with binary values (0 and 1) in the feature “value”, the same classification algorithms were applied, and the results have been 99.4% accurate in the first case and 99.99% accurate in the second case.
Brun et al. [
14] provided a methodology for network attacks against IoT gateways to be detected online. Using a set of metrics extracted from packet captures, the methodology predicts that there is a possibility of a network attack using a deep-learning approach. Based on empirical validation results on packet captures containing attacks, the Dense Random Neural Network (RNN) detects attacks correctly.
Tyagi et al. [
15] developed an IDS based on extracted novel feature sets synthesizing the BoT-IoT dataset that can accurately and automatically distinguish benign and malicious traffic in real-time. An IoT-specific lightweight feature set consisting of seven lightweight features was developed instead of using existing feature reduction techniques such as principal component analysis (PCA), which can change the core meaning of variables. The study shows that fabricated seven features can be used to detect four types of attacks, such as distributed DoS (DDoS), DoS, reconnaissance, and information theft. Further, the study demonstrated the efficiency and applicability of supervised ML algorithms such as KNN, LR, SVM, multilayer perceptron (MLP), DTs, and RF in IoT security. A variety of performance metrics, including accuracy, precision, recall, F-Score, and receiver operating characteristics (ROC), are used to validate the performance of the proposed system. They found that DT and RF classifiers both performed nearly as well in terms of accuracy (99.9%), but other metrics like training and testing times indicated that RF was superior.
Thamilarasu et al. [
16] proposed an intelligent IDS that detects anomalous behavior on insecure IoT networks by combining network virtualization with the Deep Learning (DL) algorithm. The IDS can detect attacks relating to the IoT, such as blackholes, opportunistic attacks, DDoS, sinkholes, and wormholes. An approach based on deep learning is used to detect attacks. In the proposed system, features are selected based on the information gained at each Deep Neural Network (DNN) layer. Based on the results of the proposed deep learning model, the true positive rate was 97%, and the average precision was 95% for all attacks. A total of five models have been developed for the detection of each attack type. In their experiments, they found that it is both practical and feasible to use DL algorithms for effective anomaly detection in the IoT environment, based on network simulations and testbeds.
Anthi et al. [
17] proposed a framework that uses ML classifiers to identify network probing and simple DoS attacks (SYN flood, UDP flood). For DoS attack detection, the proposed system showed low precision (high false positive (FP)) and low recall (high false negative (FN)). Therefore, it does not deliver promising results for detecting attacks.
Ye et al. [
18] combined the SVM classification algorithms with the simulation platforms of mininet and floodlight to construct the Software-Defined Networks (SDN) environment, and the 6-tuple characteristic values of the switch flow table were extracted. They also implemented deep packet analysis for detecting DDoS attacks in SDN by analyzing flow entries (such as source IP, destination IP, source port, destination port, and number of packets). Since the characteristic values are attack-dependent, they fail for other types of attacks besides DDoS attacks. Using the proposed IDS, the false alarm rate reaches 0%, which is virtually impossible in reality. Based on their experiments, the accuracy rate of their method is 95.24% with a small amount of data collection.
Kostas [
19] proposed an anomaly detection network using ML methods. CICIDS2017 was used as a dataset since it is up-to-date and has a wide variety of attacks. An RF regression algorithm was used for feature selection on this dataset. A total of seven ML algorithms were used in the application step, all of which produced high performance. These are the following ML algorithms and success rates: Naive Bayes (86%), Quadratic Discriminant Analysis (QDA) (86%), RF (94%), ID3 (95%), AdaBoost (94%), MLP (83%), and KNN (97%).
Alsheikh et al. [
20] proposed a framework that integrates RF algorithms for classification jobs and additive regression techniques for anomaly detection in medical wireless sensor networks (WSNs). The framework was tested on real medical datasets available from reliable sources and achieved both spatial and temporal anomaly detection. The research team found that ML algorithms and techniques can be instrumental in devising a framework for fault and anomaly detection in medical WSNs.
Hasan et al. [
21] analyzed several ML models to predict attacks and anomalies on IoT systems. A number of ML algorithms were used, including LR, SVM, DT, RF, and artificial neural networks (ANN). In comparing performance, accuracy, precision, recall, and F1 score are used as evaluation metrics. A 99.4% test accuracy was achieved for DT, RF, and ANN. Even though these three techniques have similar accuracy, other metrics suggest that RF performs better.
Ramadan et al. [
22] proposed a hybrid IDS system that detects IoT network attacks. Preprocessing and classification are the two stages of the proposed system. Data preprocessing is performed on the NSL-KDD dataset by encoding, scaling, and removing noise. Enhanced Shuffled Frog Leaping (ESFL) is then used to extract relevant features. A hybrid IDS system known as the Light Convolutional Neural Network with Gated Recurrent Neural Network (LCNN-GRNN) is used for classification. An anomaly class or a normal class depends on this classification. Based on the experimental results, the proposed system performed better than the existing methods.
Aversano et al. [
1] proposed a DL-based anomaly detection method for IoT scenarios. Using a DNN architecture and 70 features, they detected anomalies in network traffic and identified the type of attack. Additionally, an autoencoder and a hyperparameter optimization analysis are used to reduce the number of features. To conduct experiments, they developed an integrated dataset based on public IoT traffic traces. In all the scenarios analyzed, the results show good performance. With all features included in the binary classification, the best accuracy is obtained at 99.89% in the top hyperparameter permutation. Furthermore, feature reduction leads to stable classifier performance (using a PCA and a 9-layer autoencoder, for example, to obtain accuracy greater than or equal to 99.2% when there are greater than 35 features). The 70 considered features in the multinomial classifier are too many, and fewer features are likely to provide better and more reliable results. However, when using a 9-layer autoencoder for feature reduction, the best accuracy is 98.9% obtained when the number of features is 60. When the number of features is between 35 and 60, this feature reduction approach ensures better performance. Finally, the optimized DNN architecture is evaluated in a noisy scenario that involves some of the features considered. It was also found that adding Gaussian noise in up to 40% of the features considered did not affect performance too much, especially for the binary case.
Lopez-Martin et al. [
23] propose a new network intrusion detection method for IoT networks. Based on a conditional variational autoencoder, the proposed method integrates intrusion labels within the decoder layers. It provides better classification results than other familiar classifiers and is less complex than other unsupervised methods based on variational autoencoders. Furthermore, the method recovered missing features from the incomplete training datasets by performing feature reconstruction. The Network Intrusion Detection System (NID), which is part of network monitoring systems, and IoT networks can use both capabilities. This model performs exceptionally well for both tasks, performing better on the NSL-KDD test dataset, for example, than well-known algorithms: RF, linear SVM, multinomial logistic regression, and multilayer perceptions. The model creates a single model in a single training step, regardless of the labels associated with the training data. Classifiers based on variational autoencoders need to create as many models as there are distinct label values, each requiring a different training step. It takes a great deal of computational effort and resources to complete the training steps. Models can recover missing categorical features with three, 11, and 70 values, respectively, with 99%, 92%, and 71% accuracy. Multilabel classification and feature reconstruction problems are evaluated using extensive performance metrics. For predicted or reconstructed labels, they provided aggregated and one-versus-rest metrics, such as accuracy, F1, precision, and recall.
Yihunie et al. [
24] analyzed anomaly-based IDS using ML techniques. A total of five ML classifiers were applied to the NSL-KDD dataset: stochastic gradient descent, RF, logistic regression, SVM, and sequential model. In spite of the fact that the NSL-KDD dataset does not accurately represent current network traffic, it is used in that research due to the lack of a publicly available dataset. Five different classification algorithms were tested with and without one-hot encoding. Based on the results, RF outperformed the other four classifiers. The RF classifier achieved near-perfect results. The RF model achieved the highest recall, indicating that a minimum number of false negatives were encountered.
Kim et al. [
25] presented a GA to improve the detection model in network IDSs based on SVM. In addition, IDS should be able to handle misuses as well as novel attacks, and it should process audit data with minimal overhead on the computer system and IDS itself. The performance of SVMs has been shown to be better than that of traditional classification methods. It is true that SVM-based IDS can improve IDS performance in terms of detection rates and learning speed compared to conventional algorithms like neural networks (NNs), but there is still room for improvement. It is often the case that the overall performance of IDS is severely degraded as the number of features in the audit data increases. In order to overcome these problems, they employed the GA technique, which provides fast and excellent optimization for IDS, to determine the optimal detection model. On the KDD99 intrusion detection dataset, they demonstrated the feasibility of the proposed system. Finally, the paper method is not only capable of determining the optimal detection model but also minimizes the number of features that an SVM classifier should process and therefore maximizes detection rates.
Meng [
26] conducted a broader and deeper experiment to compare the performance of NNs, SVM, and DT with the aim of demonstrating the practice and exploring the issues of using such types of approaches to detect network anomalies. Also discussed and analyzed are the effects of feature selection. Their experimental results indicate that ML approaches are capable of identifying anomalies with proper training, but the performance may vary depending on the algorithm. The wide use of ML schemes in real-life operational environments is hindered by fluctuations in capability, false alarm rates, and training data difficulties. In order to enhance detection performance, ML schemes should be applied in an appropriate manner.
Al-Janabi et al. [
27] developed an anomaly-based IDS that uses artificial NLs to detect and classify attacks. Three main modes of operation are available for the developed system: detection mode (for distinguishing normal from abnormal actions), detection and classification mode (for further categorizing abnormal events into four types of attacks: DOS, PROB, U2R, or R2L), and detailed classification mode (for dividing abnormal events into 29 types of sub attacks). Additionally, anomaly intrusion detection parameters are applied to packet behavior. IDSs can learn a system’s behavior using several methods. To learn the behaviors of a system, the proposed IDS uses a back propagation ANN. KDD99 was used in their experiments, and the results were obtained to meet the objectives.
Shurman et al. [
28] introduced a hybrid-based intrusion detection system (IDS) framework for IoT networks that can identify suspicious network traffic from any node. They ran datasets of IPs against the design to determine how it could identify strange packets on the network and block undesirable IPs before they become an initial DoS threat.
Mamatha et al. [
29] proposed an intrusion acknowledgment system that is characterized by four essential stages: Aggregation of data, where groupings of framework packages are gathered. In the second stage, data preprocessing is performed, in which getting ready and test data are prepared and fundamental features are selected to distinguish between classes. During the period of data gathering, data is first compiled to make the central features, like those in the KDD Cup 99 dataset. The third stage involves preparing the classifier, where the model for the request is prepared. Lastly, the readied classifier is used to detect intrusions on the test data during attack affirmation. A channel-based fragment affirmation calculation, explicitly based on Flexible Mutual Information Feature Selection (FMIFS), has been proposed. The FMIFS calculations are adjusted according to Battiti’s figures in order to diminish the number of highlights. In order to reduce the plenitude of highlights, FMIFS proposes an adjustment as per Battiti’s calculations. In FMIFS, the excess parameter that is required in Mutual Information Feature Selection (MIFS) and Modified Mutual Information Feature Selection (MMIFS) is discarded. In spite of the fact that there is no set framework or rule for determining the best inspiration, this can be intriguing a little while later. To create an IDS, FMIFS and least-squares support vector machines (LSSVM) are combined. LSSVM works with correspondence objectives rather than distinction obstacles as an alternative to quadratic programming problems for solving social event issues. LSSVMIDS and FMIFS were studied using three well-understood impedance disclosure datasets: KDD Cup 99, NSL-KDD, and Kyoto 2006+. LSSVMIDS is computationally efficient when using the proposed feature selection algorithm.
Albulayhi et al. [
30] developed and implemented a novel approach to feature selection and extraction for anomaly-based IDS. To select and extract relevant features, two entropy-based approaches are used: information gain (IG) and gain ratio (GR). After that, the best features are extracted using mathematical set theory: union and intersection. Four ML algorithms are used to train and test the model framework on the IoT intrusion dataset 2020 (IoTID20) and NSL-KDD datasets: bagging, multilayer perception, J48, and IBk. Based on the intersection and union, 13 and 28 relevant features (out of 86) were obtained for IoTID20 and 15 and 25 relevant features (out of 41) for NSL-KDD, respectively. In addition, they compared the proposed approach with other state-of-the-art studies. Based on the comparison, their proposed model scores a very high 99.98% classification accuracy.
Krishnan et al. [
31] evaluated a number of supervised feature selection methods in order to predict malicious network traffic against IoT devices. Three different methods of feature selection were employed: sequential backward processing, sequential forward processing, and recursive feature elimination (RFE). Furthermore, for each selection method, three different logistic regression techniques were implemented. According to the study, all three methods of logistic regression (Support Vector Classifier (SVC), RF, and XGBoost) performed well with high accuracy. As a result, these techniques can be used in a supervised learning setting to predict an attack on IoT devices.
Qaddoura et al. [
32] proposed a three-stage approach involving clustering with reduction, oversampling, and classification using a single-hidden layer feed-forward neural network (SLFN). A novel aspect of the paper is how the data reduction technique and the oversampling technique are combined to generate useful and balanced training data and the hybrid approach used for detecting intrusion activities. As part of the experiments, accuracy, precision, recall, and G-mean were evaluated. They were divided into four steps: assessing the impact of data reduction with clustering, evaluating the framework with basic classifiers, evaluating the effect of oversampling, and comparing it to basic classifiers. It is found that SLFN classifications and SVM with Synthetic Minority Oversampling Technique (SVM-SMOTE) with 0.9 ratio and k value 3 for the k-means++ clustering technique produce better results than other classification techniques and other values.
Choudhary et al. [
33] propose an IDS based on deep learning using SVM and DNN. Since SVMs are binary classifiers, only two routes were classified at a time for the appropriate route to be shown. Cosine similarity measures and deployment models have been introduced to understand route similarity. Measurements of precision, recall, F-measure, and accuracy have been performed to assess the proposed work. A comparison of the proposed architecture with other state-of-the-art techniques has been conducted to determine its effectiveness. Compared with other approaches, precision, recall, F-measure, and accuracy improved by 13%, 74%, 71%, and 76%, respectively.
Mohan Sai et al. [
34] utilized a Raspberry Pi to implement a lightweight intrusion detection technique using a ML approach. Their method of classifying attack traffic and normal traffic was based on an SVM. To reduce the number of features in a dataset, a CFS algorithm is used. The dataset used was UNSW-NB 15, and the features were reduced from 44 to 3. These three features were used to train the model. The CFS model was compared to the non-CFS model using a laptop since it was impossible to train the model using all 44 instances on a Raspberry Pi, resulting in system failure. In the evaluation, the DoS attack instances are extracted from UNSWNB 15 and evaluated using the WEKA application. By reducing the number of features in the system, the CFS algorithm makes the system lightweight by enhancing detection accuracy. As a result of their experiments, they have found that their approach for detecting a DoS attack has a satisfactory detection rate and accuracy.
Naung Soe et al. [
8] also developed an IoT cyber-attack detection system using ML technology. For the feature selection, they employed a lightweight and efficient feature selection algorithm, CFS, and a well-known DT version, the J48 algorithm, to carry out the classification. The system was implemented on a Raspberry Pi, and its performance was evaluated using UNSW-NBI5. During the experiment, the system was able to handle all the instances in this dataset and had a much faster training speed while retaining almost no degradation in detection accuracy. Moreover, if the step of feature selection was not taken, the system would only be able to handle 80% of the instances. The analysis of the above works is listed in
Table 1.
In
Table 2, the related literature is compared to our proposed system based on the following characteristics:
Dataset: name of the dataset used to train the system.
Feature selection approach: approach or algorithm used to select the best feature for detecting and classifying the attacks.
Performance metrics: the metrics used to evaluate the performance of the system.
Average detection rate or accuracy: the average or best detection or accuracy rate the system achieved.
Table 2.
Experimental comparison of related work.
Table 2.
Experimental comparison of related work.
| Author | Dataset | Performance Metrics | Feature Selection Approach | Average Detection Rate or Accuracy |
|---|
| Aversano et al. [1] | Integrated dataset based on public IoT traffic traces | Accuracy and F-measure | Autoencoder and a hyperparameter optimization analysis | The best accuracy is obtained (0:9989 for the top hyperparameter permutation). |
| Verma et al. [3] | CIDDS-001, UNSW-NB15, and NSL-KDD | Accuracy, specificity, sensitivity, false positive rate, and area under the receiver operating characteristic curve | Random search algorithms | 96.74%
By using CART |
| Khatib et al. [6] | UNSW-NB15 | Accuracy, recall, F1 score, and ROC AUC curve | Not mentioned | 95% accuracy with DT, RF, and Nystrom-SVM |
| Naung Soe et al. [8] | UNSW-NB 15 | Processing time and detection accuracy | CFS | Not mentioned |
| Khammassi et al. [12] | KDD99 dataset and the UNSW-NB15 dataset | Accuracy, Recall, DR, FAR | Wrapper, GA, and LR | With a subset of only 18 features, the KDD99 dataset showed 99.90% accuracy of classification, 99.81% DR, and 0.105% FAR. |
| Mukherjee et al. [13] | From the ML data repository Kaggle, which was provided by Xavier. | Accuracy | Not mentioned | 99.4% accuracy in the first case and 99.99% accuracy in the second case |
| Brun et al. [14] | Own a simulated dataset | Time series of the difference between the numbers of initiated and established TCP connexions per time slot, attack probability predicted by the dense RNN | Not mentioned | Time-series of the difference between the numbers of initiated and established TCP connections per time slot (10 s) |
| Tyagi et al. [15] | BoT-IoT dataset | Accuracy, precision, recall, F-Score, and ROC | Manual | There is no difference in accuracy between the DT:99.9% and RF: 99.9% classifiers. |
| Thamilarasu et al. [16] | The dataset consists of 5 million network transactions. | Precision, recall, and F1 Score | The selected features are transmission rate, reception rate, transmission-to-reception ratio, duration, transmission mode, source-IP, destination-IP, and data-value information. | Avg. Precision = 96.88%, Avg. Recall = 98.02%, F1 Score = 0.974 |
| Anthi et al. [17] | Own a simulated dataset | Precision, recall, and F-measure | - | Precision: 97.7%; recall: 97.7%; F-measure: 97.7% |
| Ye et al. [18] | Own a simulated dataset | Detection accuracy rate, false alarm rate | Source IP, Destination IP, Source Port, Destination Port, and Number of Packets | Average detection accuracy rate: 95.24%; average false alarm rate: 1.26% |
| Kostas [19] | CICIDS2017 | Accuracy, precision, F-measure, and recall | Random Forest Regressor algorithm | NB: 86%; QDA: 86%; RF: 94%; ID3: 95%; AdaBoost: 94%; MLP: 83%; KNN: 97% |
| Alsheikh et al. [20] | Real medical dataset | ROC curve, absolute error, and run-times | Not mentioned | Not mentioned |
| Hasan et al. [21] | An open-source dataset was collected from Kaggle | Accuracy, precision, recall, F1 score, and area under the receiver operating characteristic curve | No ML approach has been used for feature selection | 99.4% test accuracy for DT, RF and ANN |
| Ramadan et al. [22] | NLS-KDD | False Positive Rate (FPR), accuracy, True Positive Rate (TPR), False Negative Rate (FNR) | The feature selection process is done by using the Enhanced Shuffled Frog Leaping (ESFL) algorithm. | Accuracy of 90.25% in attack detection compared to existing methods |
| Lopez-Martin et al. [23] | NSL-KDD | Accuracy, F1 score, precision, and recall | Latent multivariate probability distribution | Accuracy of 99%, 92%, and 71%, respectively |
| Yihunie et al. [24] | NSL-KDD | Precision, recall, F1 score, ROC curve, and accuracy | One-hot encoding | Accuracy: 99%, precision: 0.9992, recall: 0.9969, F1 score: 0.9980 |
| Kim et al. [25] | KDD99 | Detection rates | GA | Detection rates are more than 99%. |
| Meng [26] | KDD99 | Accuracy and detection rate | Manual | All three algorithms achieve a very high detection rate, more than 94%. |
| Al-Janabi et al. [27] | KDD99 | Detection Rate (DR) and False Positive Rate (FP) | Manual | Not mentioned |
| Shurman et al. [28] | Dataset of IPs | Detection time, accuracy | Not mentioned | Not mentioned |
| Mamatha et al. [29] | KDD99, NSL-KDD, and Kyoto 2006+ | Accuracy, affirmation rate, false positive rate, and F-measure | Flexible Mutual Information Feature Selection (FMIFS) | 100% |
| Albulayhi et al. [30] | IoTID20 and NSL-KDD | Accuracy, recall, precision, F1 Score, and ROC | Information gain (IG) and gain ratio (GR) | 99.98% classification accuracy |
| Krishnan et al. [31] | IoTID20 | Accuracy, F1 score, recall, RMSE | Sequential Backward Processing, Sequential Forward Processing, and Recursive Feature Elimination (RFE) | Best accuracy: 99.79% |
| Qaddoura et al. [32] | IoTID20 | Accuracy, precision, recall and G-mean | Not Applied (all features used) | 98.42% |
| Choudhary et al. [33] | Own a simulated dataset | Accuracy, recall, precision, and F-measure | Not mentioned | Precision: 98.12%, recall: 98.04%, F-measure: 94.88%, accuracy: 98.68% |
| Mohan Sai et al. [34] | UNSW-NB 15 | F-measure, recall, precision FPR, TPR, TNR, True Negative Rate (TNR), and accuracy | CFS | Accuracy: 98% |
4. Methodology
To detect anomalies in IoT devices, ML classification algorithms will be used to build an IDS. This IDS will continuously monitor network traffic for any deviation from normal network profiles based on anomaly detection. There are three types of IDSs that can be used: signatures, anomalies, and specifications. Due to its ability to detect new attacks, an anomaly-based IDS is preferred over a signature- or specification-based IDS. However, it comes with a high false alarm rate. The effectiveness of an anomaly-based IDS depends on the quality of its detection engine (model or classifier) [
3]. An anomaly-based IDS continuously monitors network traffic for deviations from the normal profile. As soon as a deviation exceeds the threshold, an alarm signals the detection of a DoS attack.
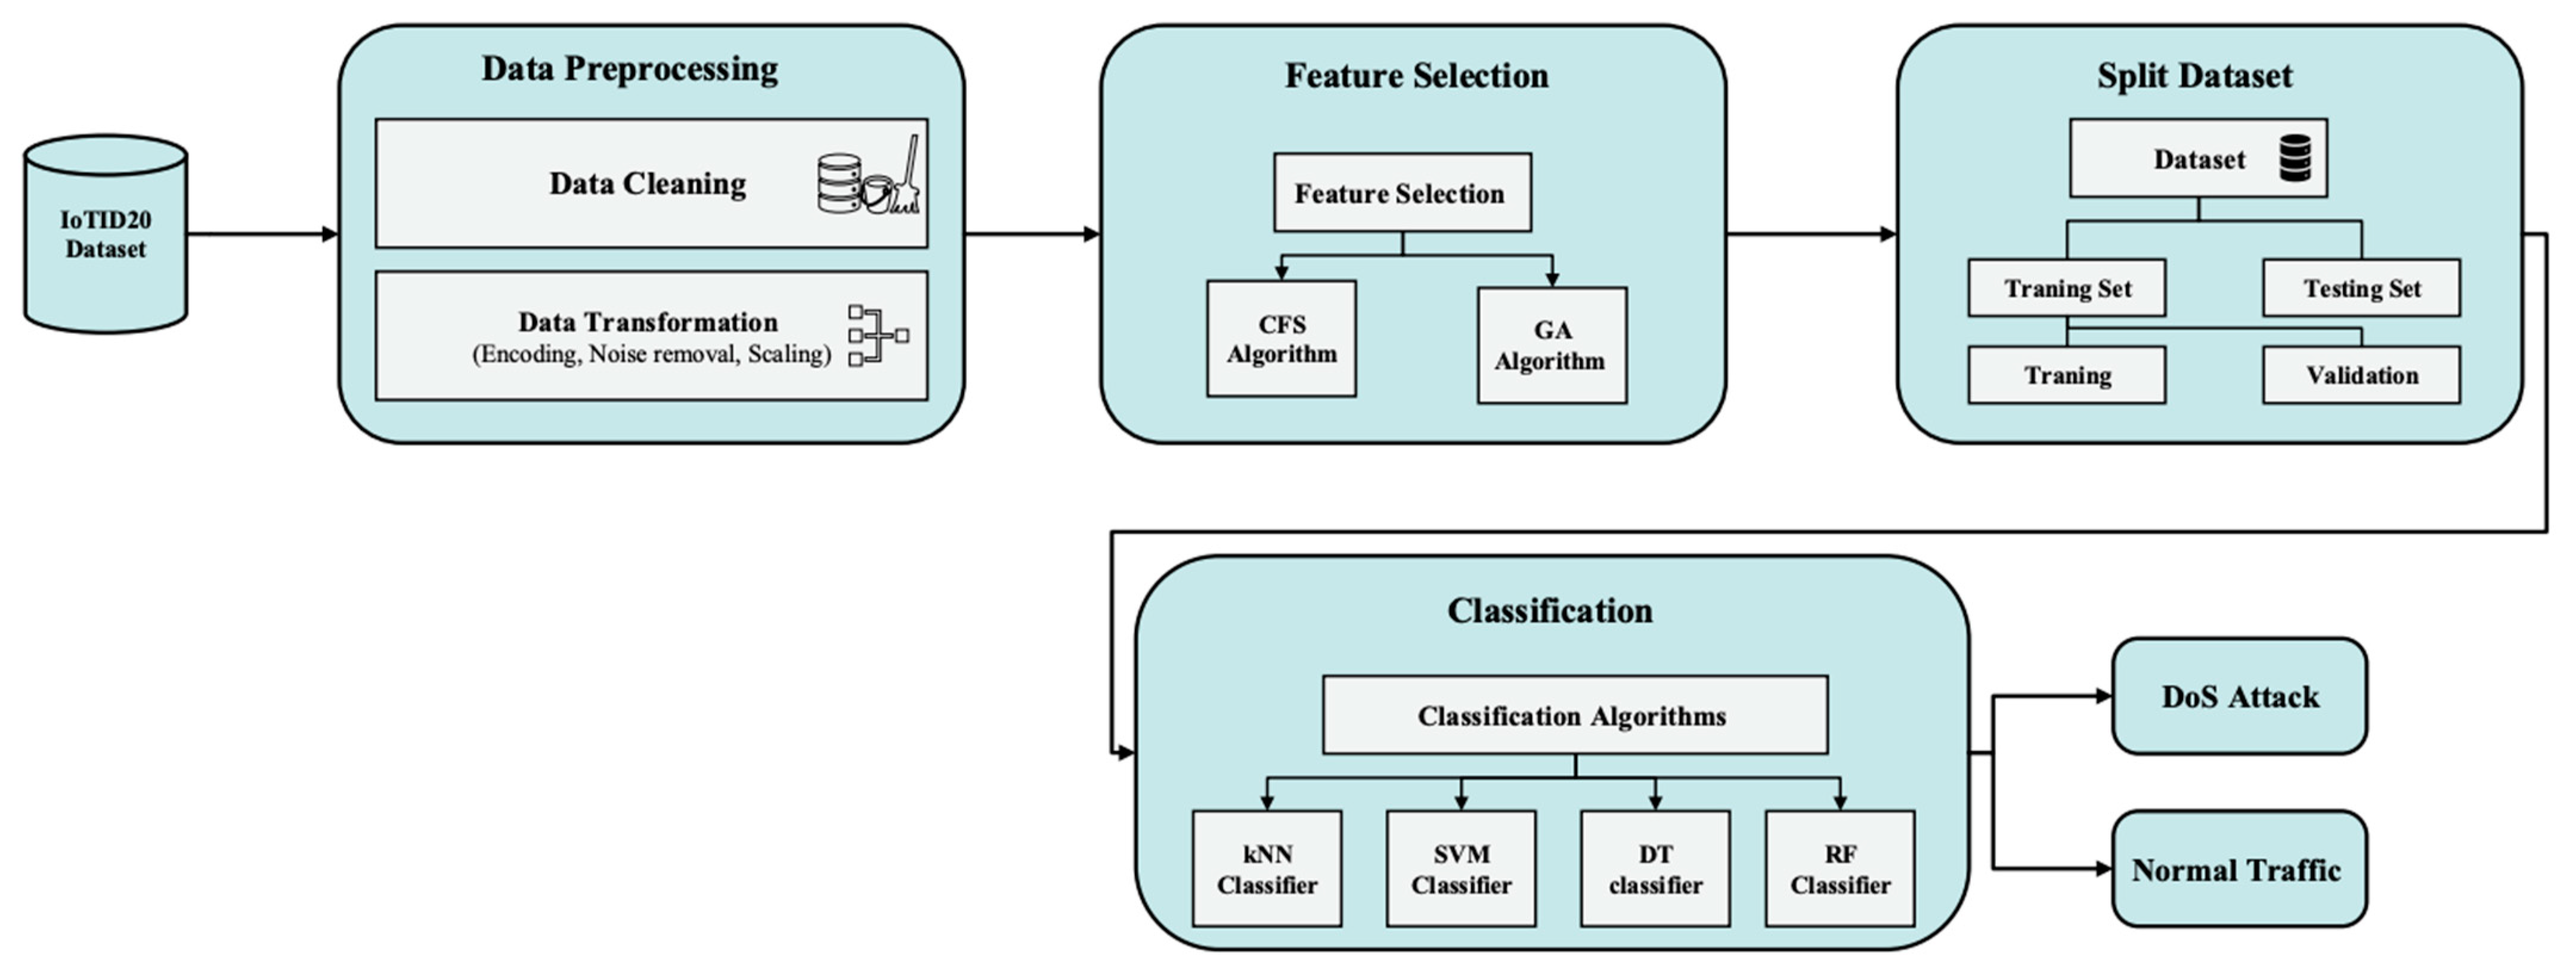
This study will have several key stages, as shown in
Figure 2. To train the system, we will use the IoTID20 dataset, which contains recent types of attacks on IoT networks. We will do some preprocessing on this dataset to improve its quality and prepare it for feature selection and training. Data preprocessing includes cleaning and transformation of the data. Data cleaning involves removing null values and their entries. Whenever there are missing values, the ML algorithm has a difficult time handling them, and the model may produce an incorrect prediction. In addition, the data transformation will include encoding, noise removal, and scaling. In the initial dataset, there are many columns with multiple labels. A label can be defined in the form of a number or a word. Encoding refers to converting labels from a human-readable to a machine-readable format. With the help of filters, noise in the form of irrelevant features is removed by the noise removal process. Scaling is used to scale large amounts of numerical data based on distance values. Following these methods, the final features will be selected from these prepossessed features.
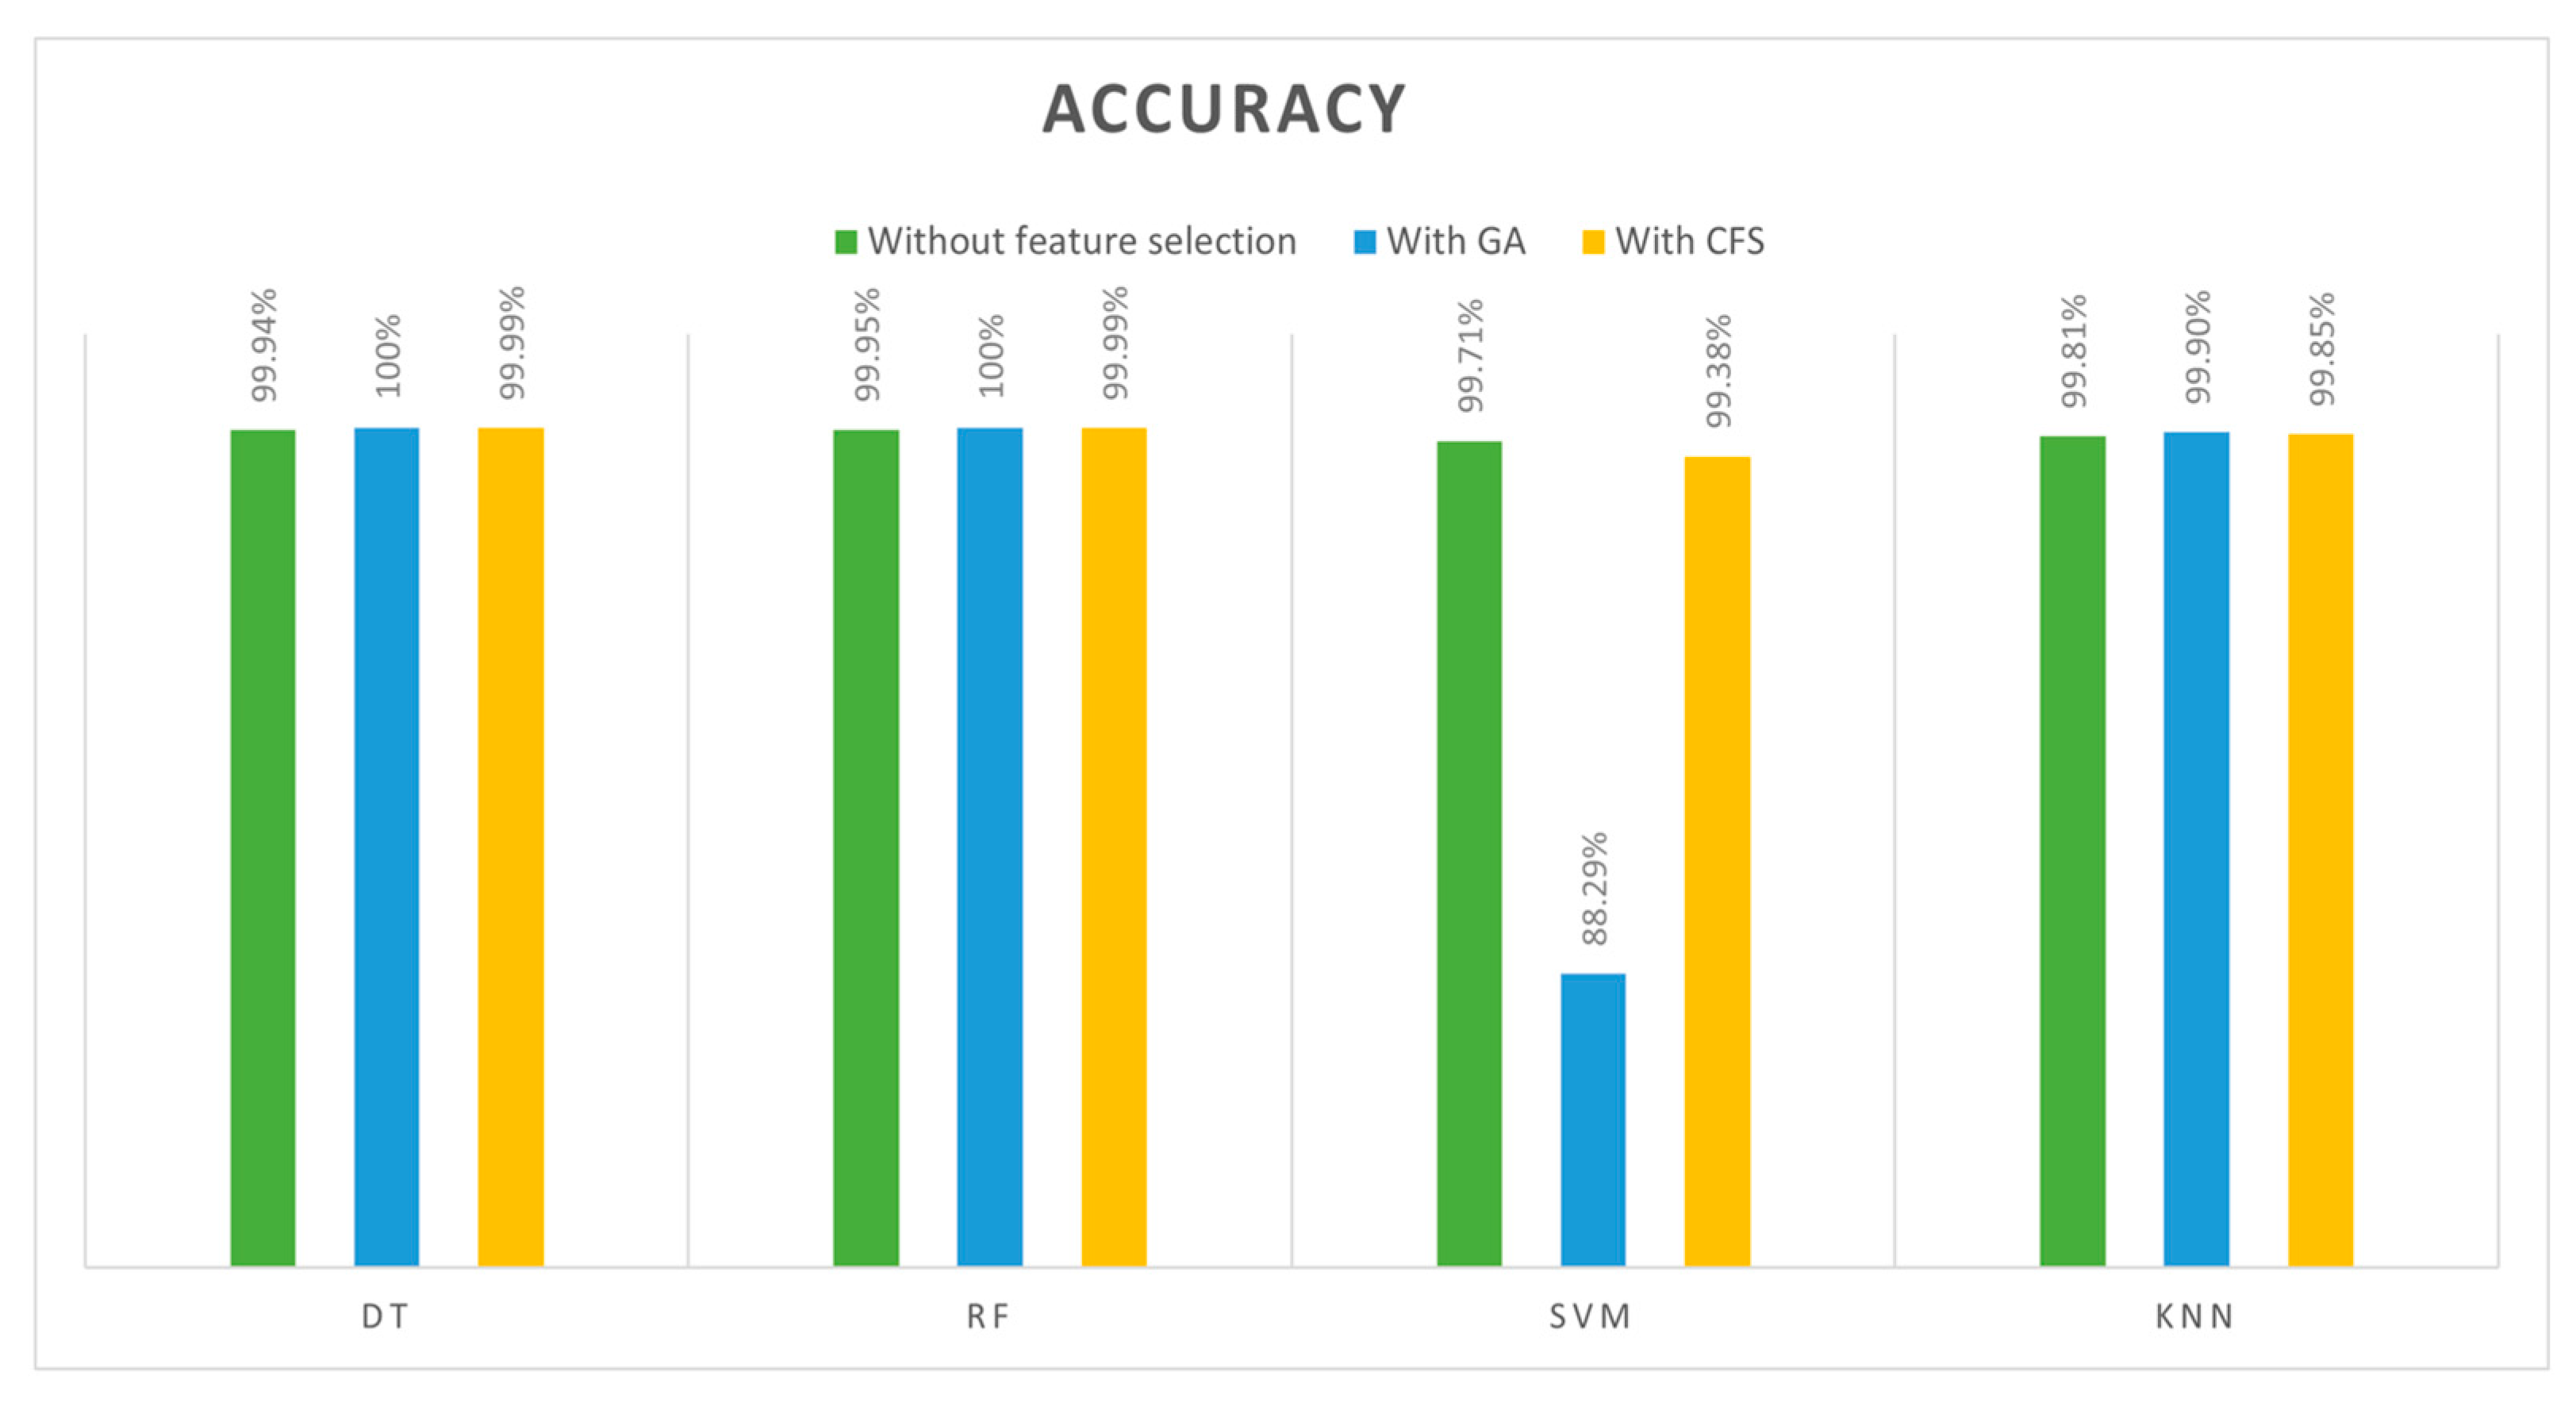
The scaled data will be used as input in the feature selection phase to select the most relevant and important features using a CFS algorithm and GA. After that, we will make a comparison between the feature selection algorithms and select the most appropriate one. After the features are selected, the dataset will be divided into two subsets: the training subset and the test subset. By selecting the right testing and training data, classification accuracy will be improved. The training data is the set of instances trained on the model, while the test data is used to determine the model’s ability or execution. Classification determines whether the information belongs to a normal class or a DoS attack. In order to achieve the best classification approach, a variety of algorithms, such as KNN, SVM, DT, and RF, will be compared. Finally, we will validate our proposed scheme using a confusion matrix.
4.1. Dataset
There are many datasets that can be used to train the system to detect DoS attacks. The dataset must contain real-time network traffic. It is essential that the dataset be versatile and extensive. In addition, the dataset should cover a variety of attack vectors and include the most recent DoS attacks [
35]. According to the literature analysis in
Section 2, the most commonly used datasets are UNSW-NB15, KDD 99, NSL-KDD, IoTID20, and Bot-IoT. We compared these available datasets in
Table 3 to select the dataset with the highest quality to train our system.
According to this compression, the IoTID20 was selected in this study to train the IDS to detect DoS attacks, as it contains the most recent traffic attacks collected in real-time and scans simulate attacks on IoT networks.
IoTID20 Dataset
In the IoTID20 dataset, there are different types of IoT attacks (e.g., DDoS, DoS, Mirai, and ARP Spoofing) as well as normal (benign) traffic. IoTID20 is a dataset collected from smart home IoT ecosystems. Smart homes typically incorporate a variety of interconnected components, including artificial intelligence speakers (SKTNGU), Wi-Fi cameras (EZVIZ), laptops, smartphones, tablets, and wireless access points (Wi-Fi). In this dataset, the cameras and artificial intelligence speakers were the IoT victim equipment, and the other equipment was the attacking equipment. Using Nmap tools, attacks such as DoS, scanning, and man in the middle were simulated. Mirai botnet attacks were generated separately on a laptop, and then changed to simulate their origin on IoT devices [
36]. Using the CICFlowMeter, the IoTID20 dataset created CSV files from these packet files. Based on the IP addresses, the CSV files were labeled according to their anomalous behavior and types of attacks.
Table 4 and
Table 5 show the distribution of the dataset. The dataset contains 86 features.
4.2. Feature Selection Algorithms
In order to improve the detection accuracy and training speed of our system, we needed to use a feature selection algorithm. Feature selection involves eliminating irrelevant and redundant features and selecting those that are most pertinent and relevant. For the feature selection phase, we decided to use two feature selection algorithms and compress between them, which are GA and CFS.
4.2.1. Genetic Algorithm
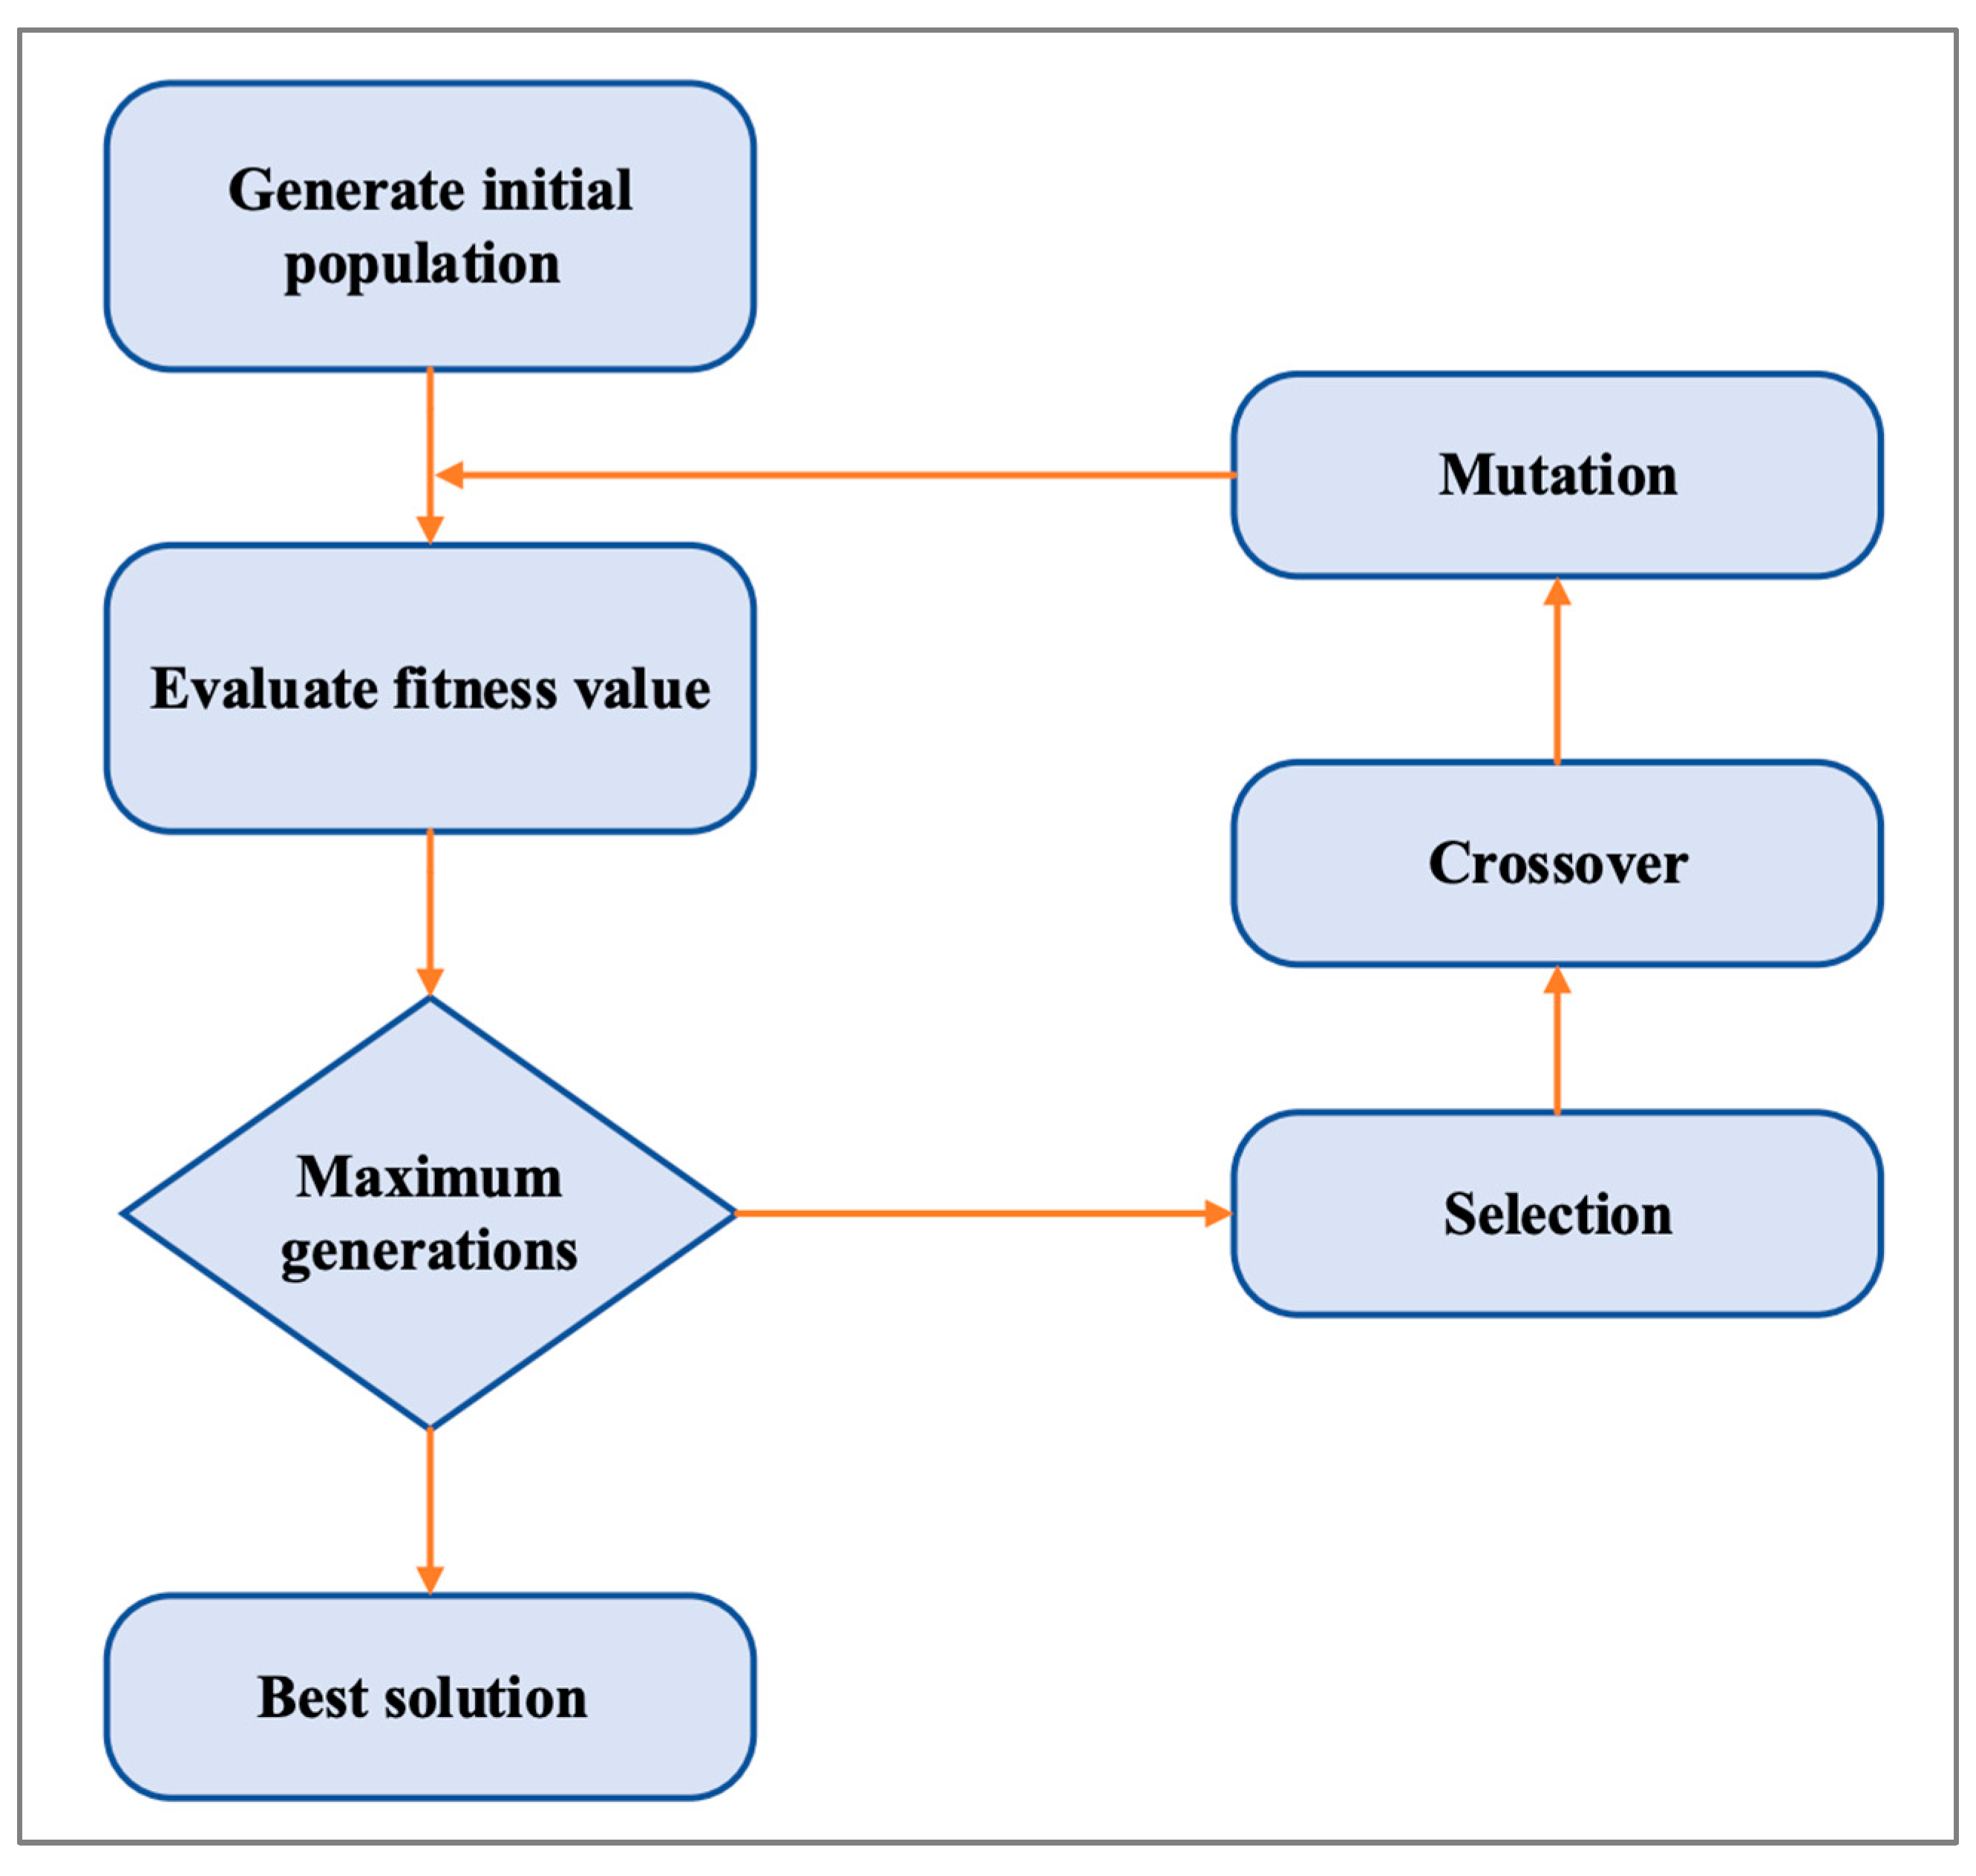
The first algorithm is GA, which is a natural selection-based optimization technique. In GA, a set of optimal values is determined based on evolution. The first step in feature selection is to create a population from subsets of the possible features. Based on this population, subsets are evaluated using a predictive model. In order to determine which subsets of the population will continue into the next generation, each member of the population is considered in a tournament. The next generation is made up of the tournament winners with some cross-over (the winning feature sets are updated with features from other winners) and mutation (some features are introduced or removed randomly) [
37].
Figure 3 shows how the algorithm works. As a result of the algorithm running for a set number of generations (iterations), the optimal member of the population becomes the selected feature.
4.2.2. Correlation-Based Feature Selection
The CFS algorithm is a filter approach used to evaluate the correlation between outputs and input features [
38]. According to empirical evidence, irrelevant or redundant information, which can increase computation time and result in poorer detection accuracy, should also be eliminated [
8]. Redundant features are those that are highly correlated with other features. According to the CFS algorithm, a good feature subset consists of features that are highly correlated with the class and uncorrelated with each other [
8]. The CFS algorithm supports most attribute types, including binary, date, nominal, empty, or unary value attributes [
39]. As shown in
Table 6, both algorithms have advantages and disadvantages.
4.3. Classification Algorithms
There are two types of ML algorithms: supervised and unsupervised. In supervised algorithms, predefined (classified) objects are used to predict the object class. Unsupervised algorithms, in contrast, find the natural grouping of unlabeled objects [
40]. In order to obtain the best performance in our IDS, we will use and compare four types of supervised learning algorithms for classification.
4.3.1. Decision Tree
The first classification algorithm chosen to determine its performance in classifying the DoS attack is DT. This technique is used for solving both classification and regression problems, but generally, it is used for classification problems [
41]. This classifier is tree-structured, where the internal nodes represent the dataset’s features, the branches represent the decision rules, and the leaves represent the outcome [
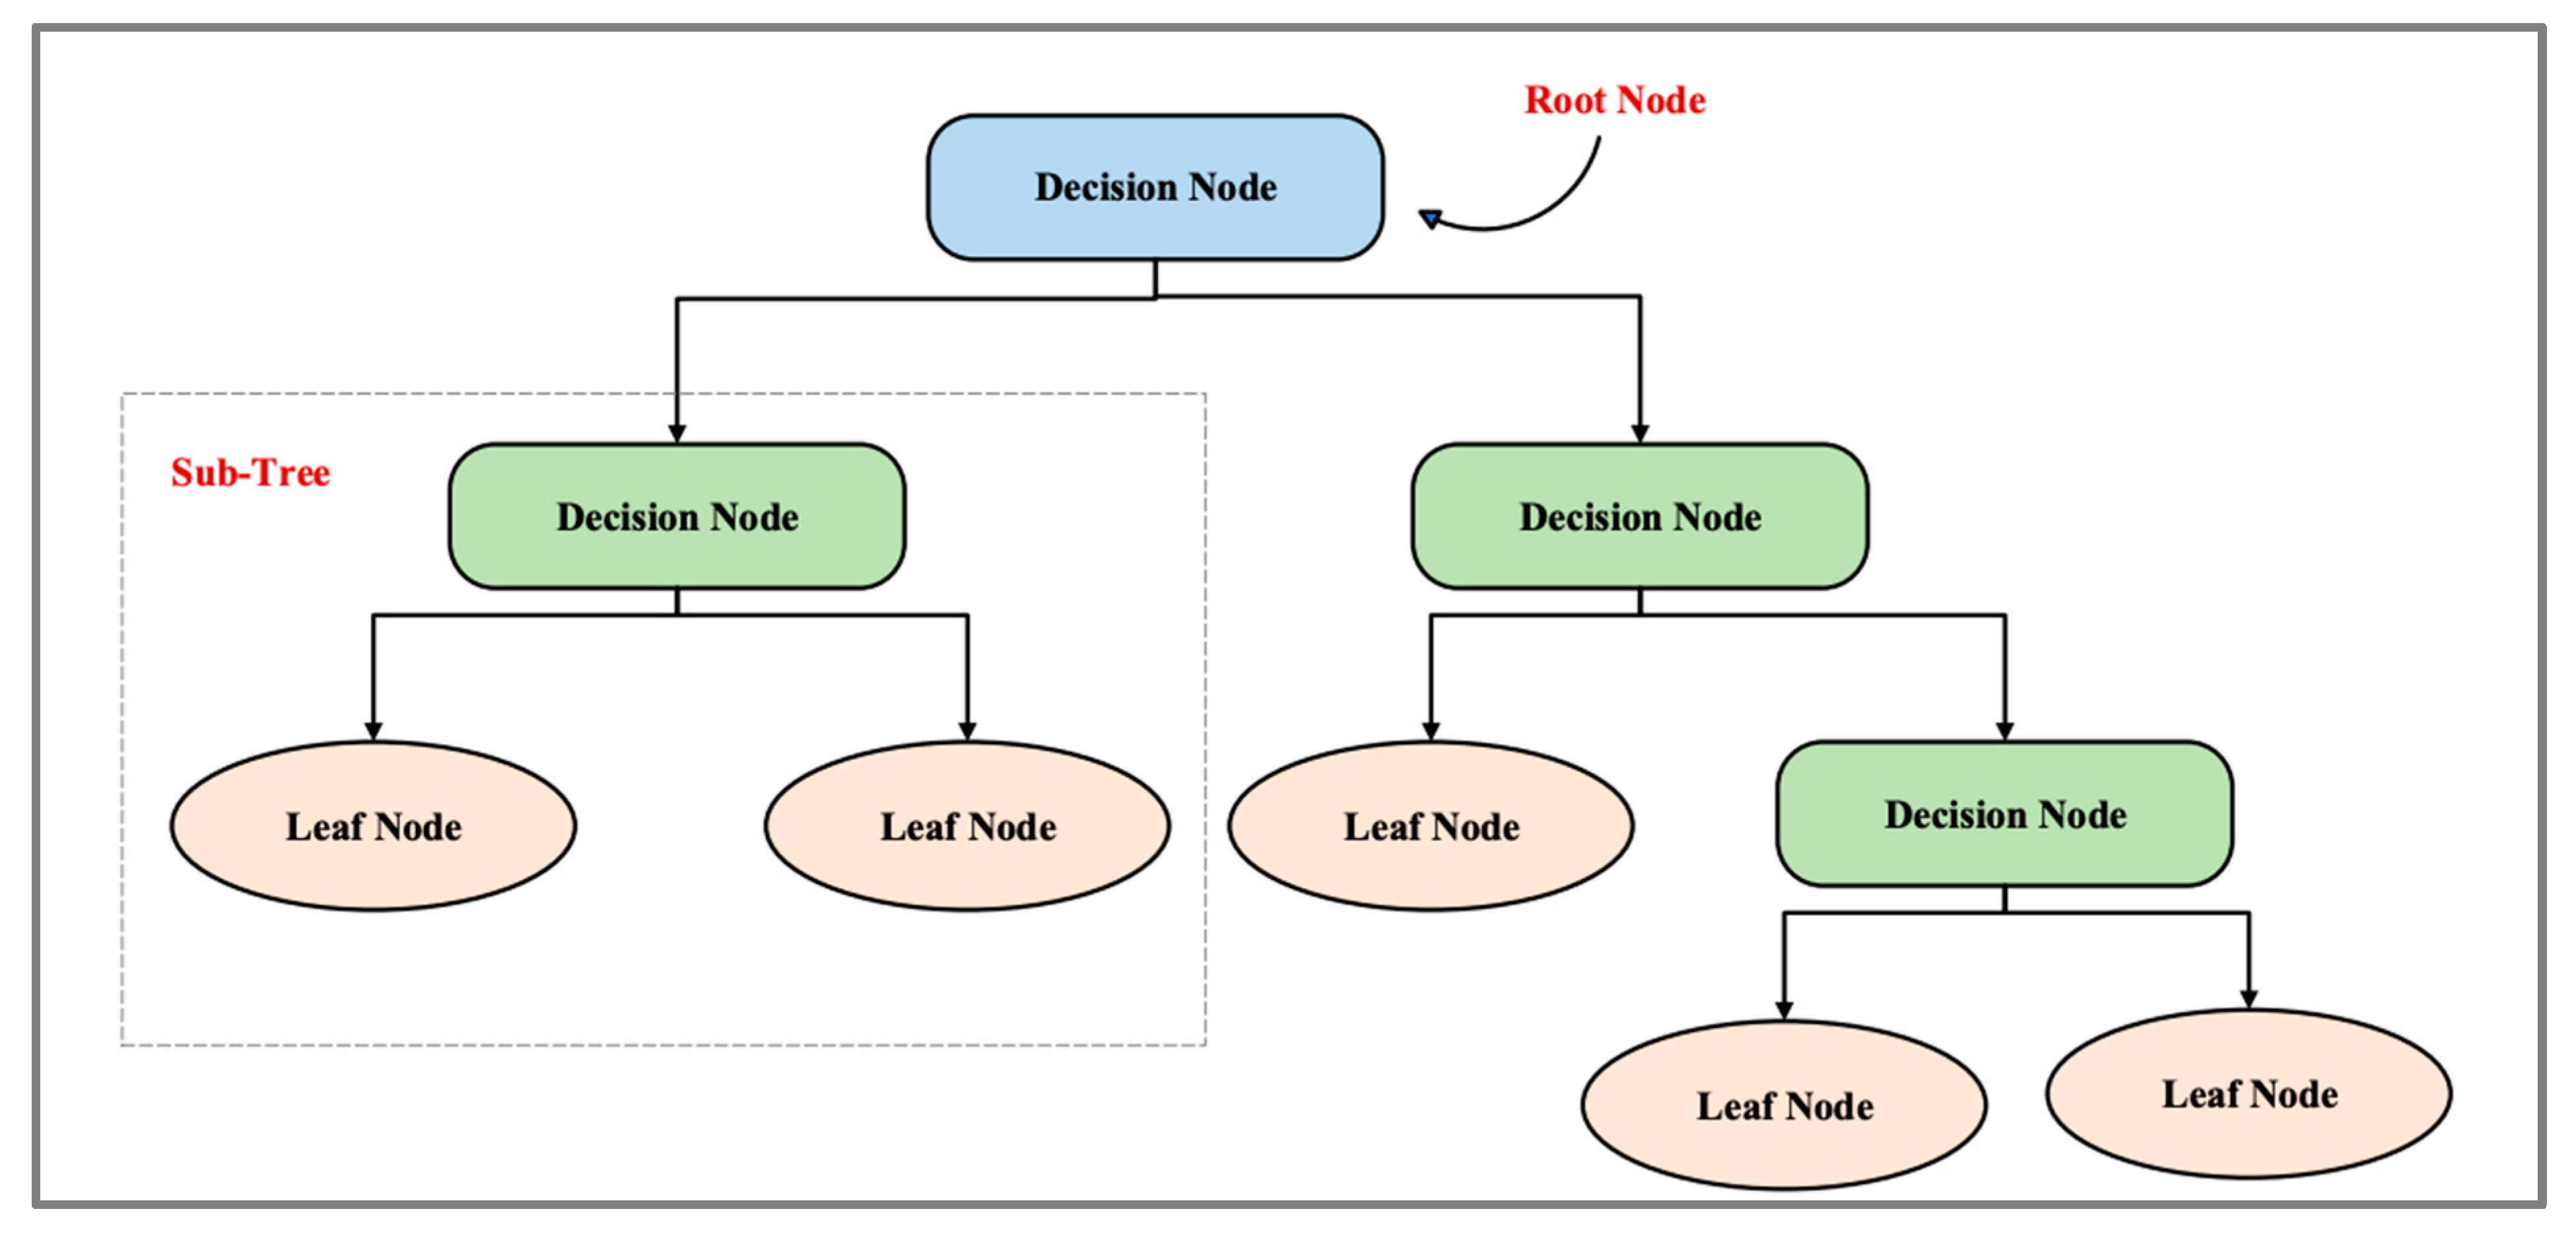
42]. DT has two nodes: the decision node and the leaf node. Leaf nodes are the outputs of decision nodes and do not contain any further branches, whereas decision nodes are used to make decisions and have multiple branches. Dataset features are used to make decisions or perform tests. This is a way of getting all the possible solutions based on given conditions for a problem or decision. DT is similar to trees in that it begins with a root node, which expands into branches and creates an overall tree-like structure. In a decision tree, a question is asked, and based on the answer (yes or no), a subtree is created.
Figure 4 explains the general structure of DT.
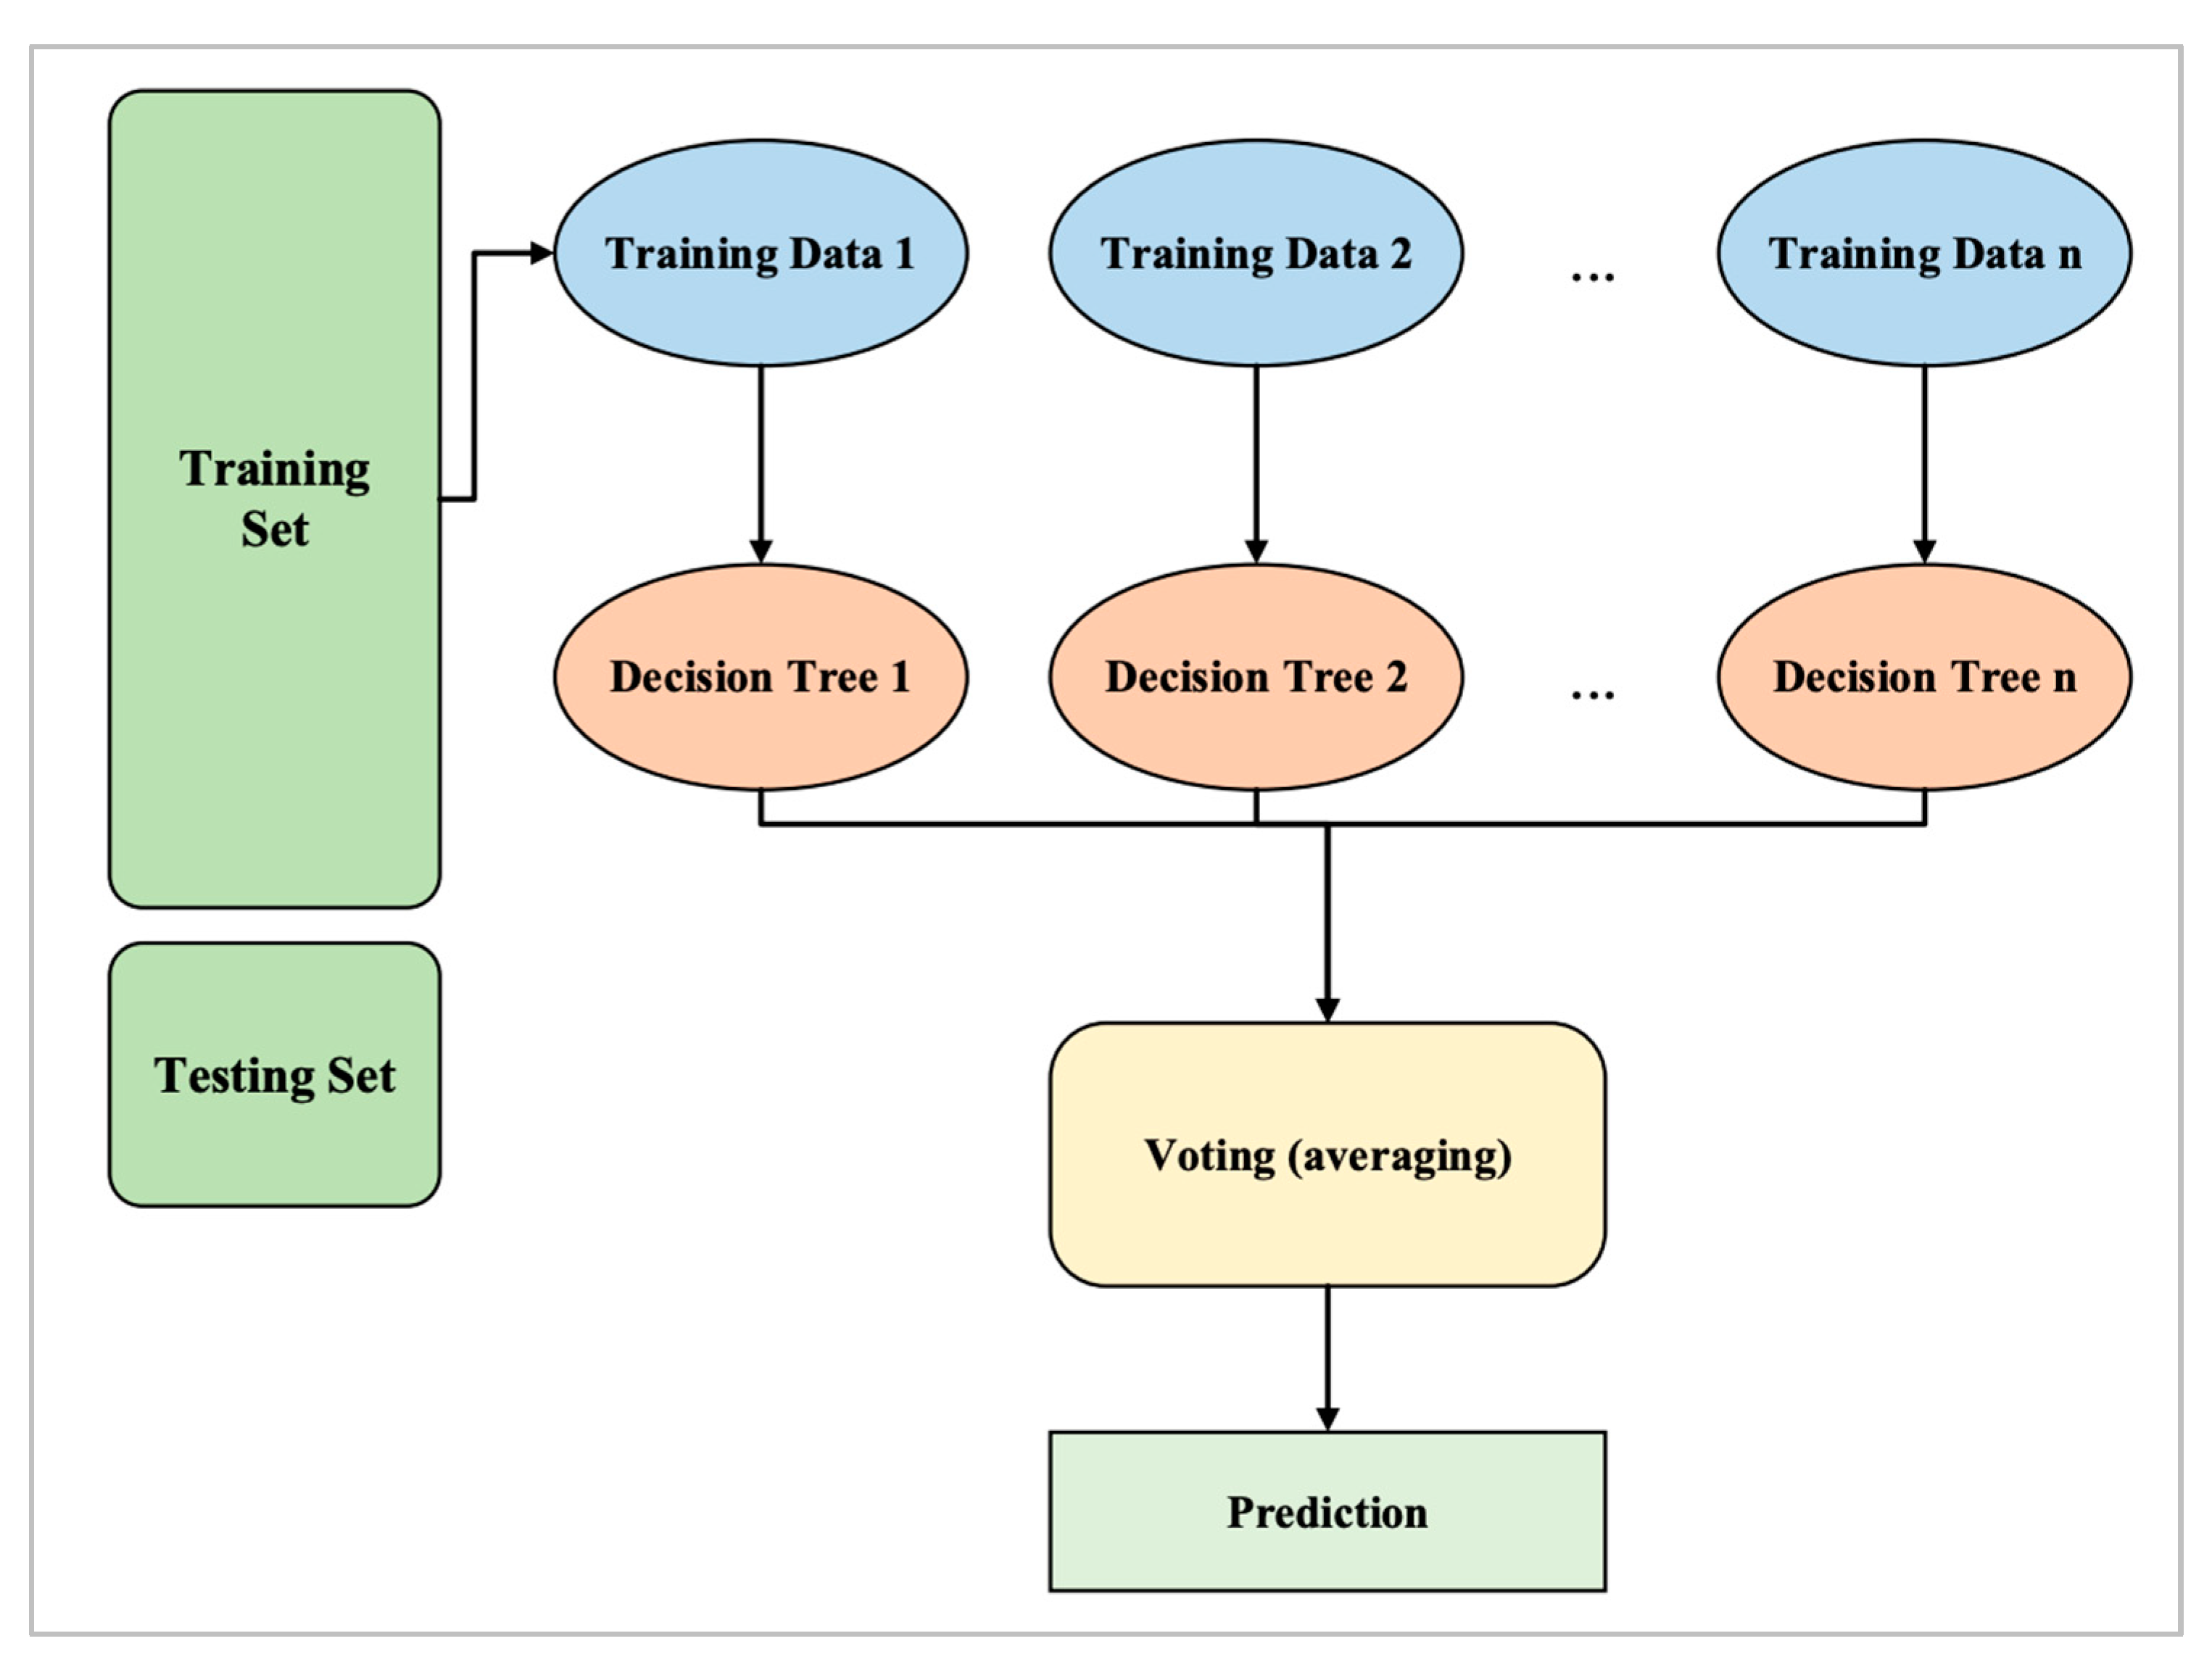
4.3.2. Random Forest
The second classifier algorithm that was selected is RF. Using the RF classifier, a subset of the training set is randomly selected to create a set of decision trees. This method basically involves building multiple DTs from a randomly selected subset of the training set and then combining the votes from each tree to make a final prediction [
43]. Taking data input, a classifier model assigns it to one of several categories. As an example, a classifier can be used to predict whether an image is that of a dog or cat, given a set of images containing images of dogs and cats. Basically, an RF algorithm creates multiple DTs, each based on a random subset of data. A DT is a type of algorithm that determines which category data inputs fall into based on the data inputs. By creating multiple decision trees and averaging their results, RFs go one step further. In this way, overfitting is reduced, which occurs when the algorithm only works well with the training data and not with the new data [
43].
It is possible to think of the RF as an ensemble of several DTs. A final outcome is created by aggregating the predictions of multiple decision trees (majority voting) and averaging them. As a result, the RF model generalizes better to a larger population. Furthermore, the model becomes less prone to overfitting or high variance [
44]. The RF algorithm steps are shown in
Figure 5.
4.3.3. Support Vector Machine
The third classifier was SVM. SVM is generally considered a classification approach, but it can also be used to solve regression problems. In addition to handling continuous variables, it can also handle categorical variables easily [
45]. To separate different classes, SVM constructs a hyperplane in multidimensional space. Iterative SVM generates optimal hyperplanes, which minimizes errors. SVM is based on finding a maximum marginal hyperplane (MMH) to divide the dataset into classes [
45].
The main objective is to separate the dataset as effectively as possible [
46]. The distance between two points is known as the margin in SVM. Using the dataset given, the objective is to find a hyperplane with the greatest margin between support vectors. SVM undertakes the next steps to determine the MMH:
4.3.4. k-Nearest Neighbors
The kNN algorithm is a supervised ML algorithm that learns from labeled input data and uses that knowledge to produce accurate outputs with unlabeled data. kNNs are used to predict test data sets based on the characteristics (labeled data) of training data. Predictions are made by calculating the distance between test data and training data, assuming that the data points have similar characteristics [
47]. The kNN algorithm is similar to a voting system, in which the majority class label determines the class label of a new data point among its nearest k (k is an integer) neighbors. Suppose you live in a small village with a few hundred residents, and you must decide which political party to support [
47]. For this, you might ask your nearest neighbors which political party they support. Generally, if most of your nearest neighbor’s support party A, you will vote for it as well [
47]. Similar to kNN, a new data point’s class label is determined by its k nearest neighbors by determining the majority class label.
4.4. Evaluation Metrics
Our proposed system was evaluated on accuracy, precision, recall, and F1 score. The evaluation metrics such as accuracy, precision, recall, and the F1 score are computed using these four parameters: true positive (TP), false negative (FN), false positive (FP), and true negative (TN).
4.4.1. Confusion Matrix
A confusion matrix is a table used to describe the performance of a classifier within the context of a set of observations known to have actual (monitored) values. A change in a box refers to a skill in a lesson, and a change in a column refers to a skill in the intended course (or vice versa). A confusion matrix consists of the following terms:
TP: Both the actual and predicted values are positive.
TN: Both the actual and predicted values are negative.
FP: The actual value is negative, but the model predicted it to be positive.
FN: The actual value is positive, but the model predicted it to be negative.
We calculated several measures from the confusion matrix to quantify and compare the quality of the models, including the following:
Accuracy
The accuracy indicates that the flow manifests are accurately categorized around the entire traffic trace. It is the proportion of correctly classified cases above all N cases. The accuracy formula is as follows:
Precision
Precision refers to how many intrusions an IDS predicts. A higher P indicates a lower alarm. The percentage of positive classifications made in the right direction. Following is the formula for calculating precision:
Recall
Recall measures how much of an intrusion was expected versus how many intrusions actually occurred, so a high R-value is needed. This is the percentage of positive examples that have been classified correctly. Following is the formula for calculating recall:
F1 Score
The F1 score provides an overall score by combining precision and recall. The model correctly identifies threats when the number of false alarms is minimal. The F1 score is good when there are false positives and false negatives. Below is the formula for the F1 score.


