Article

A Framework for Determining the Optimal Vibratory Frequency of Graded Gravel Fillers Using Hammering Modal Approach and ANN

1
China Academy of Railway Sciences Co., Ltd., Beijing 100081, China
2
Department of Civil Engineering, Shijiazhuang Tiedao University, Shijiazhuang 050043, China
3
Department of Civil Engineering, Central South University, Changsha 410075, China
*
Author to whom correspondence should be addressed.
Sensors 2024, 24(2), 689; https://doi.org/10.3390/s24020689
Submission received: 16 November 2023 / Revised: 10 January 2024 / Accepted: 19 January 2024 / Published: 22 January 2024

Abstract

:
To address the uncertainty of optimal vibratory frequency fov of high-speed railway graded gravel (HRGG) and achieve high-precision prediction of the fov, the following research was conducted. Firstly, commencing with vibratory compaction experiments and the hammering modal analysis method, the resonance frequency f0 of HRGG fillers, varying in compactness K, was initially determined. The correlation between f0 and fov was revealed through vibratory compaction experiments conducted at different vibratory frequencies. This correlation was established based on the compaction physical–mechanical properties of HRGG fillers, encompassing maximum dry density ρdmax, stiffness Krd, and bearing capacity coefficient K20. Secondly, the gray relational analysis algorithm was used to determine the key feature influencing the fov based on the quantified relationship between the filler feature and fov. Finally, the key features influencing the fov were used as input parameters to establish the artificial neural network prediction model (ANN-PM) for fov. The predictive performance of ANN-PM was evaluated from the ablation study, prediction accuracy, and prediction error. The results showed that the ρdmax, Krd, and K20 all obtained optimal states when fov was set as f0 for different gradation HRGG fillers. Furthermore, it was found that the key features influencing the fov were determined to be the maximum particle diameter dmax, gradation parameters b and m, flat and elongated particles in coarse aggregate Qe, and the Los Angeles abrasion of coarse aggregate LAA. Among them, the influence of dmax on the ANN-PM predictive performance was the most significant. On the training and testing sets, the goodness-of-fit R2 of ANN-PM all exceeded 0.95, and the prediction errors were small, which indicated that the accuracy of ANN-PM predictions was relatively high. In addition, it was clear that the ANN-PM exhibited excellent robust performance. The research results provide a novel method for determining the fov of subgrade fillers and provide theoretical guidance for the intelligent construction of high-speed railway subgrades.

1. Introduction

The compaction quality control of high-speed railway graded gravel (HRGG) was a crucial factor influencing the service performance of the subgrade [1,2,3]. Vibratory compaction was the mainstream method in subgrade construction, where the vibration frequency was closely related to compaction quality control. Unreasonable vibration frequencies could lead to poor control of subgrade compaction quality, which caused various types of subgrade diseases, such as uneven settlement [4,5] and permanent deformation [6,7]. Meanwhile, there has been limited research on the intelligent prediction of the optimal vibratory frequency fov for vibratory compaction, which has hindered the development of intelligent subgrade construction [8]. Hence, proposing a method for determining the subgrade compaction fov and achieving intelligent prediction of the compaction fov are of great guiding significance for improving the service performance of the subgrade and developing intelligent construction for high-speed railway subgrades.
Existing research highlights a robust correlation between vibration frequency and the dry density ρd of coarse-grained soil fillers. Through plate vibration compaction experiments, Wang et al. [9] and Ji et al. [10] identified an optimal vibration frequency range (25~27 Hz) under varying excitation forces, resulting in the attainment of maximum dry density during the compaction of coarse-grained soil fillers. Moreover, in vibration compaction experiments, Xie et al. [11] observed that employing the optimal frequency reduces HRGG filler crushing, contributing to its optimal mechanical performance. Furthermore, based on indoor experiments, Ye et al. [12] found that when the vibration frequency (25~30 Hz) approaches the resonance frequency of the fillers, the structure of coarse-grained soil fillers becomes more compact, resulting in the maximum dry density. It was observed that there existed an optimal vibration frequency fov within coarse-grained fillers during vibratory compaction, which resulted in the optimal compaction state of the fillers. Additionally, the study indicates a close relationship between the resonance frequency f0 of the fillers and the optimal vibration frequency [13,14]. Furthermore, to improve the efficiency of vibratory compaction for coarse-grained fillers, many scholars conducted research on determining the fov for coarse-grained fillers. Xie et al. [15] concluded that the f0 of coarse-grained soil fillers increased with compaction density. Additionally, it was observed that the compaction performance of the fillers was optimal when the vibration frequency matched the f0. Hence, it was urgent to investigate the relationship between f0 and compacted fov, and propose a new method to determine the fov.
With the development of intelligent compaction technology, the high-precision prediction of vibratory compaction parameters became a crucial part of intelligent subgrade construction [16,17]. Recently, many scholars have established the relationship between compaction parameters and filler features using linear regression models [18]. Nevertheless, there was a clear non-linear relationship between fov and filler characteristics, and the accuracy of this model was still open to question. In previous studies, machine learning (ML), recognized for its non-linear mapping capability, has proven to be an effective approach for predicting parameters in vibratory compaction. For example, Isik [19] applied the artificial neural network (ANN) algorithm to forecast compaction parameters in fine-grained soil and substantiated the suitability of the ANN algorithm by utilizing accuracy and error metrics such as goodness-of-fit (R2) and mean square error (MSE). Zaman et al. [20] established an ANN model to quantify the relationship between the elastic modulus and stress state of roadbed-graded aggregates. Additionally, Xie et al. [21] found that the ANN model had a better predictive capability for the optimal moisture content of HRGG fillers during vibratory compaction. All the above studies employed the ANN model to predict vibratory compaction parameters, and the prediction results were favorable, which indicated that the ANN model exhibited a strong predictive capability for vibratory compaction parameters. Additionally, considering the multitude of factors influencing fov, taking the key feature influencing the fov as input features for the prediction model could reduce the sample space dimension, enhance the predictive performance of the model, and further improve prediction accuracy [22,23]. Nevertheless, there was a lack of systematic characterization of the performance of coarse-grained fillers, especially the relationship between gradation, particle shape, particle crushing, and fov. Hence, it was necessary to determine the key feature influencing the fov.
In summary, to address the issue of uncertainty in the vibration compaction fov of HRGG fillers and achieve intelligent prediction of fov, this paper conducts the following research. Firstly, based on vibratory compaction experiments and the hammering modal analysis method, the f0 of different compaction degrees K of fillers was determined. Furthermore, the correlation between f0 and fov was revealed based on compaction experiments at different vibratory frequencies and based on the maximum dry density ρdmax, dynamic stiffness Krd, and bearing capacity coefficient K20 of the fillers. Secondly, the gray relational analysis algorithm was used to determine the key feature influencing the fov based on the quantified relationship between the filler feature and fov. Finally, the key features influencing the fov were used as input parameters to establish the artificial neural network prediction model (ANN-PM) for fov, and the predictive performance of ANN-PM was evaluated from the prediction accuracy and error. This research not only determined the fov of HRGG fillers through the hammering modal analysis method, but also achieved intelligent prediction of fov based on the ANN model. This provides a theoretical foundation for intelligent construction in high-speed railway subgrades.

2. The Method of Determining fov
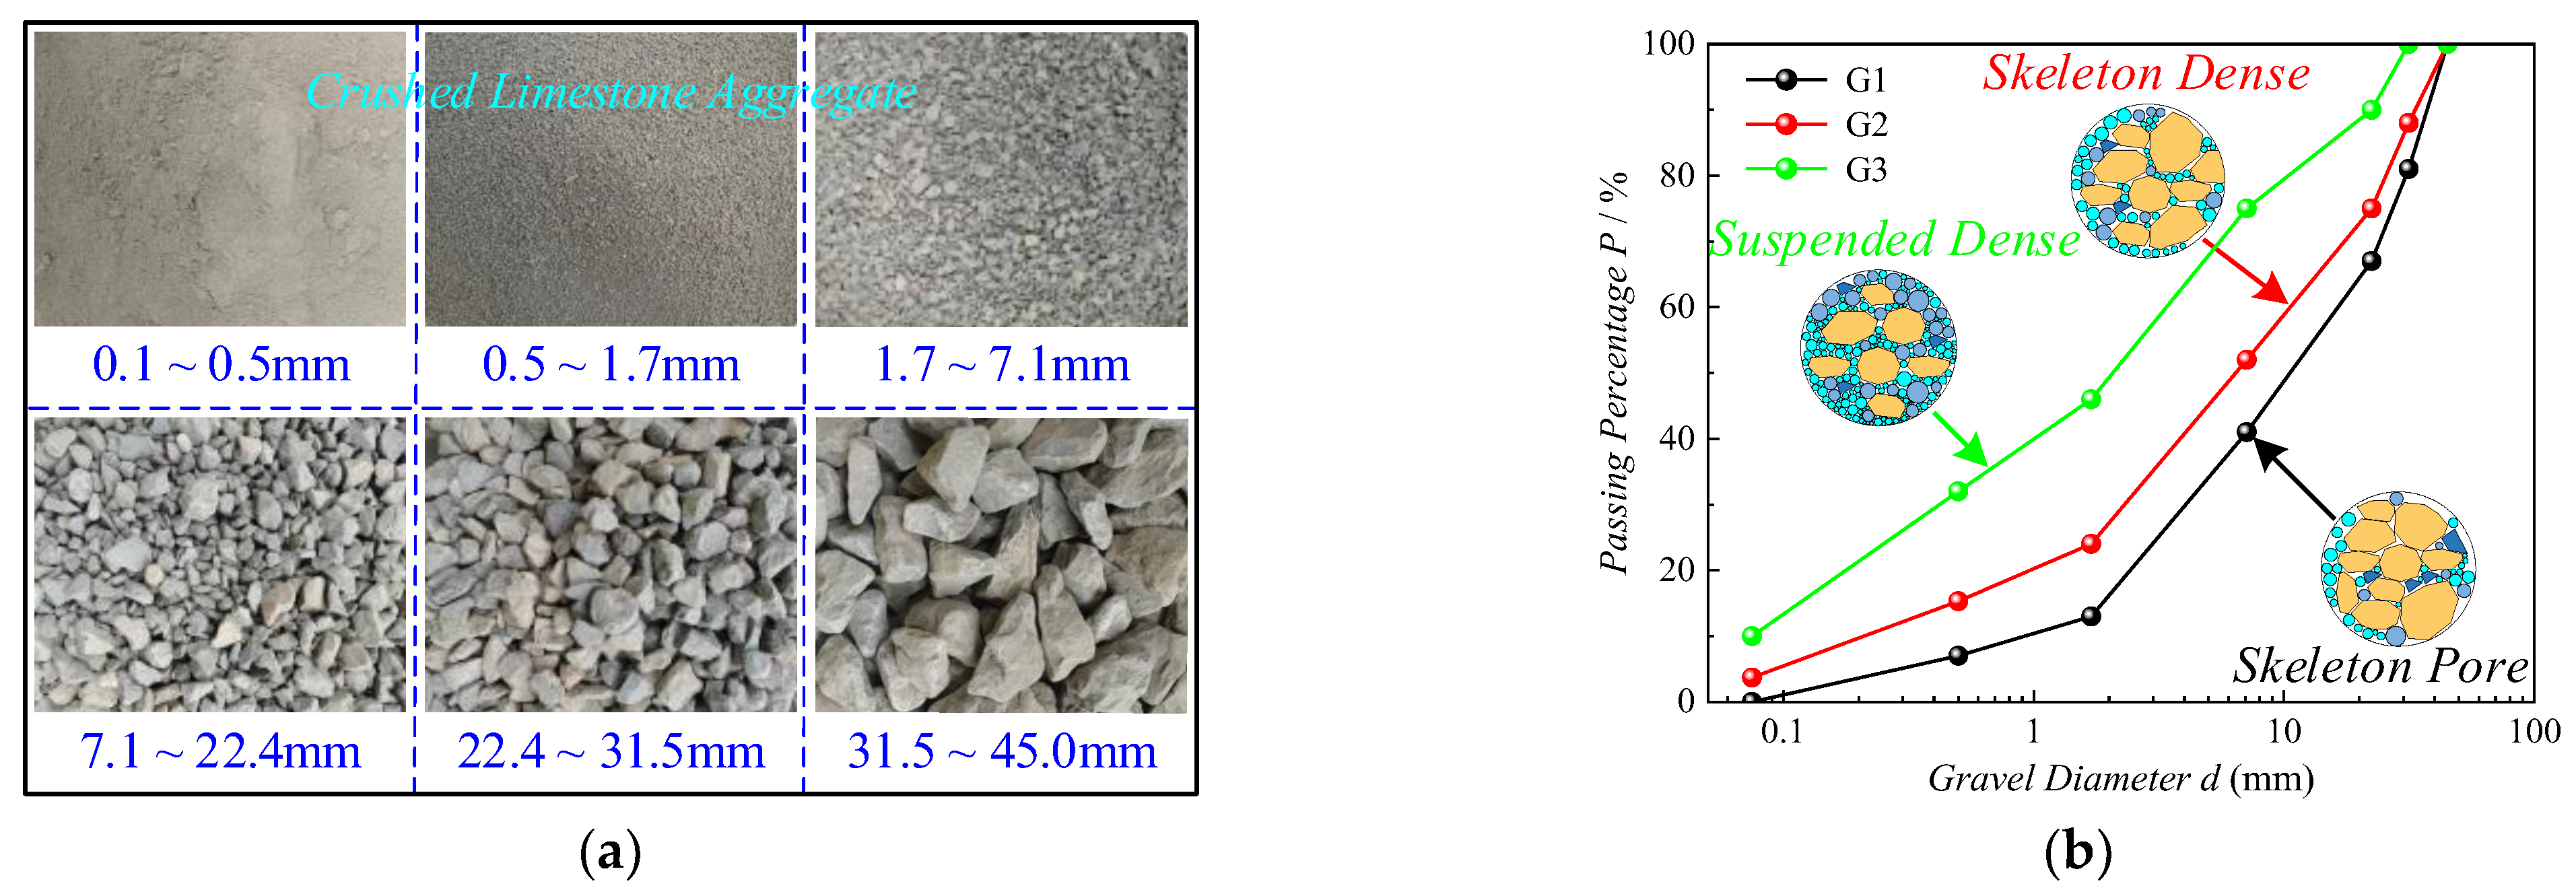
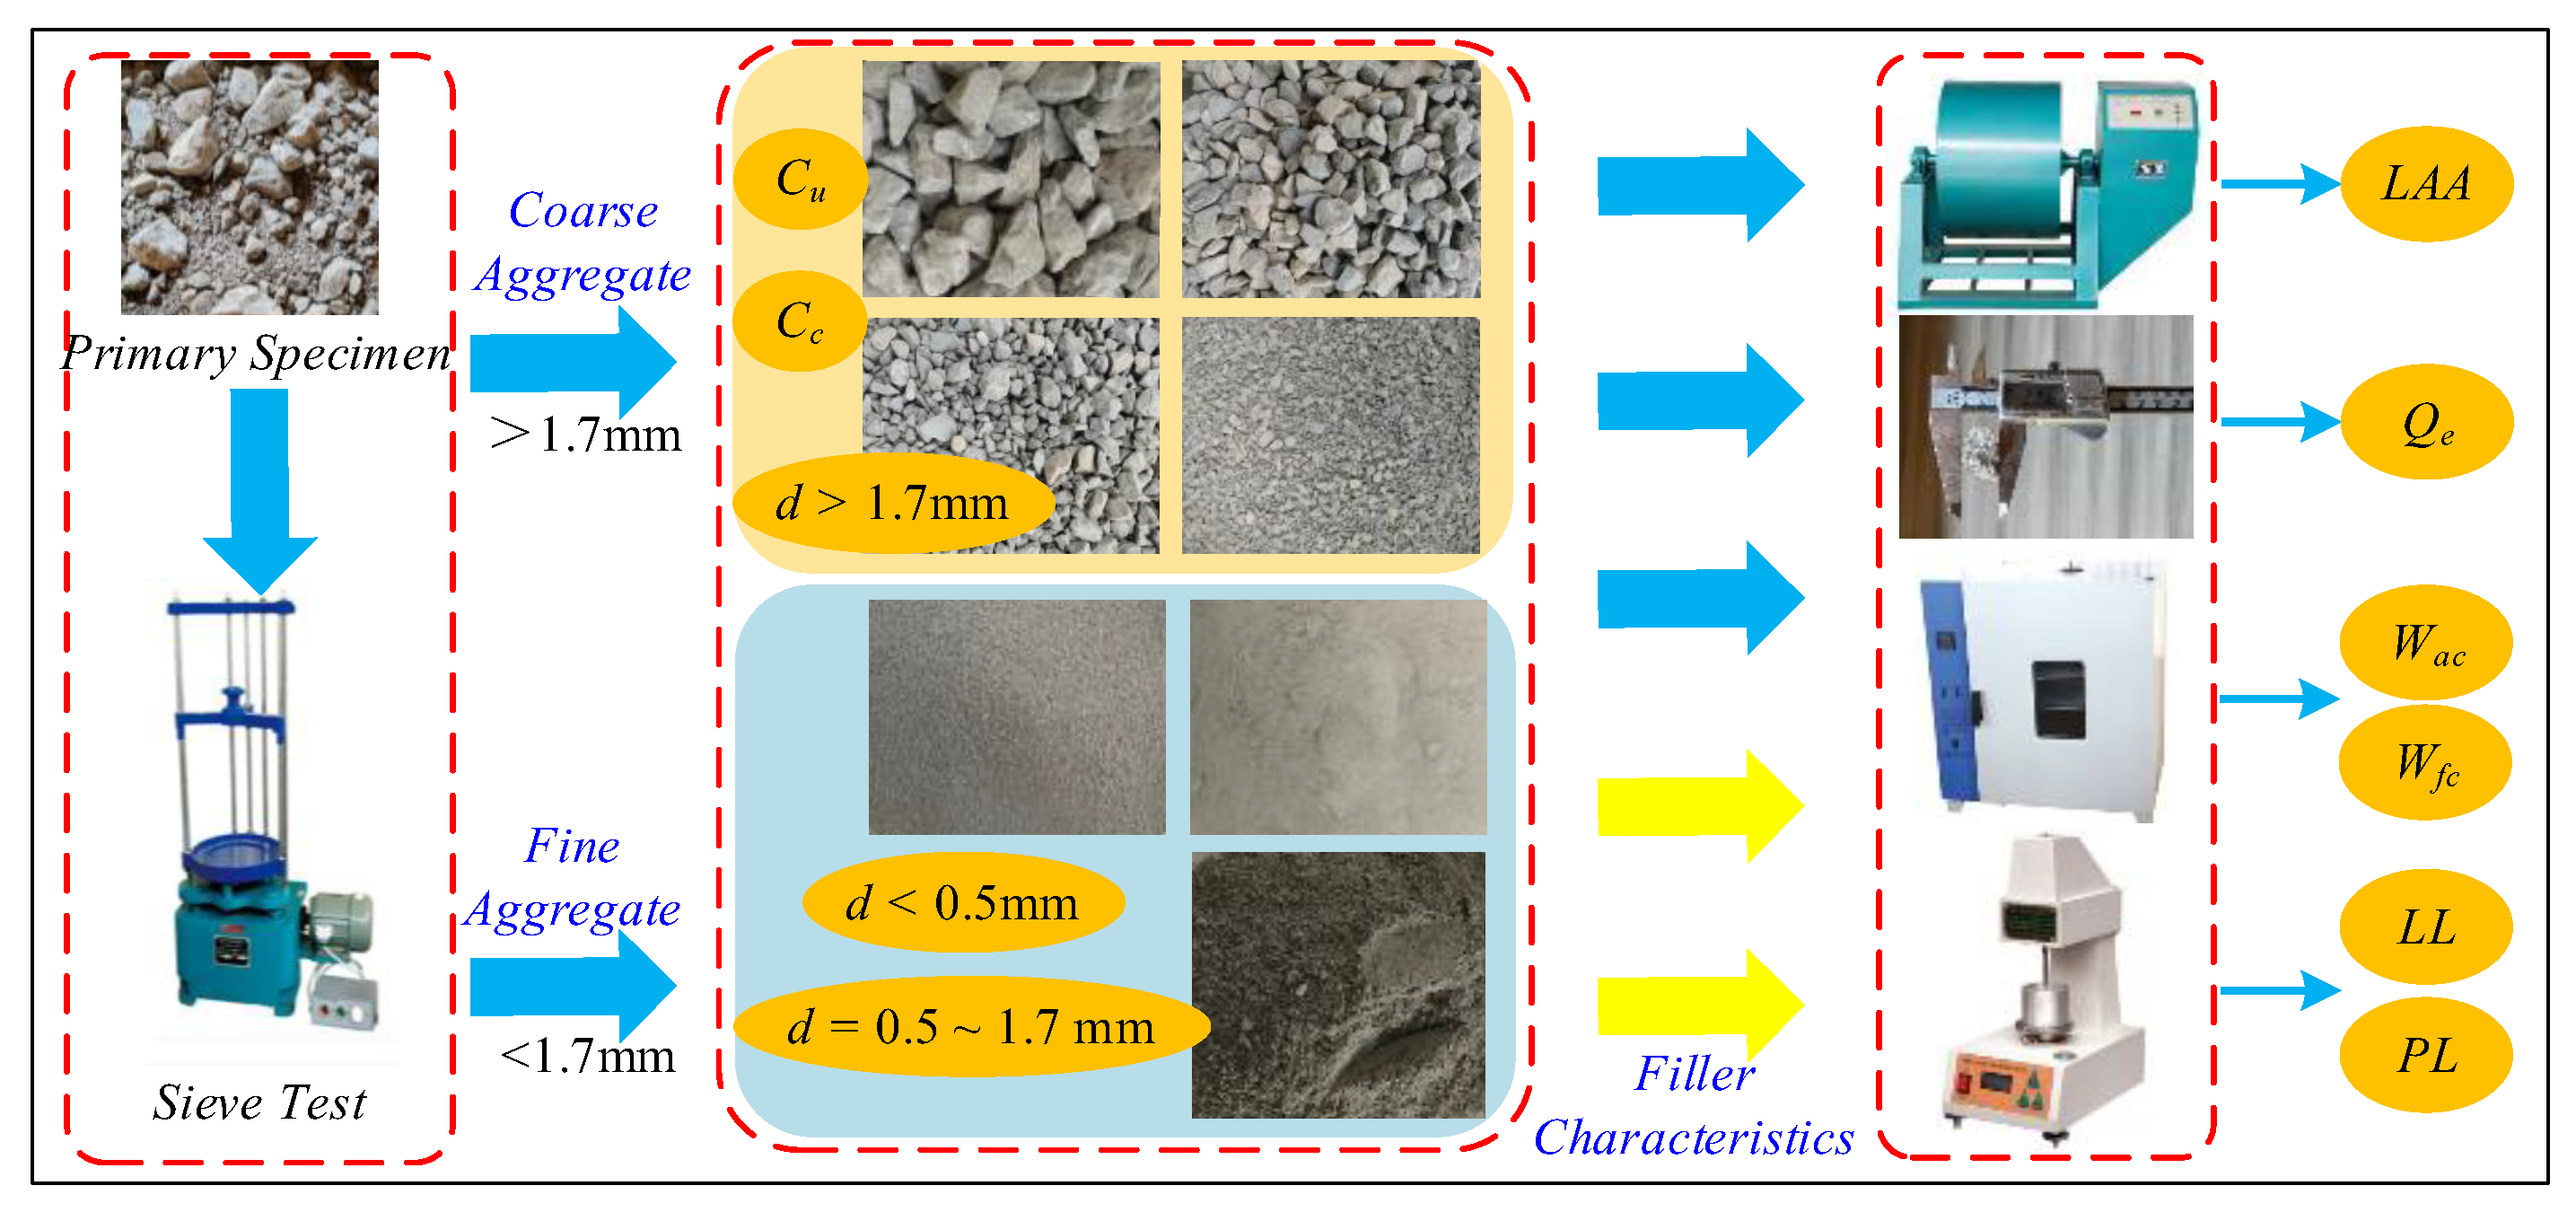
2.1. Material

As shown in Figure 1a, the HRGG fillers used in this experiment were surface subgrade fillers of the high-speed railway, which consisted of crushed limestone gravel. Based on the Code for Railway Subgrade Design (TB 10001-2016) [24], the gradation of fillers should meet the following requirements: the maximum particle diameter dmax ≤ 60 mm, the coefficient of uniformity Cu ≥ 15, and the coefficient of curvature Cc = 1~3. Hence, as shown in Figure 1b, three types of gradation were selected as experimental fillers: skeleton pore gradation G1 (dmax = 45 mm, Cu = 18.2, Cc = 1.374), skeleton dense gradation G2 (dmax = 45 mm, Cu = 40.0, Cc = 2.243), and suspended dense gradation G3 (dmax = 40.5 mm, Cu = 53.333, Cc = 1.2).

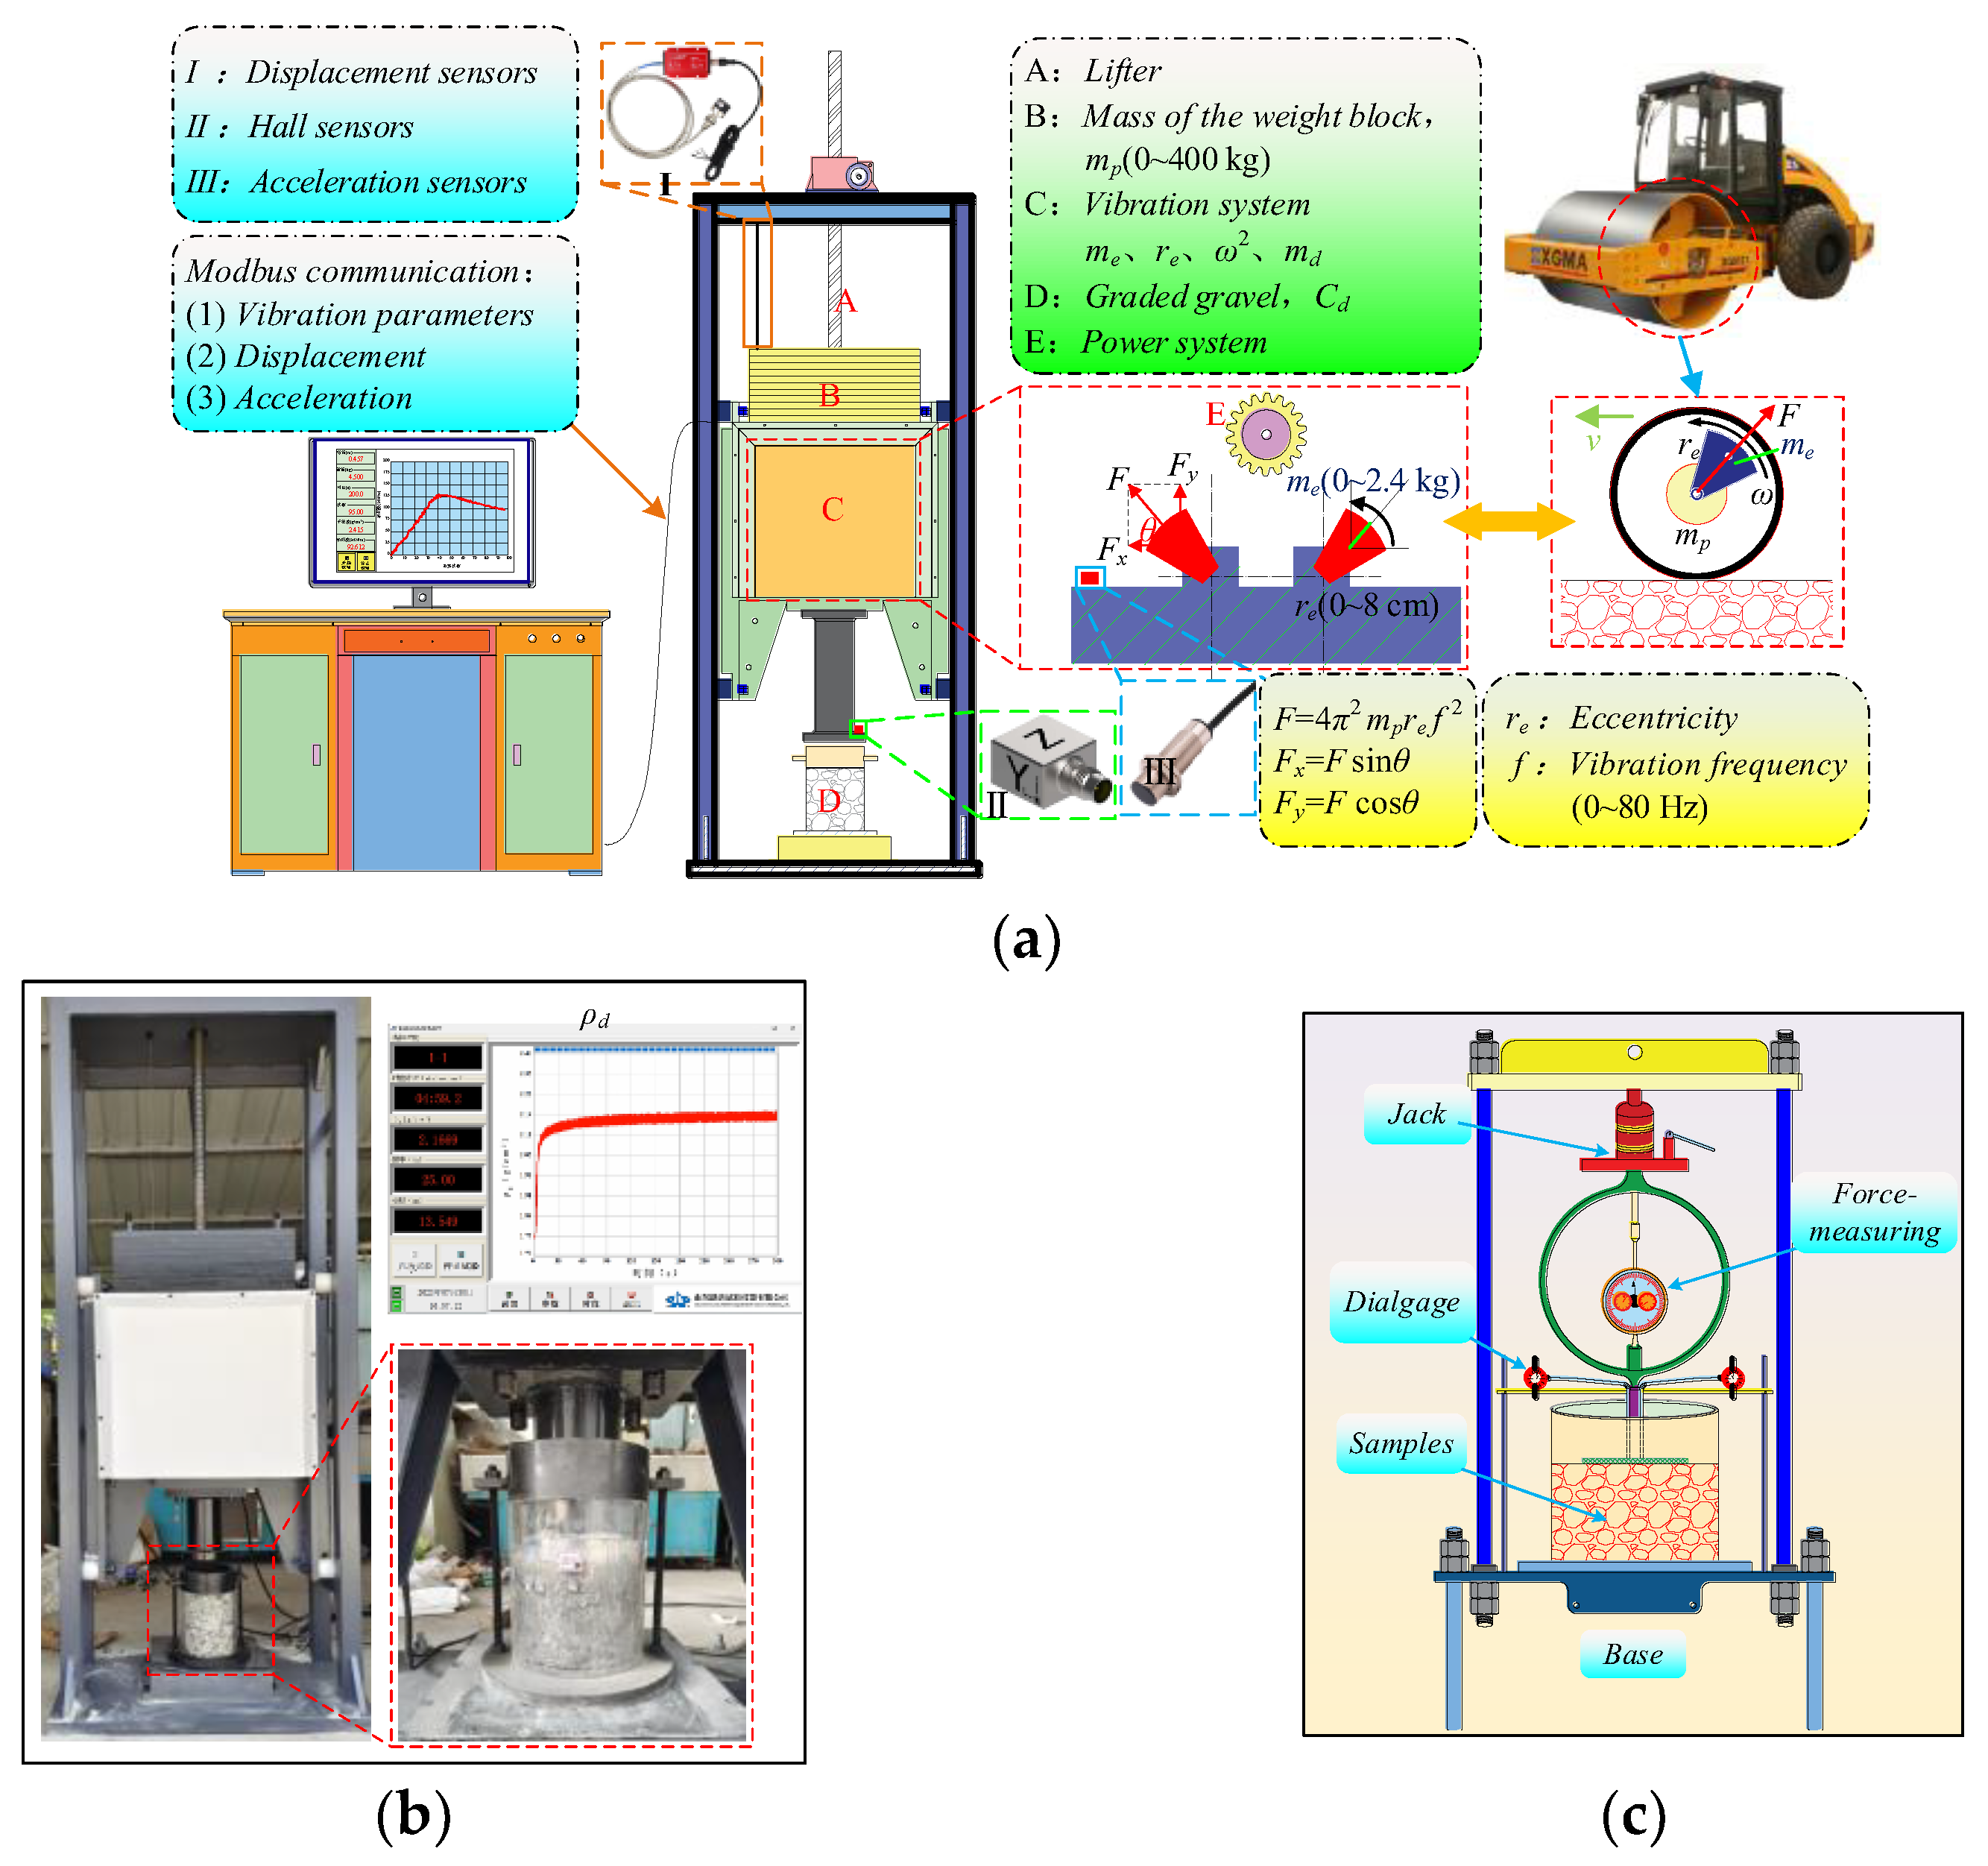
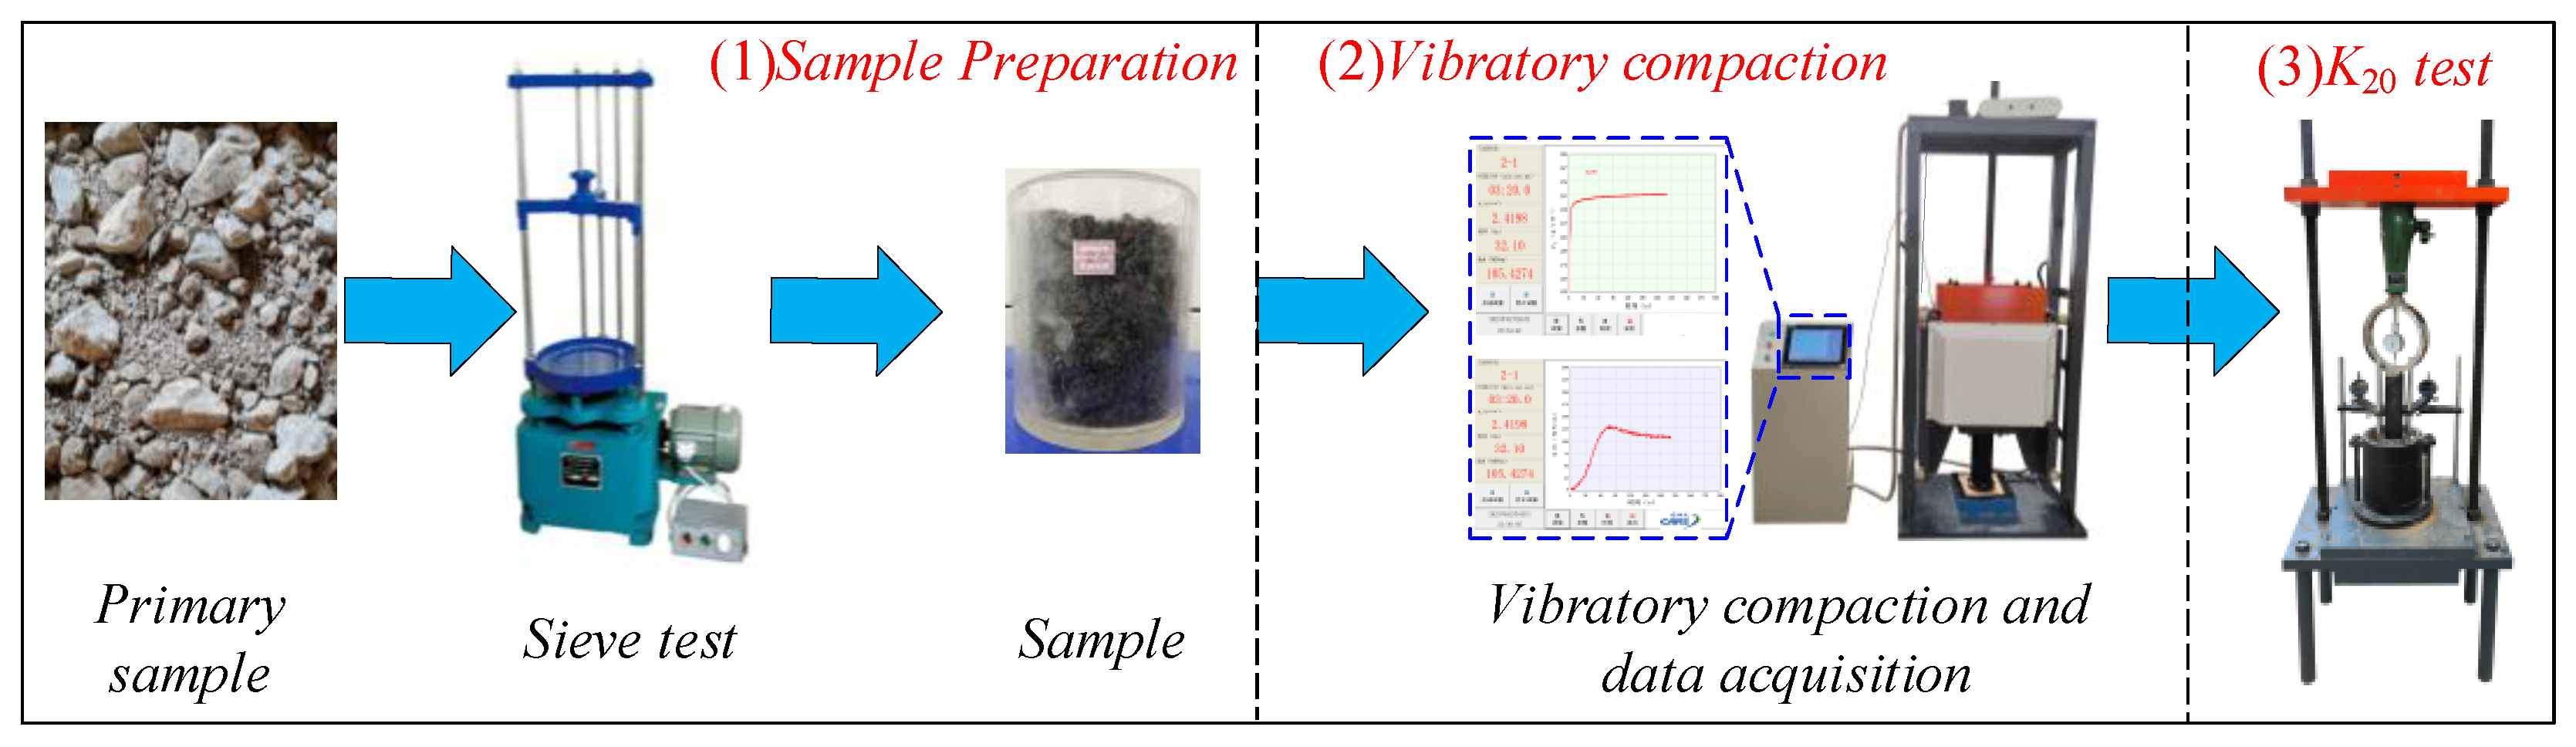
2.2. Experimental Design

Vibratory compaction experiments were conducted using an improved large-scale intelligent vibratory compactor [15]. The equipment was not only equipped with four adjustable parameters, containing the vibratory frequency f (0~80 Hz), static load mp (0~400 kg), eccentricity distance re (0~8 cm), and eccentric mass me (0~2.4 kg), but also its compaction mechanism was similar to the on-site roller compaction. As shown in Figure 2a, it was important to note that compared with the conventional vibratory compactor, this equipment embedded displacement sensors, hall sensors, and vibratory acceleration sensors. Furthermore, based on Equations (1) and (2), the real-time output of the dry density ρd curve and dynamic stiffness Krd curve can be obtained.
ρ d = m g π D c 2 ( h 0 S n )
K r d = m e r e ω 2 sin ( Δ φ ) + m p g m d x ¨ | x ˙ = 0 x | x ˙ = 0
where m is the mass of fillers; Dc is the internal diameter of the compaction cylinder; h0 is the pavement thickness; Sn is the displacement rate of fillers; me is the mass of the eccentric block; re is the eccentricity; ω is the rotation speed of the eccentric block; ∆φ is the lag phase angle, which is obtained from the hall sensor; mp is the mass of the weight block; md is the mass of the vibratory system; x is the displacement of the vibratory system, which is obtained from the displacement sensors; is the acceleration of the vibratory system, which is obtained from the acceleration sensors.
Applying the method proposed by Xie et al. [25] to determine the maximum dry density ρdmax, the compaction degree K of HRGG fillers can be calculated in real time by Equation (3). Hence, as shown in Figure 2b, the fillers with different K can be accurately obtained by controlling the vibratory compaction time. Additionally, as shown in Figure 2c, to validate the efficacy of the Krd obtained from the intelligent vibratory compactor, the bearing capacity coefficient K30 was used to evaluate the mechanical properties of the fillers. To ensure consistency between the indoor K30 and field experiments, it is necessary to scale down the K30 of the field using the theory of similarity. The K30 in this experiment was computed by Equation (4), which was derived based on the similarity coefficient for K30 proposed by Xie et al. [11].
K = ρ d ρ d max
K 30 = K 20 = σ 0.84 S 0.84
where S0.84 is a sinkage of 0.84 mm and σ0.84 is the load strength corresponding to a sinkage of 0.84 mm.
To improve the compaction quality and control the particle crushing, the parameters for the vibratory compaction experiments were selected using the optimal parameter determination method based on the resonance frequency f0 proposed by Xie et al. [25]. The vibratory frequency f was set to the f0 of the fillers, the excitation force F0/mp < 1.9, the moisture content ω was set to the critical moisture content of the fillers, the diameter-to-diameter ratio (Dc/dmax) was set to 3.9, and the thickness-to-diameter ratio (h0/dmax) was set to 3.5. Hence, in this paper, the parameters for the vibratory compaction experiments were shown in Table 1.
As shown in Figure 3, the vibratory compaction experiments were primarily divided into three steps. (1) Sample preparation: the initial fillers were classified based on particle size through sieving tests, and the samples were prepared according to the experimental gradation. (2) Vibratory compaction: experiments were conducted using the intelligent vibratory compactor, and the ρd and Krd of the HRGG fillers were collected in real time. (3) K20 testing: the K20 of the HRGG fillers after vibratory compaction was tested based on a plate load test.

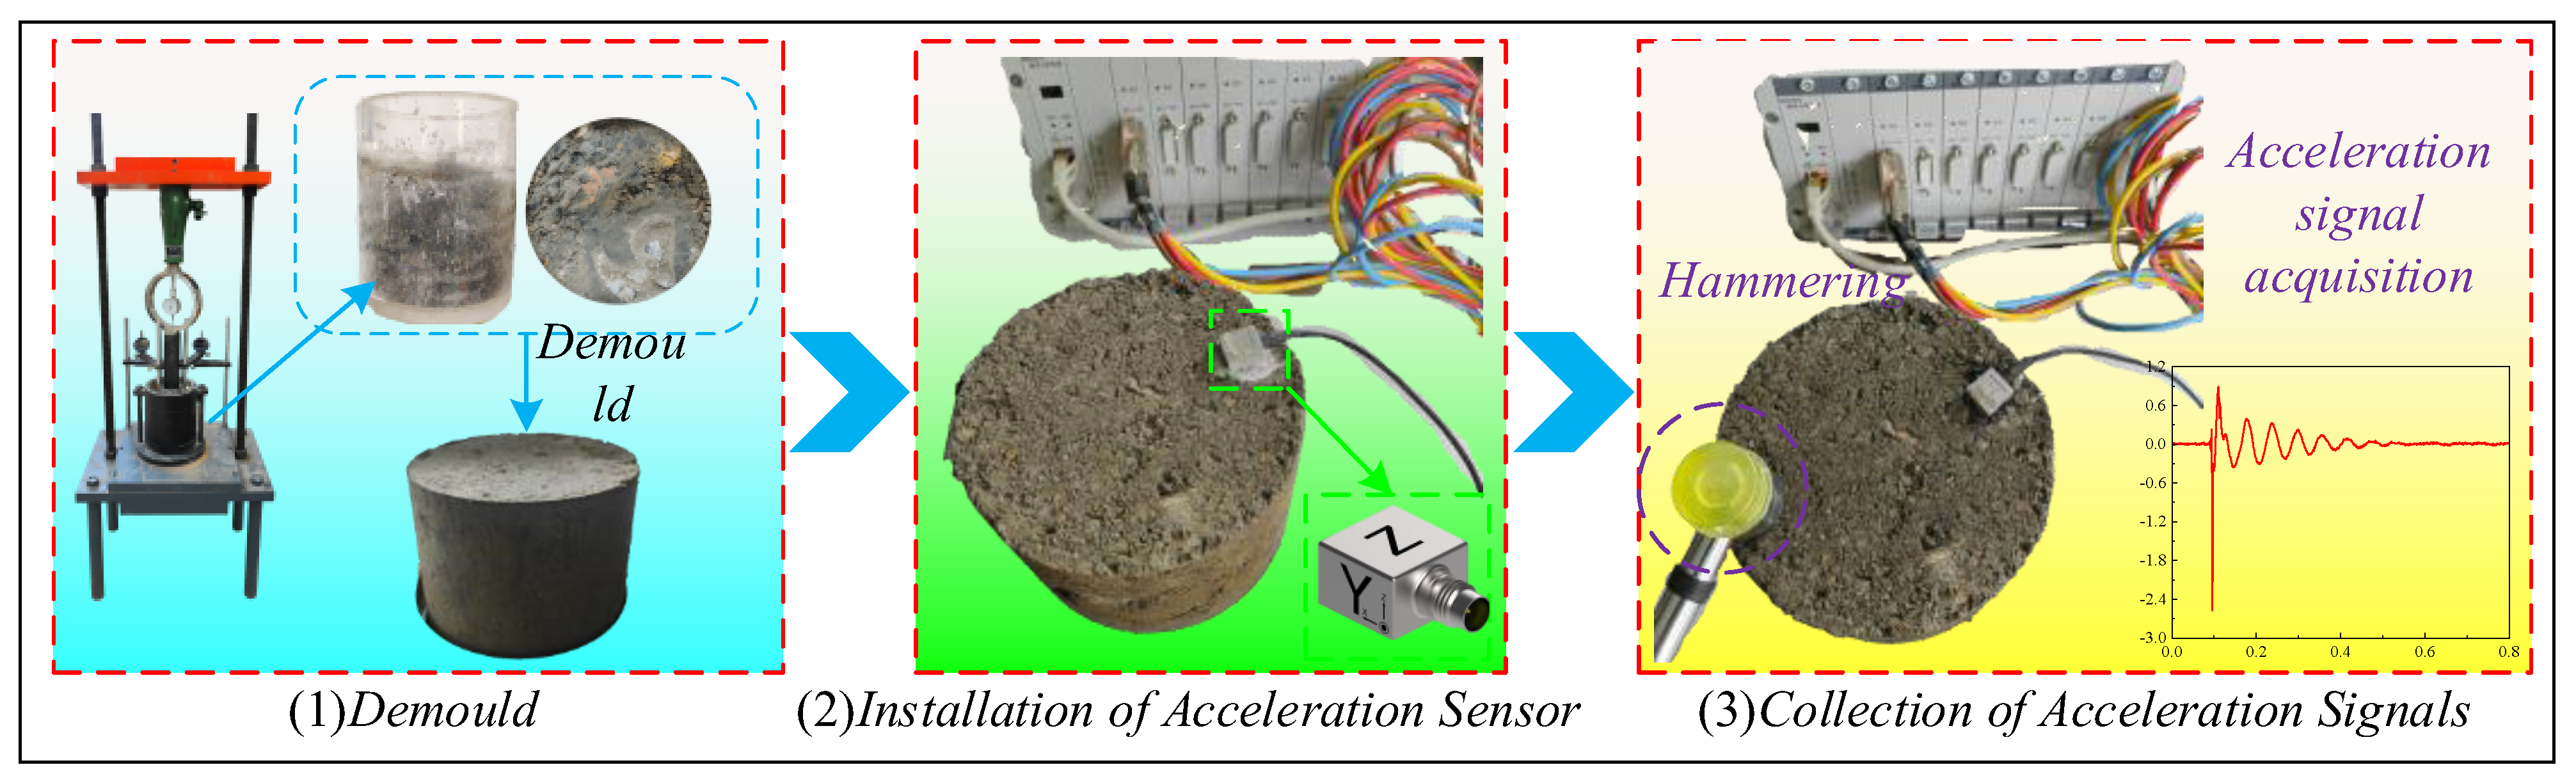
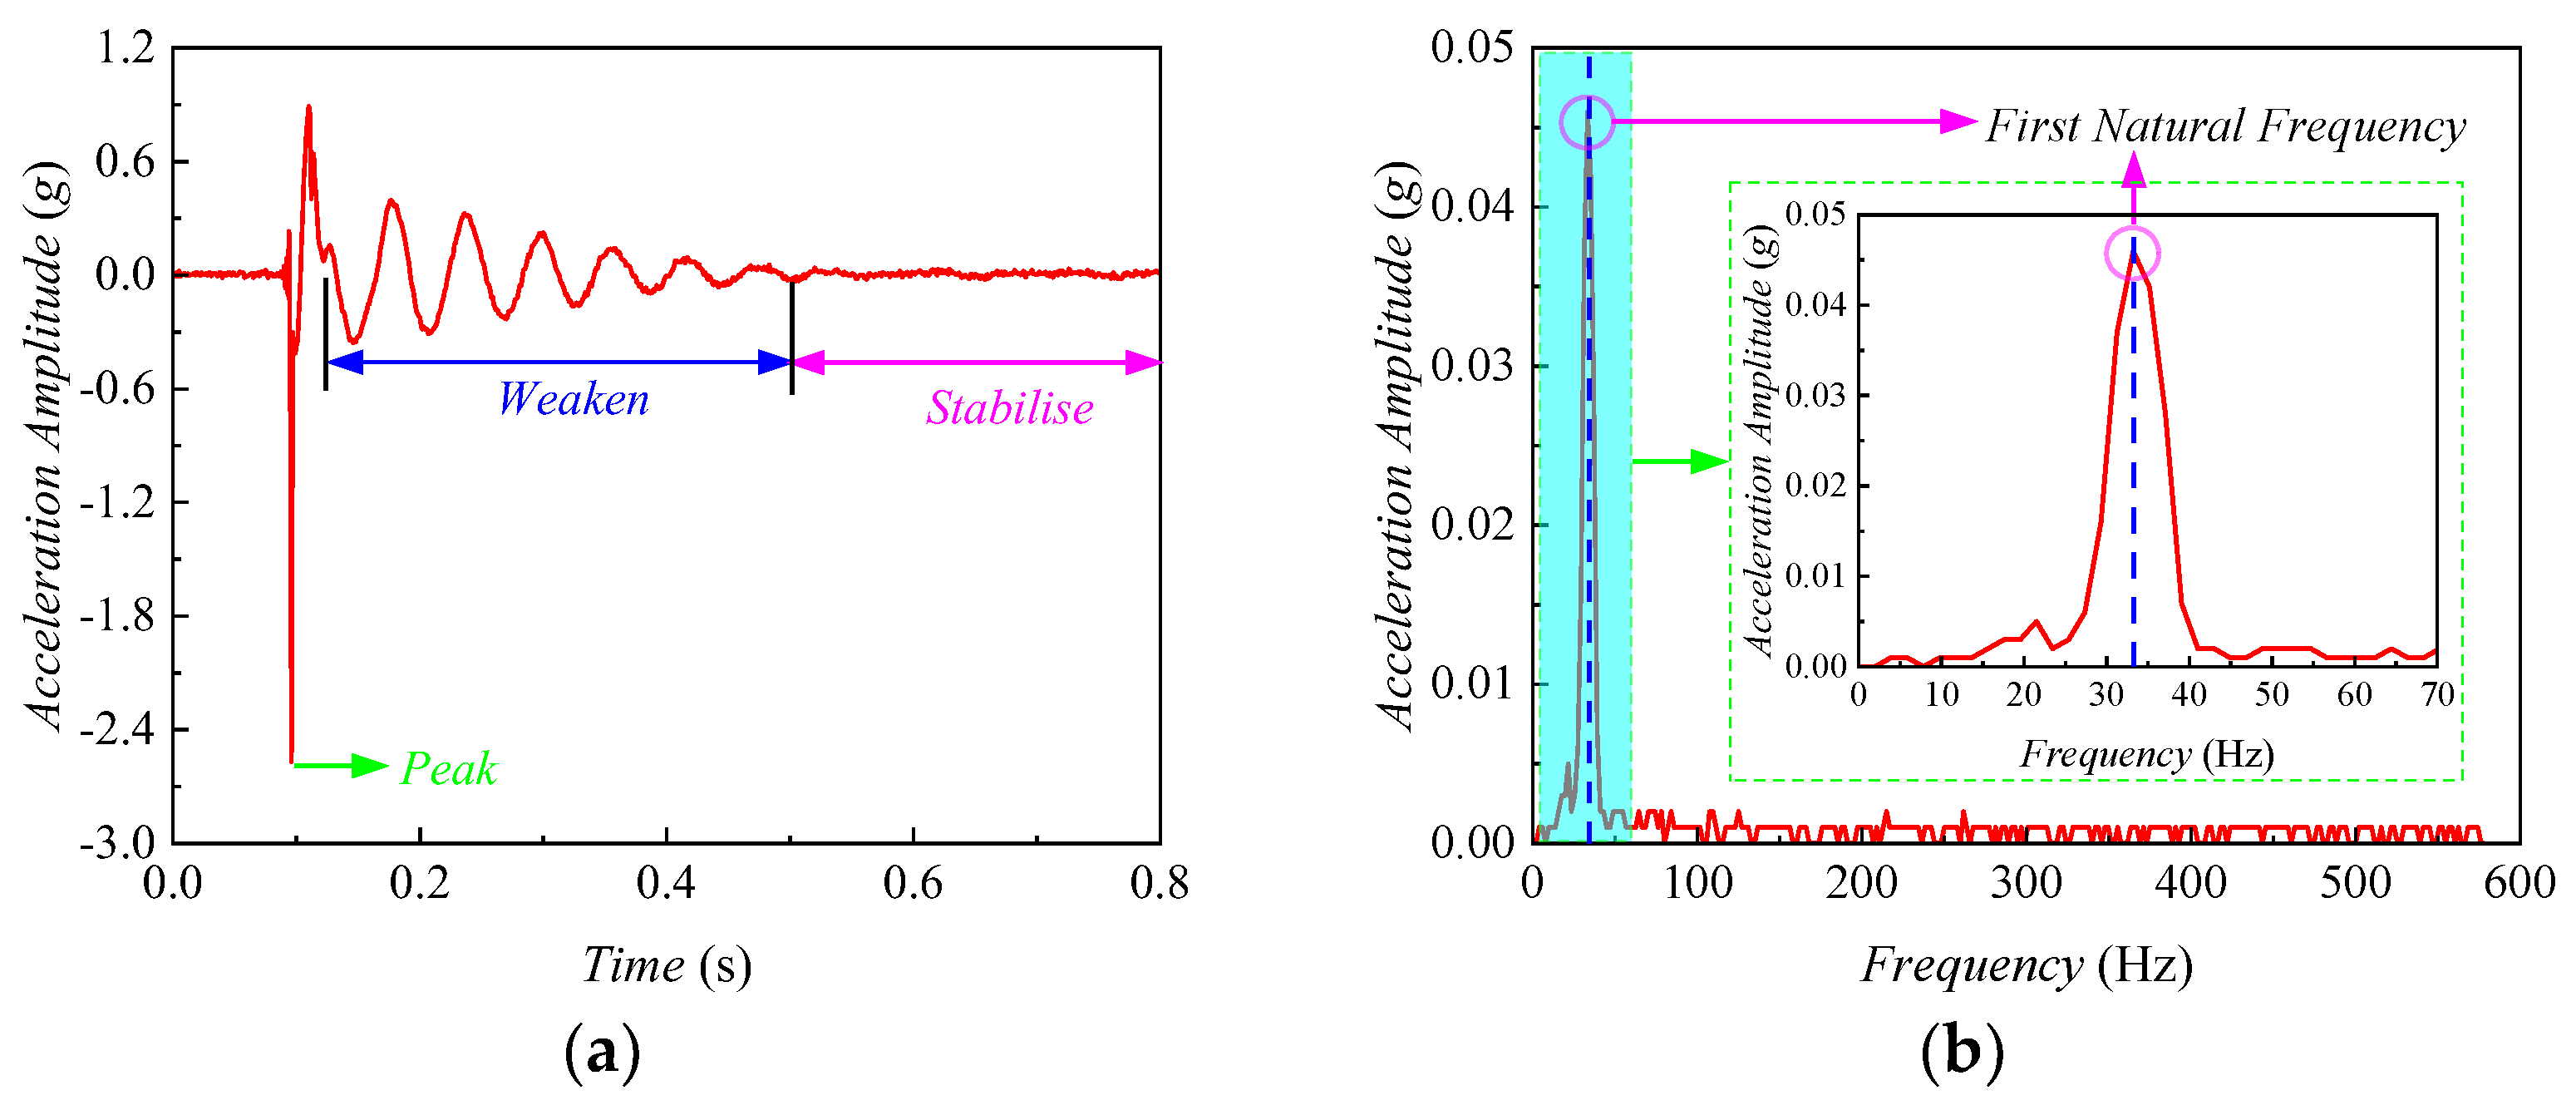
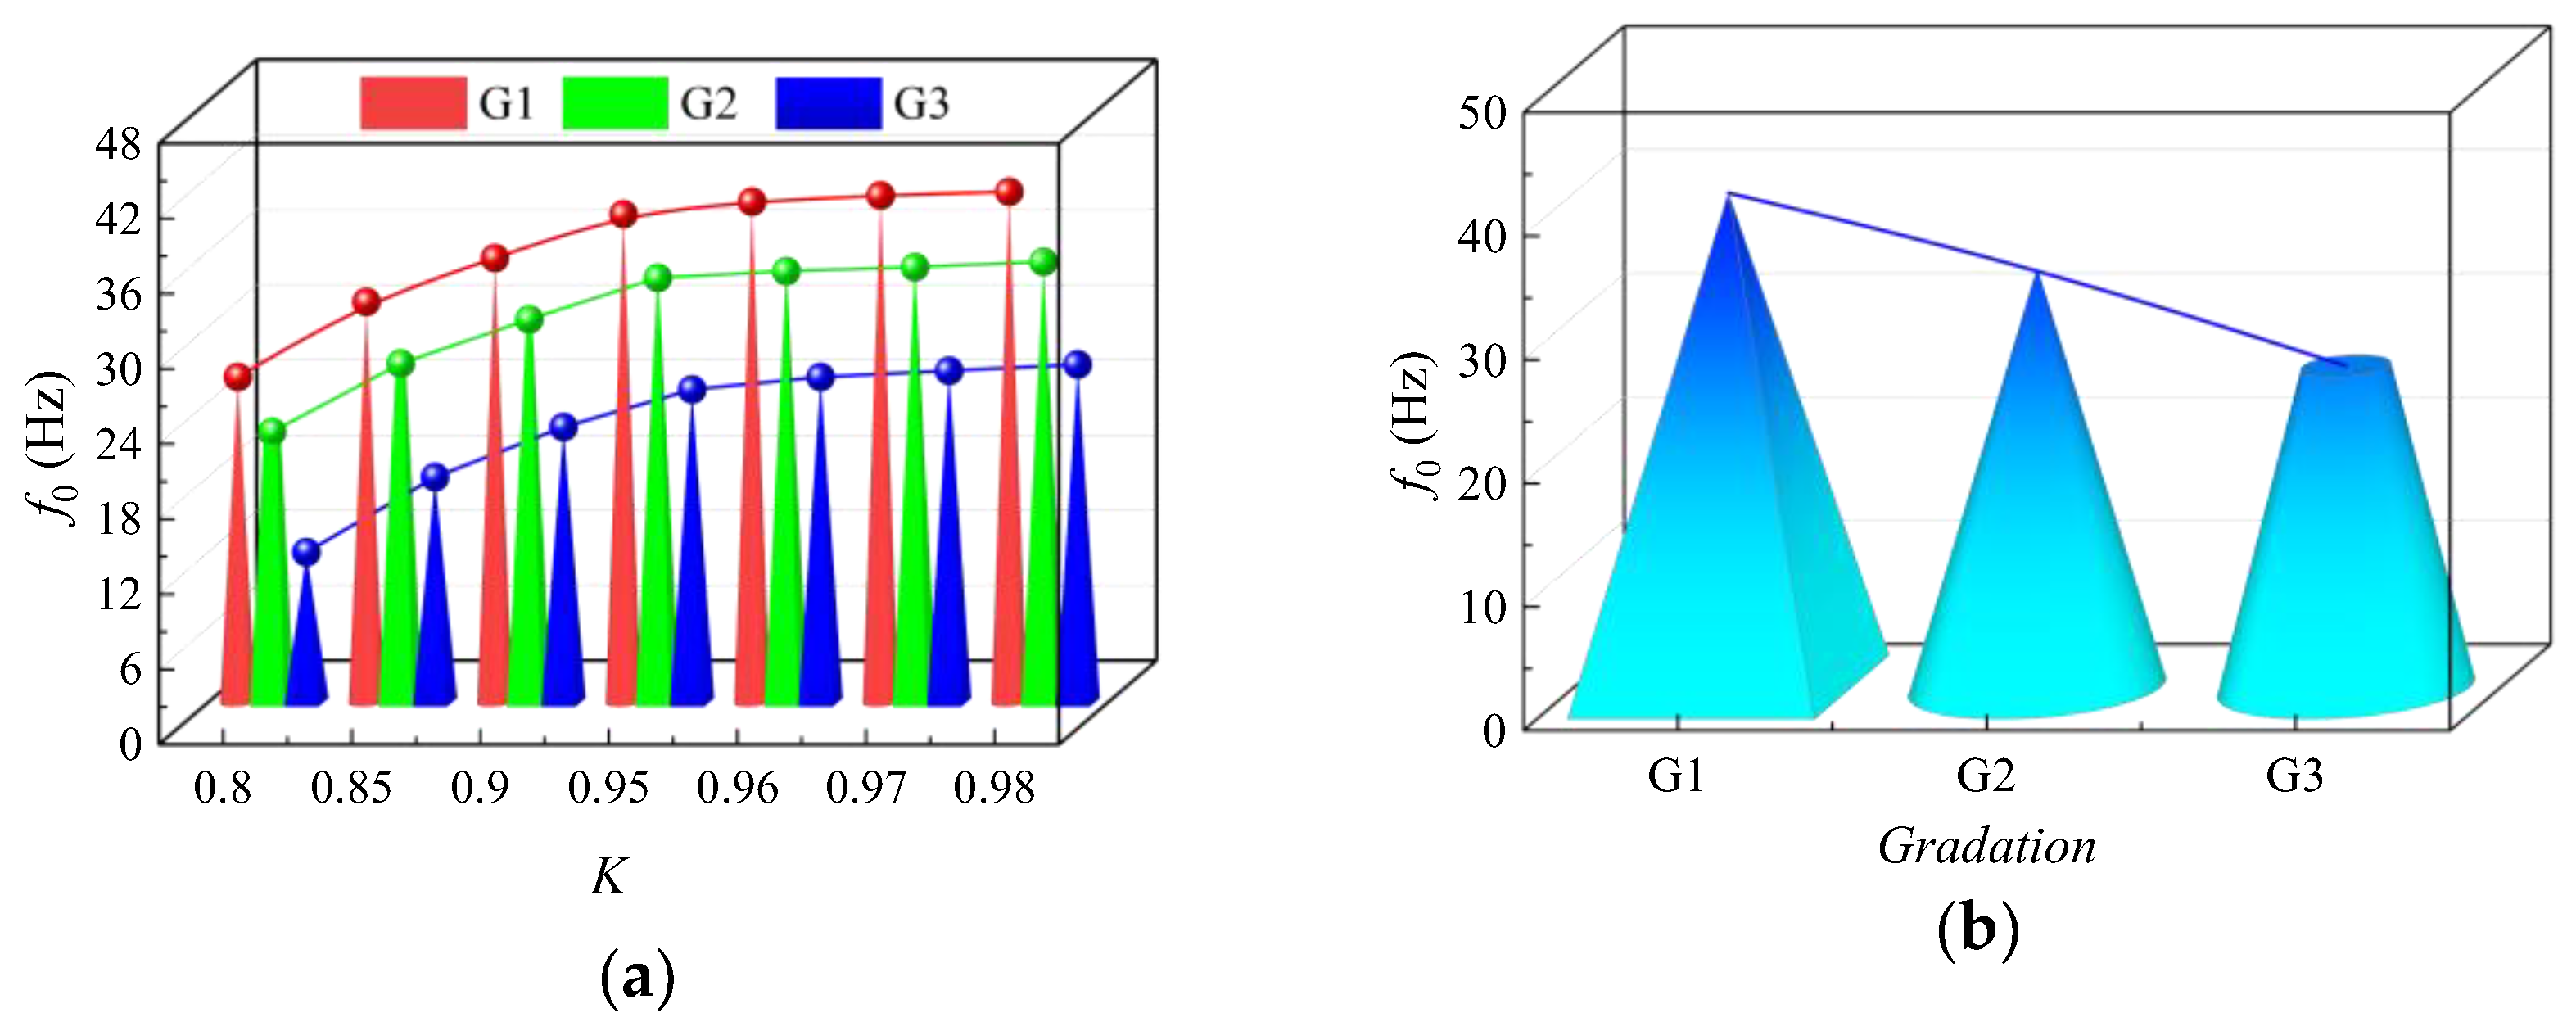
2.3. The Tests of Determining f0

The post-compaction f0 of the HRGG fillers was obtained from the hammering modal analysis method [26]. As shown in Figure 4, the hammering modal experiments were primarily divided into three steps. (1) Demold: the complete compacted HRGG fillers were obtained using demolding equipment after the plate load test. (2) Installation of acceleration sensors: a triaxial accelerometer was installed at the top of the fillers and connected to the DH5922D dynamic signal acquisition equipment. (3) Collection of hammer impact acceleration signals: a rubber hammer was used to strike the top of the fillers, and the acceleration signals of the fillers during the strike were recorded in real time. To ensure the reliability of the signals, the hammering modal experiments for fillers with different K were repeated three times. Based on the acceleration signals of the fillers, the f0 with different K of fillers was determined by the hammering modal analysis method.
Figure 5 shows the hammering modal method analysis process based on G2 type HRGG fillers. Figure 5a shows the time-domain amplitude of the acceleration signal. The acceleration amplitude gradually weakened after reaching the peak until stabilized, indicating the fillers’ vibratory feature during the strike. The initial peak indicated a rapid response of the fillers to the hammering, while the weakening process indicated that the hammering energy gradually dissipated within the fillers until stabilized. As shown in Figure 5b, the time-domain acceleration signal was subjected to Fourier transformation to obtain the acceleration signal spectrum. It was observed that the acceleration reached the peak at a frequency of 33 Hz, which indicated a significant vibratory response of the fillers at this frequency. Hence, 33 Hz was determined as the first f0 of the G2 type HRGG fillers.
As shown in Figure 6, hammering modal experiments were conducted on HRGG fillers with different K and gradation, revealing the relationship between grading, K, and f0. As shown in Figure 6a, with the K increasing, the f0 of all three fillers showed a pattern of “rapid increase—slower increase”, and when K > 0.95, f0 tended to stabilize. As shown in Figure 6b, when K = 0.96, the filler gradation transitioned from G1 to G3, and the coarse particle content gradually decreased, which led to a gradual reduction in f0.

2.4. Relationship between fo and fov

In summary, the f0 of HRGG fillers with different K had been determined by hammering modal experiments. Vibratory compaction experiments were conducted with vibratory frequencies set at 20, 25, 30, 35, 40, and 45 Hz. Furthermore, the relationship between f0 and fov was explored by the parameters Krd, K20, and ρd of the fillers.
As shown in Figure 7, the evolution patterns of Krd, K20, and ρd for the HRGG fillers under different vibratory frequencies during the vibratory compaction were obtained. As shown in Figure 7a, the Krd of fillers at different vibratory frequencies all exhibited a pattern of “rapid increase—slower decrease”, indicating the presence of an “inflection point” in the Krd curve. As shown in Figure 7b, when the vibratory frequency was set as f0, the K20 also reached the maximum value at the “inflection point” of Krd. As shown in Figure 7c, the ρd of fillers at different vibratory frequencies all showed a pattern of “rapid increase—slower increase”. Nevertheless, it was difficult to determine the maximum dry density ρdmax based on the evolution pattern of ρd. Hence, ρdmax could be determined on the ρd curve by the vibratory time Tip corresponding to the “inflection point” on the Krd curve [25].
As shown in Figure 8, the relationships between Krd, K20, and ρdmax of HRGG fillers, in relation to vibratory frequency and gradation, were obtained from vibratory compaction experiments. As shown in Figure 8a, when the vibratory frequency was f0, fillers with different gradations all exhibited the maximum Krd. Similarly, as shown in Figure 8b,c, when the vibratory frequency was f0, the K20 and ρdmax all reached maximum values, which was consistent with the evolution patterns of Krd. The above experimental results indicated that the mechanical and physical properties of the compacted fillers were optimal when the vibratory frequency was f0, further indicating that f0 was the optimal compaction frequency.

3. ANN-Based Predictive Model for fov

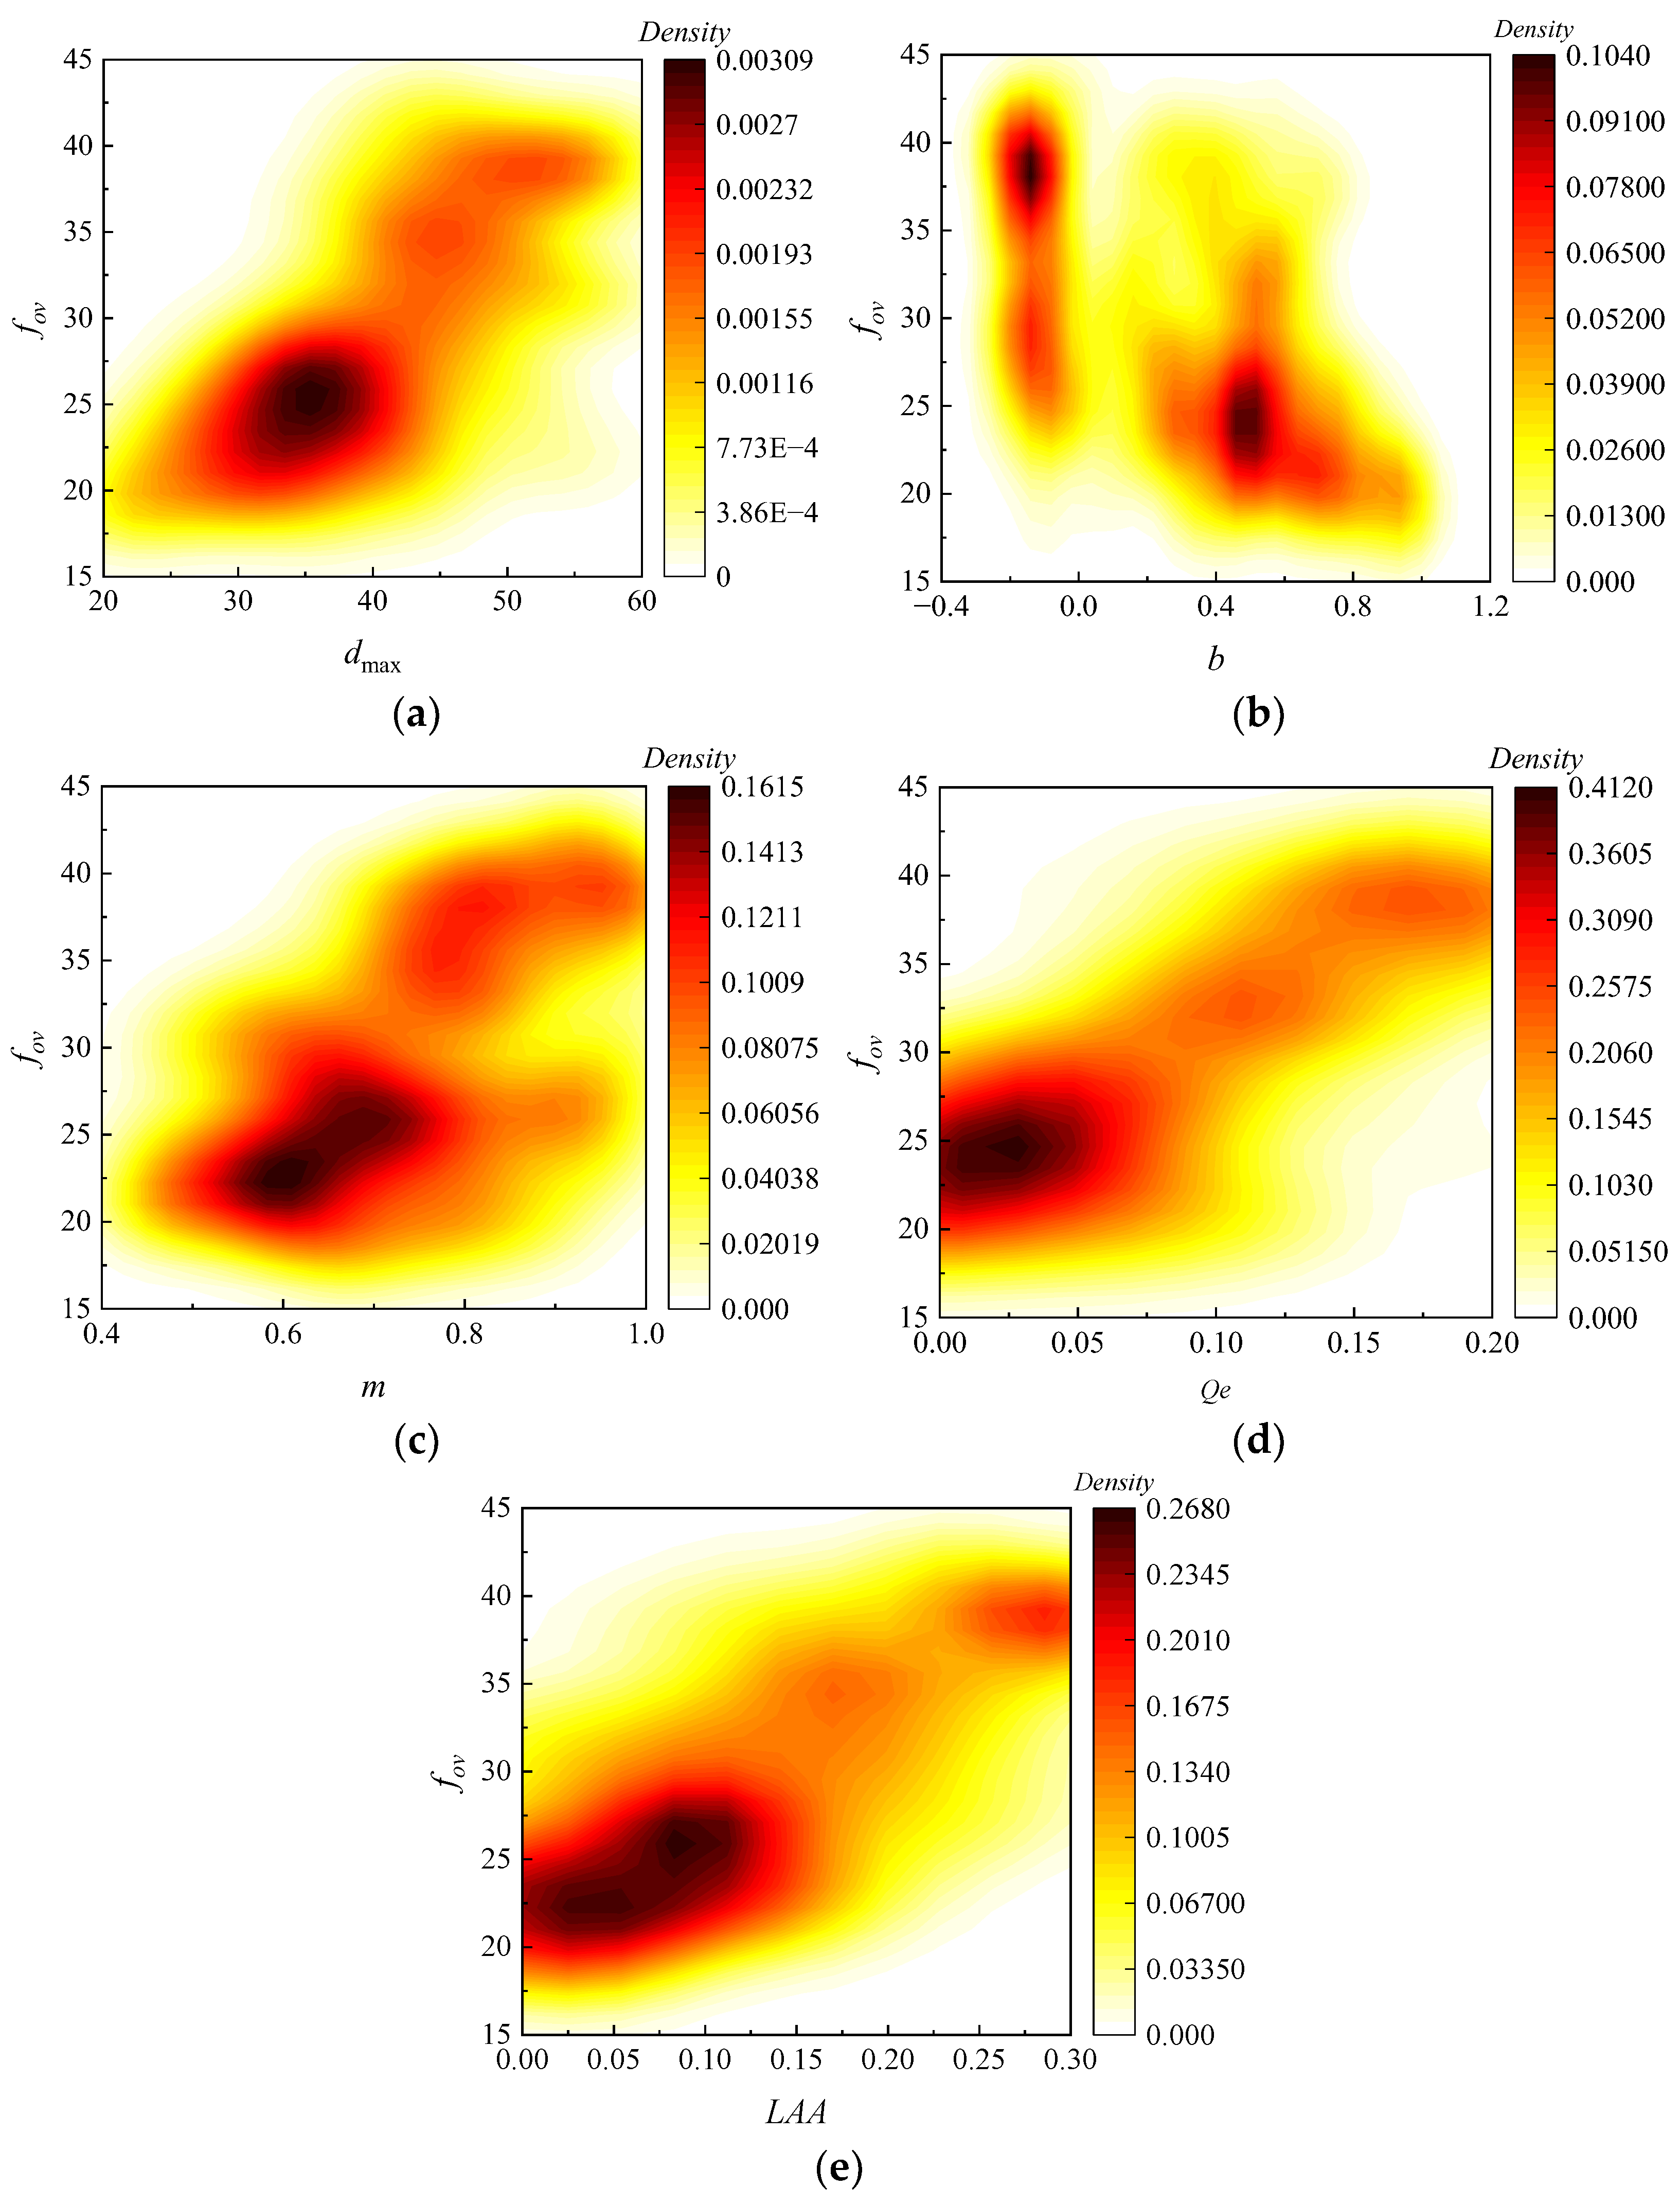
3.1. Key Feature of fov

According to the Chinese Code for Design of Railway Earth Structure (TB 10001–2016) [1], the performance feature of the fillers include gradation, particle shape, and particle crushing, such as Cu, Cc, dmax, three typical particle diameters (d ≤ 0.5 mm, d = 0.5~1.7 mm, d ≥ 1.7 mm), the Los Angeles abrasion of coarse aggregate LAA, flat and elongated particles in coarse aggregate Qe, the water absorption of coarse aggregate Wac, the water absorption of fine aggregate Waf, the liquid limit of fine aggregate LL, and the plastic limit of fine aggregate PL. As shown in Figure 9, to identify the feature of influencing the fov, all features were tested in the vibratory compaction experiments based on the Railway Ballast (TB/T 2140-2008) [27] and Geotechnical Testing Procedures for Railway Engineering (TB 10102-2023) [28].
Recently, the relationship between all features and fov was still unclear. If all features influencing fov were inputted into the ML prediction model, this might have overshadowed the role of key features and increased the difficulty of model training. Hence, it was necessary to identify the key features influencing fov, and then input them into the ML prediction model to reduce the spatial dimension of the samples and enhance the efficiency of model training.
As shown in Figure 10a, Grey Relational Analysis (GRA) was a statistical method for analyzing multiple factors, which assessed the correlation of sequences based on the similarity of their curve shapes. The similarity in sequence curve shapes was positively correlated with sequence correlation [29]. Hence, the key feature of influencing the fov could be determined based on GRA. As shown in Figure 10b and Table 2, the correlation coefficient R between each characteristic and fov was calculated. Generally, the feature could be considered as strongly correlated when R > 0.6. Thus, the feature strongly correlated with fov was as follows: dmax (0.75), d < 0.5 mm (0.73), d ≥ 1.7 mm (0.71), d = 0.5 mm~1.7 mm (0.68), Qe (0.66), LAA (0.64).

3.2. Dataset of ANN Model

The GRA algorithm explicitly determined the key feature influencing the fov. Nevertheless, it was difficult to provide a detailed description of the gradation feature for d ≥ 1.7 mm, d = 0.5 mm~1.7 mm, and d < 0.5 mm, making it impractical for direct application in the ML prediction model. Hence, it was crucial to accurately quantify the gradation feature of the fillers. As shown in Equation (5), Wu et al. [30] proposed an equation that could describe the continuous gradation of coarse-grained soil. Thus, the three indicators of the gradation feature could be described by the two gradation characteristic parameters: b and m. Eventually, dmax, b, m, Qe, and LAA were considered as the key features of influencing the fov and were used as input features for the ML prediction model.
P = 1 ( 1 b ) ( d max d ) m + b × 100 %
where b and m are the gradation characteristic parameters.
To validate the reasonableness of Equation (5) in describing the gradation feature of HRGG fillers, as shown in Figure 11, the dmax was set to 60 mm, and different values were assigned to b and m, resulting in gradation curves of different forms. The slope of the gradation curve was primarily determined by m. When b was held constant, m was positively correlated with the slope of the gradation curve. Meanwhile, the shape of the gradation curve was mainly determined by b. When m was held constant, with the b increasing, the gradation curve gradually transitioned from “hyperbolic” to “reverse S-shaped”. In conclusion, the parameters m and b in the gradation equation, respectively determined the slope and shape of the gradation curve. The wide range of variation in the b and m allowed the gradation equation to reflect different forms of gradation curves. Hence, it was reasonable to use Equation (5) to describe the gradation feature of HRGG fillers.
The ML prediction model dataset was further constructed based on the five key features of influencing the fov. A dataset D = {(xρ, yρ)}N i=1 was established by analyzing the relationship between fov and the five key features for 333 sets of fillers with different gradations, where xρ represented the input feature consisting of the five key characteristics, and yρ represented the output feature consisting of fov. As shown in Figure 12, the relationships between the five key features and fov in the ML prediction model dataset were obtained by analysis.

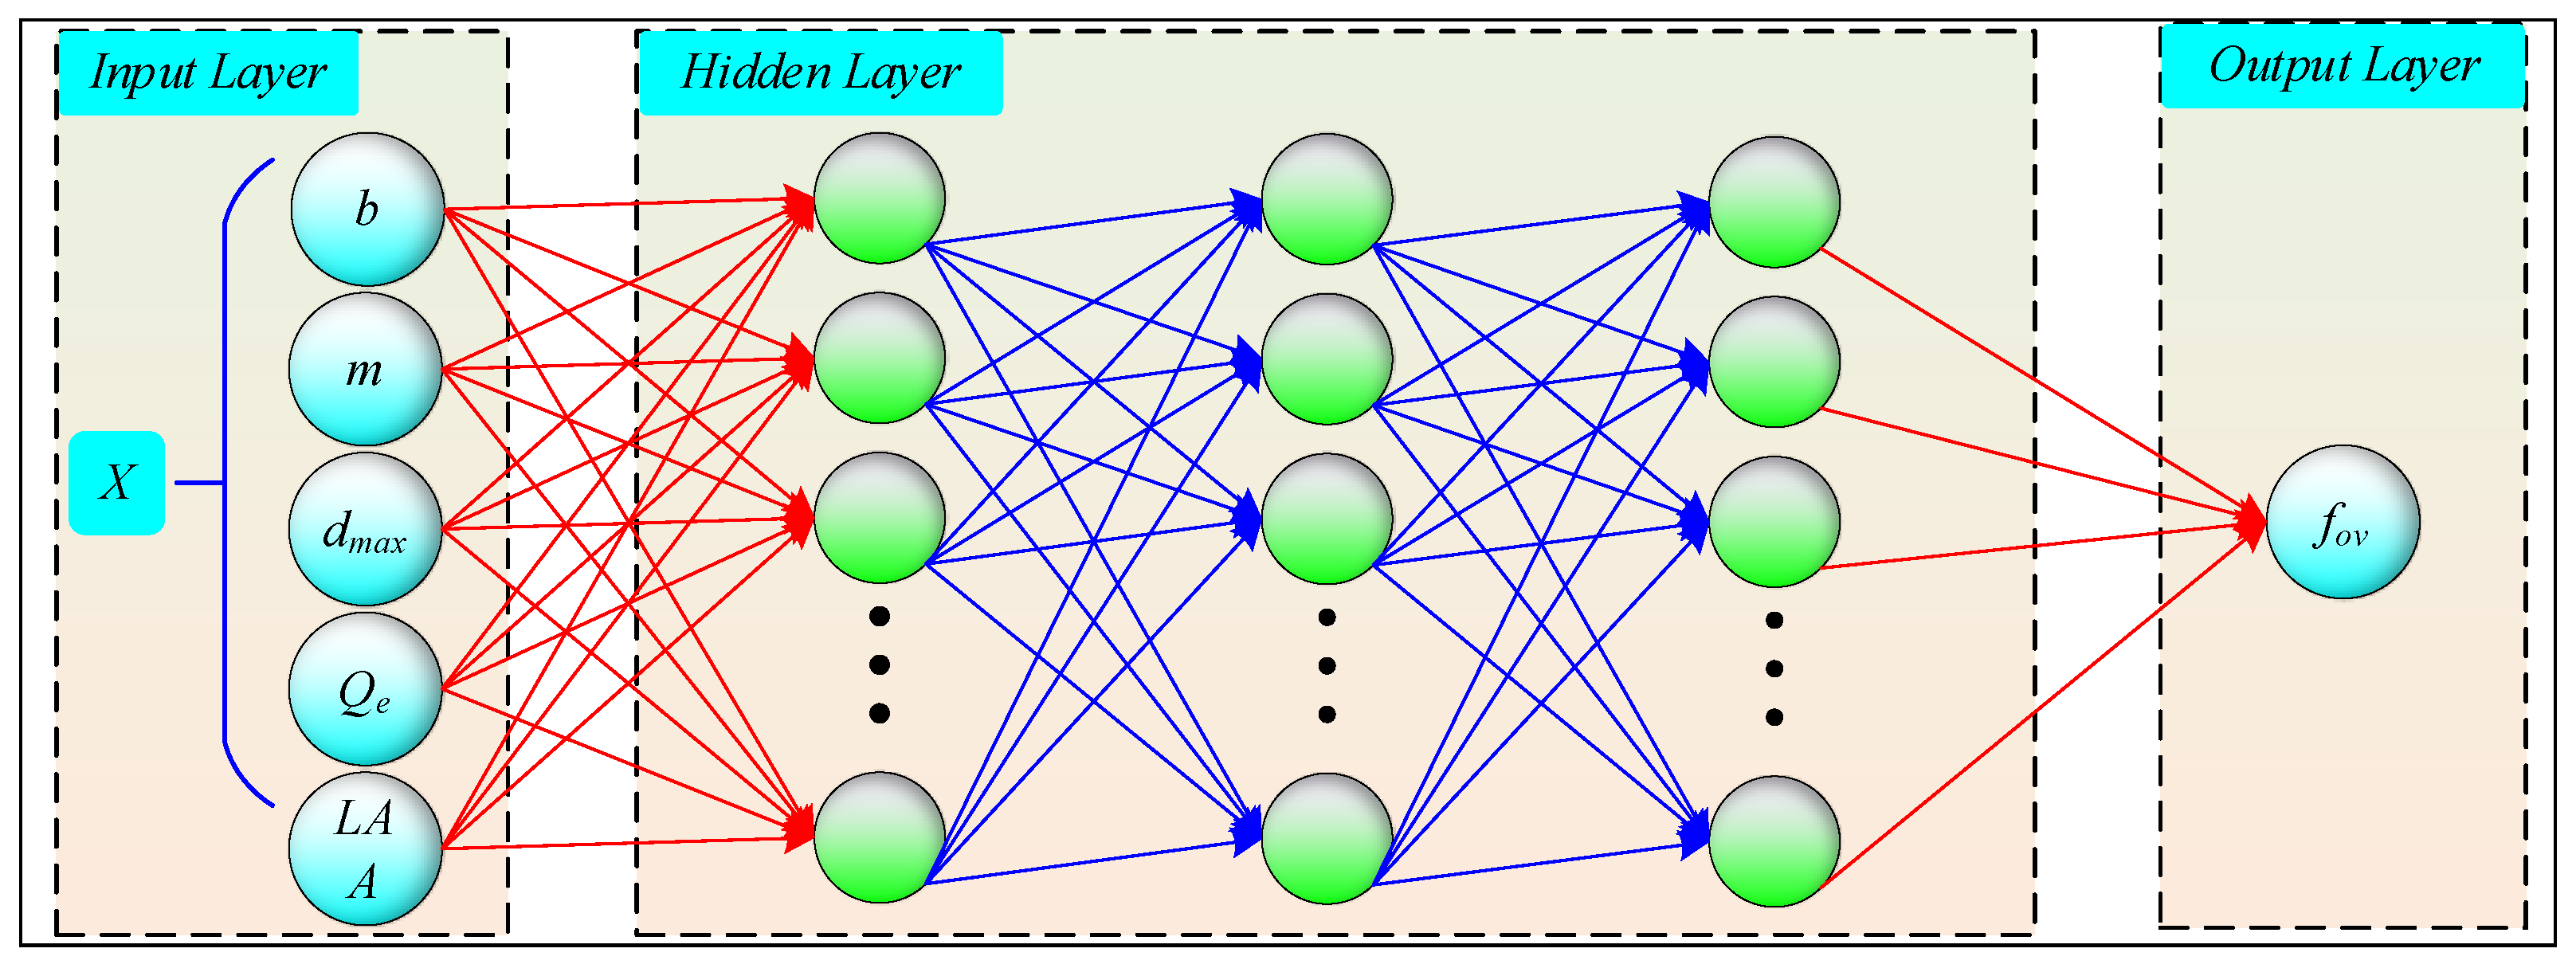
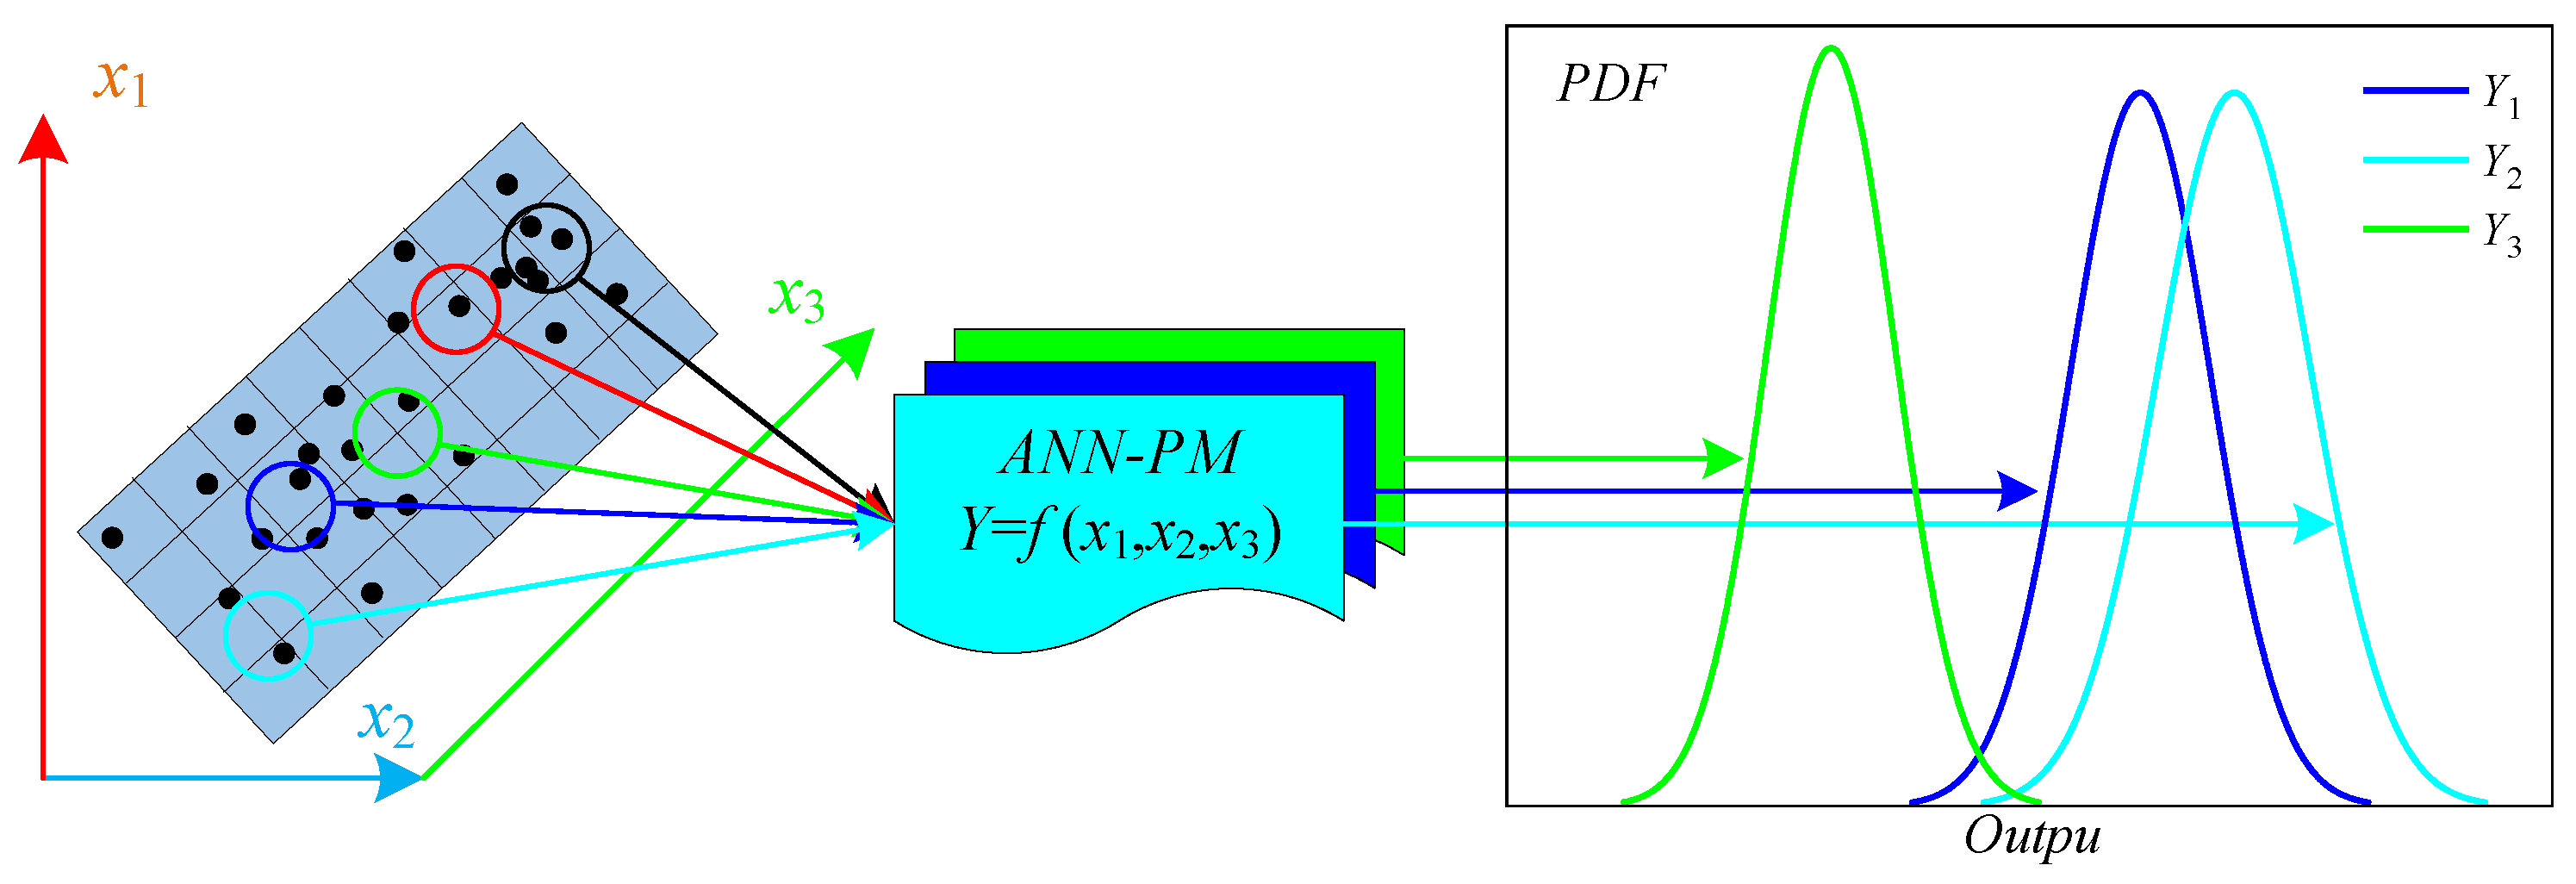
3.3. Establishment and Evaluation of ANN-PM

As shown in Figure 13, Artificial Neural Network (ANN) was a typical ML algorithm [31,32,33,34,35,36] used for predictive analysis of the fov. Additionally, the ANN model was trained using the Adam optimizer algorithm [37,38]. During the training, the mean absolute error (MAE) was used as the objective function to calculate particle fitness, which could be calculated by Equation (6). As shown in Figure 14, the establishment of the ANN prediction model (ANN-PM) based on fov primarily involved three steps: (1) partitioning the dataset, (2) developing the ANN-PM based on the training set, (3) and evaluating the performance of the ANN-PM based on the testing set.
f i t n e s s = M A E = 1 n i = 1 1 | y i y ^ i |
where n is the sample size, yi is the true value, and ŷi is the predicted value.
Step 1: Partitioning the dataset.
The dataset D was divided into training and testing sets in a 7:3 ratio, where the training set was used to develop the ML prediction model, and the testing set was used to evaluate the performance of the ANN-PM.
Step 2: Developing the ANN-PM based on the training set.
The ANN model was employed to predict fov, while the particle swarm optimization (PSO) algorithm [39,40] was introduced to optimize the hyperparameters of the ANN-PM. This method has been confirmed as an effective approach for hyperparameter optimization [41]. After that, the training set was inputted into the ANN-PM, and it was trained based on the optimal hyperparameters. The goodness-of-fit R2 [42], mean square error (MSE) [43], and mean absolute error (MAE) [44] were used to evaluate the generalization ability of the ANN-PM.
Step 3: Evaluating the impact of key features on the ANN-PM performance based on the ablation study.
A series of prediction experiments was designed by removing key features to explore their impact on the ANN-PM predictive performance [45]. Similarly, R2 was employed to evaluate the predictive performance of ANN-PM under different experimental conditions.
Step 4: Evaluating the performance of the ANN-PM based on the testing set.
After the ANN-PM was developed, the testing set was used for fov prediction. To quantify the generalization ability of the ANN-PM, the same evaluation criteria (R2, MAE, and MSE) for prediction accuracy and error as in step 2 were applied to evaluate the predictive performance of the ANN-PM.

3.4. Sensitivity Analysis of ANN-PM

As shown in Figure 15, based on the Monte Carlo method, the random fluctuations in ANN-PM input data could propagate through the output solution [46,47]. Then, the quantitative analysis of the probability distribution of the output solution could characterize the robustness of the ANN-PM.
To comprehensively evaluate the ANN-PM performance, the Monte Carlo method was employed to simulate the probability distributions of R2 and MSE. This analysis aimed to evaluate the robustness of the predictive models. The specific steps were outlined as follows:
Step 1: Randomization of data and result computation.
Randomizing the training set involves randomly combining 70% of the data for training and making predictions on the testing set. A set of MR2 and MMSE was calculated based on the predicted results, as shown in Equations (7) and (8).
M R 2 = f R 2 ( x 1 , x 2 , x n )
M M S E = f M S E ( x 1 , x 2 , x n )
where MR2 and MMSE are the R2 and MSE obtained through the Monte Carlo method. fR2() and fMSE() denote the non-linear functions between the random input training set, the R2, and MSE.
Step 2: Repetitive simulation.
The number of Monte Carlo simulations was set to 300. Next, the computational process outlined in step 1 was repeated, resulting in N sets of MR2 and MMSE, which were used to create probability distribution plots for structural analysis.

4. Results and Analysis

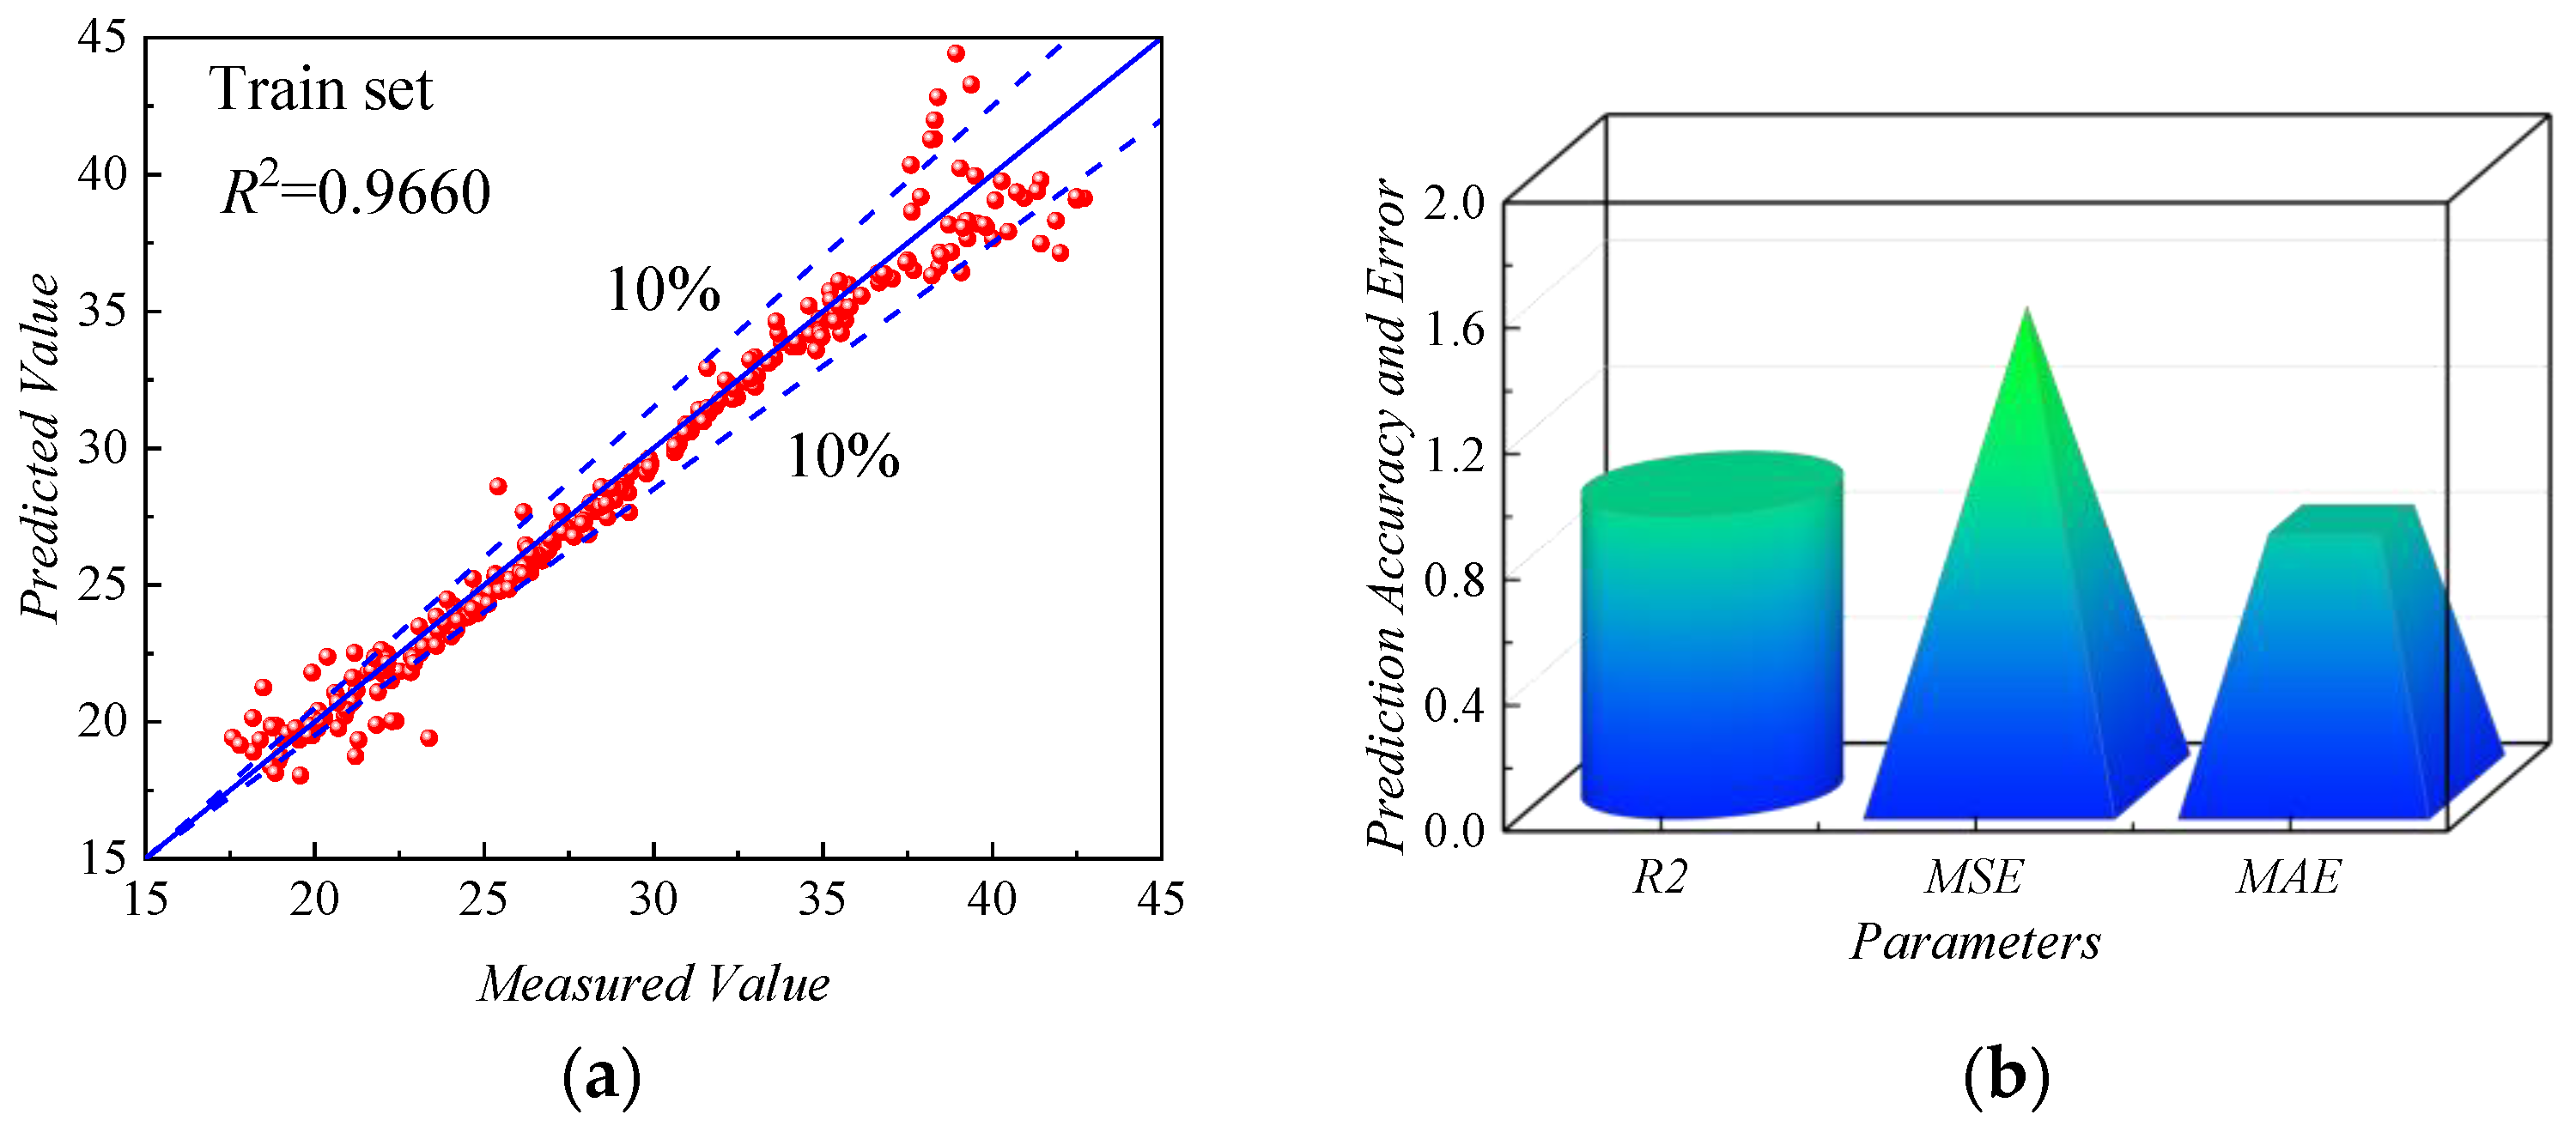
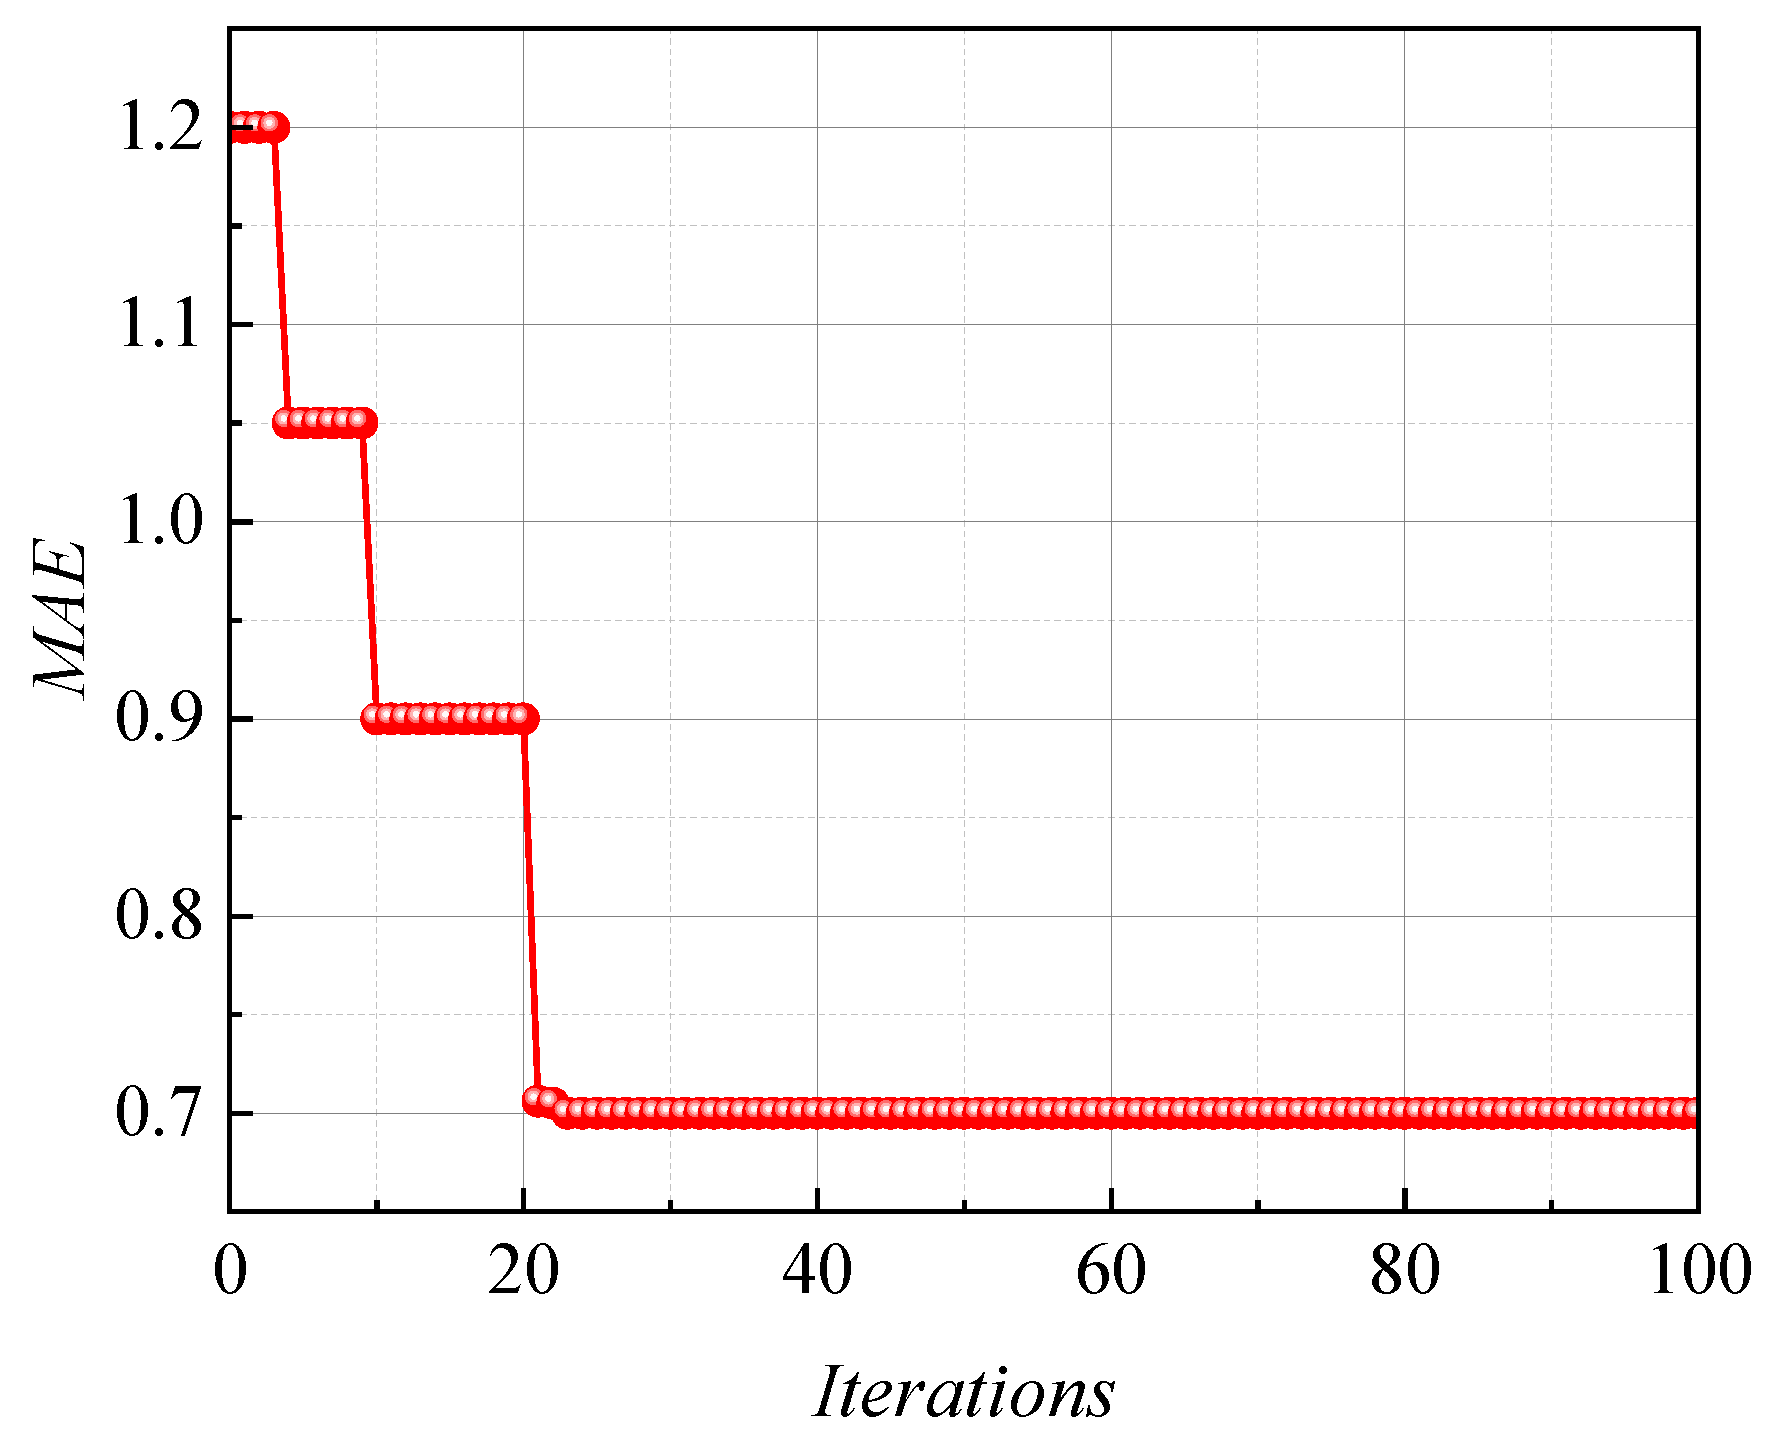
4.1. Establishment of ANN-PM Based on the Training Set

Figure 16 shows the variation of fitness for the ANN-PM during the iterative. It was clear that, with the iterative optimization of the PSO algorithm, the fitness of the ANN-PM significantly decreases and tends to stabilize after fewer iterations. This indicated that the PSO algorithm has a significant advantage in improving the prediction accuracy of ANN-PM. The optimum hyperparameters of the used ANN-PM in this paper were shown in Table 3. Furthermore, the obtained optimal hyperparameters were inputted into the ANN-PM for the prediction of fov.
As shown in Figure 17a, the scatter plot showed the fitting results of the ANN-PM on the training set, indicating the relationship between the predicted and actual values of fov. The horizontal axis represented the actual values of fov, while the vertical axis represented the predicted values. The more concentrated the data points were on the 45° median axis, the better fitting capability of the ANN-MLPM. The data points of the ANN-PM generally fluctuated around the 45° median axis, with the majority of points concentrated within the 10% error range, and only a small number of points fell outside this range, indicating that the ANN-PM demonstrated good fitting capability.
As shown in Figure 17b, the predictive performance of the ANN-PM on the training set was evaluated from the perspective of prediction accuracy and error. On the training set, the error indicators MAE (0.85391 Hz) and MSE (1.53176 Hz) of the ANN-PM were both small. Additionally, the R2 of the ANN-PM was higher than 0.96, indicating a high level of fitting accuracy. However, the predictive results on the training set only indicated the predictive ability of the ANN-PM during the development of the model. Hence, the predictive performance of the ANN-PM should have been evaluated using the testing set.

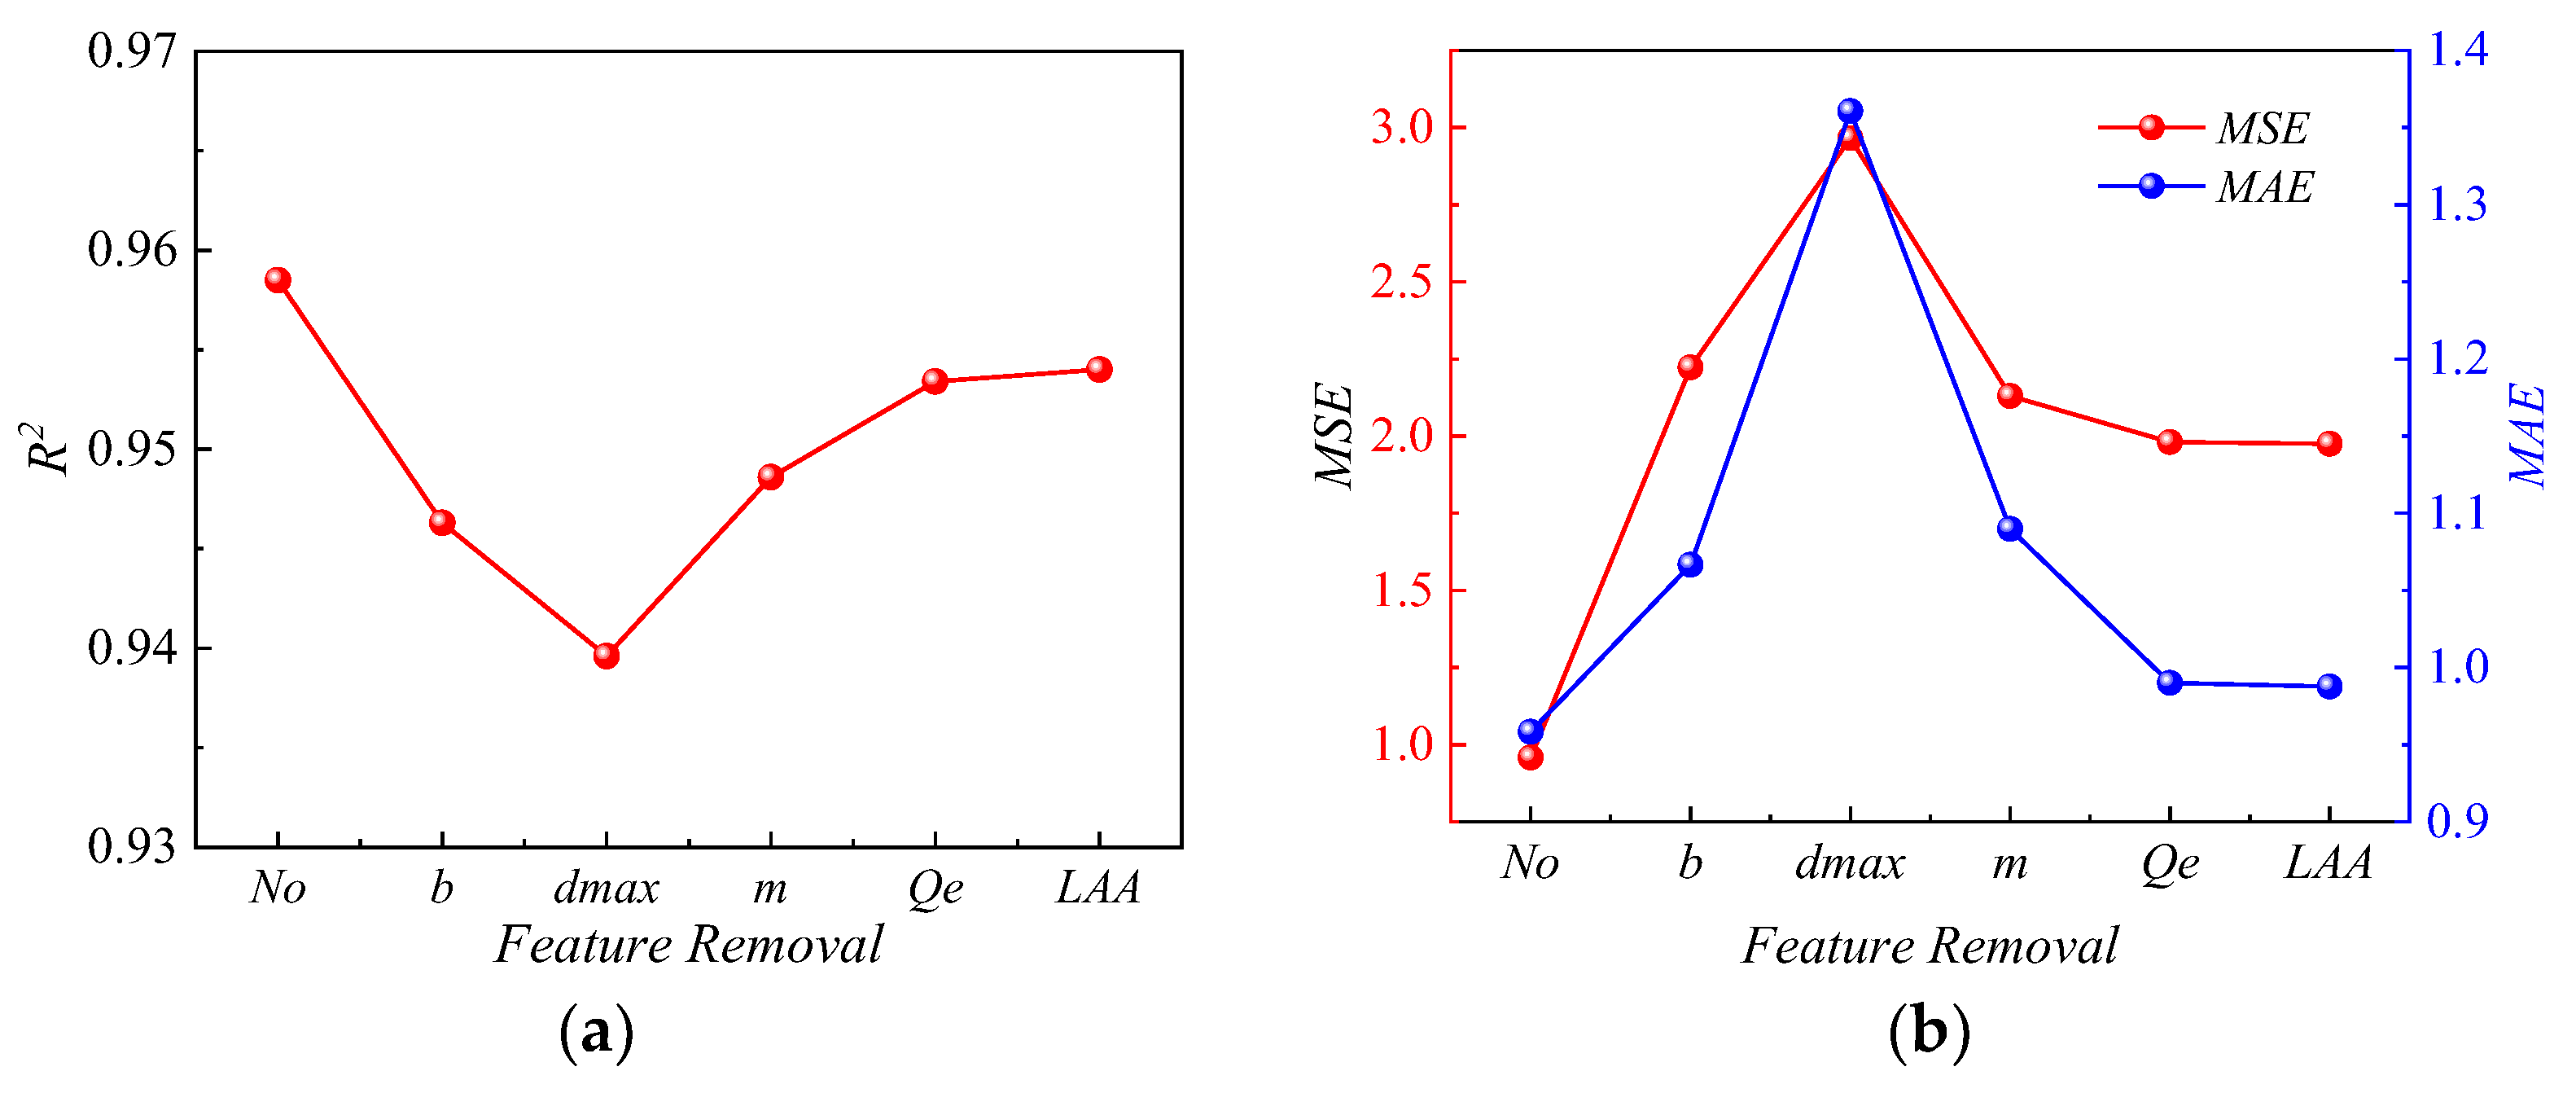
4.2. Evaluating the Impact of Key Features on the ANN-PM Performance

As shown in Figure 18, when five features were used as input features, the ANN-PM achieved the highest R2, indicating the highest prediction accuracy. Subsequently, after removing the LAA, the R2 of the ANN-PM was 0.9235, which only decreased by approximately 0.035. This indicated that the importance of the LAA for prediction results was relatively low. Conversely, when the dmax was removed, the R2 of the ANN-PM dropped to 0.8956, falling below 0.9. Similarly, when the dmax was removed, MAE and MSE all reached their maximum values. This indicated that the dmax held significant importance for prediction results. A comparative analysis revealed the importance rankings of the individual metrics as follows: dmax > b > m > Qe > LAA.

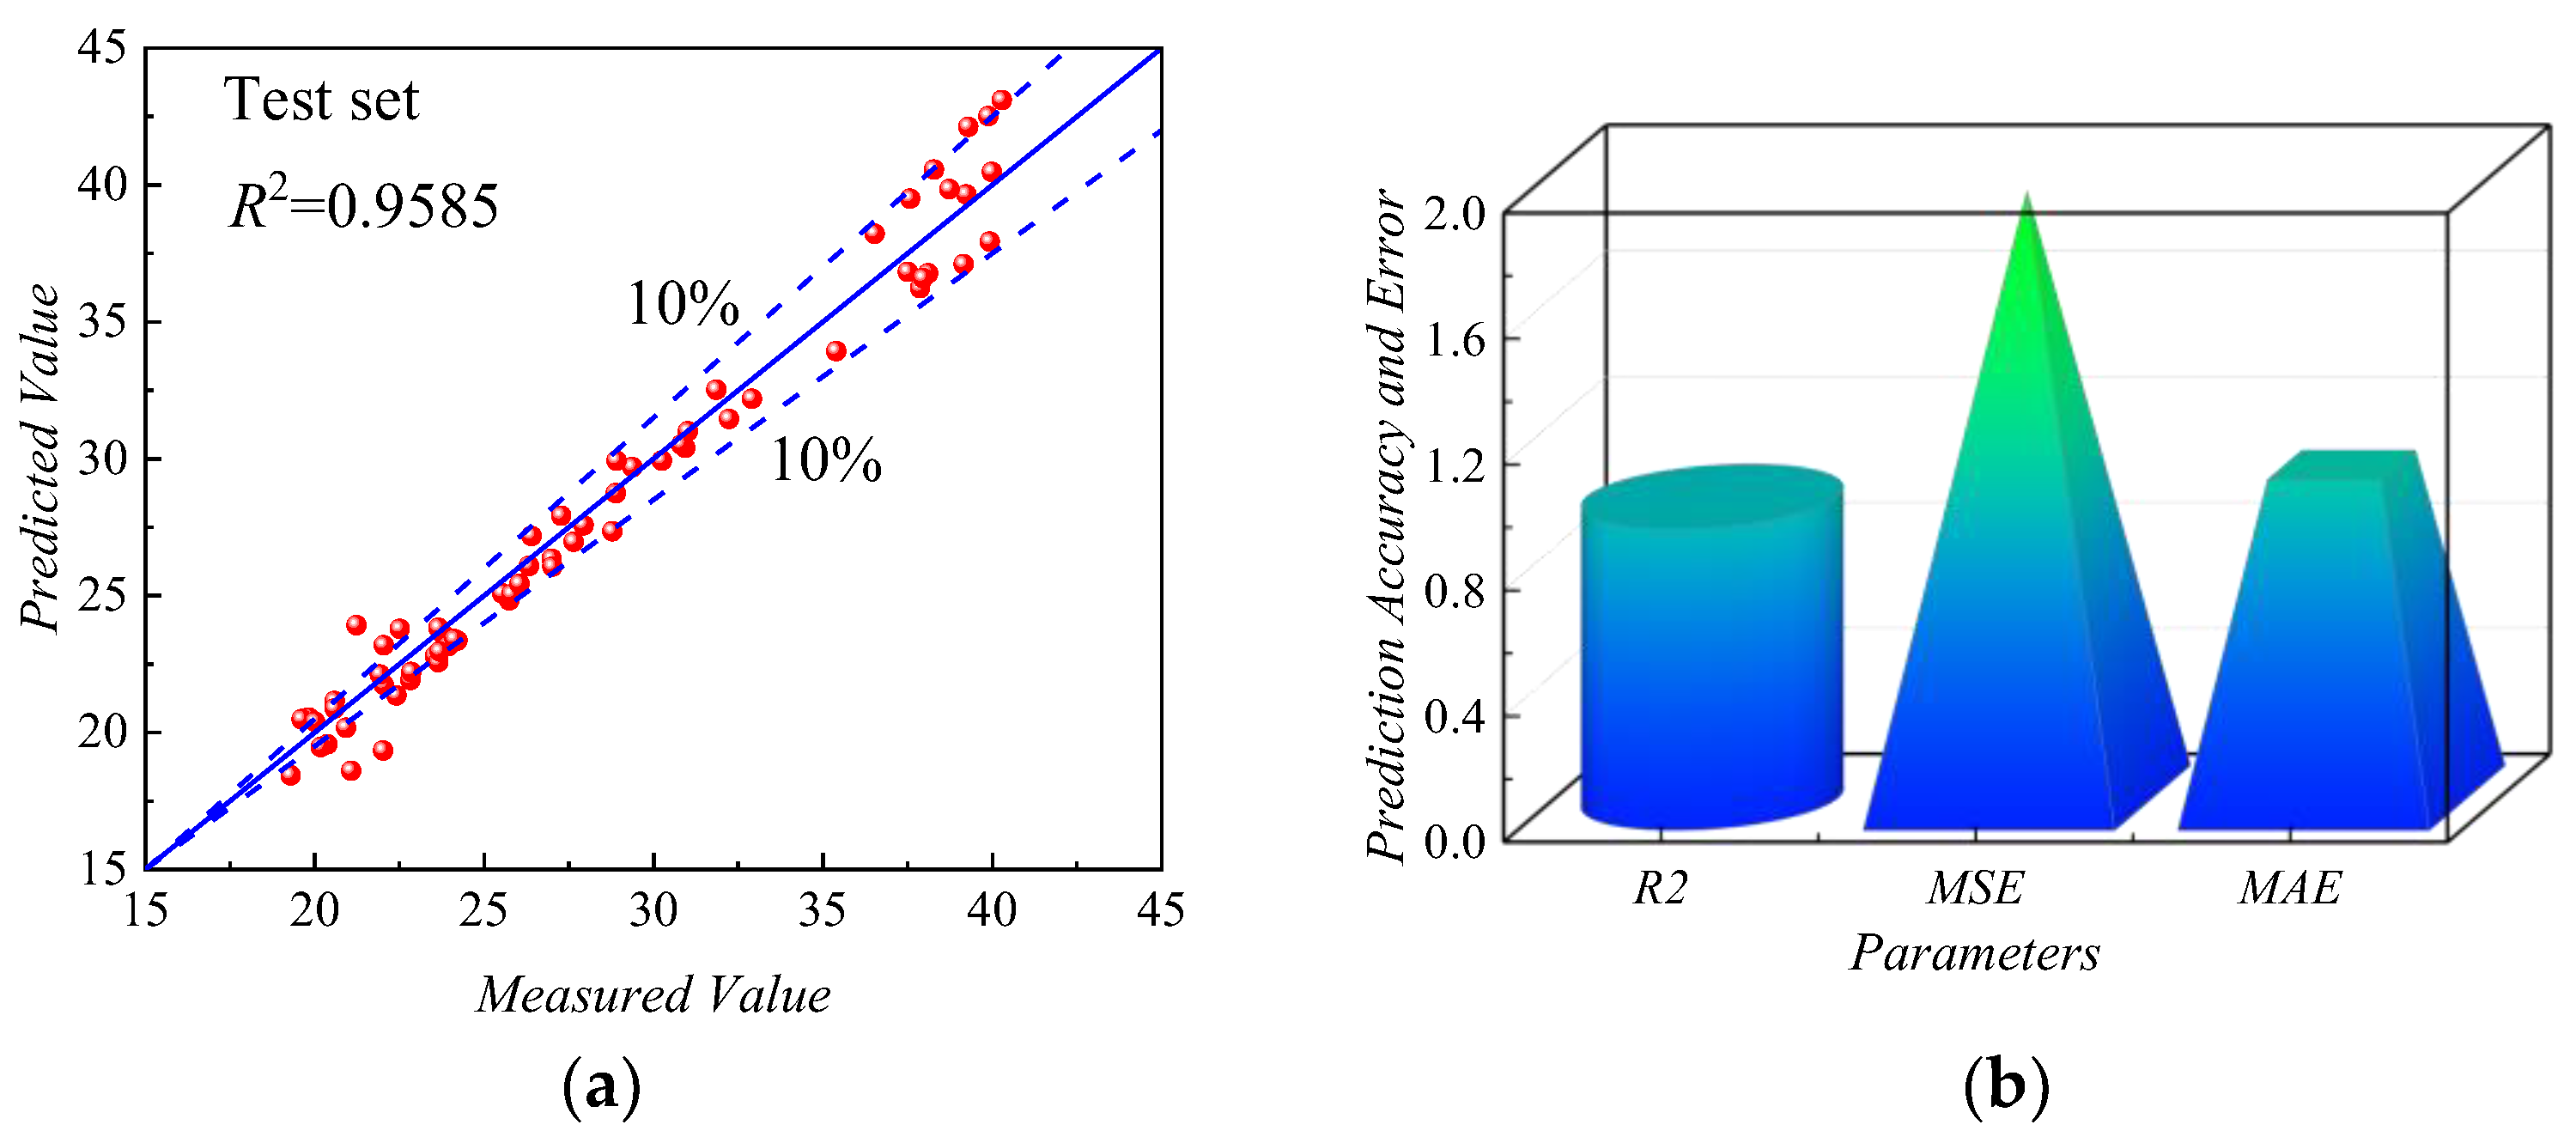
4.3. Evaluation of ANN-PM Based on the Testing Set

As shown in Figure 19a, the scatter plot showed the fitting results of the ANN-PM on the testing set, indicating the relationship between the predicted and actual values of fov. The data points of the ANN-PM generally fluctuated around the 45° median axis, with the majority of points concentrated within the 10% error range, and only a small number of points fell outside this range, indicating that the ANN-PM demonstrated good fitting capability. As shown in Figure 19b, the predictive performance of the ANN-PM on the testing set was evaluated from the perspective of prediction accuracy and error. On the testing set, the error indicators MAE (1.05942 Hz) and MSE (1.93091 Hz) of the ANN-PM were both small. Additionally, the R2 of the MLPM was higher than 0.95, indicating a high level of fitting accuracy.
Based on the above, the ANN-PM showed good predictive performance in terms of prediction accuracy and error evaluation on both the training and testing sets. Hence, the ANN-PM could be employed to predict the fov for the vibratory compaction of HRGG fillers.

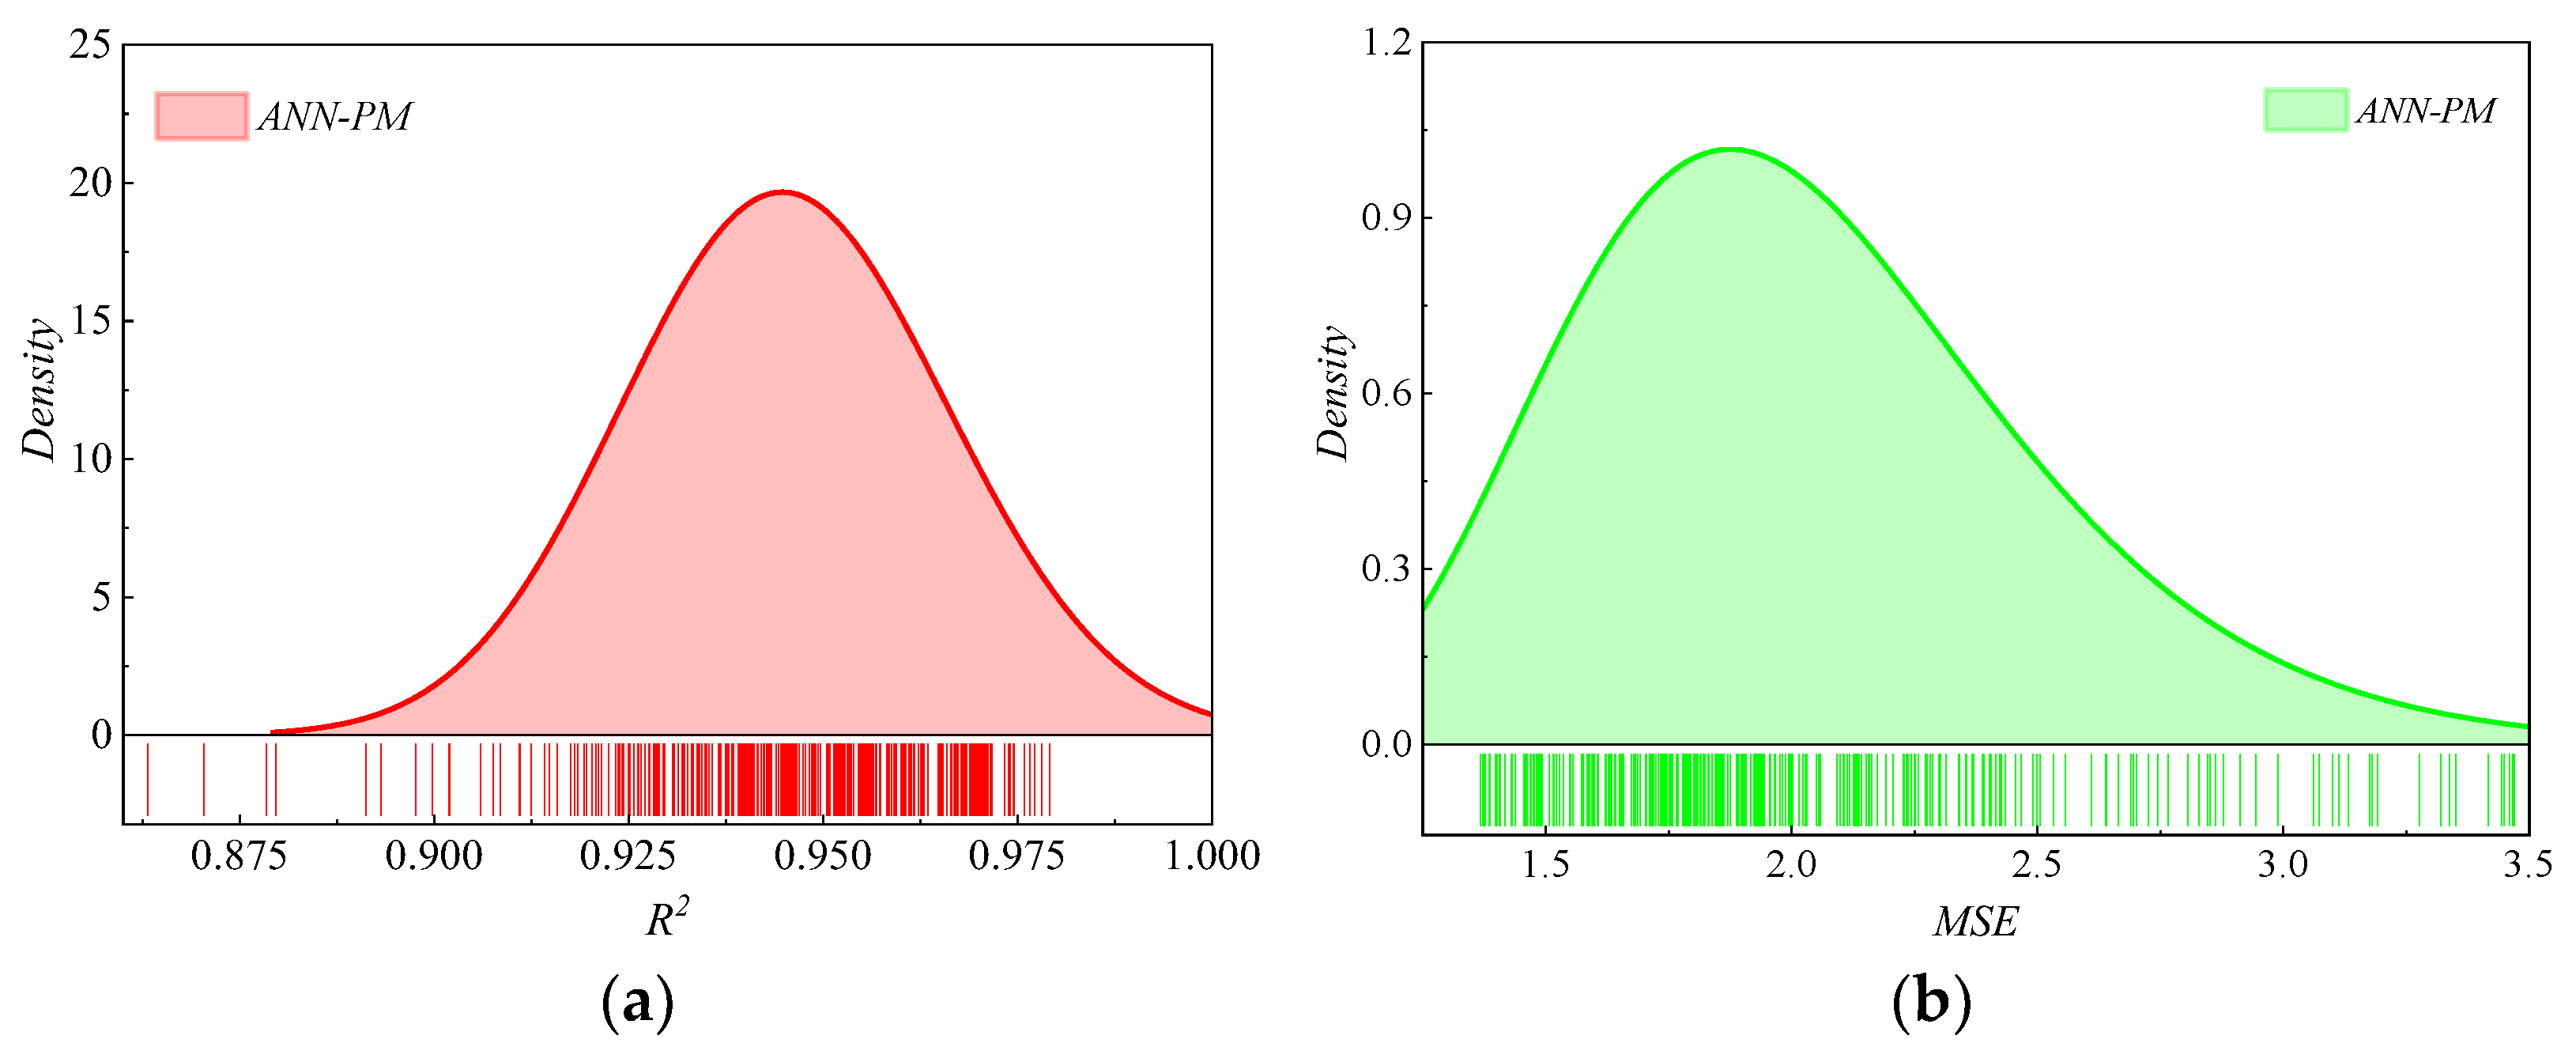
4.4. Sensitivity Analysis of ANN-PM

As shown in Figure 20, the probability distributions of the R2 and MSE were obtained by the Monte Carlo analysis. The distribution of R2 for the ANN-PM closely approached 1, with its mean value exceeding 0.9. This indicated that the ANN-PM maintained a high level of predictive accuracy. Simultaneously, the MSE distribution for the ANN-PM approached zero. Combining the robustness analysis results of R2 and MSE, it was clear that the ANN-PM exhibited excellent robust performance.

5. Discussion

Based on the results of this paper and the references [11,21,48], it is indicated that the ANN model exhibits excellent predictive performance for the vibration compaction parameters (fov) of HRGG fillers. This highlights the significant advantage of the ANN model in fov prediction, providing more accurate guidance for practical engineering applications. Hence, in forthcoming fov prediction applications, especially in the field of intelligent compaction, the ANN model is poised to become a potent tool. As intelligent technologies continue to evolve, this model has the potential to deliver accurate fov predictions for practical engineering, further propelling the advancement of intelligent compaction control. Nevertheless, there are still some issues that require further optimization regarding the ANN model. Despite demonstrating excellent predictive capabilities, the black-box nature of the ANN can hinder its real-world applications due to a lack of transparency in decision making. Hence, an in-depth exploration of data augmentation and model interpretability techniques can enhance the robustness of predictive results. Given these limitations, future research could employ SHapley Additive exPlanations (SHAP) analysis to reveal the relative importance of different input features. Moreover, the integration of advanced techniques such as ensemble learning or hybrid models may further improve prediction accuracy and reduce potential uncertainties.

6. Conclusions

To address the uncertainty of optimal vibratory frequency fov of high-speed railway graded gravel (HRGG) and achieve high-precision prediction of the fov, the following research was conducted. Firstly, the correlation between the resonance frequency f0 and fov of fillers with different compactness K was determined by vibratory compaction experiments and the hammering modal analysis method. Secondly, the relationship between the filler feature and fov was established, which revealed the key feature influencing the fov. Finally, the artificial neural network prediction model (ANN-PM) for predicting fov was established based on the key characteristics. The ablation study, prediction errors, and accuracy were used to evaluate the predictive performance of ANN-PM. Furthermore, the ANN-PM robust performance was evaluated based on the sensitivity analysis. The main conclusions obtained are as follows:
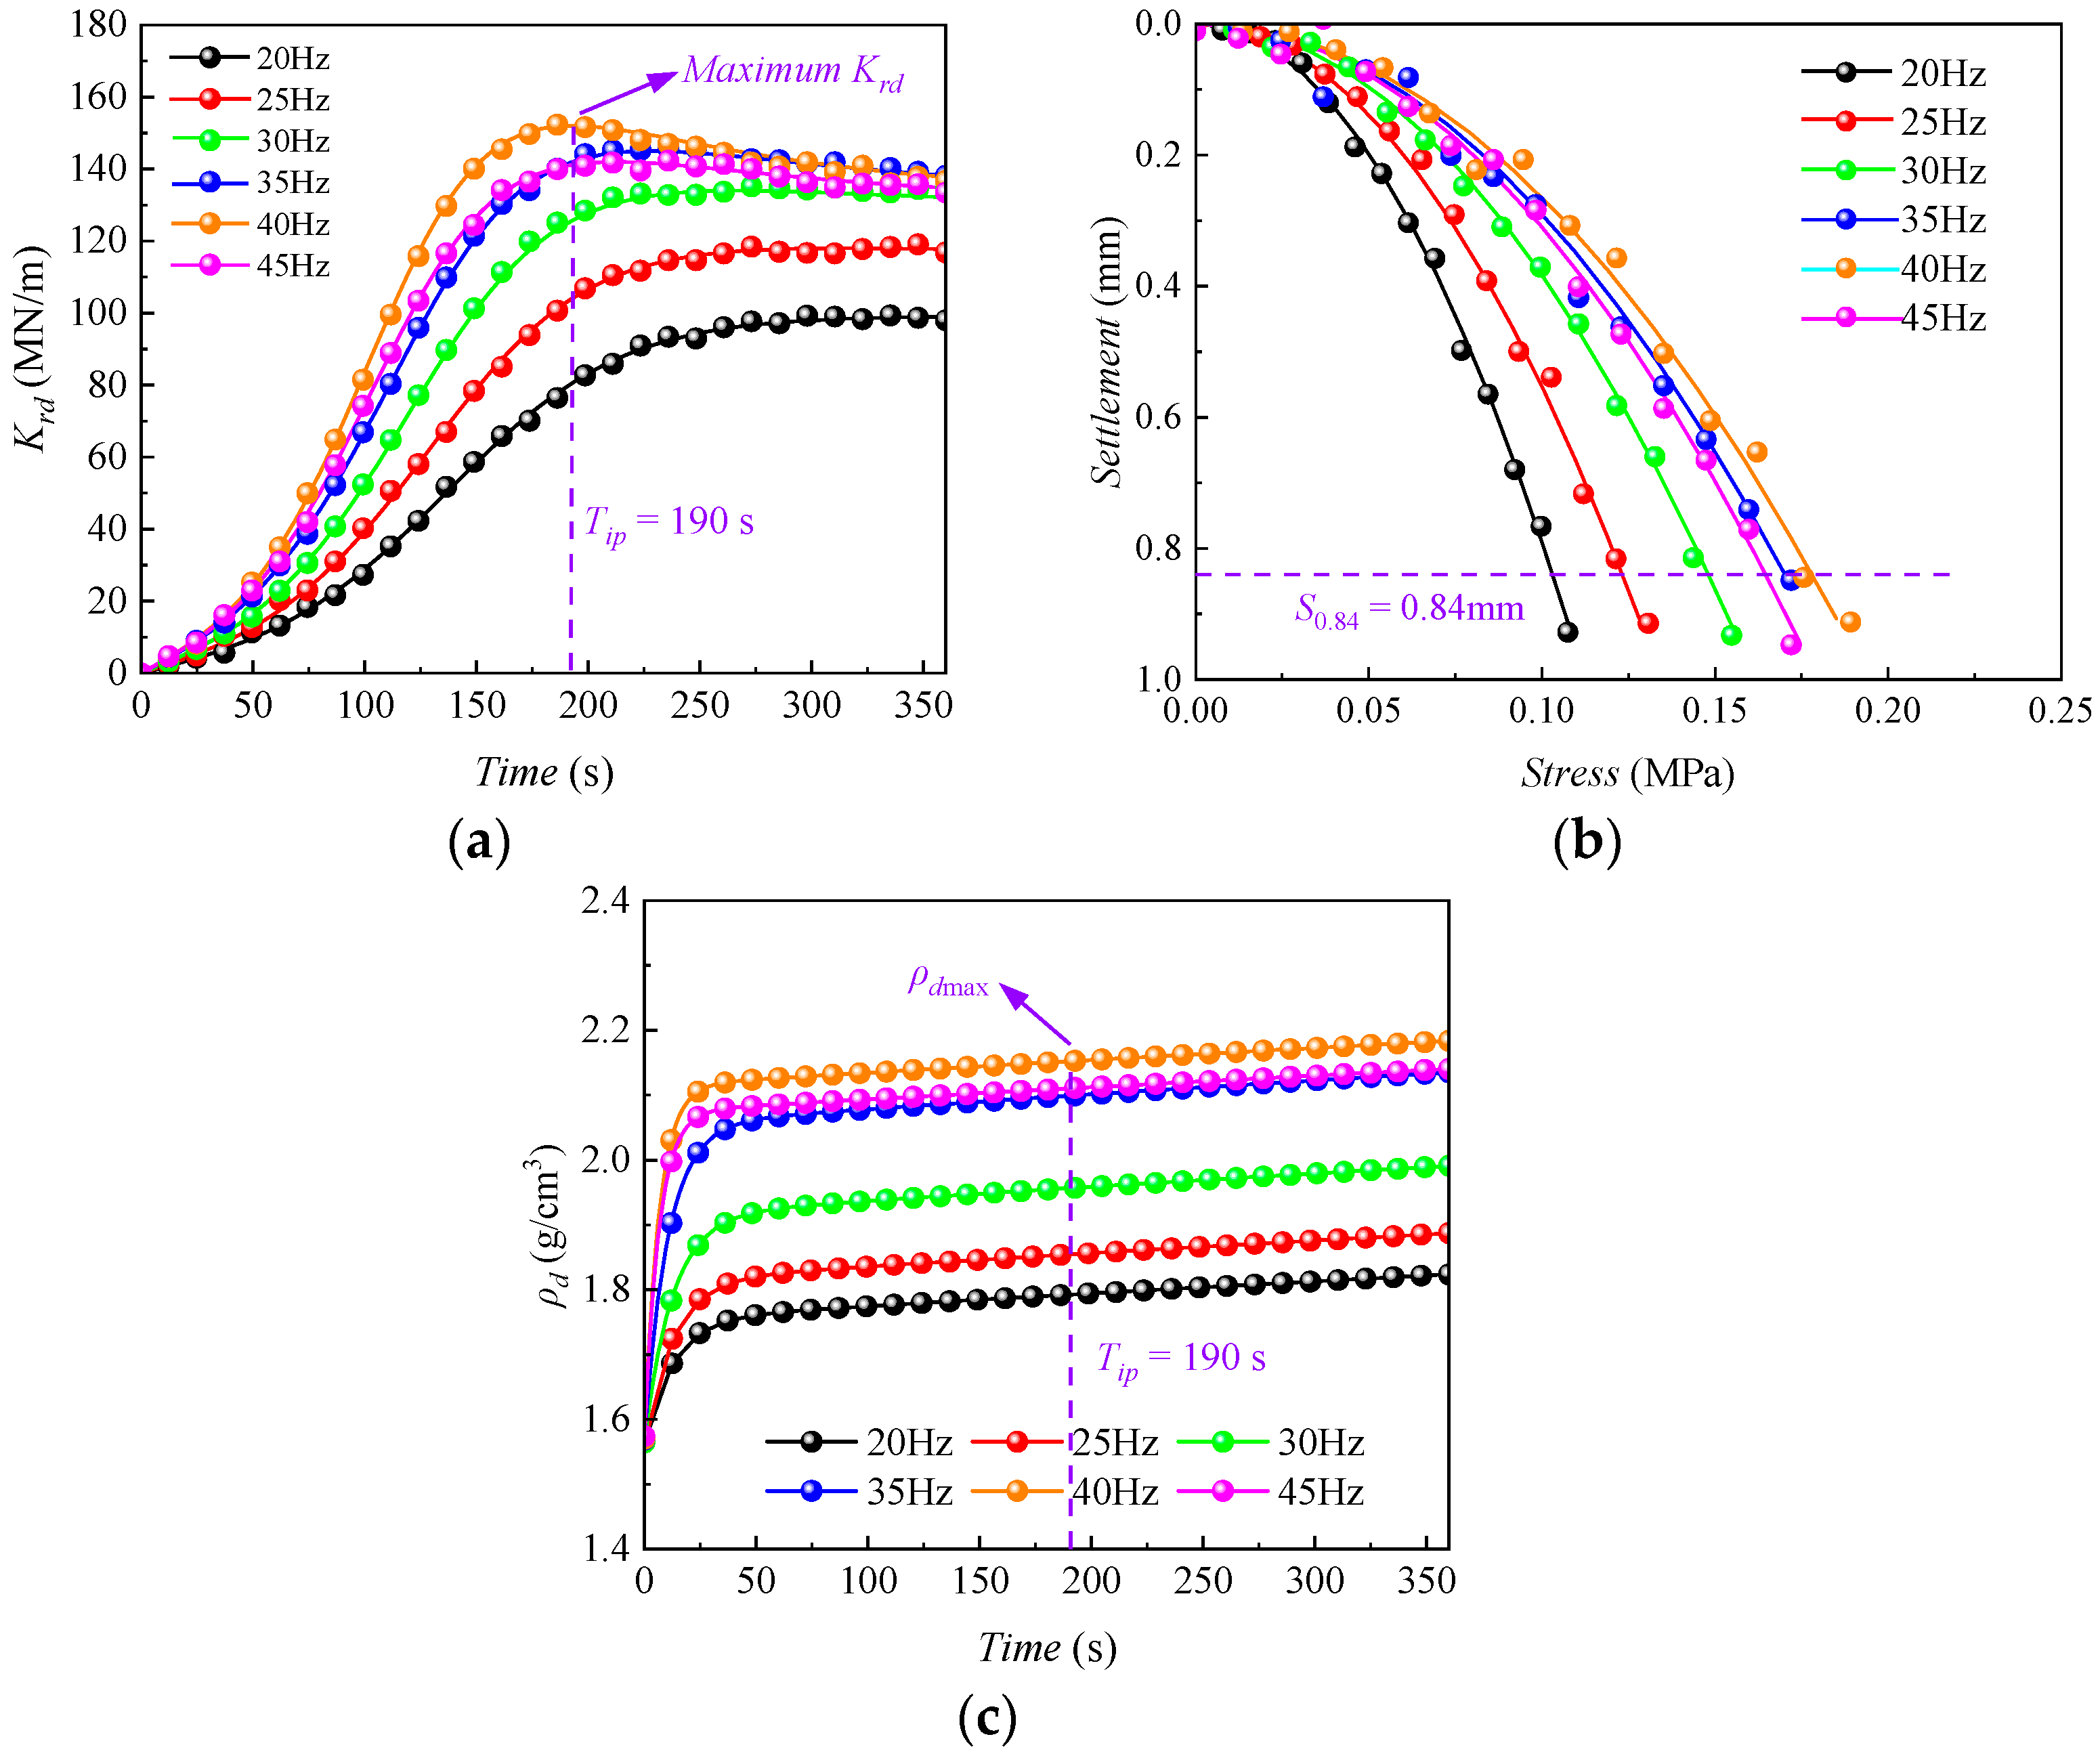
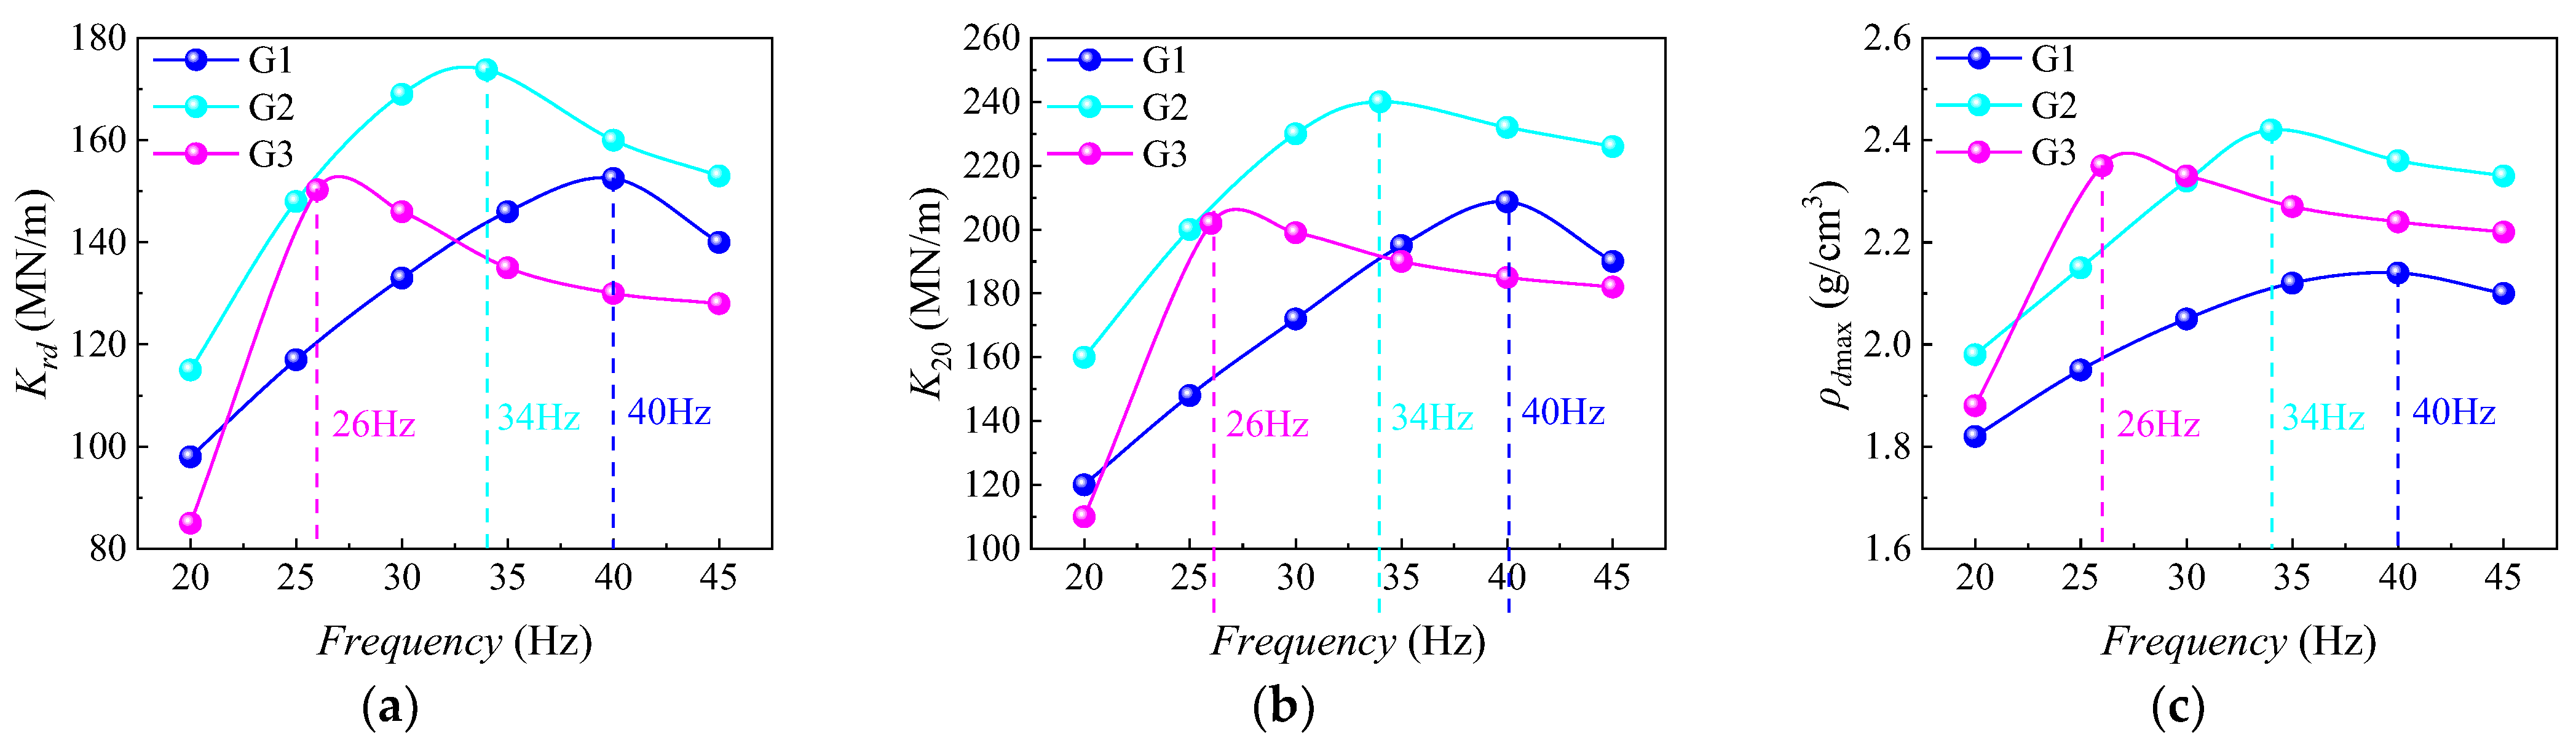
  • In the vibratory compaction experiments, maximum dry density ρdmax, stiffness Krd, and bearing capacity coefficient K20 of different gradation HRGG fillers all obtained optimal states when the vibratory frequency was set as f0, which indicated that f0 was the fov.
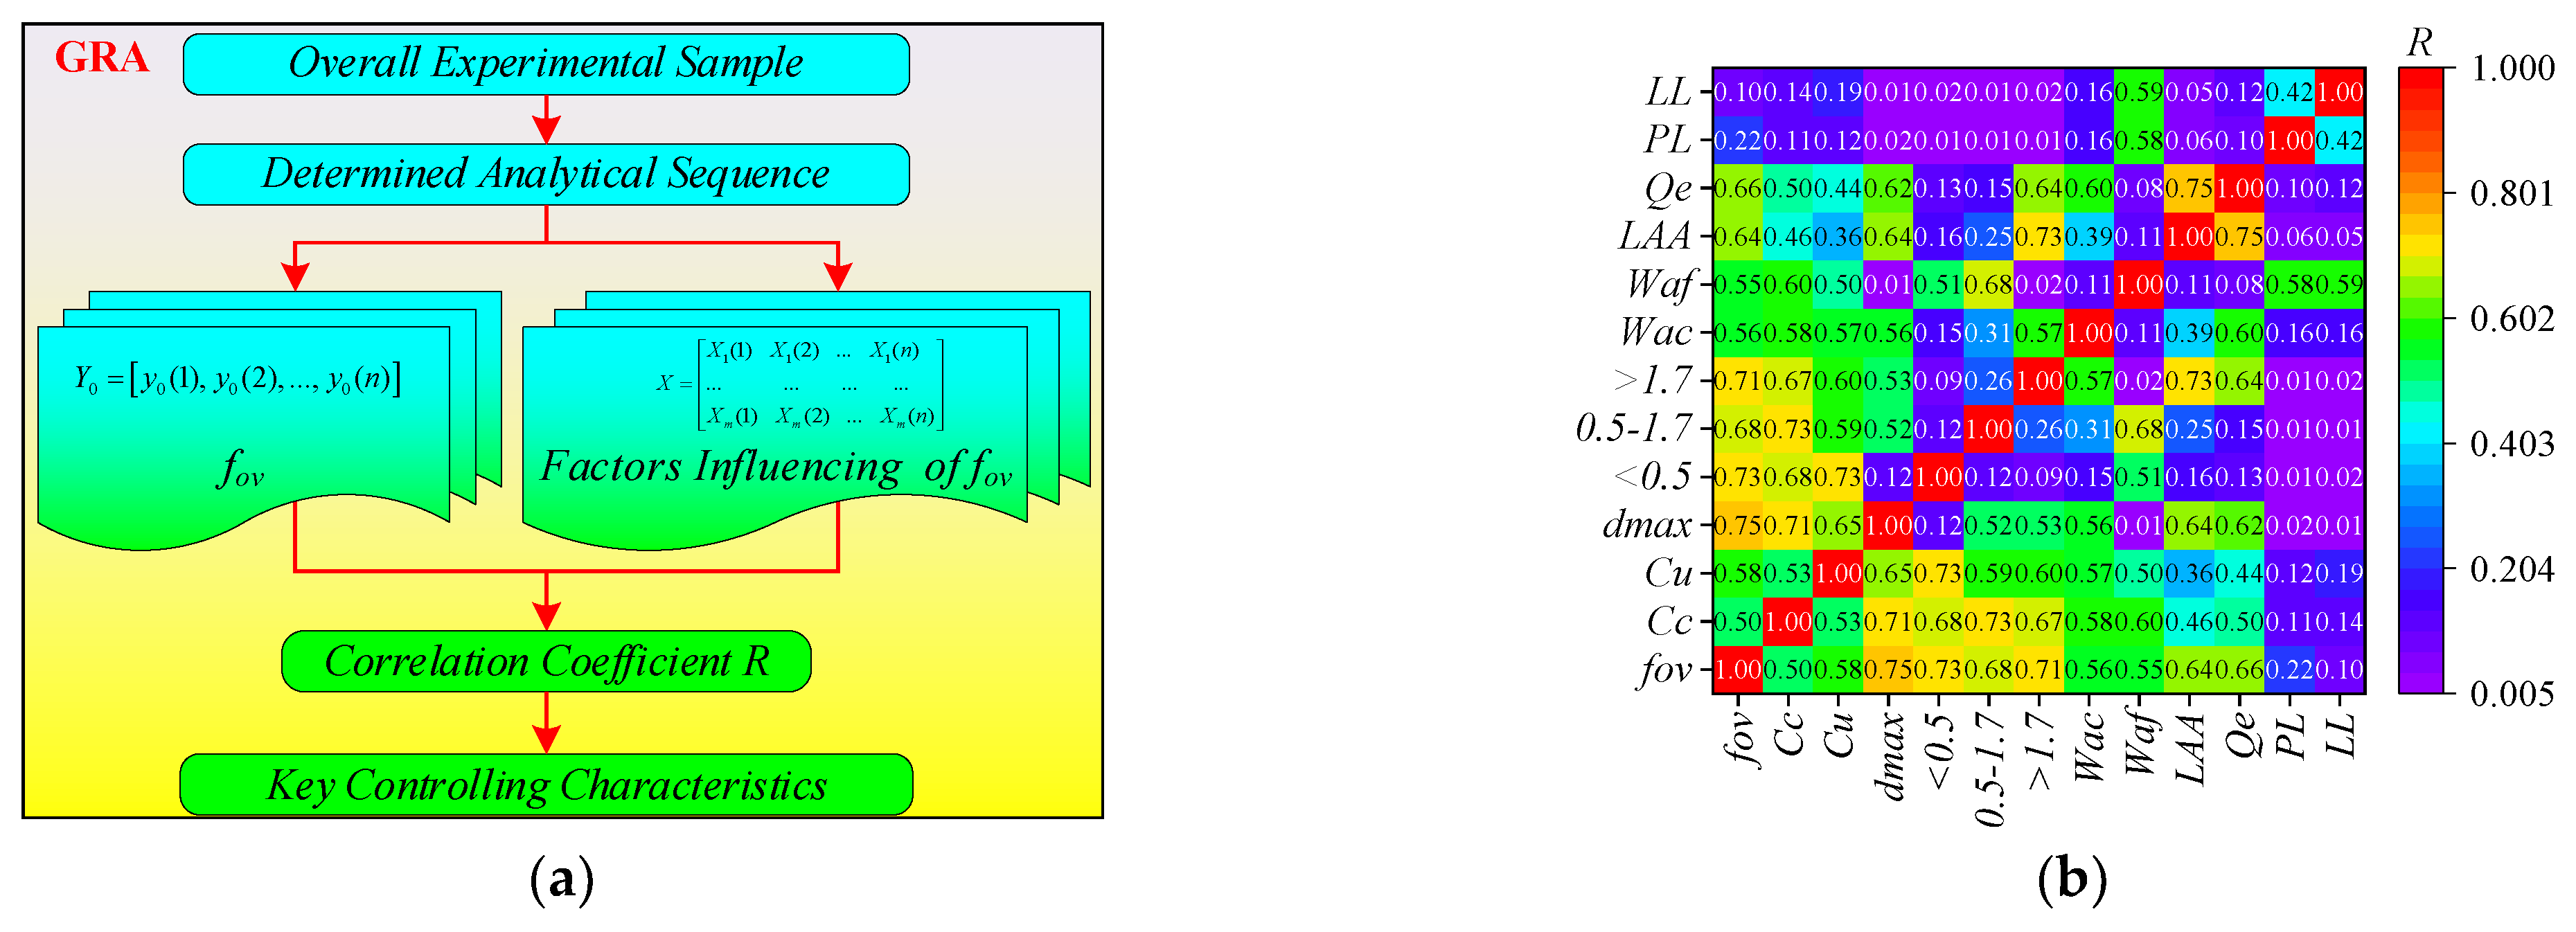
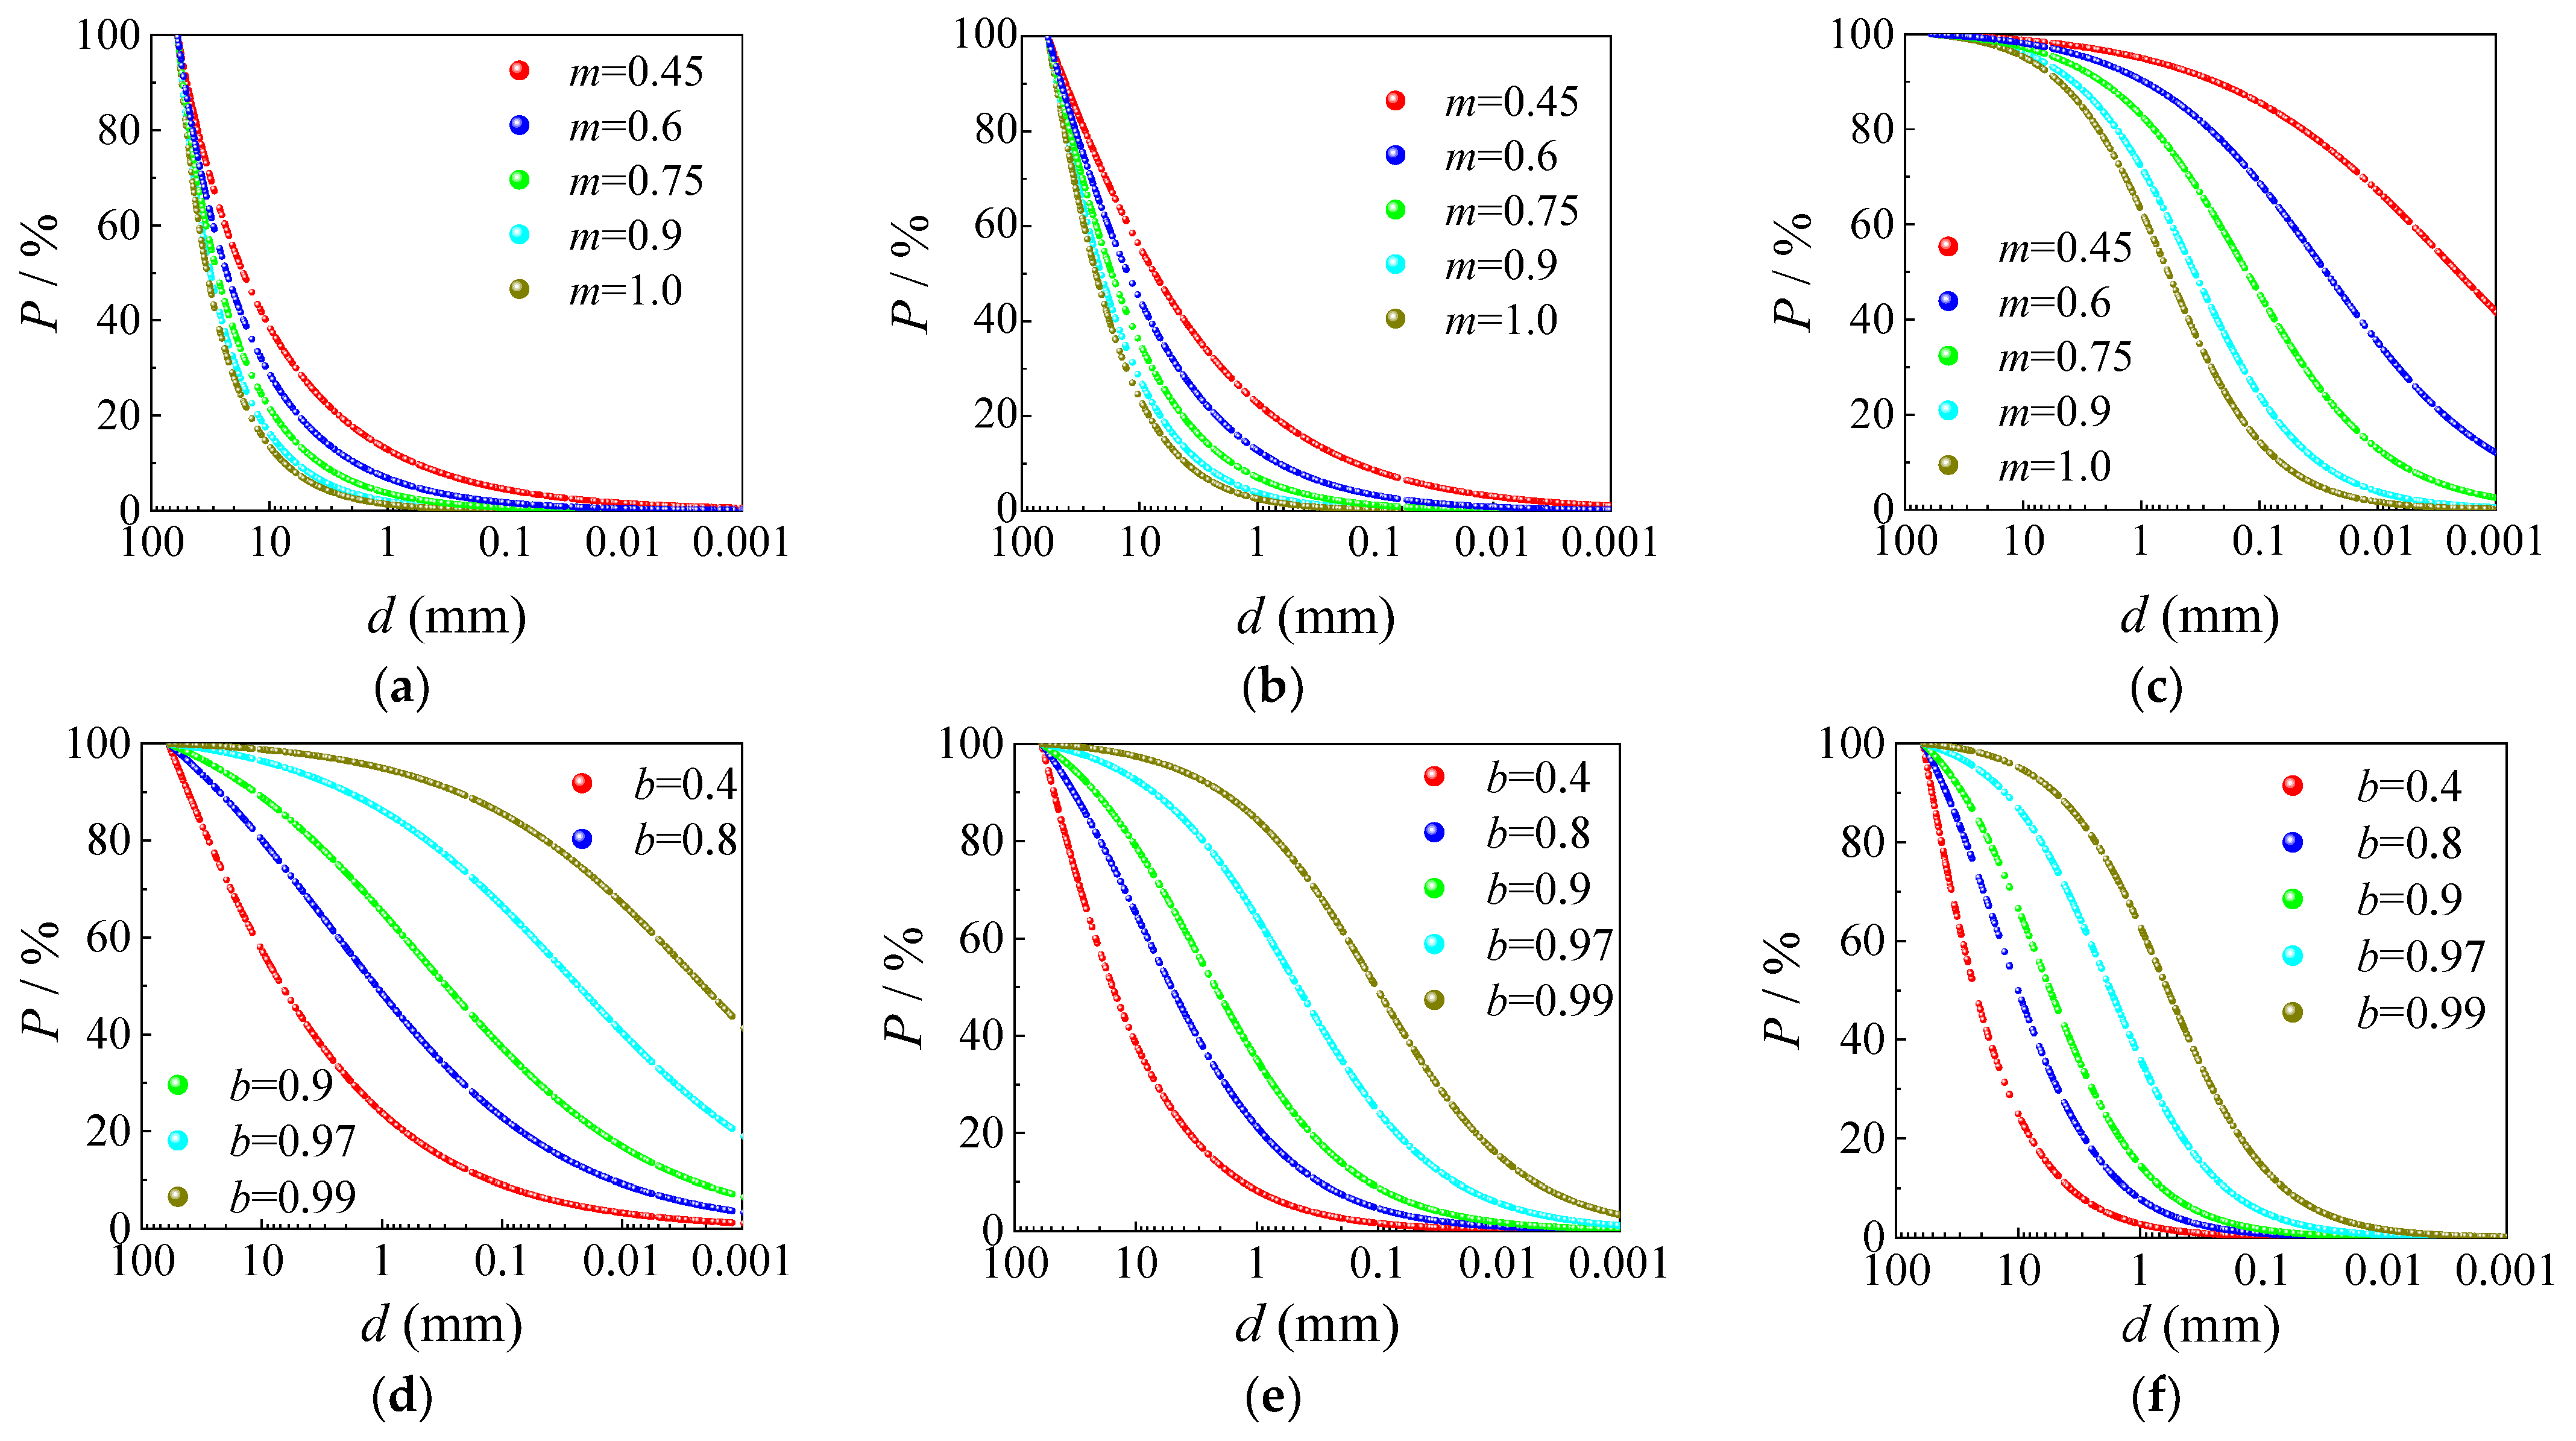
  • Based on the gray relational analysis algorithm, the key features influencing the fov were determined to be the maximum particle diameter dmax, gradation parameters b and m, flat and elongated particles in coarse aggregate Qe, and the Los Angeles abrasion of coarse aggregate LAA.
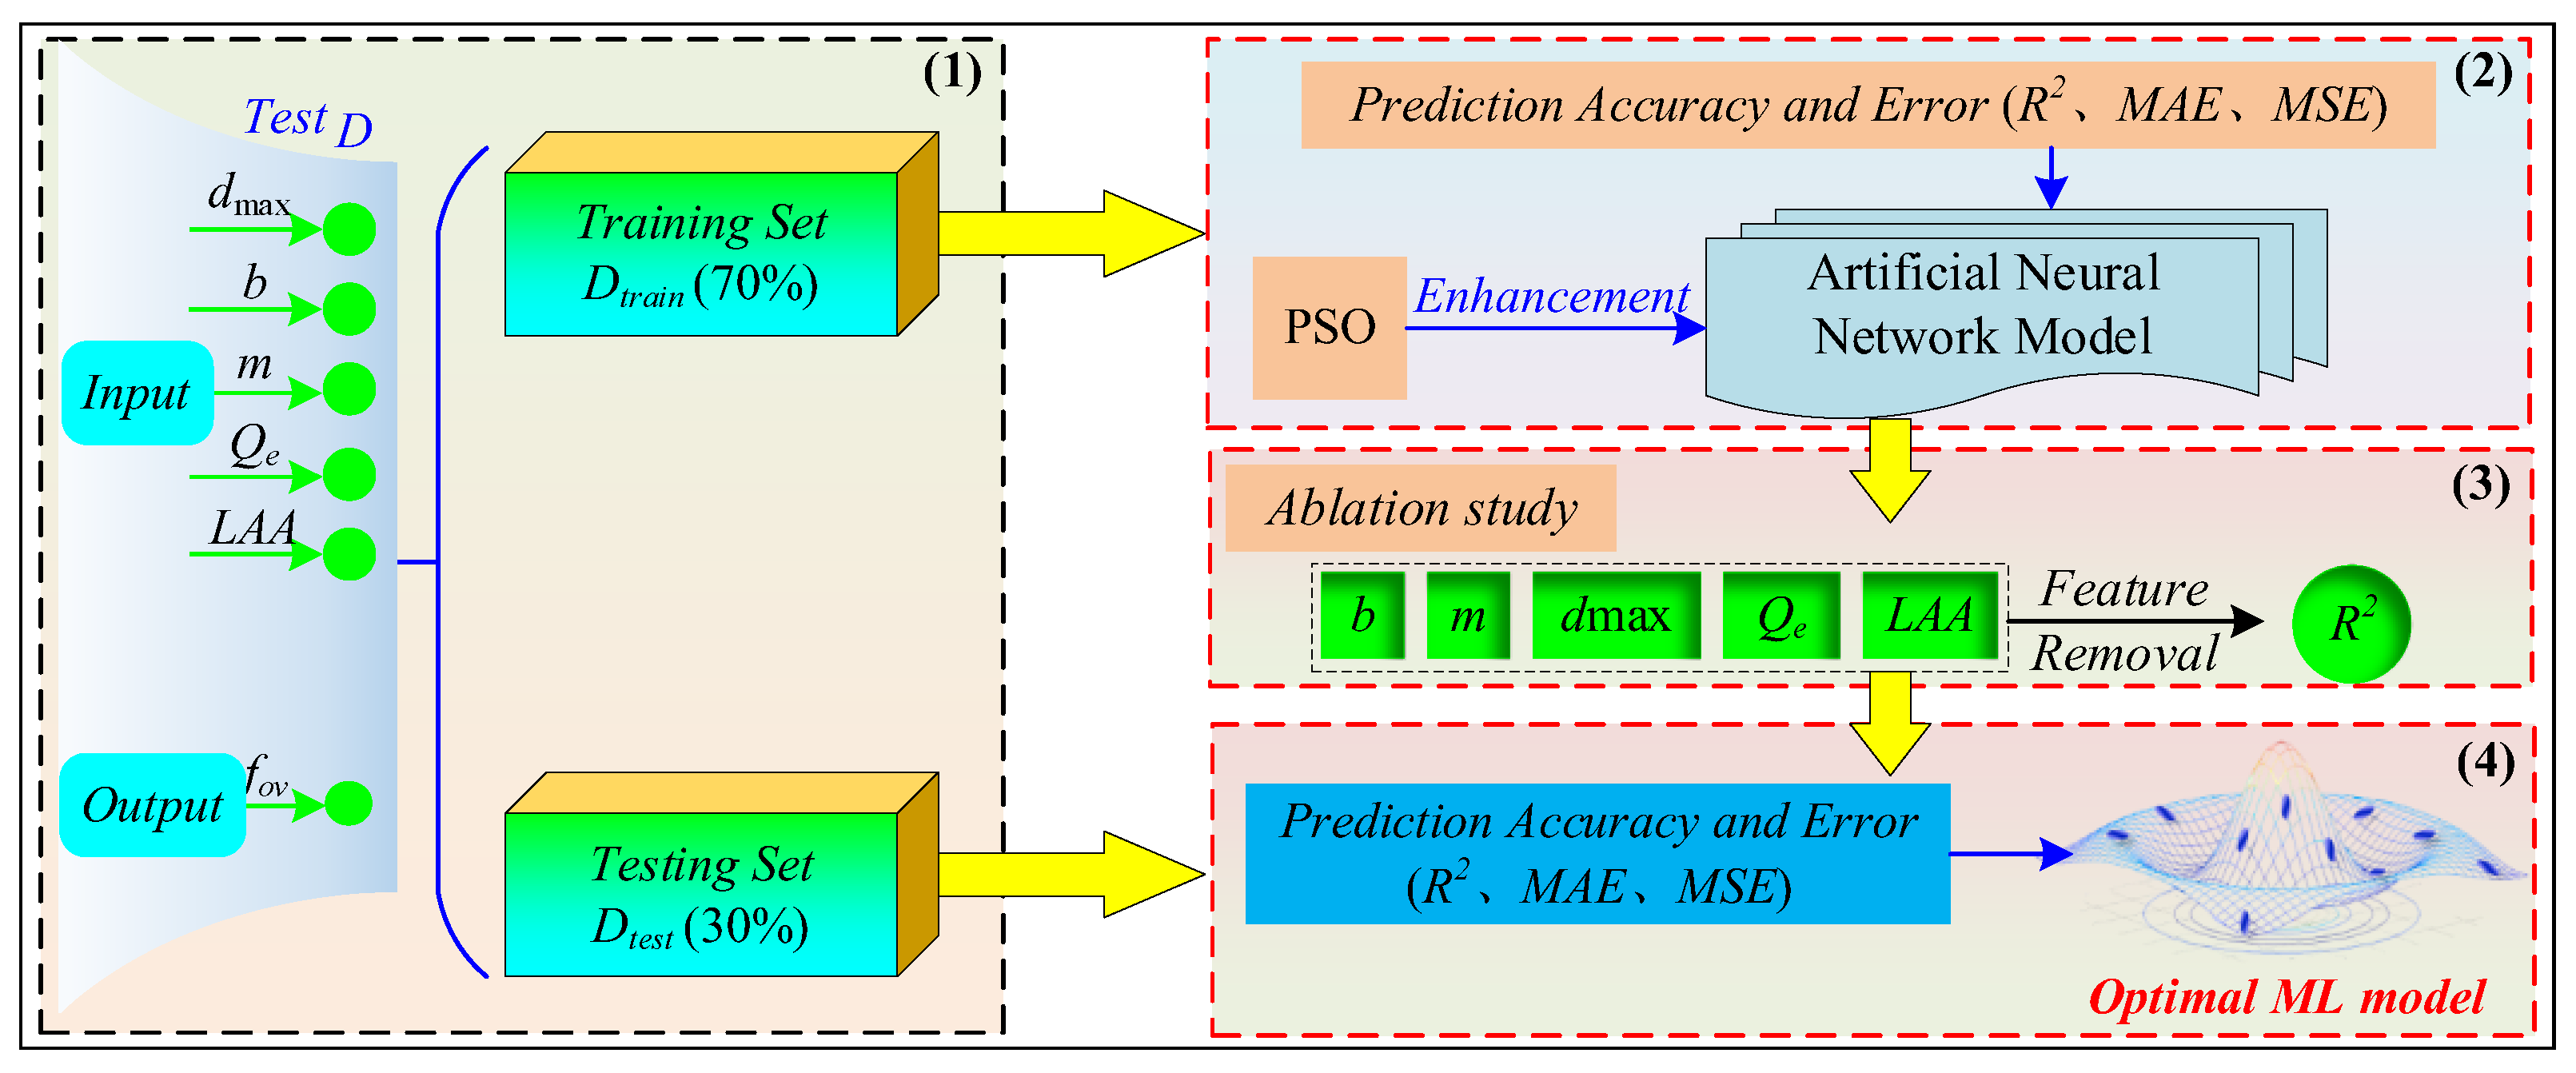
  • The key feature influencing the fov was used to establish the ANN-PM. Then, based on the ablation study, it was indicated that the impact hierarchy of the five key features on the ANN-PM predictive performance was dmax > b > m > Qe > LAA.
  • On the training and testing sets, the goodness-of-fit R2 of ANN-PM all exceeded 0.95, and the prediction errors were small, which indicated the strong prediction capability of ANN-PM for fov.
  • Based on the sensitivity analysis, the distribution of R2 for the ANN-PM closely approached 1, with its mean value exceeding 0.9. In addition, the MSE distribution for the ANN-PM approached zero. It was clear that the ANN-PM exhibited excellent robust performance.

Author Contributions

Conceptualization, X.X. and T.L.; methodology, X.X.; software, Z.H.; validation, X.L. and X.X.; formal analysis, X.X.; investigation, Z.H.; resources, T.L.; data curation, X.L.; writing—original draft preparation, X.X.; writing—review and editing, F.L. and J.L.; visualization, F.L. and J.L.; supervision, X.X.; project administration, Z.H.; funding acquisition, T.L. All authors have read and agreed to the published version of the manuscript.

Funding

This work was funded by the National Key R&D Program “Transportation Infrastructure” project, grant number 2022YFB2603400.

Institutional Review Board Statement

Not applicable.

Informed Consent Statement

Not applicable.

Data Availability Statement

Data are contained within the article.

Conflicts of Interest

Author Taifeng Li was employed by the China Academy of Railway Sciences Co., Ltd. The remaining authors declare that the research was conducted in the absence of any commercial or financial relationships that could be construed as a potential conflict of interest.

References

  1. Qu, L.; Yang, C.; Ding, X.; Kouroussis, G.; Yuan, C. Vertical vibration of piles with a square cross-section. Int. J. Numer. Anal. Met. 2021, 45, 2629–2653. [Google Scholar] [CrossRef]
  2. Wan, Z.; Bian, X.; Li, S.; Chen, Y.; Cui, Y. Remediation of mud pumping in ballastless high-speed railway using polyurethane chemical injection. Constr. Build. Mater. 2020, 259, 120401. [Google Scholar] [CrossRef]
  3. Lian, J.; Ding, X.; Cai, D.; Yue, M. Intelligent adaptive control method for key parameters of vibration rolling during high-speed railway subgrade compaction. Transp. Geotech. 2023, 41, 101000. [Google Scholar] [CrossRef]
  4. Ye, Y.S.; Cai, D.G.; Zhang, Q.L.; Wei, S.W.; Yan, H.Y.; Geng, L. Review on vibration compaction theory and intelligent compaction technology of high-speed railway subgrade. China Railw. Sci. 2021, 42, 1–12. (In Chinese) [Google Scholar]
  5. Bian, X.; Li, W.; Qian, Y.; Tutumluer, E. Analysing the effect of principal stress rotation on railway track settlement by discrete element method. Géotechnique 2020, 70, 803–821. [Google Scholar] [CrossRef]
  6. Sadek, Y.; Rikioui, T.; Abdoun, T.; Dadi, A. Influence of Compaction Energy on Cement Stabilized Soil for Road Construction. Civil. Eng. 2022, 8, 580–594. [Google Scholar] [CrossRef]
  7. Xie, K.; Su, Q.; Chen, X.B.; Liu, B.; Wang, W.B.; Wang, X.; Deng, Z.X. Element model test on polyurethane crushed stone waterproof bonding layer of ballastless track. Rock Soil Mech. 2023, 44, 1–11. (In Chinese) [Google Scholar]
  8. Yang, C.W.; Zhang, L.; Su, K. Research on dynamic response of railway subgrade packing vibration compaction based on VMD-Hilbert transform. Chin. J. Rock Mech. Eng. 2022, 41 (Suppl. S1), 2991–3001. (In Chinese) [Google Scholar]
  9. Wang, M.; Yu, Q.D.; Xiao, Y.J.; Li, W.Q.; Hua, W.J.; Wang, X.M.; Chen, X.B. Experimental investigation of macro-and meso-scale compaction characteristics of unbound permeable base materials. Chin. J. Rock Mech. Eng. 2022, 41, 1701–1716. (In Chinese) [Google Scholar]
  10. Ji, X.; Lu, H.; Dai, C.; Ye, Y.; Cui, Z.; Xiong, Y. Characterization of Properties of Soil-Rock mixture prepared by the laboratory vibration compaction method. Sustainability 2021, 13, 11239. [Google Scholar] [CrossRef]
  11. Xie, K.; Li, T.-F.; Chen, X.-B.; Deng, Z.-X. A novel method for determining the particle breakage contribution of high-speed railway graded aggregate and its application in vibratory compaction. Case. Stud. Constr. Mat. 2023, 19, e02281. [Google Scholar] [CrossRef]
  12. Ye, Y.S.; Chen, X.B.; Hui, X.H.; Cai, D.G.; Yao, J.K.; Jin, L.X. Laboratory investigation on parameter optimization of vibrating compaction for high-speed railway’s group B. J. Railw. Sci. Eng. 2021, 18, 2497–2505. (In Chinese) [Google Scholar]
  13. Zhang, Q.; Liu, T.; Zhang, Z.; Huangfu, Z.; Li, Q.; An, Z. Compaction quality assessment of rockfill materials using roller-integrated acoustic wave detection technique. Automa. Constr. 2019, 97, 110–121. [Google Scholar] [CrossRef]
  14. Li, J.; Zhou, Z.L.; Li, Y. Test analysis of relationship between natural frequency and compaction degree for roadbed soil. Trans. Chin. Soc. Agric. Eng. 2012, 28, 71–76. (In Chinese) [Google Scholar]
  15. Xie, K.; Chen, X.B.; Yao, J.K.; Cai, D.G. Study on standardization method and application of vibration compaction test parameters of high-speed railway subgrade filler. Chin. J. Rock Mech. Eng. 2023, 42, 1799–1810. (In Chinese) [Google Scholar]
  16. Hu, W.; Polaczyk, P.; Jia, X.; Gong, H.; Huang, B. Visualization and quantification of lab vibratory compacting process for aggregate base materials using accelerometer. Transp. Geotech. 2020, 25, 100393. [Google Scholar] [CrossRef]
  17. Liu, J.; Yang, X. Learning to See the Vibration: A Neural Network for Vibration Frequency Prediction. Sensors 2018, 18, 2530. [Google Scholar] [CrossRef] [PubMed]
  18. Quan, T.V.; Quoc, D.V.; Si, H.L. Evaluating compressive strength of concrete made with recycled concrete aggregates using machine learning approach. Constr. Build. Mater. 2022, 323, 126578. [Google Scholar] [CrossRef]
  19. Isik, F.; Ozden, G. Estimating compaction parameters of fine- and coarse-grained soils by means of artificial neural networks. Environ. Earth. Sci. 2013, 69, 2287–2297. [Google Scholar] [CrossRef]
  20. Zaman, M.; Solanki, P.; Ebrahimi, A.; White, L. Neural network modeling of resilient modulus using routine subgrade soil properties. Int. J. Geomech. 2010, 10, 1–12. [Google Scholar] [CrossRef]
  21. Xie, K.; Chen, X.-B.; Li, T.-F.; Deng, Z.-X.; Yao, J.-K.; Tang, L.-B. A framework for determining the optimal moisture content of high-speed railway-graded aggregate materials based on the lab vibration compaction method. Constr. Build. Mater. 2023, 392, 131764. [Google Scholar] [CrossRef]
  22. Jayan, J.; Sankar, N. Prediction of compaction parameters of soils using artificial neural network. Asian J. Eng. Technol. 2015, 3, 2321–2462. [Google Scholar]
  23. Kolakoti, A.; Prasadarao, B.; Satyanarayana, K.; Setiyo, M.; Köten, H.; Raghu, M. Elemental, Thermal and physicochemical investigation of novel biodiesel from wodyetia bifurcata and its properties optimization using artificial neural network (ANN). Automot. Exp. 2022, 5, 2615–6636. [Google Scholar] [CrossRef]
  24. TB10001-2016; Code for Design of Railway Earth Structure. Ministry of the Railway: Beijing, China, 2016. (In Chinese)
  25. Xie, K.; Chen, X.B.; Yao, J.K.; Li, T.F.; Wang, Y.S.; Deng, Z.X.; Lv, X.L. Study on the Vibration Compaction Mechanism with High-Speed Railway Fillers Based on the Dynamic Evolution of Coarse Particles. Chin. J. Geotech. Eng. 1–10. Available online: http://kns.cnki.net/kcms/detail/32.1124.tu.20230818.1510.002.html (accessed on 21 August 2023). (In Chinese).
  26. Chen, X.L.; Wang, Y.H.; Wang, C.H. Modal analysis and experiment research on natural frequencies of transition section subgrade of high-speed railway. J. Cent. South Univ. (Sci. Technol.) 2012, 43, 322–327. (In Chinese) [Google Scholar]
  27. TB/T 2140-2008; Railway Ballast. China Railway Publishing House: Beijing, China, 2008.
  28. TB 10102-2023; Geotechnical Testing Procedures for Railway Engineering. China Railway Publishing House: Beijing, China, 2023.
  29. Fan, Y.B.; Liu, C.; Wang, J.B. Prediction algorithm for springback of frame-rib parts in rubber forming process by incorporating Sobol within improved grey relation analysis. J. Mater. Res. Technol. 2021, 13, 1955–1966. [Google Scholar] [CrossRef]
  30. Wu, E.-L.; Zhu, J.-G.; Chen, G.; Wang, L. Experimental study of effect of gradation on compaction properties of rockfill materials. Bull. Eng. Geol. Environ. 2020, 79, 2863–2869. [Google Scholar] [CrossRef]
  31. Armaghani, D.J.; Asteris, P.G. A comparative study of ANN and ANFIS models for the prediction of cement-based mortar materials compressive strength. Neural. Comput. Appl. 2021, 33, 4501–4532. Available online: https://link.springer.com/article/10.1007/s00521-020-05244-4 (accessed on 24 July 2020).
  32. Jalal, M.; Grasley, Z.; Gurganus, C.; Bullard, J.W. A new nonlinear formulation-based prediction approach using artificial neural network (ANN) model for rubberized cement composite. Eng. Comput. 2022, 38, 283–300. Available online: https://link.springer.com/article/10.1007/s00366-020-01054-3 (accessed on 15 May 2020).
  33. Escribano, Á.; Wang, D. Mixed random forest, cointegration, and forecasting gasoline prices. Int. J. Forecast. 2021, 37, 1442–1462. [Google Scholar] [CrossRef]
  34. Han, H.; Shi, B.; Zhang, L. Prediction of landslide sharp increase displacement by SVM with considering hysteresis of groundwater change. Eng. Geol. 2021, 280, 105876. [Google Scholar] [CrossRef]
  35. Latif, S.D. Developing a boosted decision tree regression prediction model as a sustainable tool for compressive strength of environmentally friendly concrete. Environ. Sci. Pollut. Res. 2021, 28, 65935–65944. Available online: https://link.springer.com/article/10.1007/s11356-021-15662-z (accessed on 22 July 2021).
  36. Ren, X.; Yang, B.; Luo, N.; Li, J.; Li, Y.; Xue, T.; Yang, A. The Prediction of Sinter Drums Strength Using Hybrid Machine Learning Algorithms. Comput. Intell. Neurosci. 2022, 2022, 4790736. [Google Scholar] [CrossRef] [PubMed]
  37. Fareeha, A.; Chen, W.X. Investigation of steam ejector parameters under three optimization algorithm using ANN. Appl. Therm. Eng. 2023, 225, 120205. [Google Scholar] [CrossRef]
  38. Hu, R.; Monebhurrun, V.; Himeno, R.; Yokota, H.; Costen, F. A General Framework for Building Surrogate Models for Uncertainty Quantification in Computational Electromagnetics. IEEE Trans. Antennas Propag. 2022, 70, 1402–1414. [Google Scholar] [CrossRef]
  39. Song, M.; Ge, Y.H.; Liu, J.S. Improved Dynamic Dual Adaptive PSO Algorithm Based on Theory of Co-evolution. Comput. Eng. Appl. 2020, 56, 54–62. (In Chinese) [Google Scholar]
  40. Deng, Z.-X.; Xie, K.; Su, Q.; Xu, L.-R.; Hao, Z.-R.; Xiao, X.-P. Three-level evaluation method of cumulative slope deformation hybrid machine learning models and interpretability analysis. Constr. Build. Mater. 2023, 408, 133821. [Google Scholar] [CrossRef]
  41. Ghannadi, P.; Kourehli, S.S.; Mirjalili, S. The Application of PSO in Structural Damage Detection: An Analysis of the Previously Released Publications (2005–2020). Frat. Ed Integrità Strutt. 2022, 16, 460–489. [Google Scholar] [CrossRef]
  42. Zeng, Z.; Zhu, Z.; Yao, W.; Wang, Z.; Wang, C.; Wei, Y.; Wei, Z.; Guan, X. Accurate prediction of concrete compressive strength based on explainable features using deep learning. Constr. Build. Mater. 2022, 329, 127082. [Google Scholar] [CrossRef]
  43. Cheng, Y.; Zhou, W.H.; Xu, T. Tunneling-induced settlement prediction using the hybrid feature selection method for feature optimization. Transp. Geotech. 2022, 36, 100808. [Google Scholar] [CrossRef]
  44. Zhang, P.; Wu, H.-N.; Chen, R.-P.; Chan, T.H. Hybrid meta-heuristic and machine learning algorithms for tunneling-induced settlement prediction: A comparative study. Tunn. Undergr. Space. Technol. 2020, 99, 103383. [Google Scholar] [CrossRef]
  45. Younas, J.; Malik, M.I.; Ahmed, S.; Shafait, F.; Lukowicz, P. Sense the pen: Classification of online handwritten sequences (text, mathematical expression, plot/graph). Expert. Syst. Appl. 2021, 15, 114588. [Google Scholar] [CrossRef]
  46. Zhang, Y.G.; Zhao, Y.P.; Shen, X.Y.; Zhang, J. A comprehensive wind speed prediction system based on Monte Carlo and artificial intelligence algorithms. Appl. Energ. 2022, 305, 117815. [Google Scholar] [CrossRef]
  47. Zhao, X.; Ge, C.; Ji, F.; Liu, Y. Monte Carlo Method and Quantile Regression for Uncertainty Analysis of Wind Power Forecasting Based on Chaos-LS-SVM. Int. J. Control Autom. 2021, 19, 3731–3740. [Google Scholar] [CrossRef]
  48. Zheng, W.H. A novel method for dry density forecasting of high-speed railway graded aggregate fillers based on the PSO-ANN model. Results Eng. 2023, 19, 101361. [Google Scholar] [CrossRef]
Figure 1. Experimental material: (a) crushed limestone aggregate, (b) three typical gradation curves.
Sensors 24 00689 g001
Figure 2. Experimental equipment: (a) intelligent compaction equipment, (b) experimental data collection, and (c) indoor flatbed loading equipment.
Sensors 24 00689 g002
Figure 3. The diagram of vibratory compaction experiments.
Sensors 24 00689 g003
Figure 4. The diagram of hammer impact experiments.
Sensors 24 00689 g004
Figure 5. Hammer impact modal analysis: (a) acceleration time-domain amplitude, (b) acceleration amplitude-frequency spectrum.
Sensors 24 00689 g005
Figure 6. Relationship between K, gradation, and f0: (a) relationship between K and f0, (b) relationship between gradation and f0 when K = 0.96.
Sensors 24 00689 g006
Figure 7. Evolution of Krd, K20, and ρd of graded gravel (G1) under different vibratory frequencies: (a) Krd time history curve, (b) K20 time history curve, (c) ρd time history curve.
Sensors 24 00689 g007
Figure 8. Relationship between vibratory frequency and maximum Krd, K20, and ρdmax: (a) relationship between vibratory frequency and maximum Krd, (b) relationship between vibratory frequency and K20, and (c) relationship between vibratory frequency and ρdmax.
Sensors 24 00689 g008
Figure 9. Performance feature experiments of fillers.
Sensors 24 00689 g009
Figure 10. Based on the GRA algorithm analysis of fov key characteristics: (a) flowchart of GRA algorithm, (b) characterization analysis results.
Sensors 24 00689 g010
Figure 11. Relationship between gradation characteristic parameters and curve shape: (a) b = −0.28, (b) b = 0.36, (c) b = 1.0, (d) m = 0.45, (e) m = 0.725, and (f) m = 1.0.
Sensors 24 00689 g011
Figure 12. Relationship between the key features and fov: (a) dmax, (b) b, (c) m, (d) Qe, and (e) LAA.
Sensors 24 00689 g012
Figure 13. Architecture of artificial neural network.
Sensors 24 00689 g013
Figure 14. Schematic of ANN-based fov prediction model.
Sensors 24 00689 g014
Figure 15. Schematic of the Monte Carlo method.
Sensors 24 00689 g015
Figure 16. MAE values versus some iterations using hybrid models.
Sensors 24 00689 g016
Figure 17. Predictive performance of ANN-PM in the training dataset: (a) R2, (b) R2, MSE, and MAE.
Sensors 24 00689 g017
Figure 18. The results of the ablation study: (a) R2, (b) MSE and MAE.
Sensors 24 00689 g018
Figure 19. Predictive performance of ANN-PM in the test dataset: (a) R2, (b) R2, MSE, and MAE.
Sensors 24 00689 g019
Figure 20. Results of the Monte Carlo method: (a) R2, (b) MSE.
Sensors 24 00689 g020
Table 1. The parameters of vibratory compaction experiments.
Gradationf (Hz)ω (%)mp (kg)re (mm)me (kg)Dc (mm)h0 (mm)
G1403.660018.04.7200155
G2344.060025.14.7200155
G3265.460044.44.7200155
Table 2. The correlation between different performance features of HRGG fillers and fov.
Performance featureCuCcdmaxd ≤ 0.5d = 0.5~1.7d ≥ 1.7LAAQeWacWafLLPL
Correlation coefficient R0.580.50.750.730.680.710.640.660.560.550.10.22
Table 3. Optimum hyperparameters of ANN models.
HyperparametersαNeurons1Neurons2EpochBatch Size
ANN0.00110010020016
Disclaimer/Publisher’s Note: The statements, opinions and data contained in all publications are solely those of the individual author(s) and contributor(s) and not of MDPI and/or the editor(s). MDPI and/or the editor(s) disclaim responsibility for any injury to people or property resulting from any ideas, methods, instructions or products referred to in the content.

