
Reliability and Validity of Shore Hardness in Plantar Soft Tissue Biomechanics


Abstract
1. Introduction
2. Materials and Methods
2.1. Participants
2.2. Biomechanical Measurements
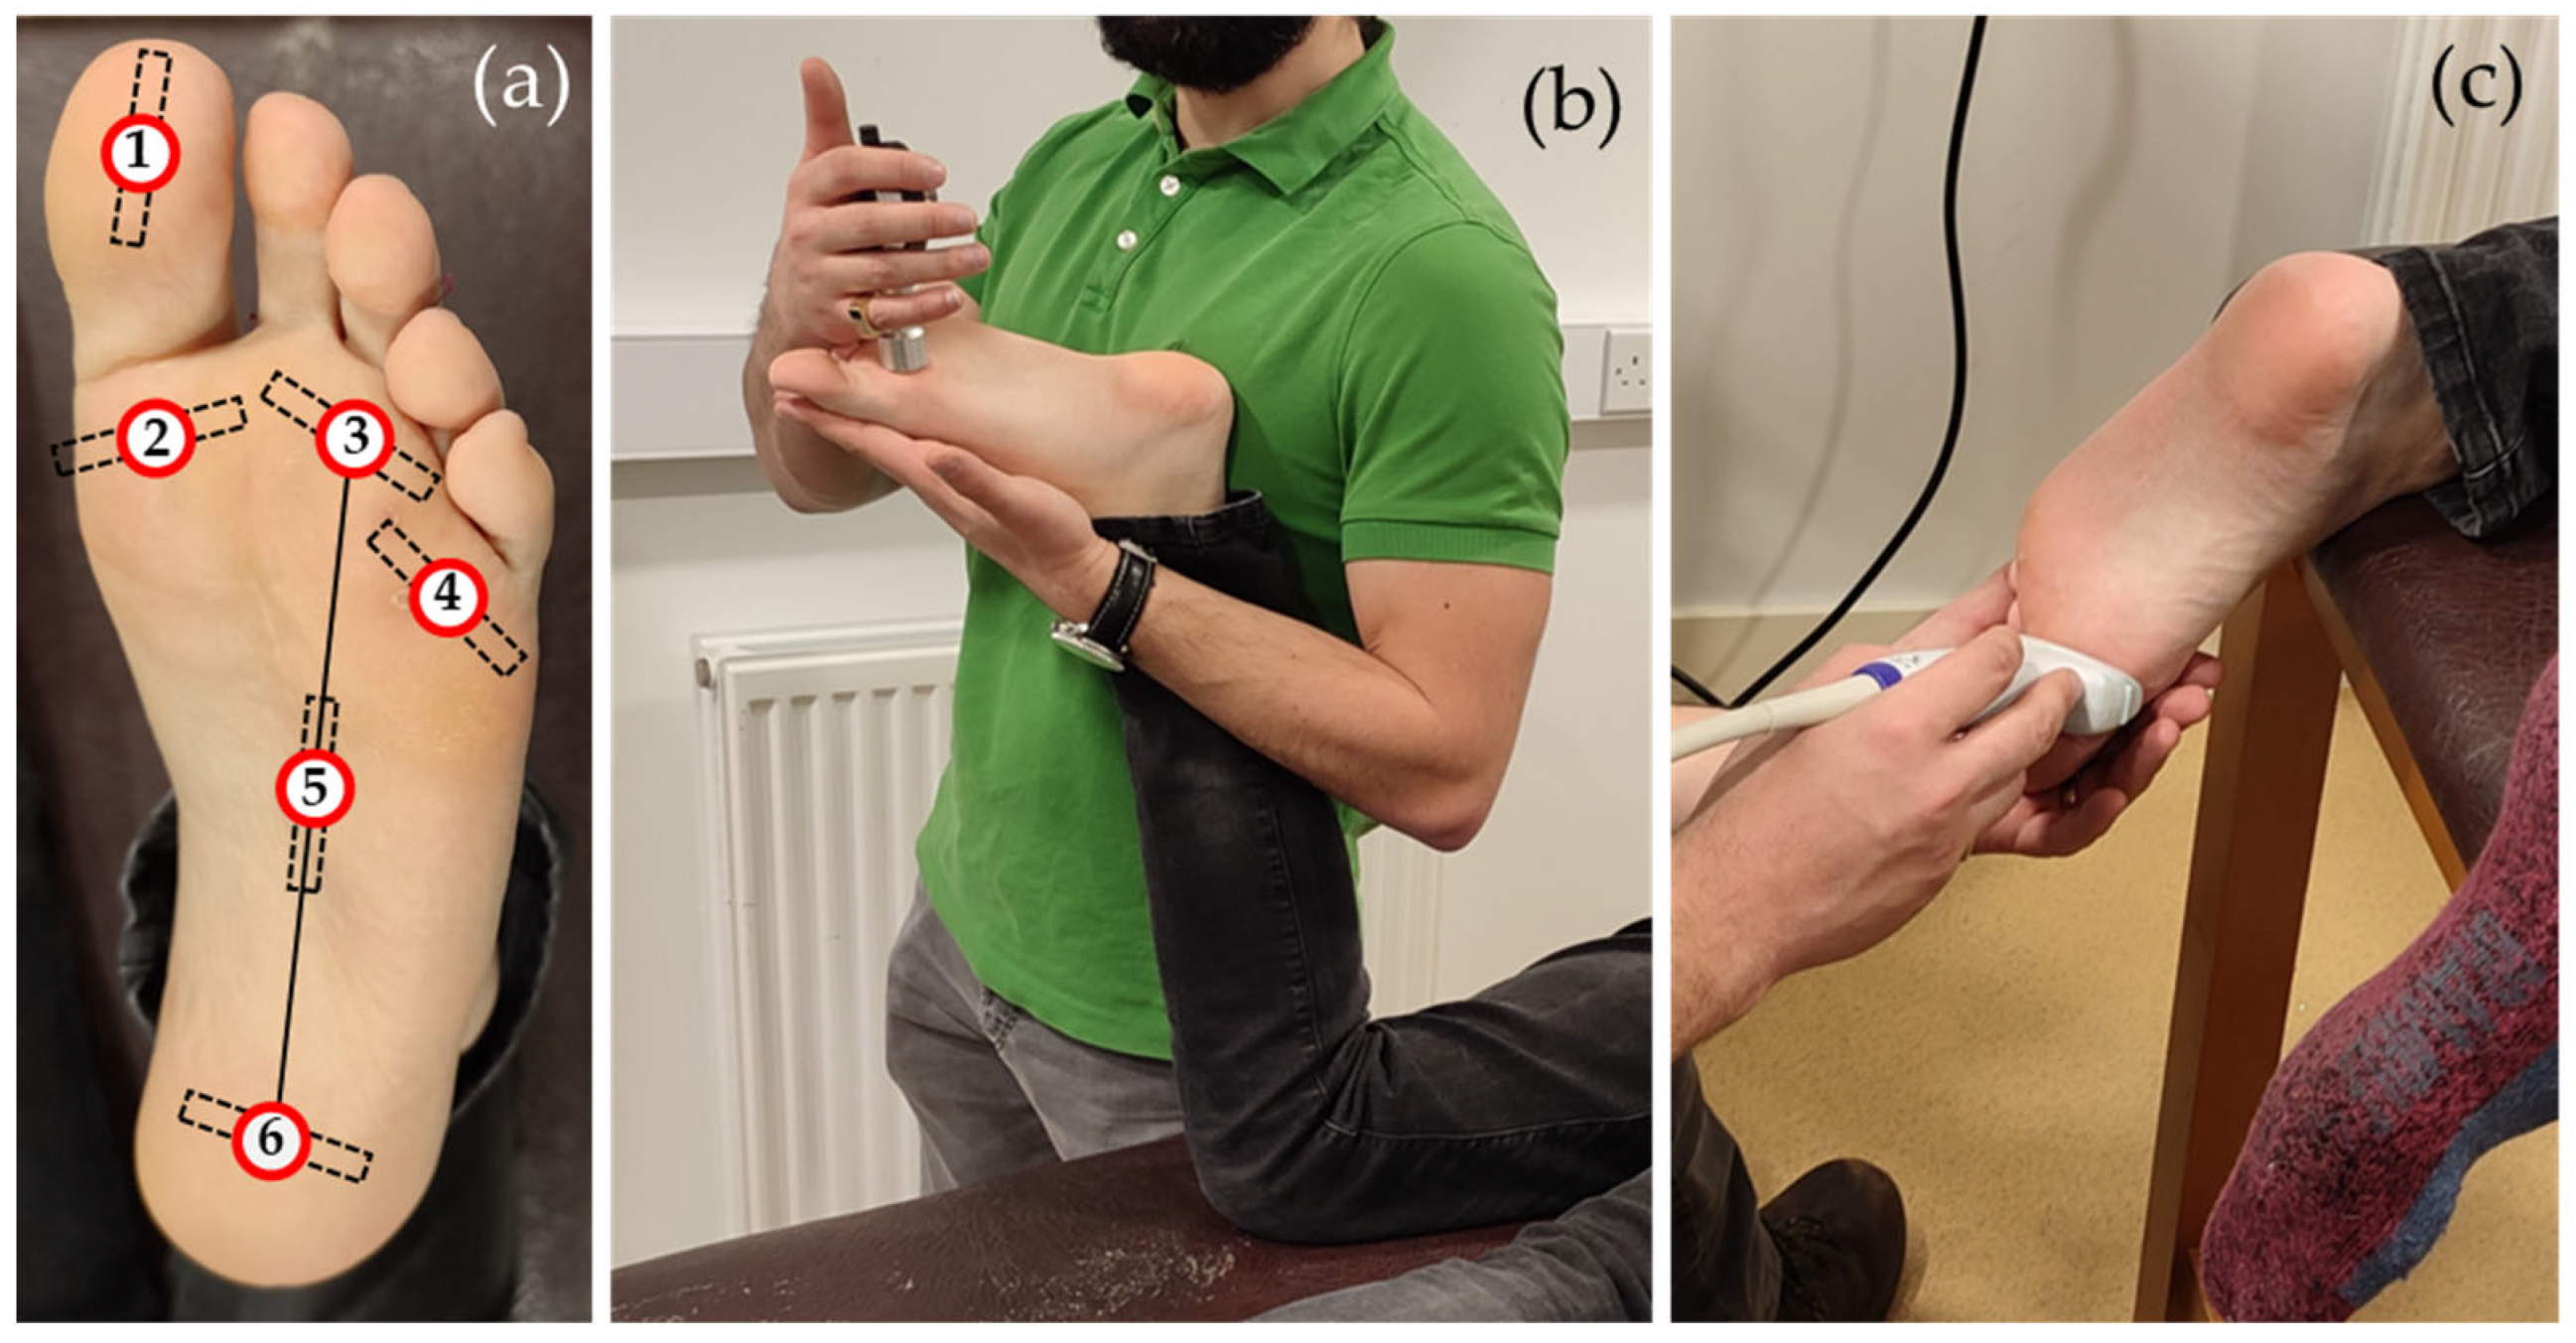
2.2.1. Shore Hardness
2.2.2. SW Elastography
2.2.3. Statistical Analysis and Sample Size
3. Results
4. Discussion
5. Conclusions
Author Contributions
Funding
Institutional Review Board Statement
Informed Consent Statement
Data Availability Statement
Conflicts of Interest
Appendix A

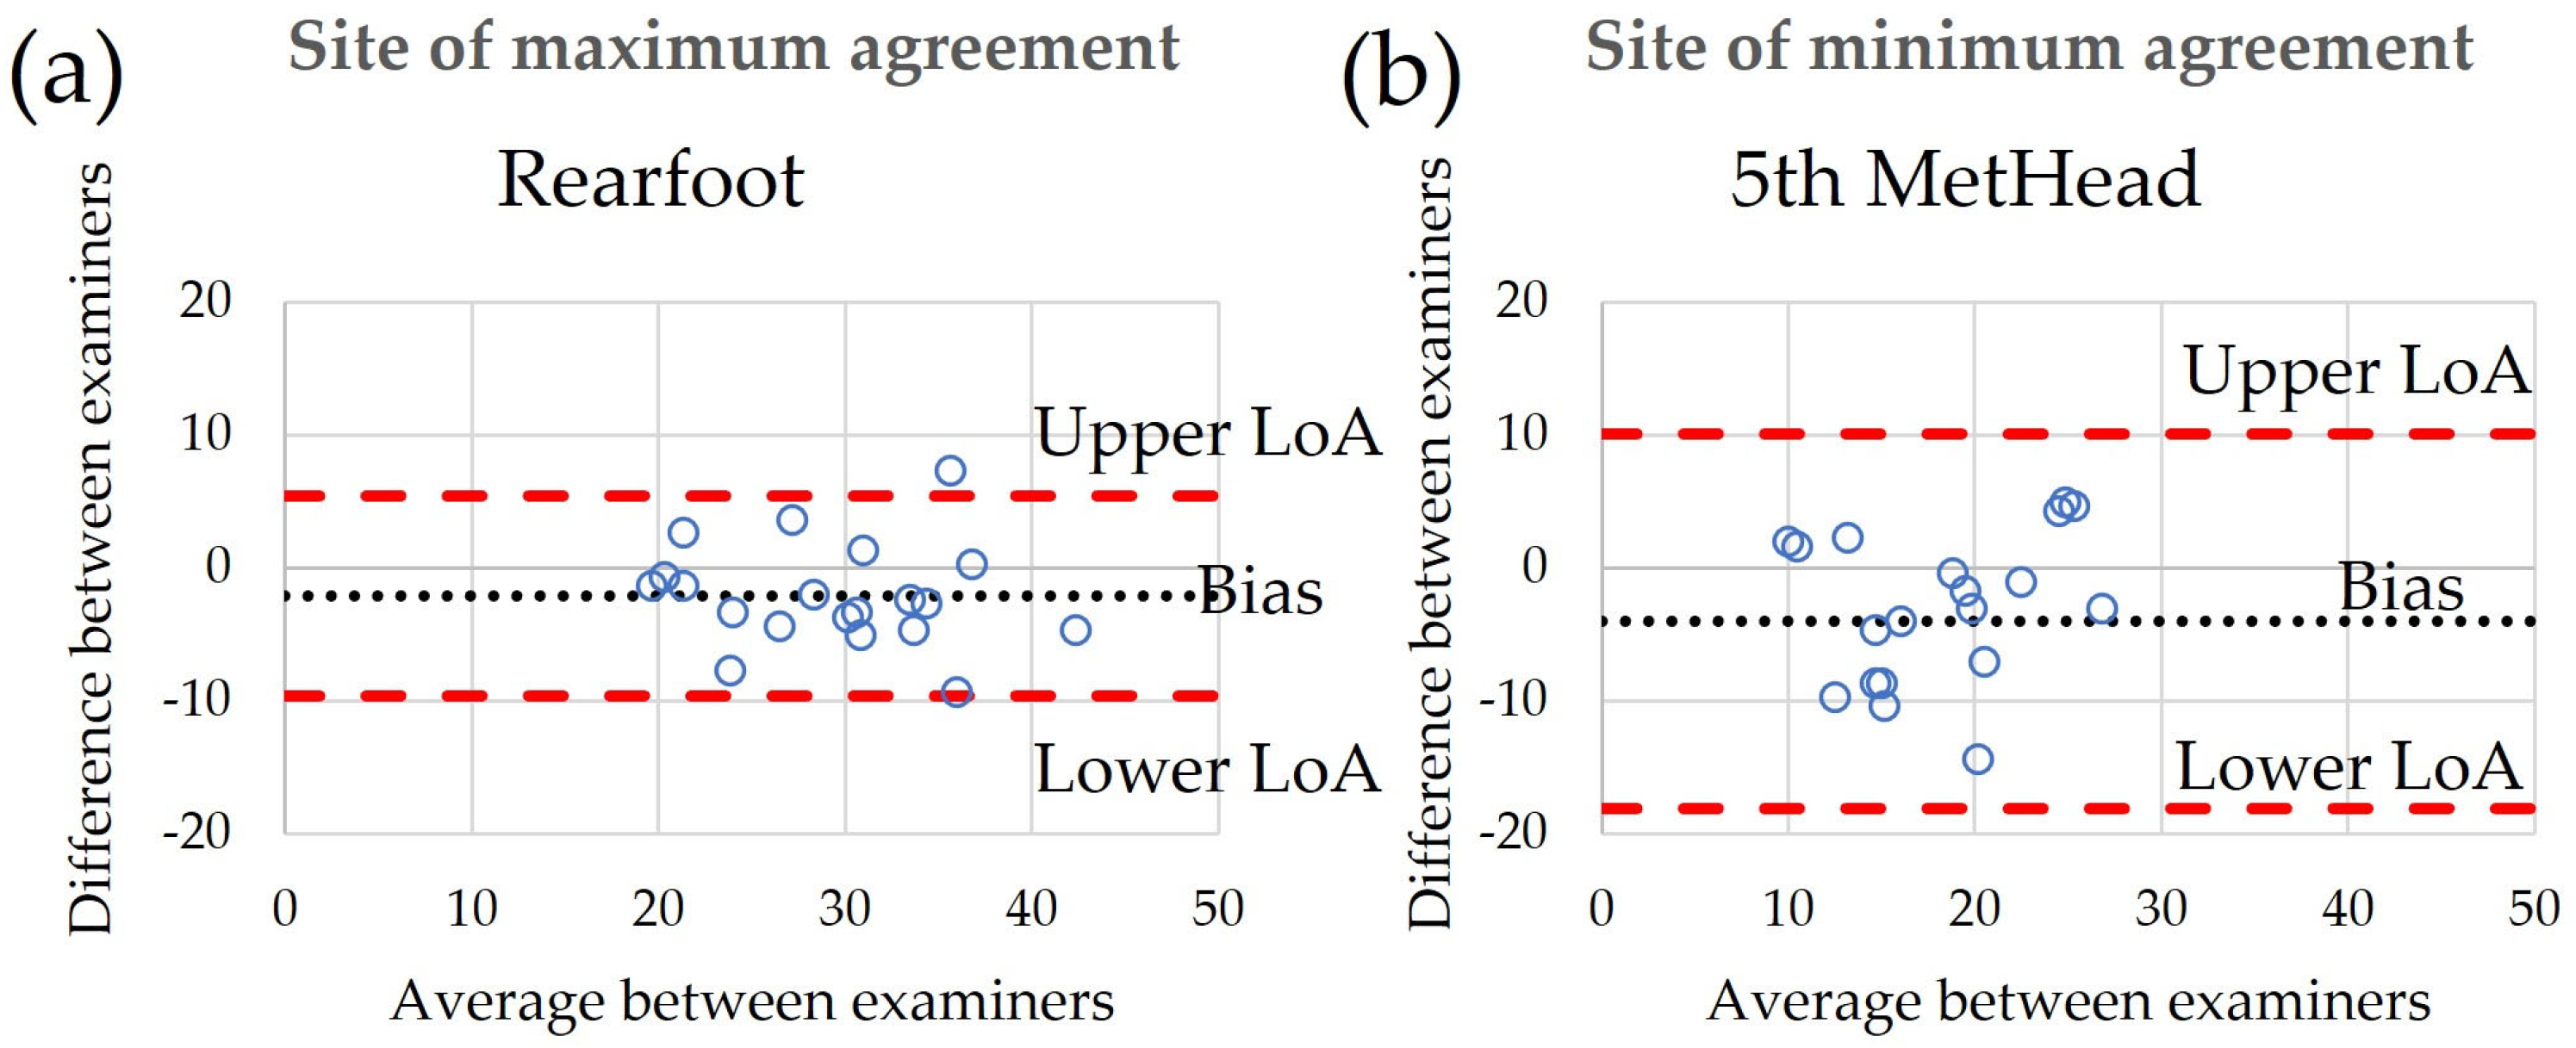
| Inter-Rater Agreement | Bias | Upper LoA | Lower LoA |
|---|---|---|---|
| Hallux | 4.2 | 16.5 | −8.1 |
| 1st MetHead | 1.4 | 11.5 | −8.8 |
| 3rd MetHead | −2.8 | 9.5 | −15.2 |
| 5th MetHead | −4.0 | 10.1 | −18.1 |
| Midfoot | −1.6 | 9.1 | −12.2 |
| Rearfoot | −2.1 | 5.5 | −9.6 |
| Intra-rater agreement: Examiner A | |||
| Hallux | −2.1 | 5.3 | −9.4 |
| 1st MetHead | −0.1 | 3.6 | −3.8 |
| 3rd MetHead | −0.5 | 8.6 | −9.5 |
| 5th MetHead | −0.1 | 8.9 | −9.1 |
| Midfoot | 0.5 | 14.8 | −13.8 |
| Rearfoot | −1.7 | 2.7 | −6.2 |
| Intra-rater agreement: Examiner B | |||
| Hallux | −3.0 | 8.8 | −14.7 |
| 1st MetHead | −2.0 | 6.6 | −10.7 |
| 3rd MetHead | 0.3 | 10.8 | −10.3 |
| 5th MetHead | 0.2 | 12.7 | −12.3 |
| Midfoot | −0.9 | 9.6 | −11.3 |
| Rearfoot | −1.0 | 6.4 | −8.3 |
References
- Naemi, R.; Chatzistergos, P.E.; Chockalingam, N. A Mathematical Method for Quantifying in Vivo Mechanical Behaviour of Heel Pad under Dynamic Load. Med. Biol. Eng. Comput. 2016, 54, 341–350. [Google Scholar] [CrossRef] [PubMed]
- Hsu, C.C.; Tsai, W.C.; Wang, C.L.; Pao, S.H.; Shau, Y.W.; Chuan, Y.S. Microchambers and Macrochambers in Heel Pads: Are They Functionally Different? J. Appl. Physiol. 2007, 102, 2227–2231. [Google Scholar] [CrossRef] [PubMed]
- Behforootan, S.; Chatzistergos, P.; Chockalingam, N.; Naemi, R. A Clinically Applicable Non-Invasive Method to Quantitatively Assess the Visco-Hyperelastic Properties of Human Heel Pad, Implications for Assessing the Risk of Mechanical Trauma. J. Mech. Behav. Biomed. Mater. 2017, 68, 287–295. [Google Scholar] [CrossRef] [PubMed]
- Naemi, R.; Chatzistergos, P.; Suresh, S.; Sundar, L.; Chockalingam, N.; Ramachandran, A. Can Plantar Soft Tissue Mechanics Enhance Prognosis of Diabetic Foot Ulcer? Diabetes Res. Clin. Pract. 2017, 126, 182–191. [Google Scholar] [CrossRef] [PubMed]
- Piaggesi, A.; Romanelli, M.; Schipani, E.; Campi, F.; Magliaro, A.; Baccetti, F.; Navalesi, R. Hardness of Plantar Skin in Diabetic Neuropathic Feet. J. Diabetes Complicat. 1999, 13, 129–134. [Google Scholar] [CrossRef] [PubMed]
- Chatzistergos, P.; Chockalingam, N. An In-Vivo Model For Overloading-Induced Soft Tissue Injury. Sci. Rep. 2022, 12, 6047. [Google Scholar] [CrossRef]
- Erdemir, A.; Viveiros, M.L.; Ulbrecht, J.S.; Cavanagh, P.R. An Inverse Finite-Element Model of Heel-Pad Indentation. J. Biomech. 2006, 39, 1279–1286. [Google Scholar] [CrossRef]
- Hsu, C.-C.; Tsai, W.-C.; Hsiao, T.-Y.; Tseng, F.-Y.; Shau, Y.-W.; Wang, C.-L.; Lin, S.-C.; Hsu, T.C.; Tsai, W.C.; Hsiao, T.Y.; et al. Diabetic Effects on Microchambers and Macrochambers Tissue Properties in Human Heel Pads. Clin. Biomech. 2009, 24, 682–686. [Google Scholar] [CrossRef]
- Diabetes UK. Us, Diabetes and a Lot of Facts and Stats; Diabetes UK: London, UK, 2019. [Google Scholar]
- Monteiro, R.L.; Drechsel, T.J.; Ferreira, J.S.S.P.; Zippenfennig, C.; Sacco, I.C.N. Potential Predictive Effect of Mechanical Properties of the Plantar Skin and Superficial Soft Tissue, and Vibration Perception on Plantar Loading during Gait in Individuals with Diabetes. BMC Musculoskelet. Disord. 2023, 24, 712. [Google Scholar] [CrossRef]
- Lung, C.-W.; Wu, F.-L.; Liao, F.; Pu, F.; Fan, Y.; Jan, Y.-K. Emerging Technologies for the Prevention and Management of Diabetic Foot Ulcers. J. Tissue Viability 2020, 29, 61–68. [Google Scholar] [CrossRef]
- Chatzistergos, P.; Behforootan, S.; Allan, D.; Naemi, R.; Chockalingam, N. Shear Wave Elastography Can Assess the In-Vivo Nonlinear Mechanical Behavior of Heel-Pad. J. Biomech. 2018, 28, 114–150. [Google Scholar] [CrossRef] [PubMed]
- Lin, C.Y.; Chen, P.Y.; Shau, Y.W.; Tai, H.C.; Wang, C.L. Spatial-Dependent Mechanical Properties of the Heel Pad by Shear Wave Elastography. J. Biomech. 2017, 53, 191–195. [Google Scholar] [CrossRef] [PubMed]
- Mifsud, T.; Chatzistergos, P.; Maganaris, C. Supersonic Shear Wave Elastography of Human Tendons Is Associated with in Vivo Tendon Stiffness over Small Strains Medial Gastrocnemius Musculotendinous Junction Soleus Tendon Junction Whole. J. Biomech. 2023, 152, 111558. [Google Scholar] [CrossRef] [PubMed]
- Jeong, W.K.; Lim, H.K.; Lee, H.-K.; Jo, J.M.; Kim, Y. Principles and Clinical Application of Ultrasound Elastography for Diffuse Liver Disease. Ultrasonography 2014, 33, 149–160. [Google Scholar] [CrossRef] [PubMed]
- Choi, Y.J.; Lee, J.H.; Baek, J.H. Ultrasound Elastography for Evaluation of Cervical Lymph Nodes. Ultrasonography 2015, 34, 157–164. [Google Scholar] [CrossRef] [PubMed]
- Goddi, A.; Bonardi, M.; Alessi, S. Breast Elastography: A Literature Review. J. Ultrasound 2012, 15, 192–198. [Google Scholar] [CrossRef]
- Latorre-Ossa, H.; Gennisson, J.L.; De Brosses, E.; Tanter, M. Quantitative Imaging of Nonlinear Shear Modulus by Combining Static Elastography and Shear Wave Elastography. IEEE Trans. Ultrason. Ferroelectr. Freq. Control 2012, 59, 833–839. [Google Scholar] [CrossRef]
- Aristizabal, S.; Amador, C.; Nenadic, I.Z.; Greenleaf, J.F.; Urban, M.W. Application of Acoustoelasticity to Evaluate Nonlinear Modulus in Ex Vivo Kidneys. IEEE Trans. Ultrason. Ferroelectr. Freq. Control 2017, 65, 188–200. [Google Scholar] [CrossRef]
- Eby, S.; Song, P.; Chen, S.; Chen, Q.; Greenleaf, J.; An, K.-N. Validation of Shear Wave Elastography in Skeletal Muscle. J. Biomech. 2013, 46, 2381–2387. [Google Scholar] [CrossRef]
- Chatelin, S.; Bernal, M.; Deffieux, T.; Papadacci, C.; Flaud, P.; Nahas, A.; Boccara, C.; Gennisson, J.-L.; Tanter, M.; Pernot, M. Anisotropic Polyvinyl Alcohol Hydrogel Phantom for Shear Wave Elastography in Fibrous Biological Soft Tissue: A Multimodality Characterization. Phys. Med. Biol. 2014, 59, 6923–6940. [Google Scholar] [CrossRef]
- Dong, B.; Duan, Y.; Wang, H.; Chen, Y.; Lyu, G. Performance of Two-Dimensional Shear Wave Elastography for Detecting Advanced Liver Fibrosis and Cirrhosis in Patients with Biliary Atresia: A Systematic Review and Meta-Analysis. Pediatr. Radiol. 2023, 53, 2642–2650. [Google Scholar] [CrossRef] [PubMed]
- Yang, Y.; Zhao, X.; Zhao, X.; Shi, J.; Huang, Y. Value of Shear Wave Elastography for Diagnosis of Primary Prostate Cancer: A Systematic Review and Meta-Analysis. Med. Ultrason. 2019, 21, 382–388. [Google Scholar] [CrossRef] [PubMed]
- Park, S.Y.; Kang, B.J. Combination of Shear-Wave Elastography with Ultrasonography for Detection of Breast Cancer and Reduction of Unnecessary Biopsies: A Systematic Review and Meta-Analysis. Ultrasonography 2021, 40, 318–332. [Google Scholar] [CrossRef] [PubMed]
- Wu, C.H.; Lin, C.Y.; Hsiao, M.Y.; Cheng, Y.H.; Chen, W.S.; Wang, T.G. Altered Stiffness of Microchamber and Macrochamber Layers in the Aged Heel Pad: Shear Wave Ultrasound Elastography Evaluation. J. Formos. Med. Assoc. 2017, 117, 4–9. [Google Scholar] [CrossRef]
- Lin, C.-Y.; Lin, C.-C.; Chou, Y.-C.; Chen, P.-Y.; Wang, C.-L. Heel Pad Stiffness in Plantar Heel Pain by Shear Wave Elastography. Ultrasound Med. Biol. 2015, 41, 2890–2898. [Google Scholar] [CrossRef]
- Lin, C.; Wu, C.; Özçakar, L. Restoration of Heel Pad Elasticity in Heel Pad Syndrome Evaluated by Shear Wave Elastography. Am. J. Phys. Med. Rehabil. 2017, 96, e96. [Google Scholar] [CrossRef]
- Mo, F.; Li, J.; Yang, Z.; Zhou, S.; Behr, M. In Vivo Measurement of Plantar Tissue Characteristics and Its Indication for Foot Modeling. Ann. Biomed. Eng. 2019, 47, 2356–2371. [Google Scholar] [CrossRef]
- Lin, C.-Y.; Chen, P.-Y.; Wu, S.-H.; Shau, Y.-W.; Wang, C.-L. Biomechanical Effects of Plastic Heel Cup on Plantar Fasciitis Patients Evaluated by Ultrasound Shear Wave Elastography. J. Clin. Med. 2022, 11, 2150. [Google Scholar] [CrossRef]
- Bus, S.A.; Lavery, L.A.; Monteiro-Soares, M.; Rasmussen, A.; Raspovic, A.; Sacco, I.C.N.; van Netten, J.J. Guidelines on the Prevention of Foot Ulcers in Persons with Diabetes (IWGDF 2023 Update). Diabetes. Metab. Res. Rev. 2023. online ahead of print. [Google Scholar] [CrossRef]
- Narayanamurthy, V.B.; Poddar, R.; Periyasamy, R. Biomechanical Properties of the Foot Sole in Diabetic Mellitus Patients: A Preliminary Study to Understand Ulcer Formation. Int. J. Biomed. Clin. Eng. 2014, 3, 1–17. [Google Scholar] [CrossRef]
- Thomas, V.J.; Patil, K.M.; Radhakrishnan, S.; Narayanamurthy, V.B.; Parivalavan, R. The Role of Skin Hardness, Thickness, and Sensory Loss on Standing Foot Power in the Development of Plantar Ulcers in Patients with Diabetes Mellitus—A Preliminary Study. Low. Extrem. Wounds 2003, 2, 132–139. [Google Scholar] [CrossRef] [PubMed]
- Charanya, G.; Patil, K.M.; Narayanamurthy, V.B.; Parivalavan, R.; Visvanathan, K. Effect of Foot Sole Hardness, Thickness and Footwear on Foot Pressure Distribution Parameters in Diabetic Neuropathy. Proc. Inst. Mech. Eng. Part. H J. Eng. Med. 2004, 218, 431–443. [Google Scholar] [CrossRef]
- Kissin, E.Y.; Schiller, A.M.; Gelbard, R.B.; Anderson, J.J.; Falanga, V.; Simms, R.W.; Korn, J.H.; Merkel, P.A. Durometry for the Assessment of Skin Disease in Systemic Sclerosis. Arthritis Rheum. Care Res. 2006, 55, 603–609. [Google Scholar] [CrossRef] [PubMed]
- Aghassi, D.; Monoson, T.; Braverman, I. Reproducible Measurements to Quantify Cutaneous Involvement in Scleroderma. Arch. Dermatol. 1995, 131, 1160–1166. [Google Scholar] [CrossRef]
- Holowka, N.B.; Wynands, B.; Drechsel, T.J.; Yegian, A.K.; Tobolsky, V.A.; Okutoyi, P.; Mang’eni Ojiambo, R.; Haile, D.W.; Sigei, T.K.; Zippenfennig, C.; et al. Foot Callus Thickness Does Not Trade off Protection for Tactile Sensitivity during Walking. Nature 2019, 571, 261–264. [Google Scholar] [CrossRef]
- Allan, D.; Chatzistergos, P.E.; Mahadevan, S.; Healy, A.; Sundar, L.; Ramachandran, A.; Kumar, S.; Punnoose, A.; Chockalingam, N.; Naemi, R. Increased Exposure to Loading Is Associated with Decreased Plantar Soft Tissue Hardness in People with Diabetes and Neuropathy. Diabetes Res. Clin. Pract. 2022, 187, 109865. [Google Scholar] [CrossRef]
- Chatzistergos, P.E.; Allan, D.; Chockalingam, N.; Naemi, R. Shore Hardness Is a More Representative Measurement of Bulk Tissue Biomechanics than of Skin Biomechanics. Med. Eng. Phys. 2022, 105, 103816. [Google Scholar] [CrossRef] [PubMed]
- Ahanchian, N.; Nester, C.J.; Howard, D.; Ren, L.; Parker, D. Estimating the Material Properties of Heel Pad Sub-Layers Using Inverse Finite Element Analysis. Med. Eng. Phys. 2017, 40, 11–19. [Google Scholar] [CrossRef]
- Bland, M.J.; Altman, D.G. Statistical methods for assessing agreement between two methods of clinical measurement. Lancet 1986, 8, 307–310. [Google Scholar] [CrossRef]
- Cicchetti, D.V. Guidelines, Criteria, and Rules of Thumb for Evaluating Normed and Standardized Assessment Instruments in Psychology. Psychol. Assess. 1994, 6, 284–290. [Google Scholar] [CrossRef]
- Walter, S.D.; Eliasziw, M.; Donner, A. Sample size and optimal designs for reliability studies. Stat. Med. 1998, 17, 101–110. [Google Scholar] [CrossRef]
- Overholser, B.R.; Sowinski, K.M. Biostatistics Primer: Part 2. Nutr. Clin. Pract. 2008, 23, 76–84. [Google Scholar] [CrossRef] [PubMed]


| SH | SW Speed (m/s) | Thickness (mm) | ||||
|---|---|---|---|---|---|---|
| Skin | Micro- Chamber | Macro- Chamber | Skin | Bulk Tissue | ||
| Hallux | 26 (13, 40) | 4.3 (2.8, 5.3) | 3.7 (2.5, 4.8) | 2.5 (1.7, 4.3) | 0.9 (0.6, 1.0) | 11.5 (9.0, 14.4) |
| 1st MetHead | 18 (4, 26) | 4.1 (2.8, 7.0) | 3.4 (2.5, 5.0) | 2.0 (1.5, 3.3) | 0.9 (0.7, 3.2) | 13 (11.2, 15.5) |
| 3rd MetHead | 15 (5, 28) | 4.3 (3.1, 6.4) | 3.7 (2.7, 5.1) | 1.9 (1.3, 3.0) | 1.1 (0.9, 3.6) | 12.6 (10.3, 14.5) |
| 5th MetHead | 16 (10, 28) | 4.6 (3.2, 5.8) | 3.7 (2.7, 5.2) | 2.3 (1.6, 4.2) | 1.0 (0.6, 1.3) | 12.3 (10.8, 13.9) |
| Midfoot | 16 (6, 27) | 3.2 (2.6, 4.6) | 3.0 (2.4, 4.5) | 2.3 (1.6, 3.6) | 0.8 (0.6, 1.2) | - |
| Rearfoot | 30 (20, 41) | 6.6 (3.7, 10.1) | 5.5 (3.6, 7.7) | 3.1 (1.6, 5.1) | 1.1 (0.8, 2.1) | - |
| r | p (2-Tailed) | N | ||
|---|---|---|---|---|
| 1st MetHead | Skin | 0.715 | <0.001 | 20 |
| Microchamber | 0.634 | 0.003 | 20 | |
| 3rd MetHead | Skin | 0.865 | <0.001 | 20 |
| Microchamber | 0.894 | <0.001 | 20 | |
| Rearfoot | Skin | 0.638 | 0.004 | 18 |
| Microchamber | 0.659 | 0.003 | 18 |
| Inter-Rater | ICC | 95% CI | ||
|---|---|---|---|---|
| Hallux | 0.592 | 0.158, 0.824 | ||
| 1st MetHead | 0.623 * | 0.271, 0.830 | ||
| 3rd MetHead | 0.636 * | 0.283, 0.838 | ||
| 5th MetHead | 0.295 | −0.090, 0.627 | ||
| Midfoot | 0.616 * | 0.262, 0.826 | ||
| Rearfoot | 0.797 ** | 0.515, 0.918 | ||
| Intra-rater | Examiner A | Examiner B | ||
| ICC | 95% CI | ICC | 95% CI | |
| Hallux | 0.862 ** | 0.638, 0.947 | 0.653 * | 0.299, 0.848 |
| 1st MetHead | 0.953 ** | 0.886, 0.981 | 0.762 ** | 0.477, 0.900 |
| 3rd MetHead | 0.852 ** | 0.664, 0.939 | 0.744 * | 0.455, 0.891 |
| 5th MetHead | 0.870 ** | 0.706, 0.946 | 0.620 * | 0.251, 0.831 |
| Midfoot | 0.655 * | 0.309, 0.848 | 0.729 * | 0.441, 0.882 |
| Rearfoot | 0.902 ** | 0.620, 0.967 | 0.838 ** | 0.641, 0.932 |
Disclaimer/Publisher’s Note: The statements, opinions and data contained in all publications are solely those of the individual author(s) and contributor(s) and not of MDPI and/or the editor(s). MDPI and/or the editor(s) disclaim responsibility for any injury to people or property resulting from any ideas, methods, instructions or products referred to in the content. |
© 2024 by the authors. Licensee MDPI, Basel, Switzerland. This article is an open access article distributed under the terms and conditions of the Creative Commons Attribution (CC BY) license (https://creativecommons.org/licenses/by/4.0/).
Share and Cite
Tonna, R.; Chatzistergos, P.E.; Wyatt, O.; Chockalingam, N. Reliability and Validity of Shore Hardness in Plantar Soft Tissue Biomechanics. Sensors 2024, 24, 539. https://doi.org/10.3390/s24020539
Tonna R, Chatzistergos PE, Wyatt O, Chockalingam N. Reliability and Validity of Shore Hardness in Plantar Soft Tissue Biomechanics. Sensors. 2024; 24(2):539. https://doi.org/10.3390/s24020539
Chicago/Turabian StyleTonna, Redent, Panagiotis E. Chatzistergos, Otis Wyatt, and Nachiappan Chockalingam. 2024. "Reliability and Validity of Shore Hardness in Plantar Soft Tissue Biomechanics" Sensors 24, no. 2: 539. https://doi.org/10.3390/s24020539
APA StyleTonna, R., Chatzistergos, P. E., Wyatt, O., & Chockalingam, N. (2024). Reliability and Validity of Shore Hardness in Plantar Soft Tissue Biomechanics. Sensors, 24(2), 539. https://doi.org/10.3390/s24020539