
Quantitation of the Surface Shortwave and Longwave Radiative Effect of Dust with an Integrated System: A Case Study at Xianghe


Abstract
1. Introduction
2. Data and Method
2.1. Site and Measurements
2.2. Event Selection
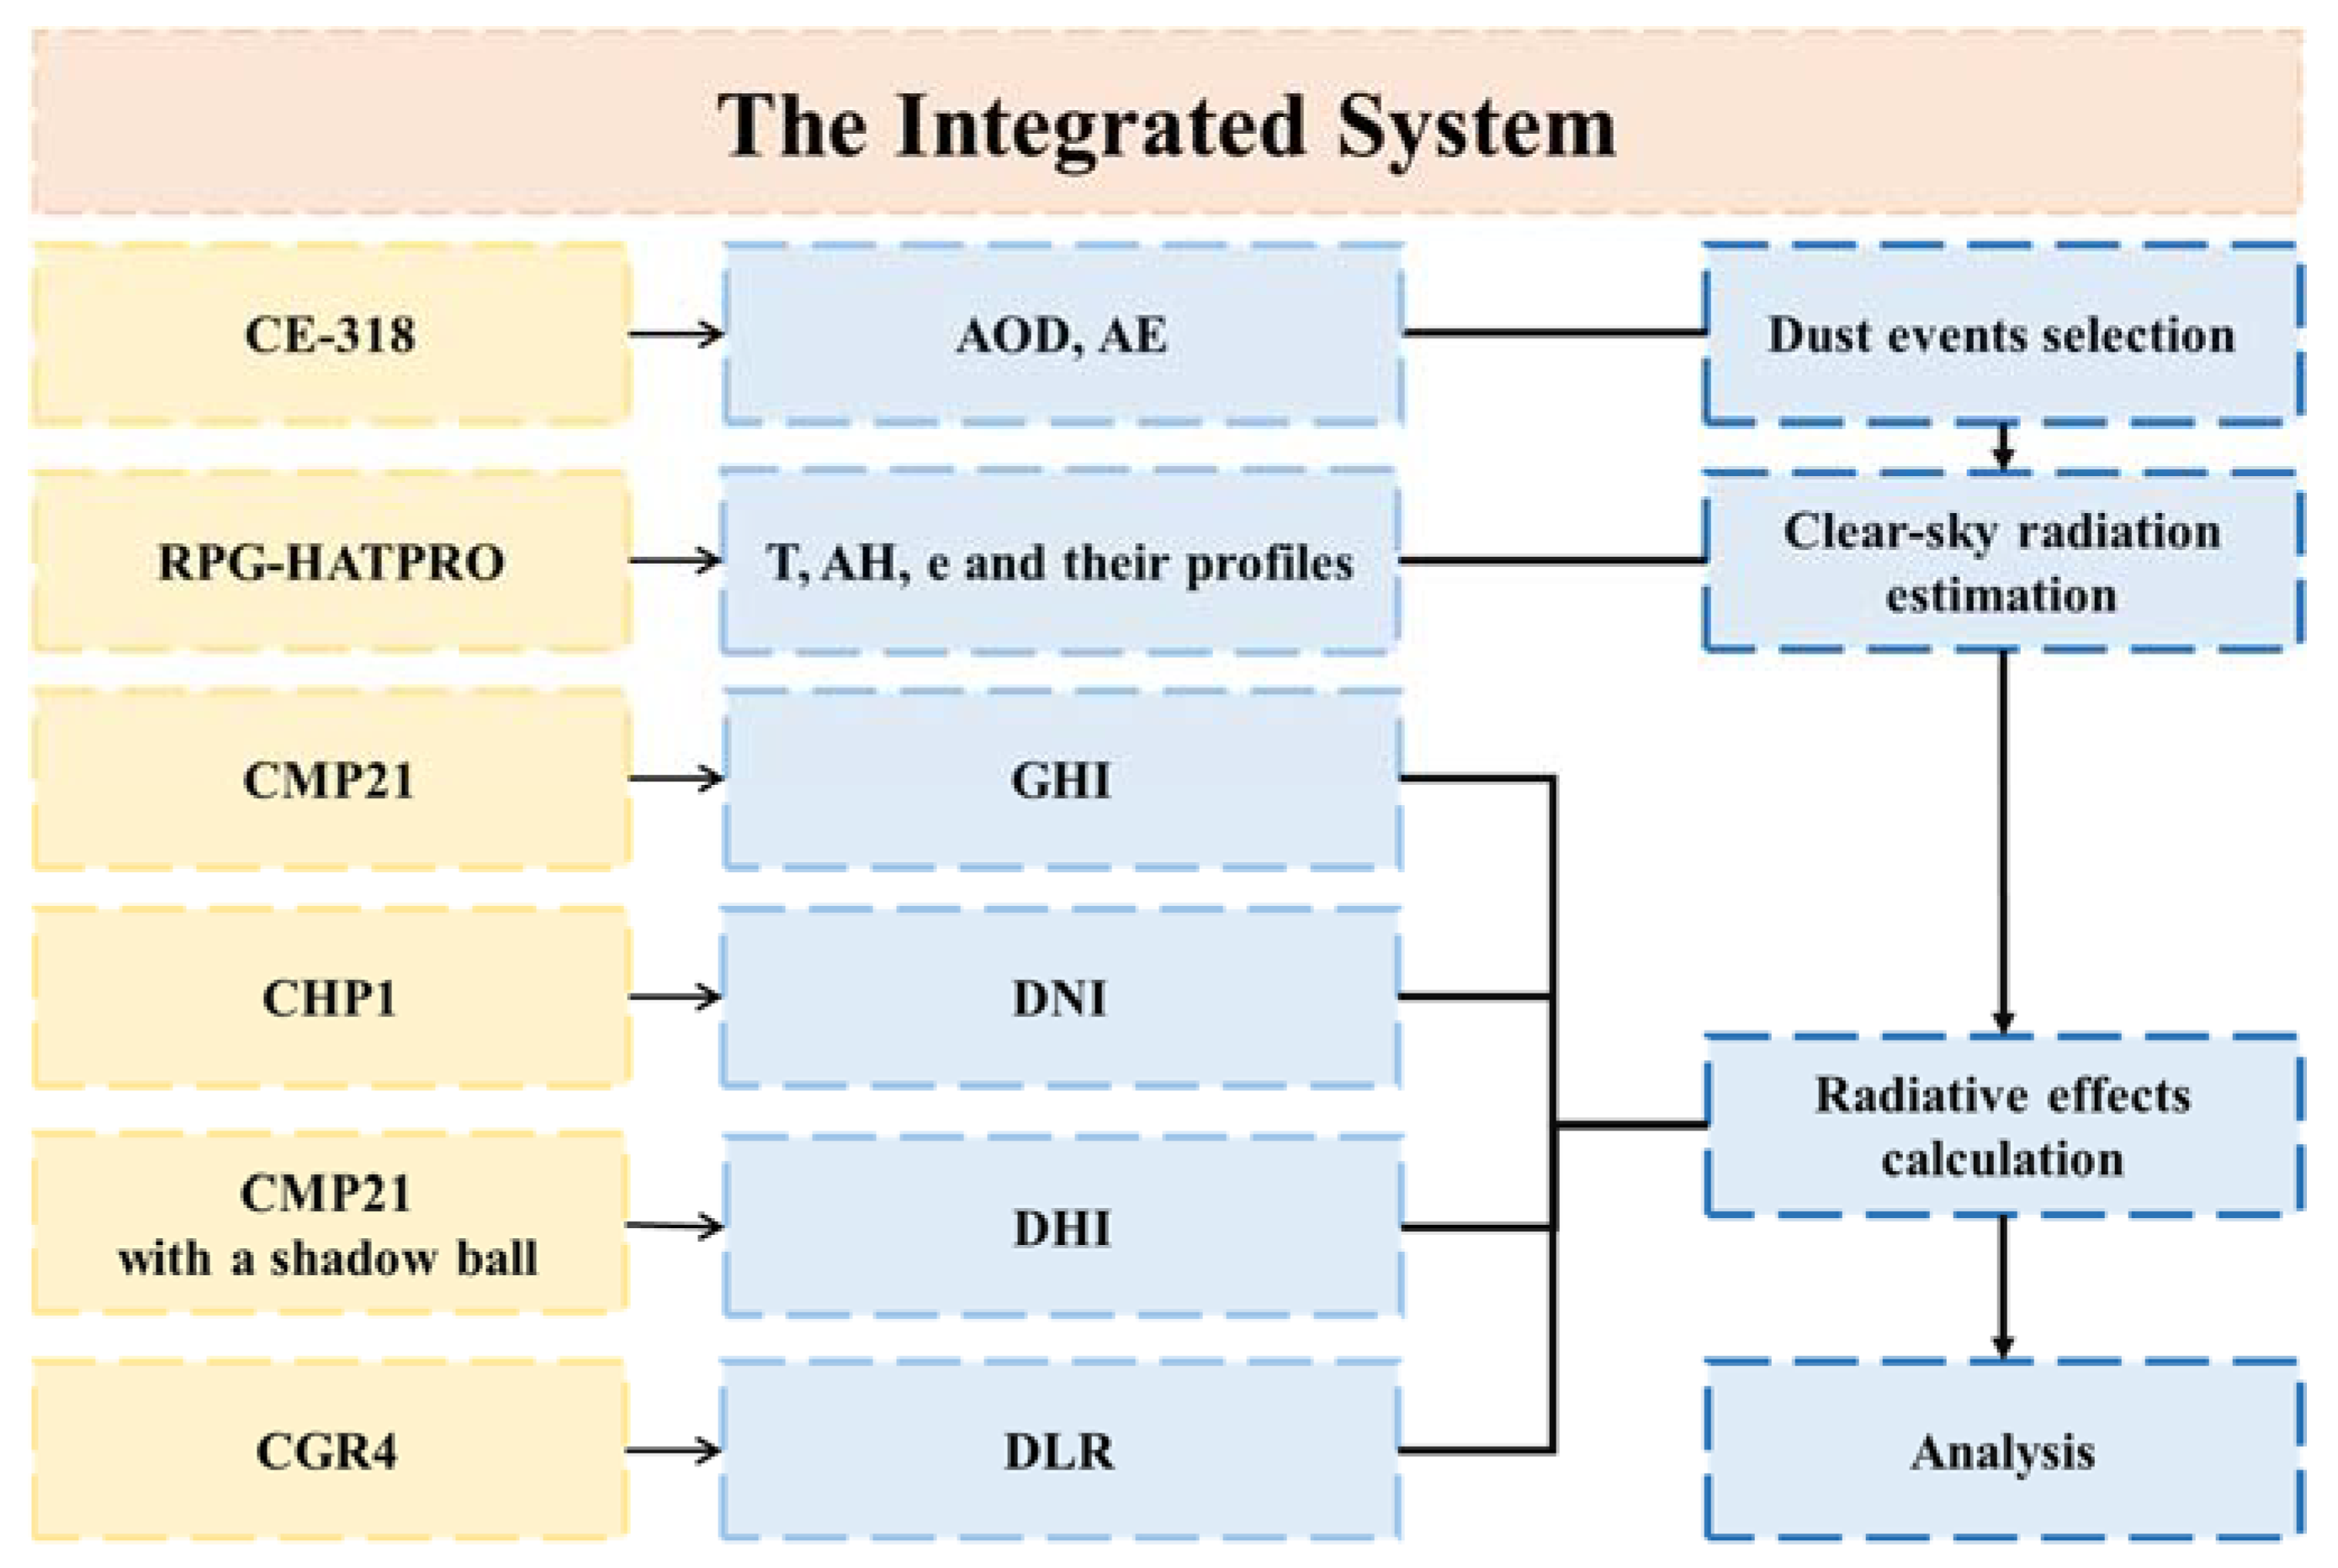
2.3. Methodology
3. Results
4. Conclusions
Author Contributions
Funding
Institutional Review Board Statement
Informed Consent Statement
Data Availability Statement
Conflicts of Interest
References
- Boucher, O.; Randall, D.; Artaxo, P.; Bretherton, C.; Feingold, G.; Forster, P.; Kerminen, V.-M.; Kondo, Y.; Liao, H.; Lohmann, U.; et al. Clouds and Aerosols. In Climate Change 2013—The Physical Science Basis; Cambridge University Press: Cambridge, UK, 2013; pp. 571–658. [Google Scholar]
- Roger, J.; Mallet, M.; Dubuisson, P.; Cachier, H.; Vermote, E.; Dubovik, O.; Despiau, S. synergetic approach for estimating the local direct aerosol forcing: Applications to an urban zone during the ESCOMPTE experiment. J. Geophys. Res. Atmos. 2006, 111, d13208. [Google Scholar] [CrossRef]
- Sicard, M.; Mallet, M.; García-Vizcaíno, D.; Comerón, A.; Rocadenbosch, F.; Dubuisson, P.; Muñoz-Porcar, C. Intense dust and extremely fresh biomass burning outbreak in Barcelona, Spain: Characterization of their optical properties and estimation of their direct radiative forcing. Environ. Res. Lett. 2012, 7, 034016. [Google Scholar] [CrossRef]
- Sicard, M.; Bertolín, S.; Mallet, M.; Dubuisson, P.; Comerón, A. Estimation of mineral dust long-wave radiative forcing: Sensitivity study to particle properties and application to real cases in the region of Barcelona. Atmos. Chem. Phys. 2014, 14, 9213–9231. [Google Scholar] [CrossRef]
- Meloni, D.; di Sarra, A.; Brogniez, G.; Denjean, C.; De Silvestri, L.; Di Iorio, T.; Sferlazzo, D.M. Determining the infrared radiative effects of Saharan dust: A radiative transfer modelling study based on vertically resolved measurements at Lampedusa. Atmos. Chem. Phys. 2018, 18, 4377–4401. [Google Scholar] [CrossRef]
- Georgoulias, A.; Alexandri, G.; Kourtidis, K.; Lelieveld, J.; Zanis, P.; Pöschl, U.; Levy, R.; Amiridis, V.; Marinou, E.; Tsikerdekis, A. Spatiotemporal variability and contribution of different aerosol types to the Aerosol Optical Depth over the Eastern Mediterranean. Atmos. Chem. Phys. 2016, 16, 13853–13884. [Google Scholar] [CrossRef] [PubMed]
- Xia, X.; Zong, X. Shortwave versus longwave direct radiative forcing by Taklimakan dust aerosols. Geophys. Res. Lett. 2009, 36, 1–5. [Google Scholar] [CrossRef]
- Di Sarra, A.; Di Biagio, C.; Meloni, D.; Monteleone, F.; Pace, G.; Pugnaghi, S.; Sferlazzo, D. Shortwave and longwave radiative effects of the intense Saharan dust event of 25-26 March 2010 at Lampedusa (Mediterranean Sea). J. Geophys. Res. Atmos. 2011, 116, 23209. [Google Scholar] [CrossRef]
- Gkikas, A.; Obiso, V.; García-Pando, C.P.; Jorba, O.; Hatzianastassiou, N.; Vendrell, L.; Basart, S.; Solomos, S.; Gassó, S.; Baldasano, J.M. Direct radiative effects of intense Mediterranean desert dust outbreaks. Atmos. Chem. Phys. Discuss. 2017, 18, 8757–8787. [Google Scholar] [CrossRef]
- Valenzuela, A.; Costa, M.; Guerrero-Rascado, J.; Bortoli, D.; Olmo, F. Solar and thermal radiative effects during the 2011 extreme desert dust episode over Portugal. Atmos. Environ. 2017, 148, 16–29. [Google Scholar] [CrossRef]
- Perrone, M.; Tafuro, A.; Kinne, S. Dust layer effects on the atmospheric radiative budget and heating rate profiles. Atmos. Environ. 2012, 59, 344–354. [Google Scholar] [CrossRef]
- Meloni, D.; Junkermann, W.; Di Sarra, A.; Cacciani, M.; De Silvestri, L.; Di Iorio, T.; Estellés, V.; Gómez-Amo, J.L.; Pace, G.; Sferlazzo, D.M. Altitude-resolved shortwave and longwave radiative effects of desert dust in the Mediterranean during the GAMARF campaign: Indications of a net daily cooling in the dust layer. J. Geophys. Res. Atmos. 2015, 120, 3386–3407. [Google Scholar] [CrossRef]
- Long, C.; Dutton, E. BSRN Global Network Recommended QC Tests, V2.0. 2002. Available online: https://bsrn.awi.de/ (accessed on 6 August 2023).
- Holben, B.; Eck, T.; Slutsker, I.; Tanré, D.; Buis, J.P.; Setzer, A.; Vermote, E.; Reagan, J.A.; Kaufman, Y.J.; Nakajima, T.; et al. AERONET—A federated instrument network and data archive for aerosol characterization. Remote Sens. Environ. 1998, 66, 1–16. [Google Scholar] [CrossRef]
- Li, Z.; Xia, X.; Cribb, M.; Mi, W.; Holben, B.; Wang, P.; Chen, H.; Tsay, S.-C.; Eck, T.F.; Zhao, F.; et al. Aerosol optical properties and their radiative effects in northern China. J. Geophys. Res. 2007, 112. [Google Scholar] [CrossRef]
- Berk, A.; Bernstein, L.; Robertson, D. MODTRAN: A Moderate Resolution Model for LOWTRAN; Air Force Geophysics Laboratory, Hansoon AFB: Bedford, MA, USA, 1987; p. 40. [Google Scholar]
- Ricchiazzi, P.; Yang, S.; Gautier, C.; Sowle, D. SBDART: A research and teaching software tool for plane-parallel radiative transfer in the Earth’s atmosphere. Bull. Am. Meteorol. Soc. 1998, 79, 2101–2114. [Google Scholar] [CrossRef]
- Badescu, V.; Gueymard, C.; Ceval, S.; Oprea, C.; Baciu, M.; Dumitrescu, A.; Iacobescu, F.; Milos, I.; Rada, C. Accuracy analysis for fifty-four clear-sky solar radiation models using routine hourly global irradiance measurements in Romania. Renew. Energy 2013, 55, 85–103. [Google Scholar] [CrossRef]
- Niemela, S.; Raisanen, P.; Savijarvi, H. Comparison of surface radiative flux parameterizations: Part I: Longwave radiation. Atmos. Res. 2001, 58, 1–18. [Google Scholar] [CrossRef]
- Niemela, S.; Raisanen, P.; Savijarvi, H. Comparison of surface radiative flux parameterizations: Part II: Shortwave radiation. Atmos. Res. 2001, 58, 141–154. [Google Scholar] [CrossRef]
- Gruber, S.; Purves, R. Uncertainties of parameterized surface downward clear-sky shortwave and all-sky longwave radiation. Atmos. Chem. Phys. 2012, 12, 5077–5098. [Google Scholar]
- Liu, M.; Zheng, X.; Zhang, J.; Xia, X. A revisiting of the parametrization of downward longwave radiation in summer over the Tibetan Plateau based on high-temporal-resolution measurements. Atmos. Chem. Phys. 2020, 20, 4415–4426. [Google Scholar] [CrossRef]
- Peng, L.; Li, W. Parameterizations of surface radiation in the semiarid grasslands of Inner Mongolia under clear-sky conditions using MODIS data. Adv. Atmos. Sci. 2014, 31, 1197–1208. [Google Scholar] [CrossRef]
- Konzelmann, T.; Vandewal, R.; Greuell, W.; Bintanja, R.; Henneken, E.A.; Abeouchi, A. Parameterization of global and longwave incoming radiation for the greenland ice-sheet. Glob. Planet. Chang. 1994, 9, 143–164. [Google Scholar] [CrossRef]
- Singh, S.; Beegum, S. Direct radiative effects of an unseasonal dust storm at a western Indo Gangetic Plain station Delhi in ultraviolet, shortwave, and longwave regions. Geophys. Res. Lett. 2013, 40, 2444–2449. [Google Scholar] [CrossRef]
- Shi, H.; Yang, D.; Wang, W.; Fu, D.; Gao, L.; Zhang, J.; Hu, B.; Shan, Y.; Zhang, Y.; Bian, Y.; et al. First estimation of high-resolution solar photovoltaic resource maps over China with Fengyun-4A satellite and machine learning. Renew. Sustain. Energy Rev. 2023, 184, 113549. [Google Scholar] [CrossRef]
- Huang, C.; Shi, H.; Yang, D.; Gao, L.; Zhang, P.; Fu, D.; Xia, X.; Chen, Q.; Yuan, Y.; Liu, M.; et al. Retrieval of sub-kilometer resolution solar irradiance from Fengyun-4A satellite using a region-adapted Heliosat-2 method. Sol. Energy 2023, 264, 112038. [Google Scholar] [CrossRef]
- Wang, W.; Yang, D.; Huang, N.; Lyu, C.; Zhang, G.; Han, X. Irradiance-to-power conversion based on physical model chain: An application on the optimal configuration of multi-energy microgrid in cold climate. Renew. Sustain. Energy Rev. 2022, 161, 112356. [Google Scholar] [CrossRef]


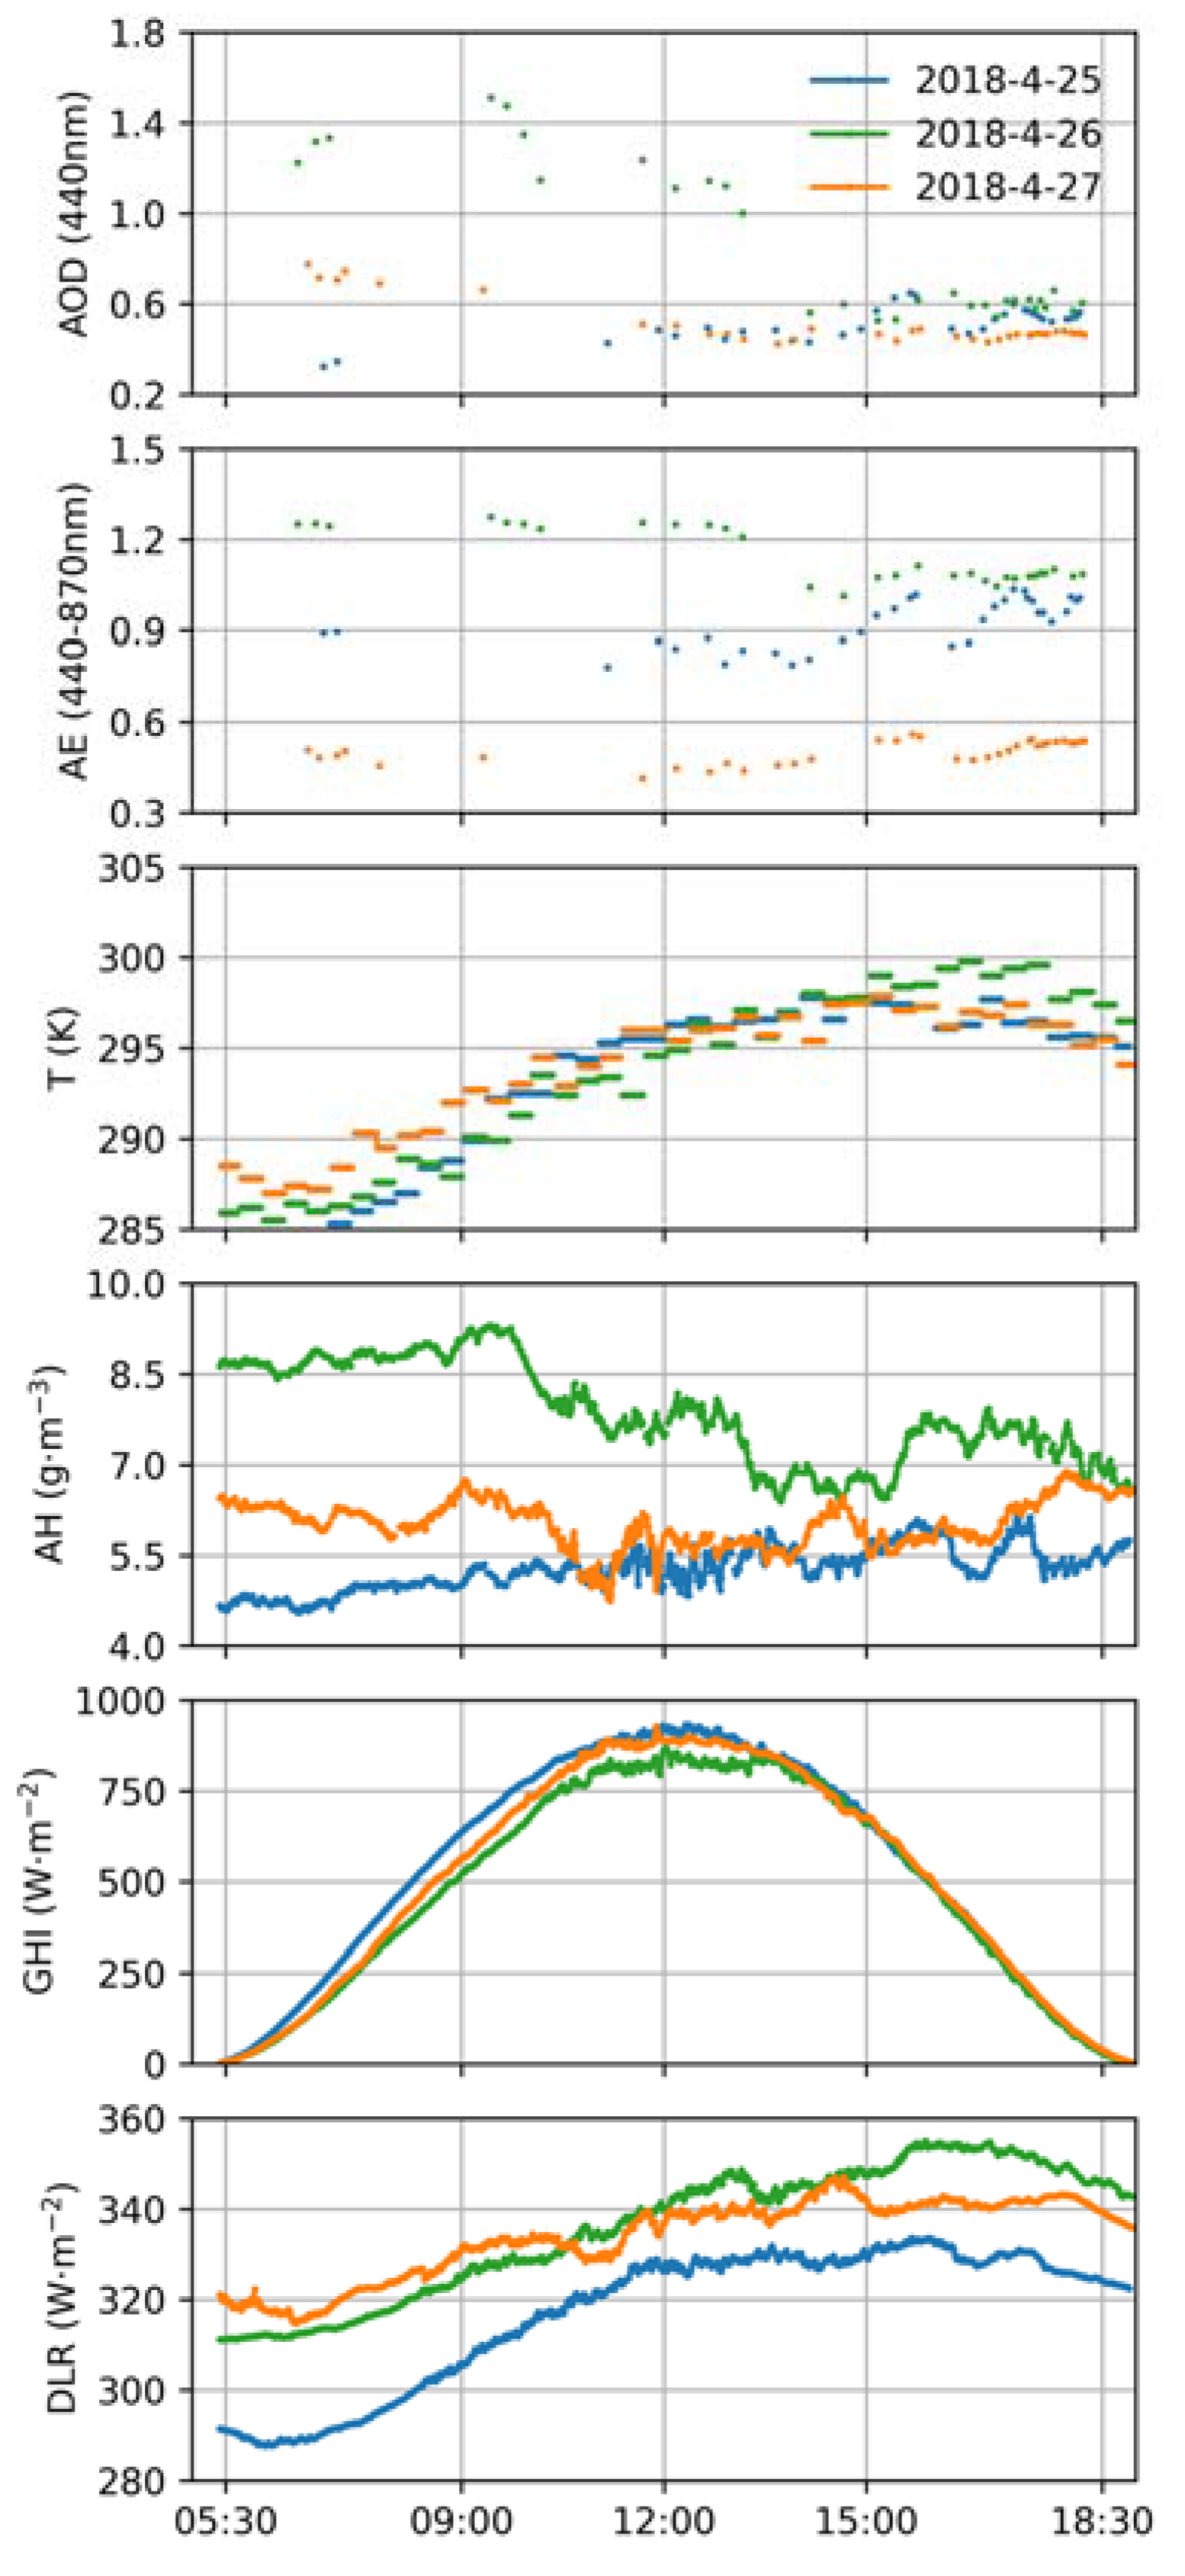
| AOD | AE | T (K) | AH (g/cm3) | GHI (W·m−2) | DLR (W·m−2) | |
|---|---|---|---|---|---|---|
| 25 April 2018 | 0.51 | 0.92 | 294.98 | 5.39 | 534.77 | 317.02 |
| 26 April 2018 | 0.85 | 1.14 | 293.64 | 7.86 | 484.06 | 335.98 |
| 27 April 2018 | 0.5 | 0.50 | 293.87 | 6.01 | 508.91 | 333.89 |
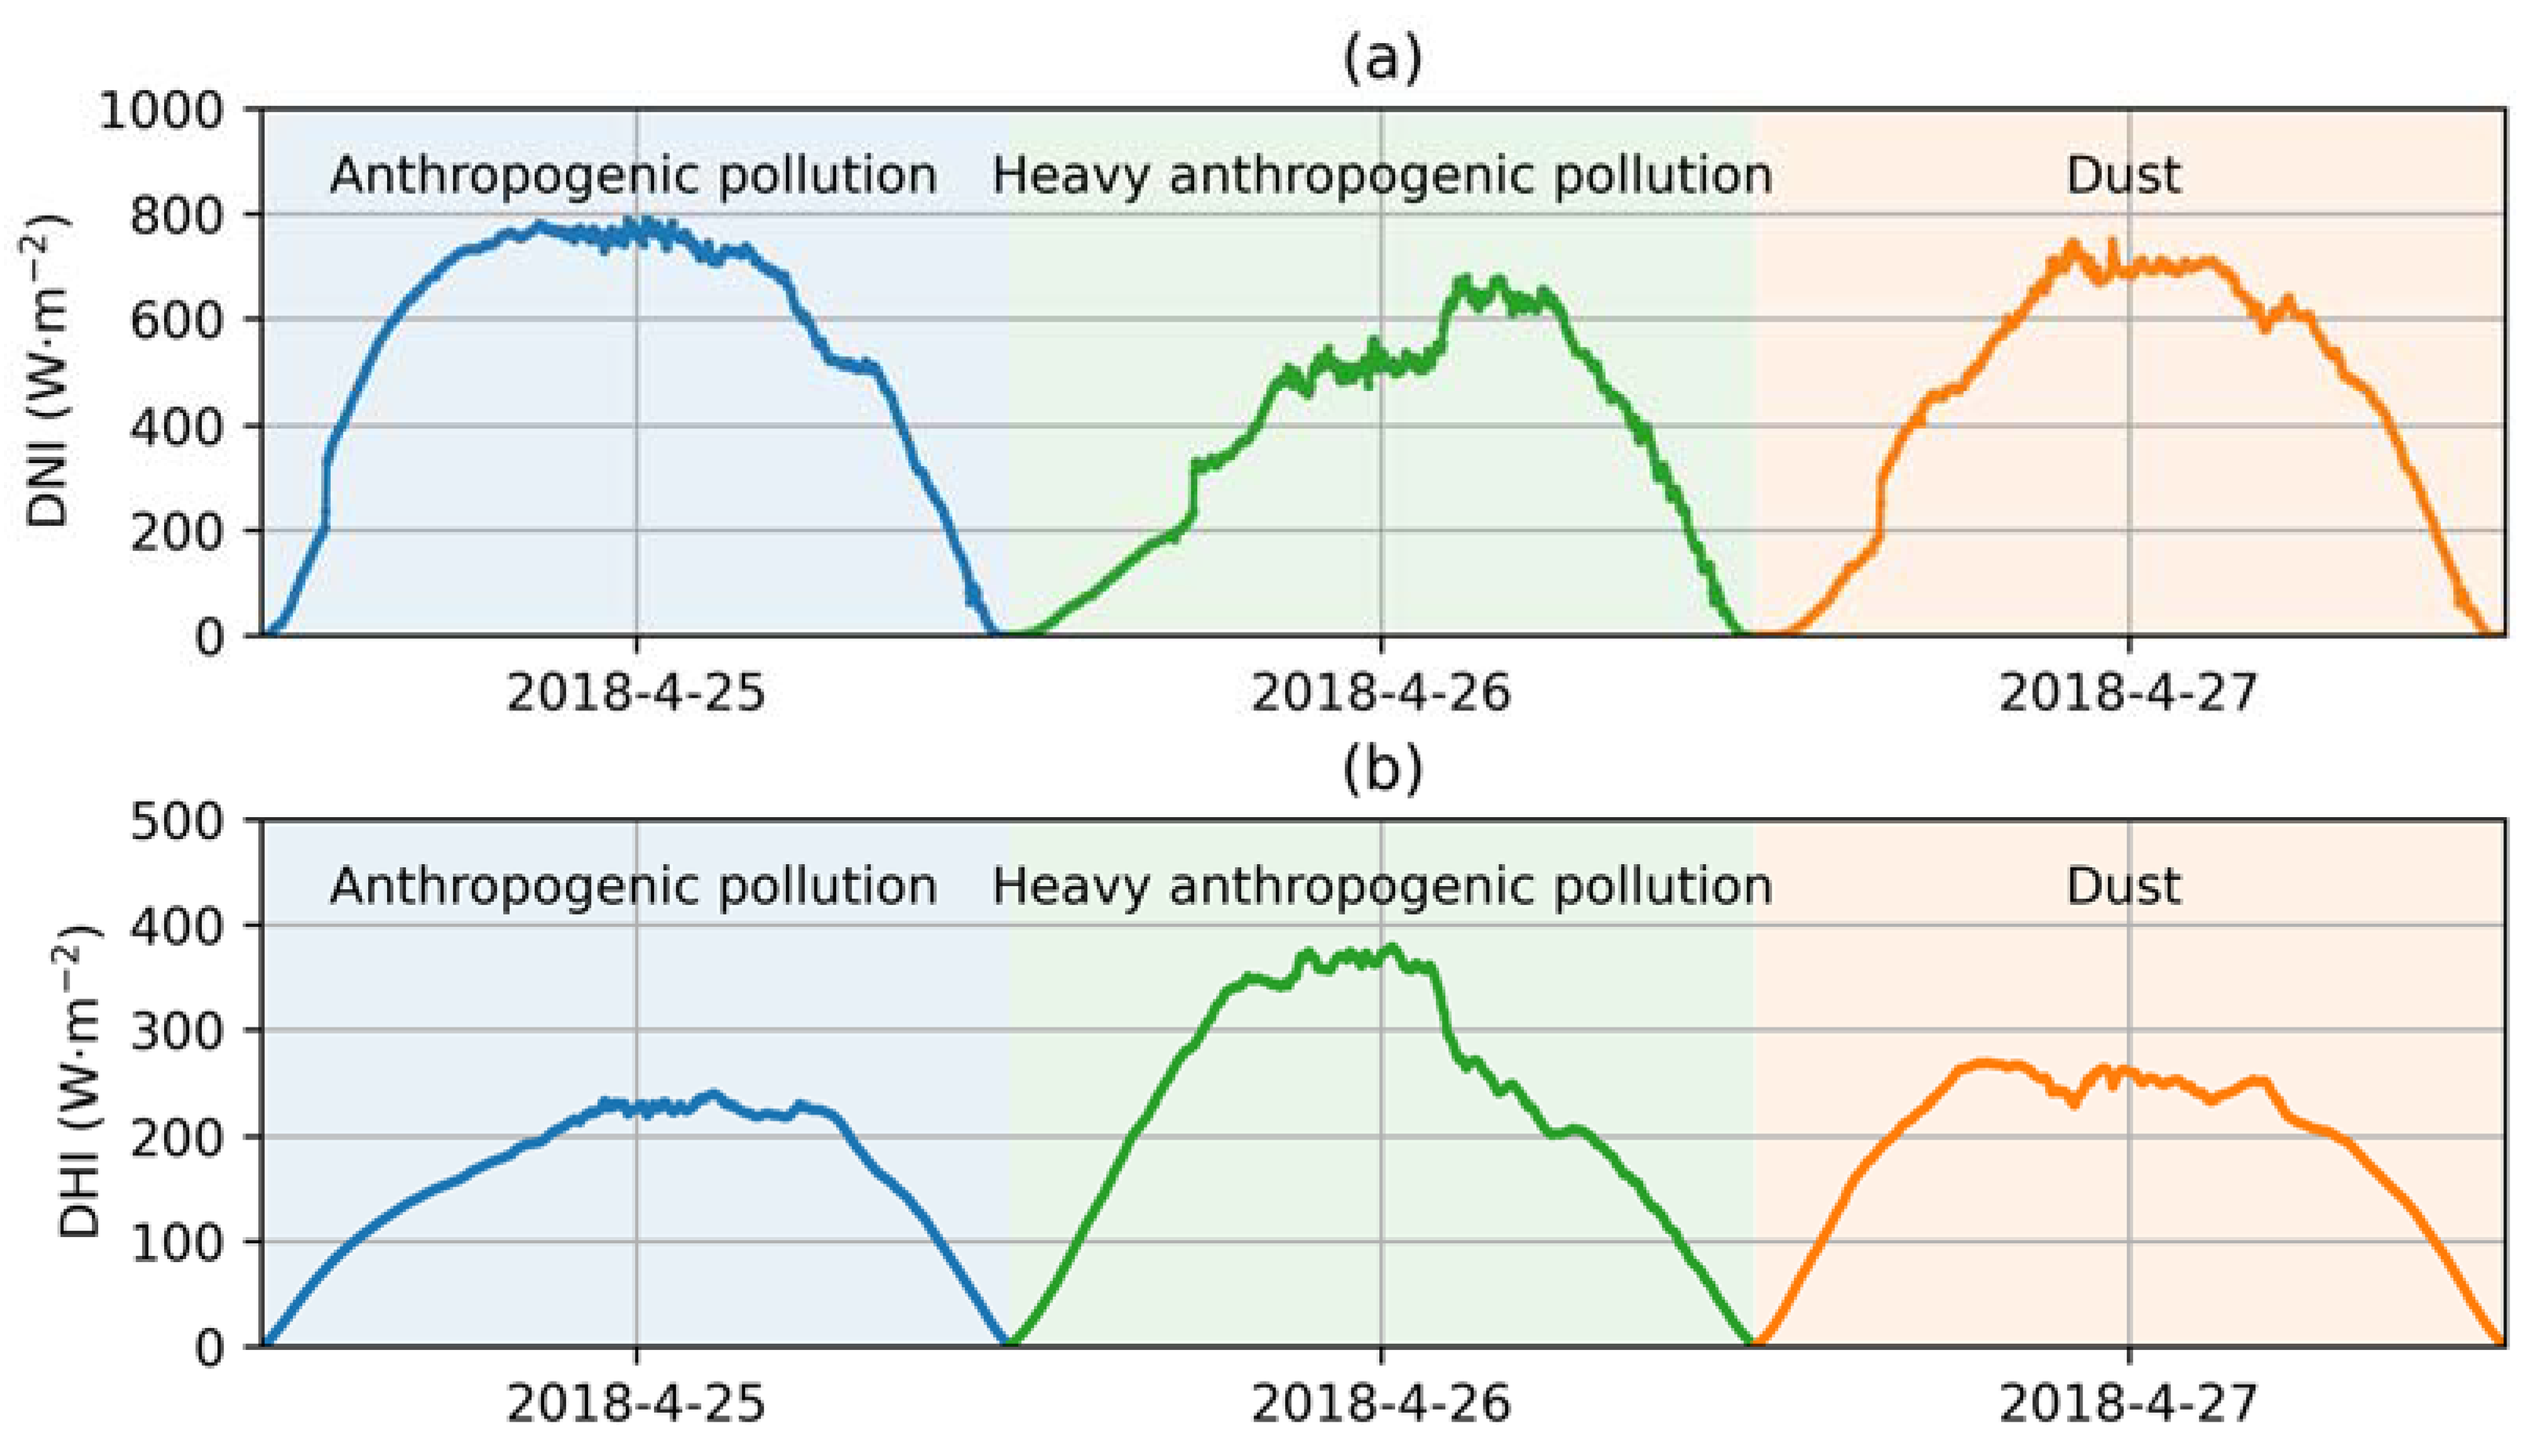
| SARE (W·m−2) | LARE (W·m−2) | |
|---|---|---|
| 25 April 2018 | −27.57 | 8.70 |
| 26 April 2018 | −65.29 | 15.19 |
| 27 April 2018 | −51.45 | 18.99 |
Disclaimer/Publisher’s Note: The statements, opinions and data contained in all publications are solely those of the individual author(s) and contributor(s) and not of MDPI and/or the editor(s). MDPI and/or the editor(s) disclaim responsibility for any injury to people or property resulting from any ideas, methods, instructions or products referred to in the content. |
© 2024 by the authors. Licensee MDPI, Basel, Switzerland. This article is an open access article distributed under the terms and conditions of the Creative Commons Attribution (CC BY) license (https://creativecommons.org/licenses/by/4.0/).
Share and Cite
Liu, M.; Shi, H.; Song, J.; Fu, D. Quantitation of the Surface Shortwave and Longwave Radiative Effect of Dust with an Integrated System: A Case Study at Xianghe. Sensors 2024, 24, 397. https://doi.org/10.3390/s24020397
Liu M, Shi H, Song J, Fu D. Quantitation of the Surface Shortwave and Longwave Radiative Effect of Dust with an Integrated System: A Case Study at Xianghe. Sensors. 2024; 24(2):397. https://doi.org/10.3390/s24020397
Chicago/Turabian StyleLiu, Mengqi, Hongrong Shi, Jingjing Song, and Disong Fu. 2024. "Quantitation of the Surface Shortwave and Longwave Radiative Effect of Dust with an Integrated System: A Case Study at Xianghe" Sensors 24, no. 2: 397. https://doi.org/10.3390/s24020397
APA StyleLiu, M., Shi, H., Song, J., & Fu, D. (2024). Quantitation of the Surface Shortwave and Longwave Radiative Effect of Dust with an Integrated System: A Case Study at Xianghe. Sensors, 24(2), 397. https://doi.org/10.3390/s24020397