
Ensemble Learning Improves the Efficiency of Microseismic Signal Classification in Landslide Seismic Monitoring


Abstract
1. Introduction
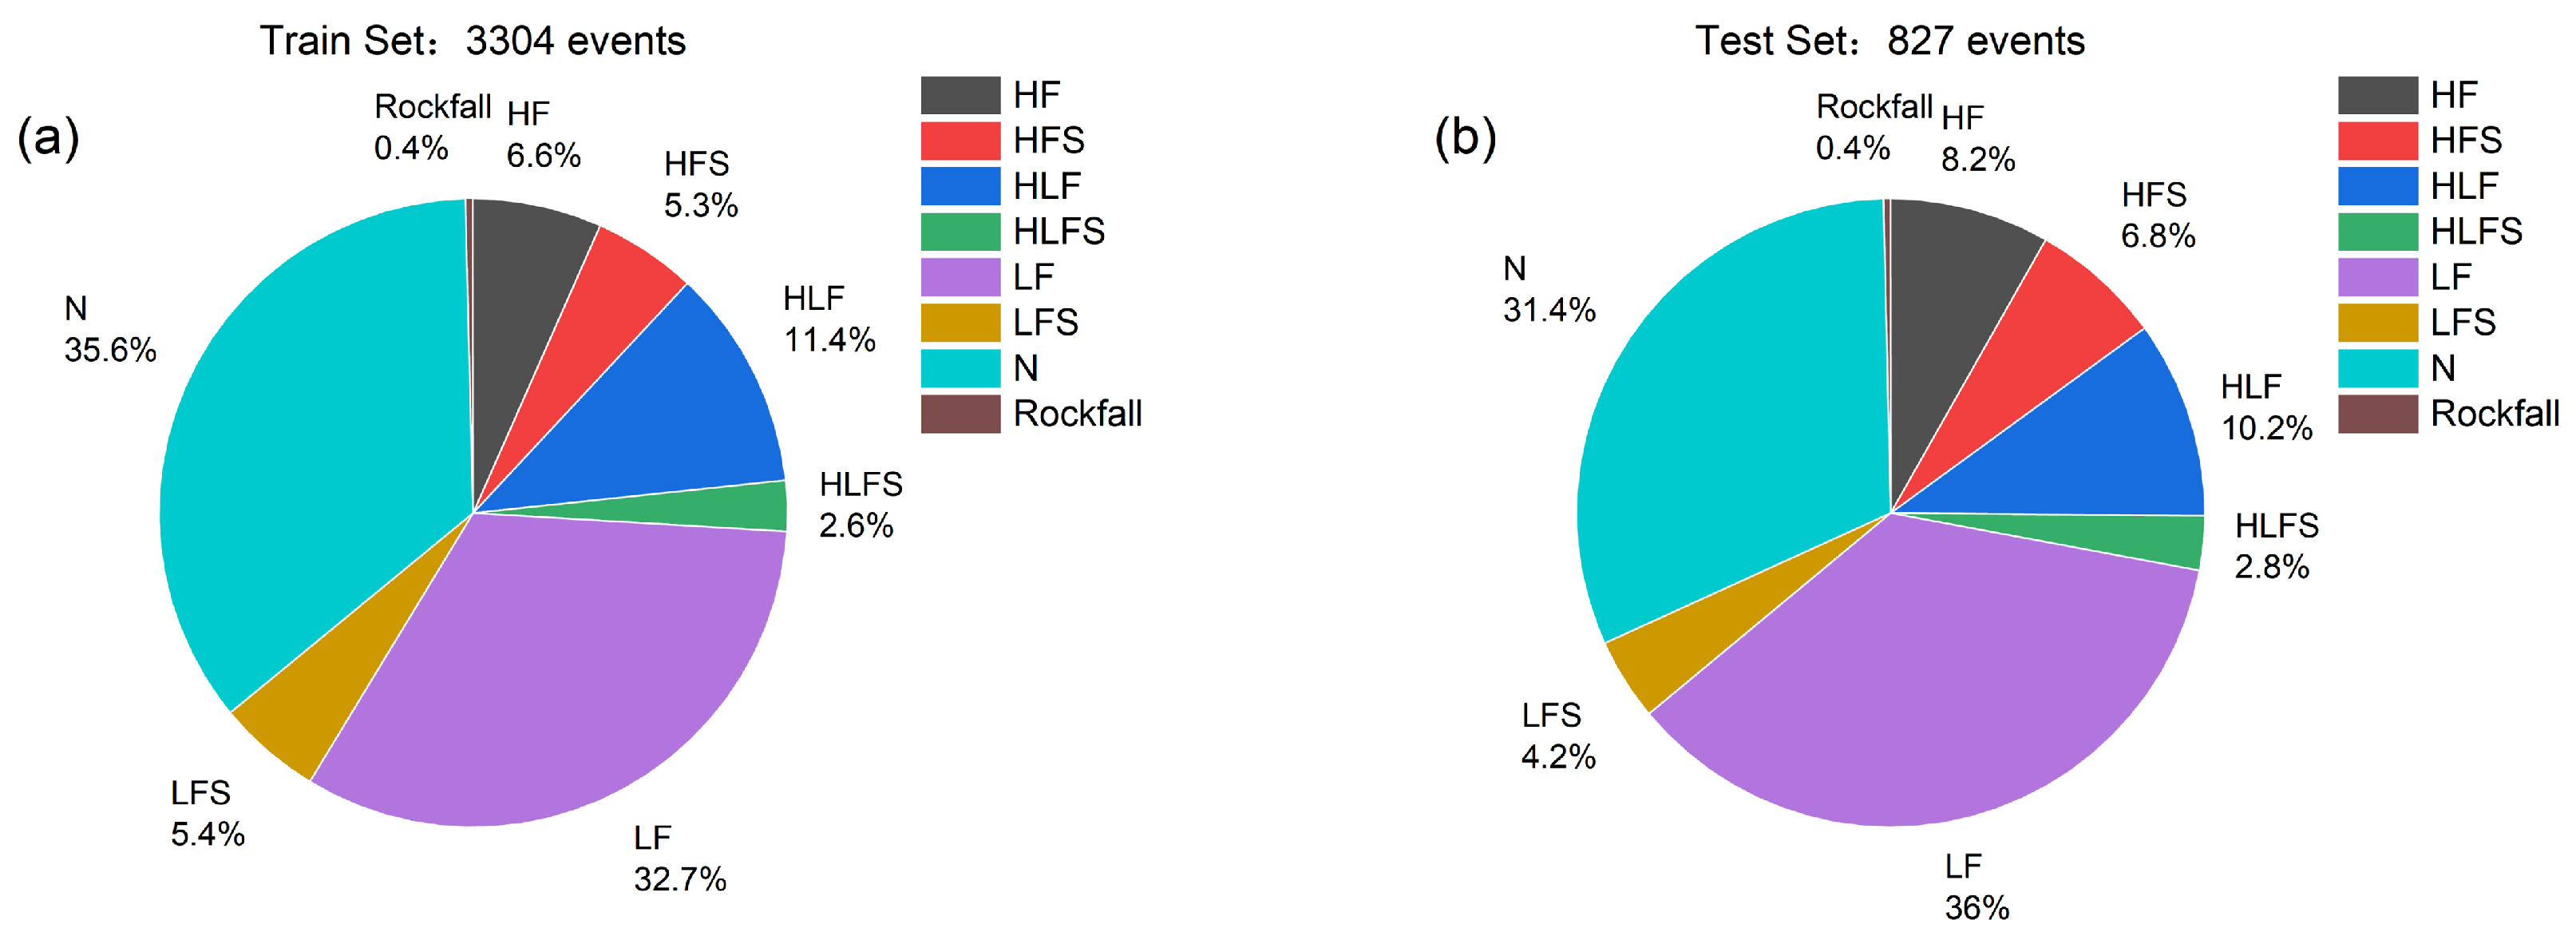
2. Dataset
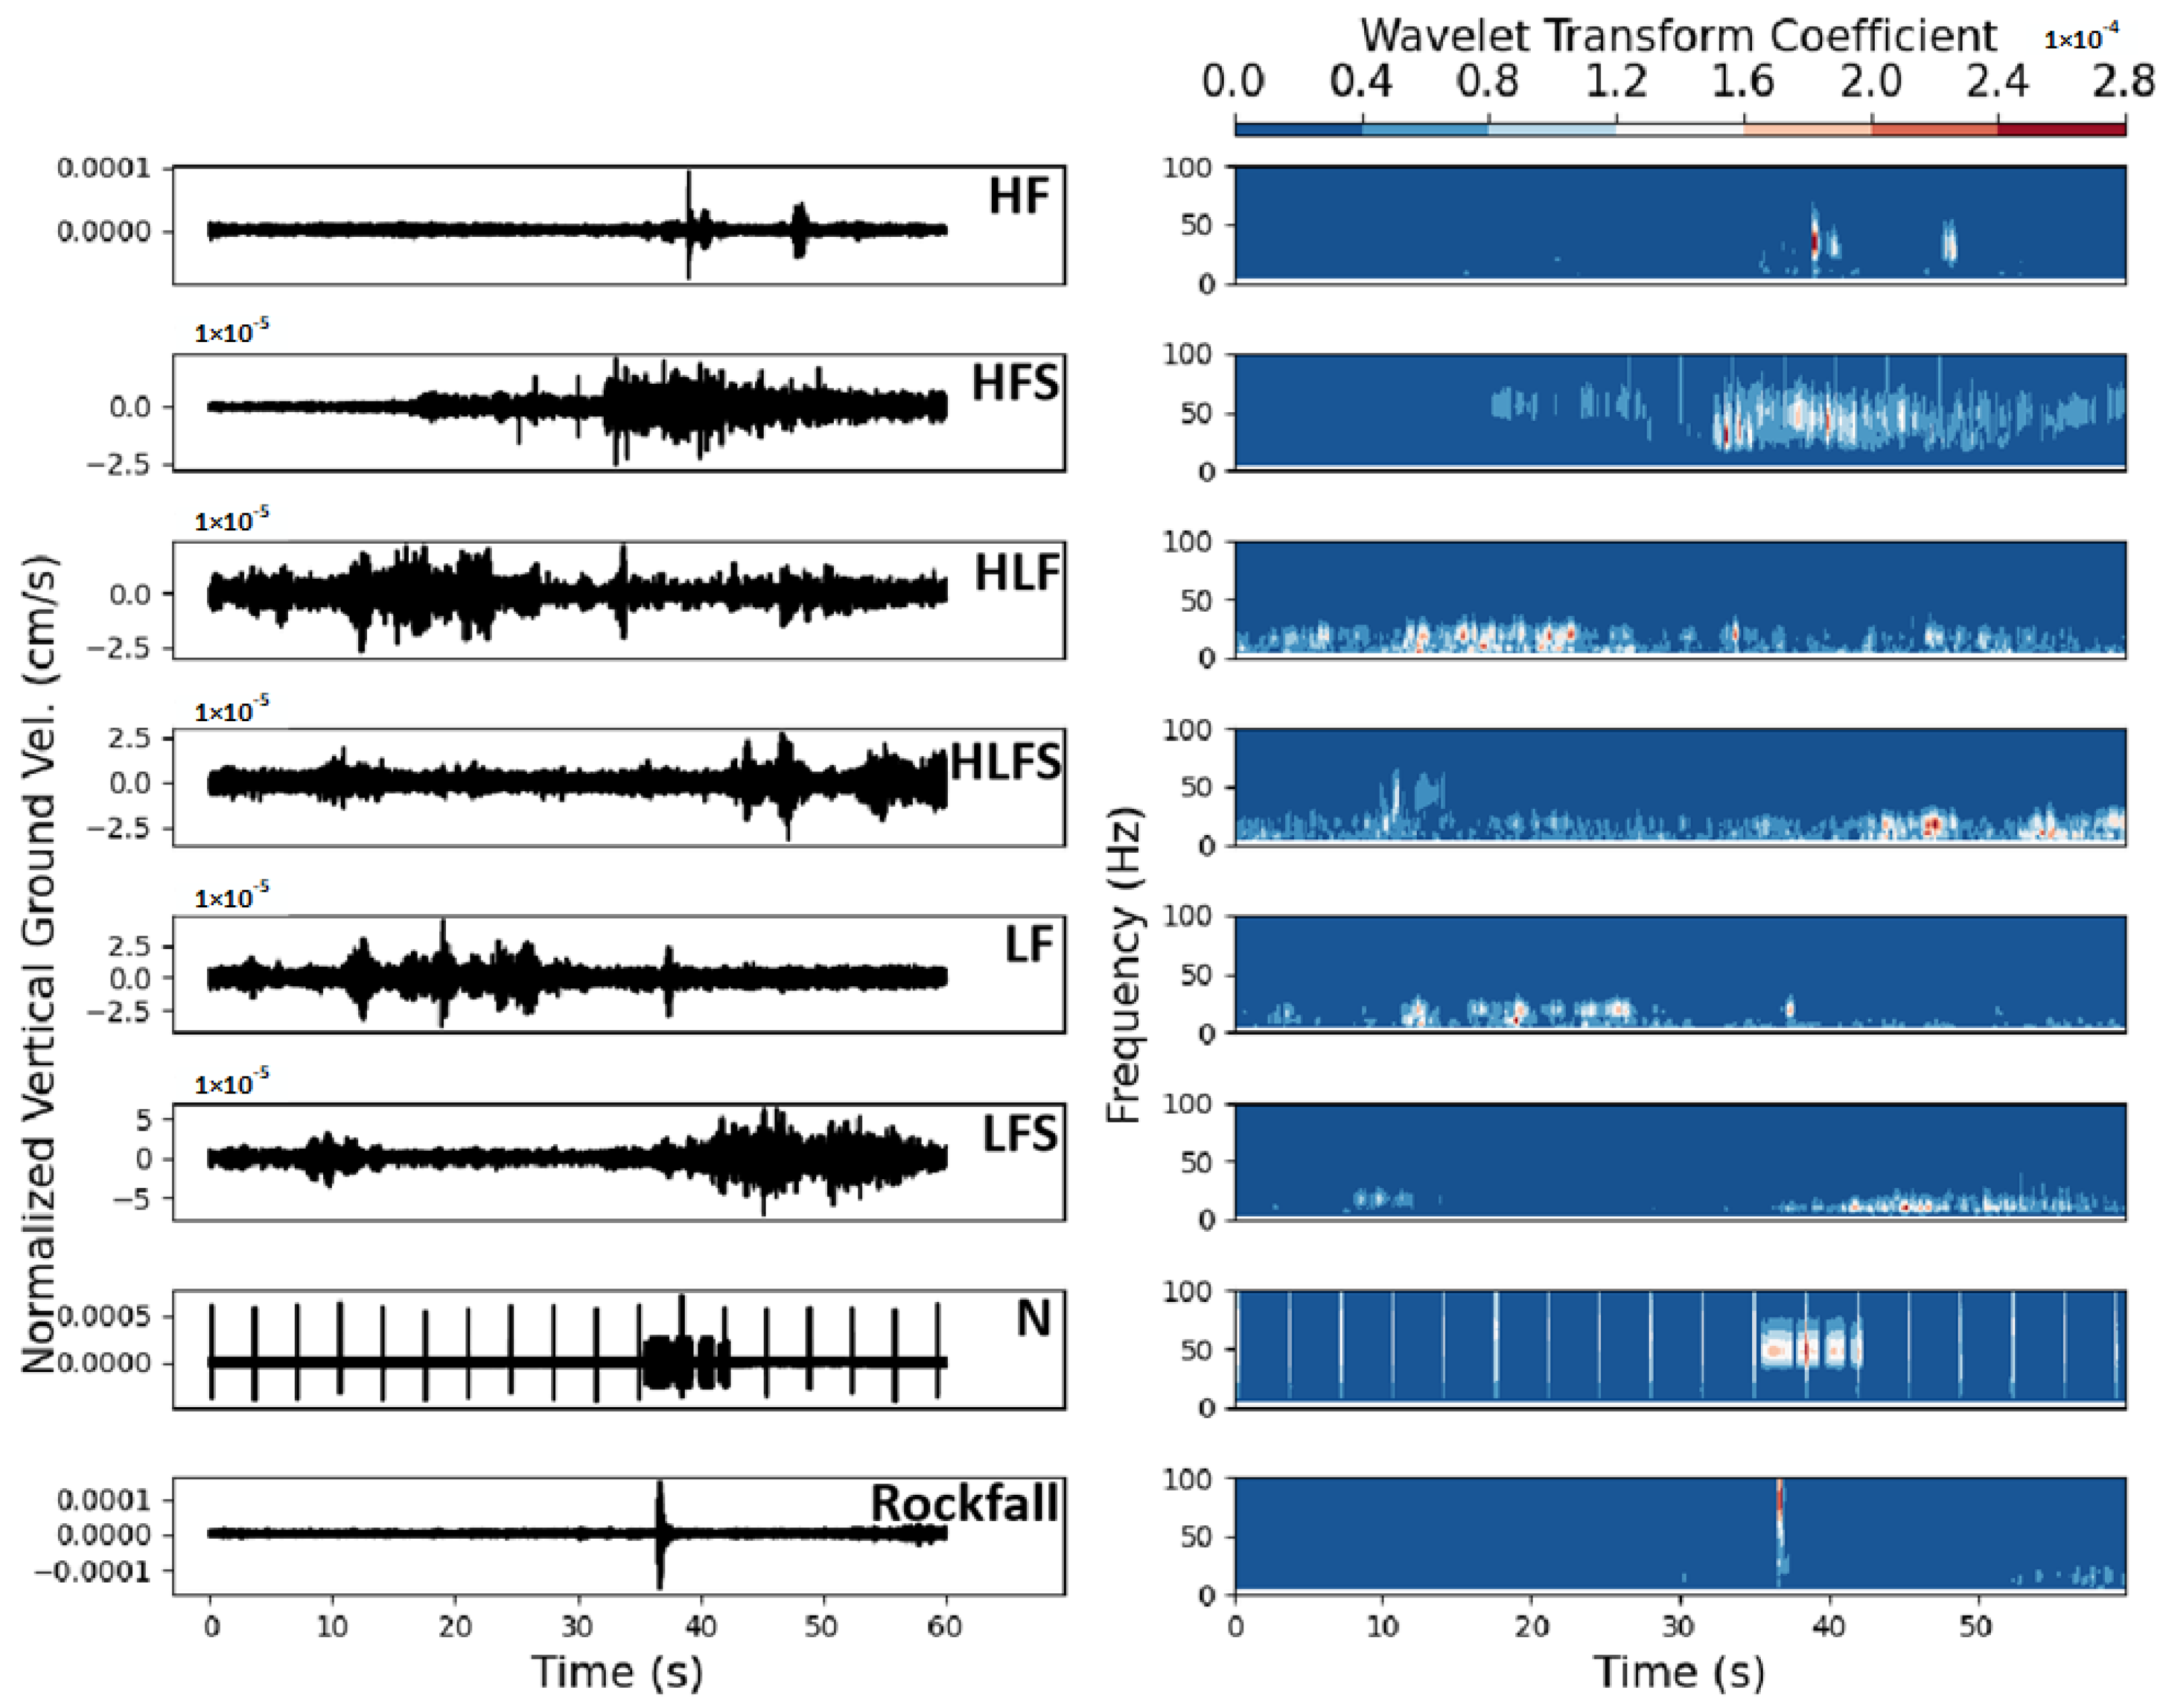
2.1. Features
2.2. Manual Classification Standard
3. Methods
3.1. Non-Ensemble Learning Algorithms
3.1.1. Naive Bayes
3.1.2. Logistic Regression
3.1.3. Support Vector Machine
3.1.4. Linear Discriminant Analysis
3.1.5. Perceptron
3.1.6. Decision Tree
3.2. Ensemble Learning Algorithms
3.2.1. Random Forest
3.2.2. Gradient Boosting Trees
3.2.3. Extreme Gradient Boosting
3.2.4. Light Gradient Boosting Machine
4. Classification Performance
4.1. Evaluation Methodology
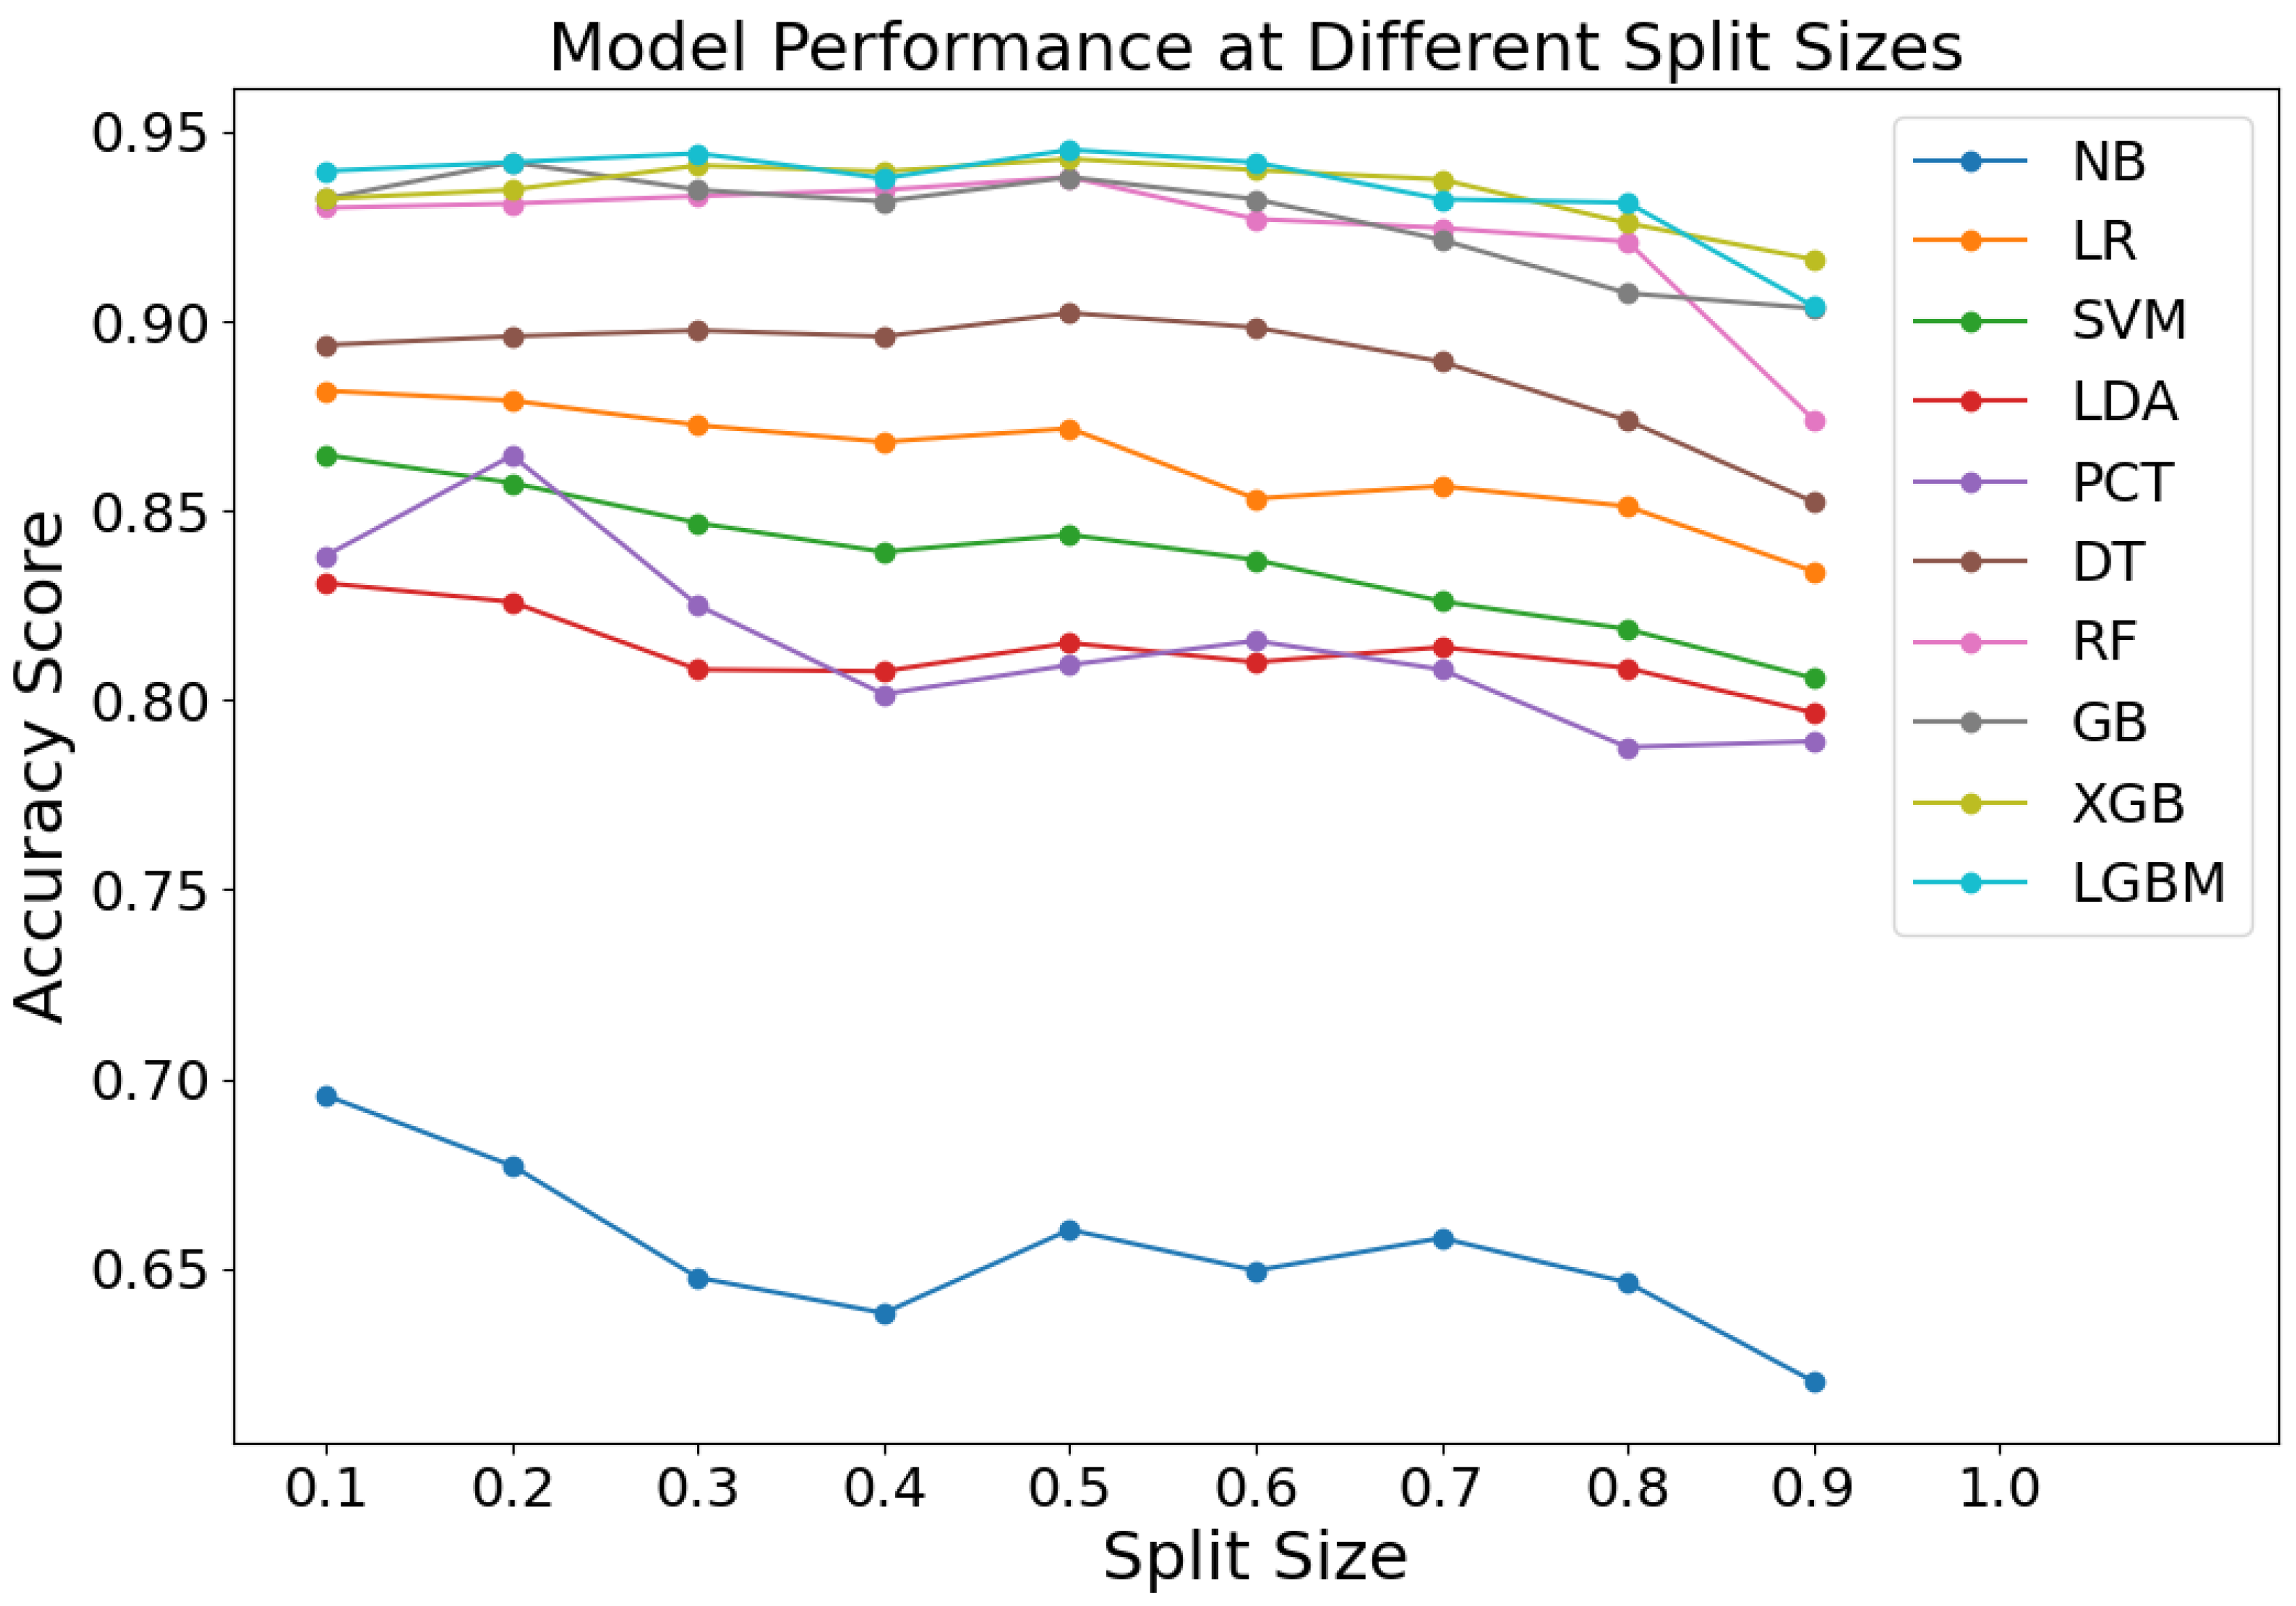
4.2. Split Ratio of the Dataset
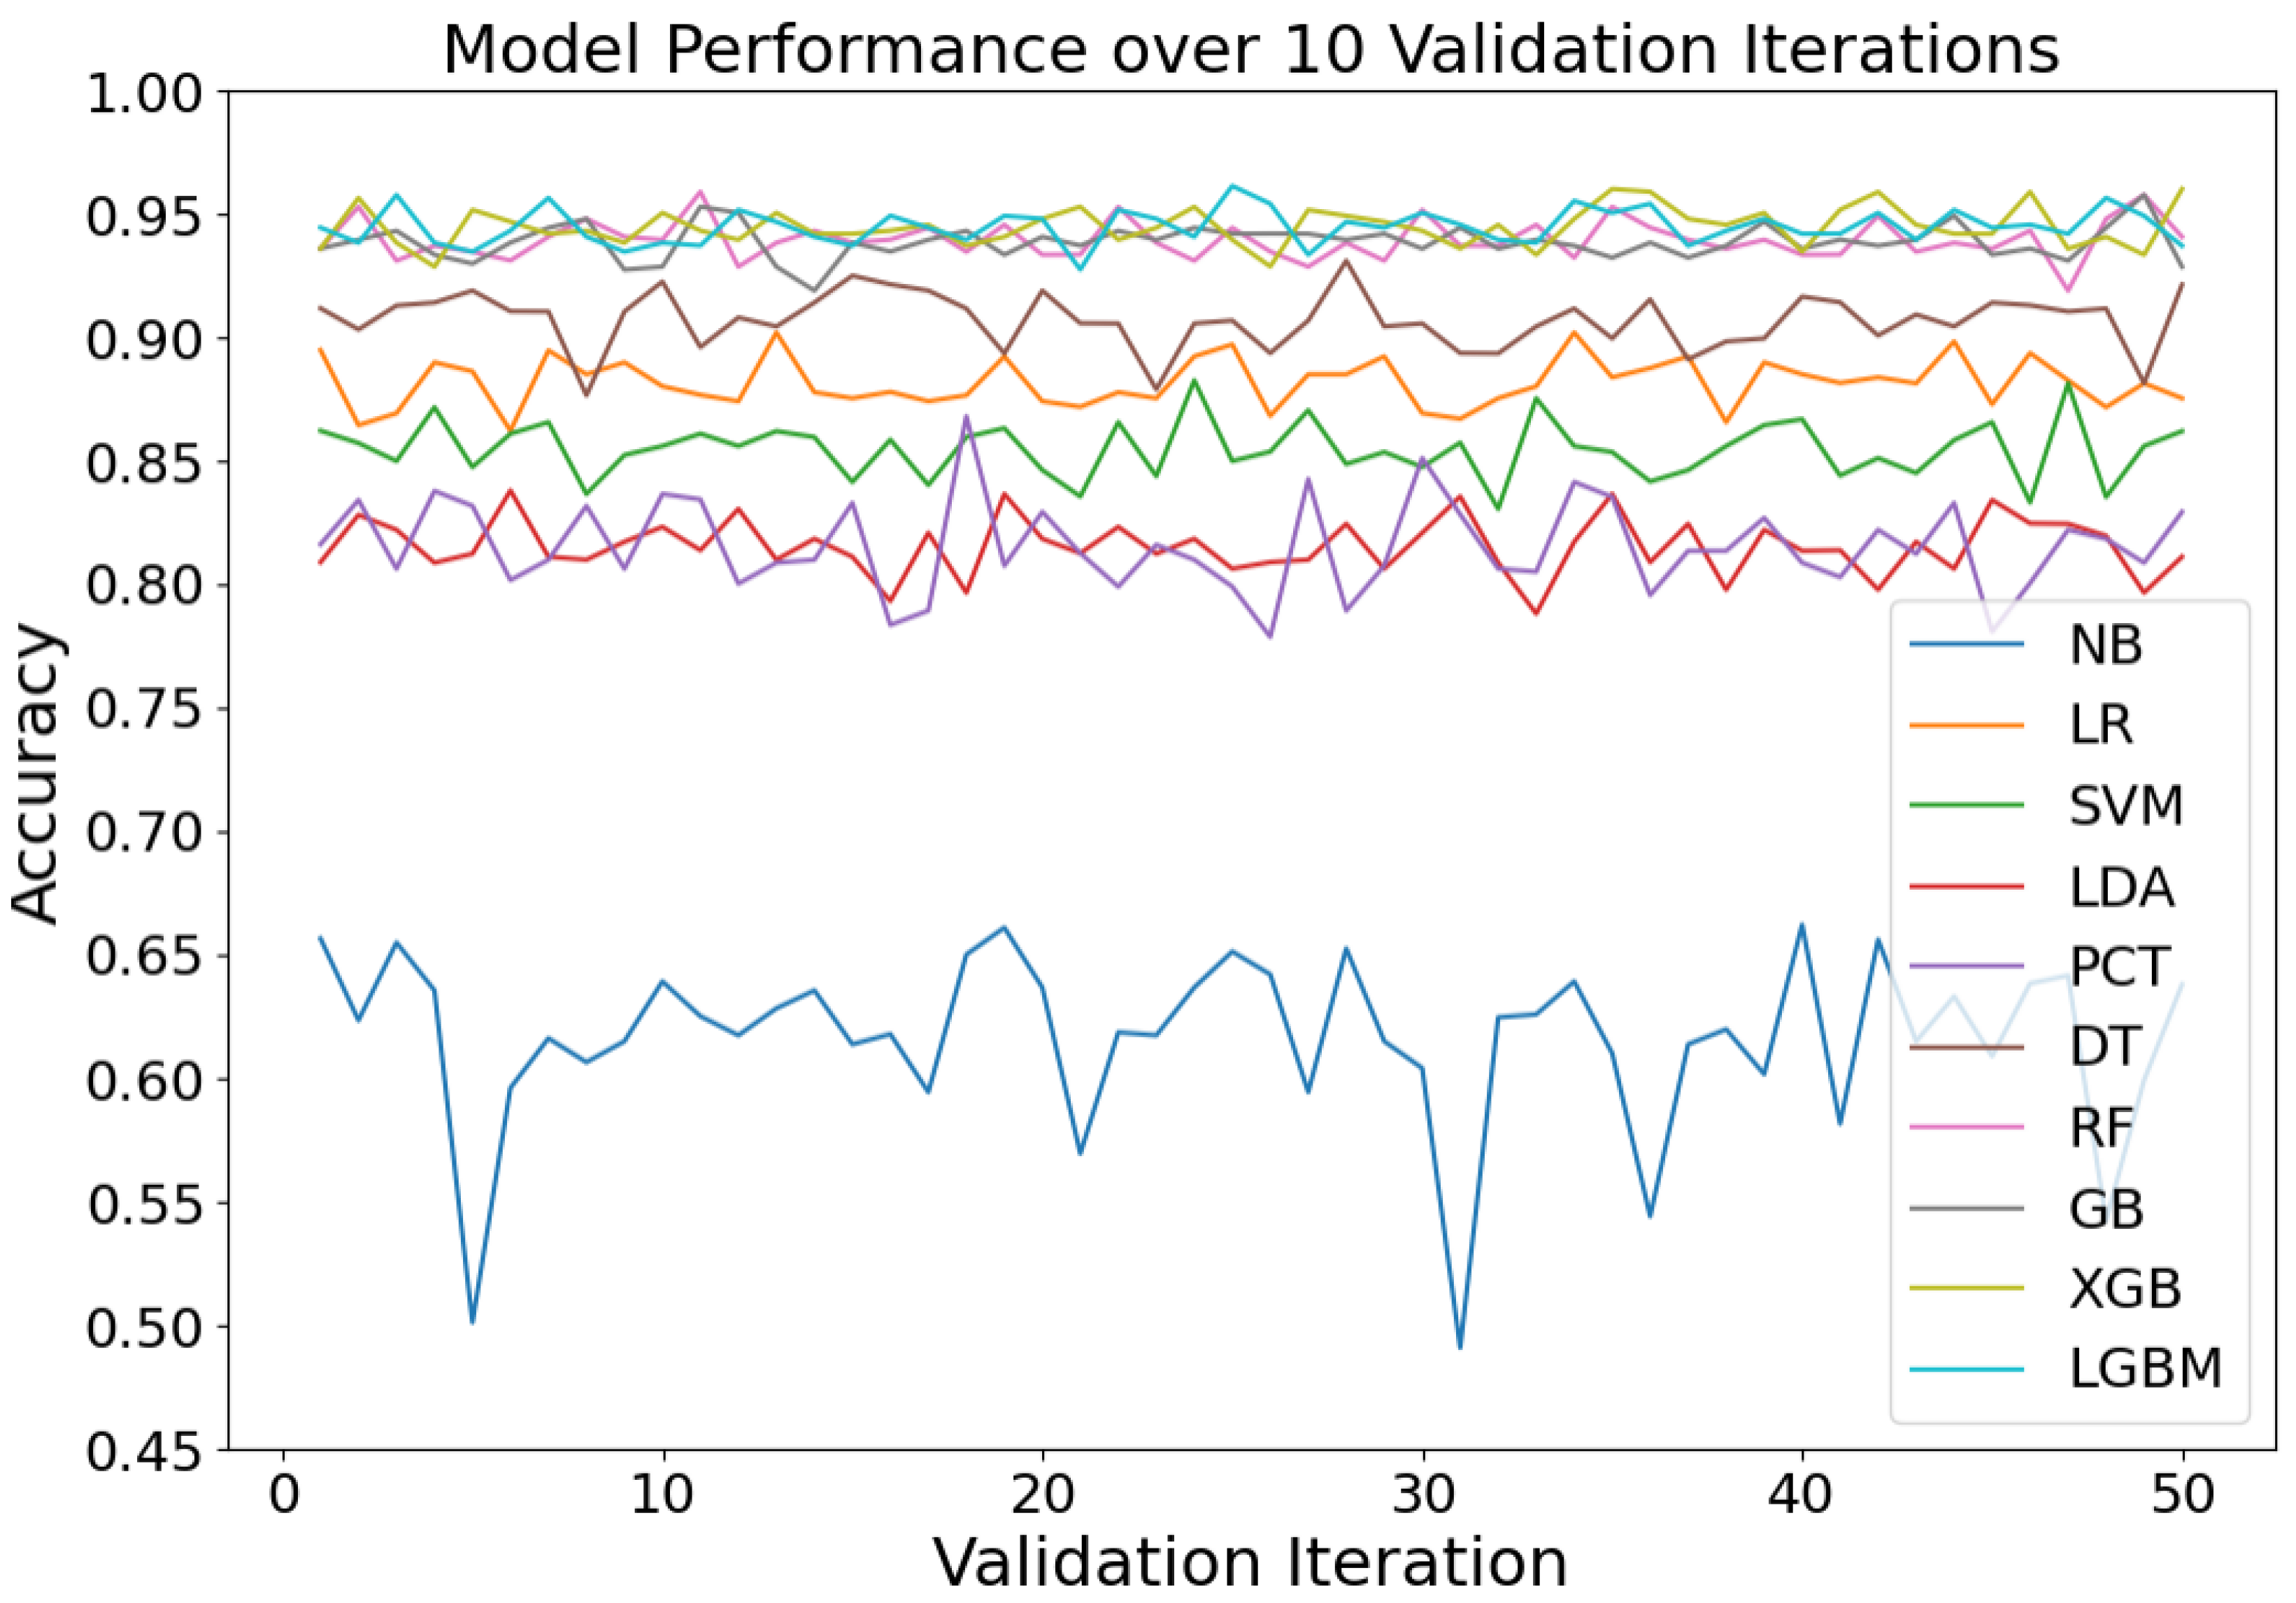
4.3. Validation Accuracies
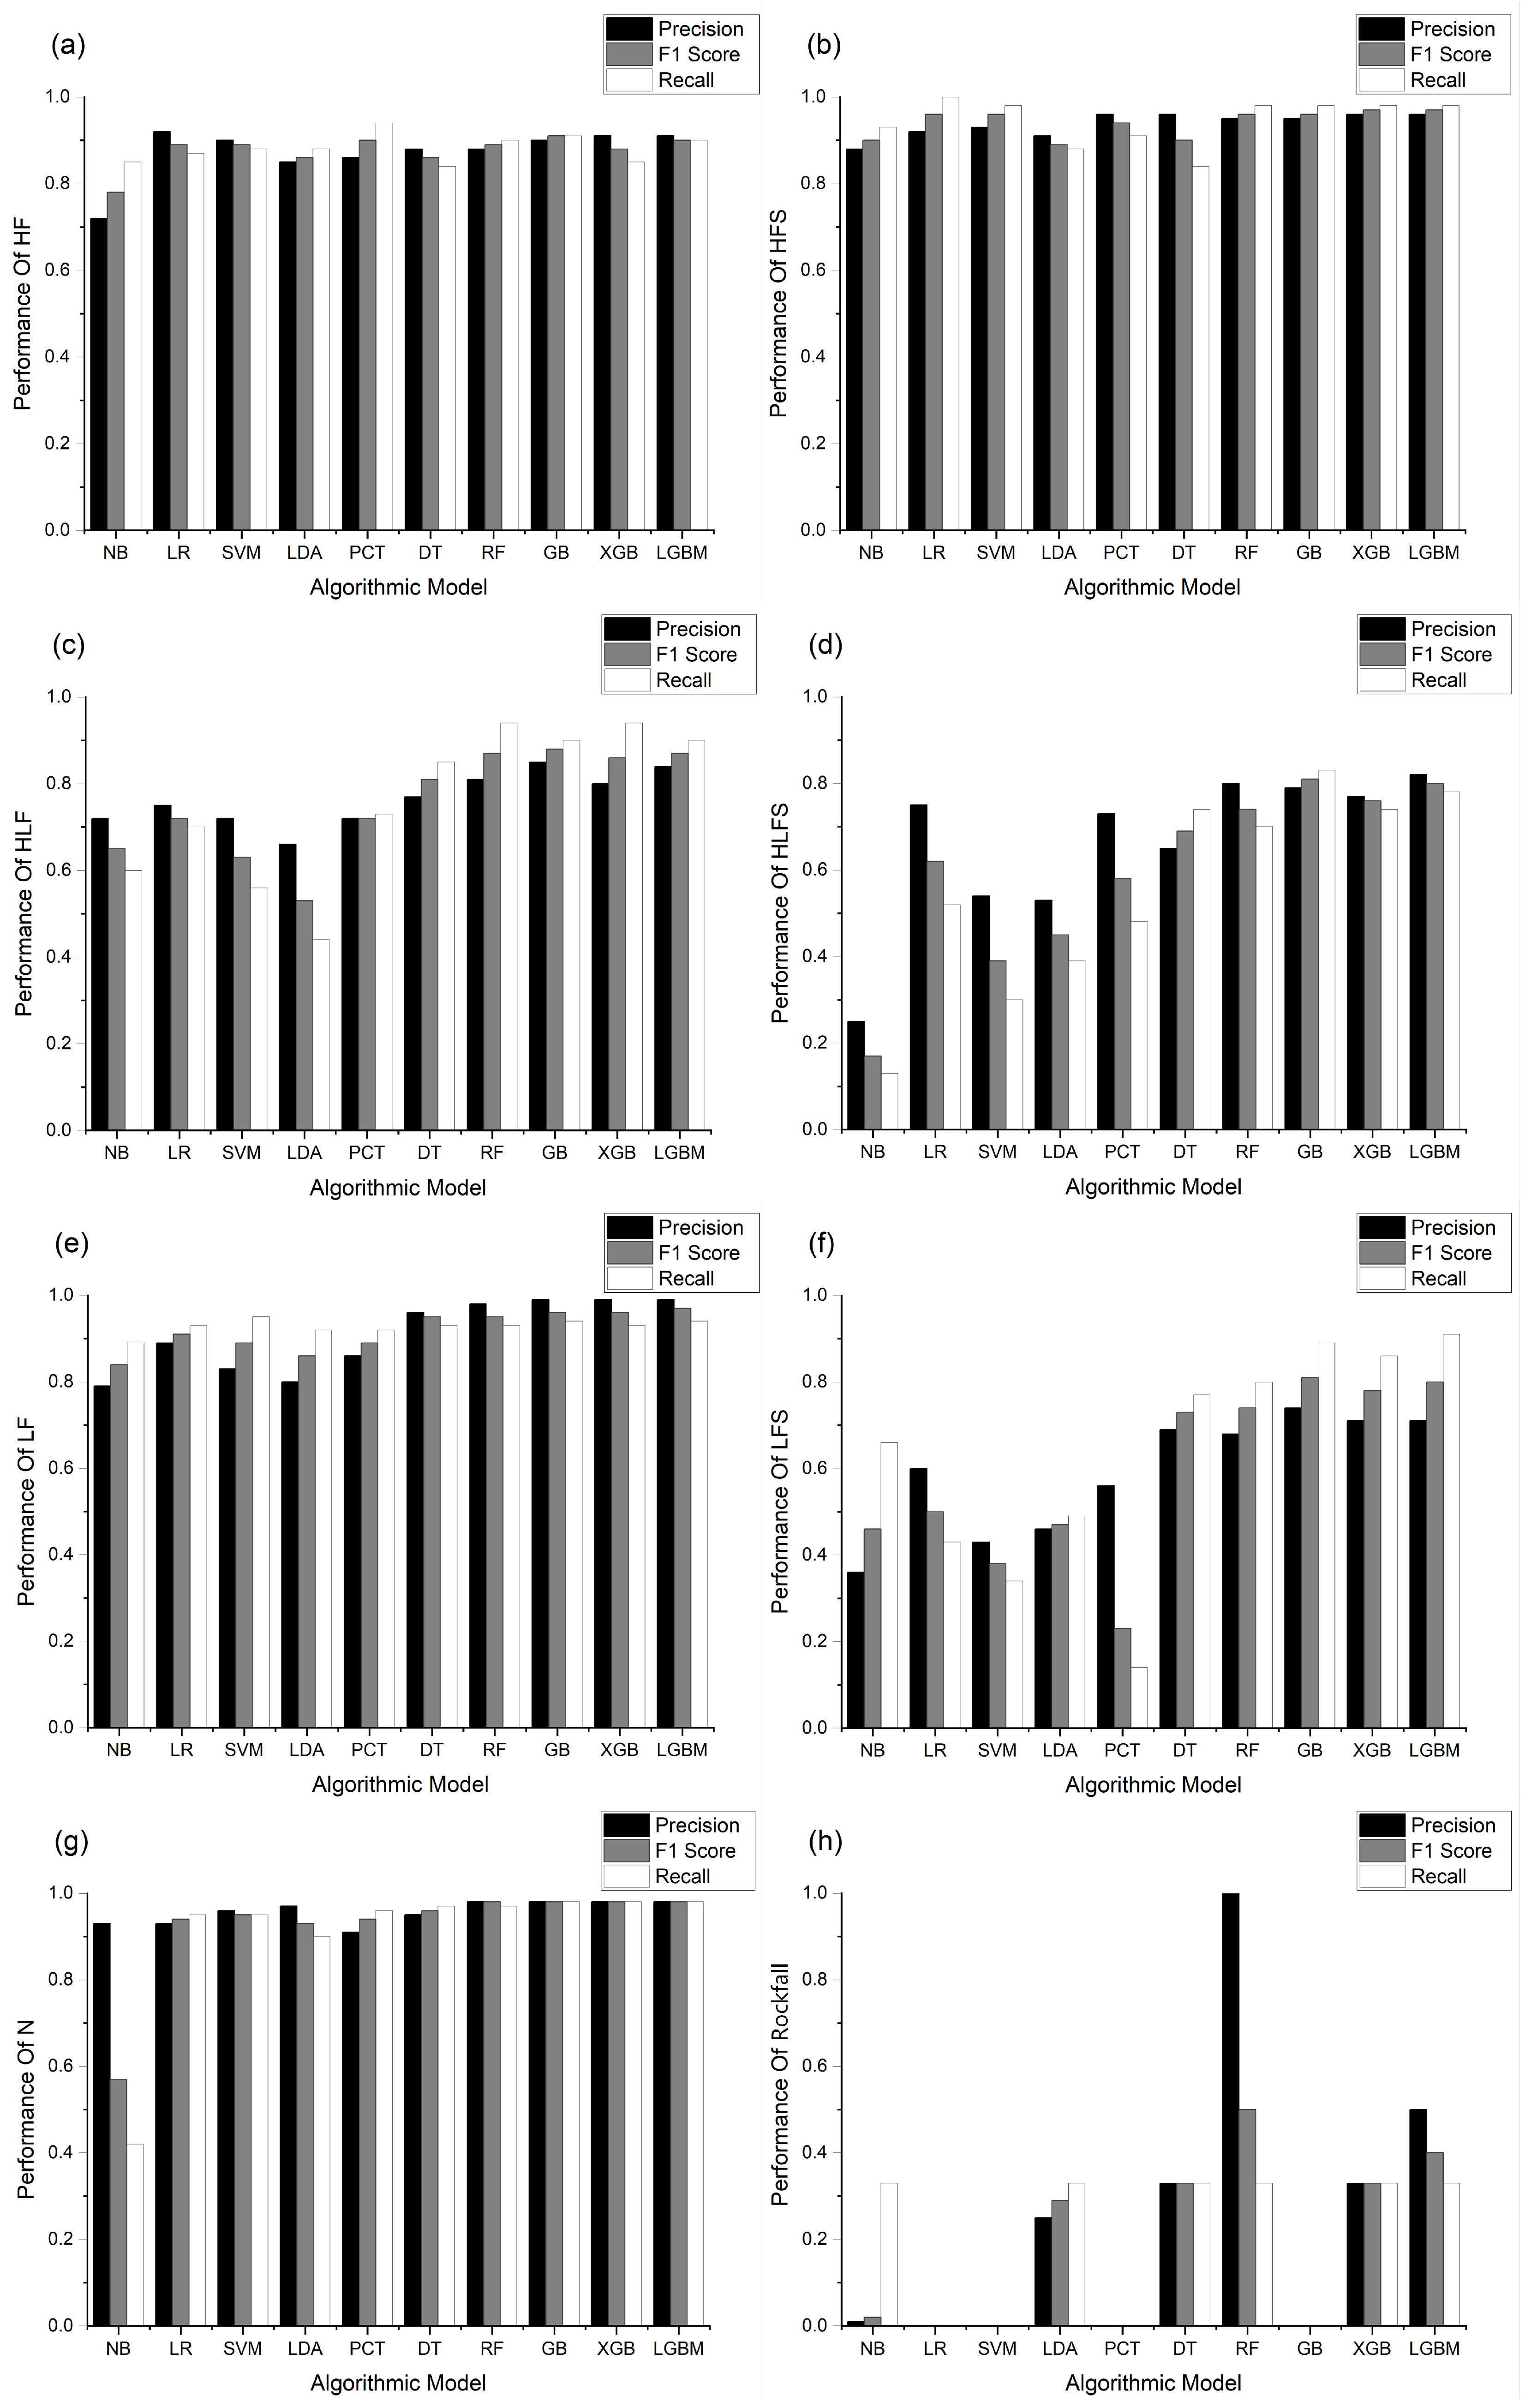
4.4. Category Performance
4.5. Model Optimization
4.6. Application
5. Conclusions
Author Contributions
Funding
Institutional Review Board Statement
Informed Consent Statement
Data Availability Statement
Acknowledgments
Conflicts of Interest
Appendix A

| Description | Formula | Sources | |
|---|---|---|---|
| 1 | Maximum amplitude of the signal | Feng et al. [1] | |
| 2 | Maximum frequency of the signal | Feng et al. [1] | |
| 3 | Energy distribution between the high-frequency bands [20–100 Hz] and low-frequency bands [3–16 Hz] | Feng et al. [1] | |
| 4 | Centroid frequency | , with and : first and second moment | Provost et al. [15] |
| 5 | Duration | , with and : beginning and end of the signal | Provost et al. [15] |
| 6 | Energy | Feng et al. [1] | |
| 7 | Energy density | Feng et al. [1] | |
| 8 | Energy variation | Feng et al. [1] | |
| 9 | Number of peaks | - | Feng et al. [1] |
| 10 | Ratio of the mean over the maximum of the envelope signal | - | Provost et al. [15] |
| 11 | Ratio of the median over the maximum of the envelope signal | - | Provost et al. [15] |
| 12 | Ratio between the ascending and descending time | , with : time of the largest amplitude | Provost et al. [15] |
| 13 | Kurtosis of the raw signal (peakness of the signal) | , with : fourth moment, : standard deviation | Provost et al. [15] |
| 14 | Skewness of the raw signal | , with : third moment | Provost et al. [15] |
| 15 | Kurtosis of the envelope | see 13 | Provost et al. [15] |
| 16 | Skewness of the envelope | see 14 | Provost et al. [15] |
| 17 | Energy in the first third part of the autocorrelation function | , with T: signal duration, C: autocorrelation function | Provost et al. [15] |
| 18 | Energy in the remaining part of the autocorrelation function | see 17 | Provost et al. [15] |
| 19 | Ratio of 17 and 18 | - | Provost et al. [15] |
| 20 | Number of peaks in the autocorrelation function | - | Provost et al. [15] |
| 21–25 | Energy of the signal filtered in the 5–10 Hz, 10–50 Hz, 5–70 Hz, 50–100 Hz, and 5–100 Hz | , with : filtered signal in the frequency range [] | Provost et al. [15] |
| 26–30 | Kurtosis of the signal in the 5–10 Hz, 10–50 Hz, 5–70 Hz, 50–100 Hz, and 5–100 Hz frequency range | see 21–25 | Provost et al. [15] |
| 31 | Decreasing part of the signal and | ,with Y: envelope of the signal | Provost et al. [15] |
| 32 | Mean of the DFT | DFT: discrete Fourier transform mean(abs(fft(Zdata))) | Hibert et al. [20] |
| 33 | Central frequency of the 1st quartile | - | Wenner et al. [21] |
| 34 | Central frequency of the 2nd quartile | - | Wenner et al. [21] |
| 35 | Median of the normalized DFT | - | Hibert et al. [20] |
| 36 | Variance of the normalized DFT | - | Hibert et al. [20] |
| 37 | Energy in [0, ]N | , with : considered frequency range | Hibert et al. [20] |
| 38 | Energy in [, ]N | - | Hibert et al. [20] |
| 39 | Energy in [, ]N | - | Hibert et al. [20] |
| 40 | Energy in [, 1]N | - | Hibert et al. [20] |
| 41 | Number of peaks | - | Feng et al. [36] |
| 42 | Gyration radius | , with : third moment | Provost et al. [15] |
| 43 | Kurtosis of the maximum of all discrete Fourier transforms (DFTs) as a function of time t | , with : spectrogram | Provost et al. [15] |
| 44 | Mean ratio between the maximum and the mean of all DFTs | Provost et al. [15] | |
| 45 | Number of peaks in the curve showing the temporal evolution of the DFTs maximum | - | Provost et al. [15] |
| 46 | Number of peaks in the curve showing the temporal evolution of the DFT mean | - | Provost et al. [15] |
| 47 | Number of peaks in the curve showing the temporal evolution of the DFT median | - | Provost et al. [15] |
| 48 | Number of peaks in the curve of the temporal evolution of the DFT central frequency | - | Provost et al. [15] |
| 49 | Number of peaks in the curve of the temporal evolution of the DFT maximum frequency | - | Provost et al. [15] |
| 50 | Ratio between 45 and 46 | - | Provost et al. [15] |
| 51 | Ratio between 45 and 47 | - | Provost et al. [15] |
| 52 | Mean ratio between the maximum and the median of all DFTs | Provost et al. [15] | |
| 53 | Ratio between 48 and 49 | - | Provost et al. [15] |
| 54 | Mean distance between the curves of the temporal evolution of the DFT maximum frequency and mean frequency | - | Provost et al. [15] |
| 55 | Mean distance between the curves of the temporal evolution of the DFT maximum frequency and median frequency | - | Provost et al. [15] |
| 56 | Mean distance between the 1st quartile and the median of all DFTs as a function of time | - | Provost et al. [15] |
| 57 | Mean distance between the 3rd quartile and the median of all DFTs as a function of time | - | Provost et al. [15] |
| 58 | Mean distance between the 3rd quartile and the 1st quartile of all DFTs as a function of time | - | Provost et al. [15] |
| 59 | The ratio of 2 between two different seismic stations | - | Feng et al. [1] |
| 60 | The ratio of 1 between two different seismic stations | - | Feng et al. [1] |
| Class | Sub-Class | Duration | Frequency | Other | Potential Origin |
|---|---|---|---|---|---|
| Slopequake (at depth) | High Frequency (HF) | <5 | 30–60 Hz, Max_frequency > 30 Hz | Very impulsive | Rock break, crack open |
| Low Frequency (LF) | <5 | 4–20 Hz | - | Soil shearing on sliding plane | |
| High-Low Frequency (HLF) | <5 | Double center: one 10–25 Hz, another 20–40 Hz, Max_frequency > 15 Hz | - | Soil-rock shear on sliding plane | |
| Succession of HF (HFS) | >5 | 30–60 Hz, Max_frequency > 30 Hz | Several bursts of energy | Soil-rock shear on sliding plane | |
| Succession of LF (LFS) | >5 | 4–20 Hz | Several bursts of energy | Soil shearing on plane | |
| HLFS | >5 | Double center: one 10–25 Hz, another 20–40 Hz | Max_frequency > 15 Hz | - | |
| Rockfall | - | - | Large bandwidth, up to 100 Hz | The duration depends on the trajectory | - |
| Earthquake | - | >10 | <20 Hz | - | - |
| Noise | - | - | <4 Hz and large bandwidth up to 250 Hz | - | - |
References
- Feng, L.; Pazzi, V.; Intrieri, E.; Gracchi, T.; Gigli, G. Joint detection and classification of rockfalls in a microseismic monitoring network. Geophys. J. Int. 2020, 222, 2108–2120. [Google Scholar] [CrossRef]
- Zaruba, Q.; Mencl, V. Landslides and Their Control; Elsevier Science: Amsterdam, The Netherlands; The University of California: Los Angeles, CA, USA, 2014. [Google Scholar]
- Dai, F.; Jiang, P.; Xu, N.W.; Zhou, Z.; Sha, C.; Guo, L. Study of microseismicity and its time-frequency characteristics of abutment rock slope during impounding period. Rock Soil Mech. 2016, 37, 359–369. [Google Scholar] [CrossRef]
- Hardy, H.R., Jr. Acoustic Emission/Microseismic Activity: Principle; Taylor and Francis: Oxfordshire, UK, 2003. [Google Scholar]
- Lou, M.; Rial, J. Application of the wavelet transform in detecting multiple events of microearthquake seismograms. Geophys. Res. Lett. 1995, 22, 2199–2202. [Google Scholar] [CrossRef]
- Allen, R.V. Automatic earthquake recognition and timing from single traces. Bull. Seismol. Soc. Am. 1978, 68, 1521–1532. [Google Scholar] [CrossRef]
- Cieplicki, R.; Eisner, L.; Mueller, M. Microseismic event detection: Comparing P-wave migration with P-and S-wave crosscorrelation. In Proceedings of the SEG International Exposition and Annual Meeting, Denver, CO, USA, 26–31 October 2014. [Google Scholar]
- Vrieze, S.I. Model selection and psychological theory: A discussion of the differences between the Akaike information criterion (AIC) and the Bayesian information criterion (BIC). Psychol. Methods 2012, 17, 228. [Google Scholar] [CrossRef] [PubMed]
- Yang, H.; Zhu, L.; Chu, R. Fault-plane determination of the 18 April 2008 Mount Carmel, Illinois, earthquake by detecting and relocating aftershocks. Bull. Seismol. Soc. Am. 2009, 99, 3413–3420. [Google Scholar] [CrossRef]
- Li, W.; Narvekar, N.; Nakshatra, N.; Raut, N.; Sirkeci, B.; Gao, J. Seismic data classification using machine learning. In Proceedings of the 2018 IEEE Fourth International Conference on Big Data Computing Service and Applications (BigDataService), Bamberg, Germany, 26–29 March 2018. [Google Scholar] [CrossRef]
- Lindenbaum, O.; Rabin, N.; Bregman, Y.; Averbuch, A. Multi-channel fusion for seismic event detection and classification. In Proceedings of the 2016 IEEE International Conference on the Science of Electrical Engineering (ICSEE), Eilat, Israel, 16–18 November 2016. [Google Scholar] [CrossRef]
- Zhao, G.; Huang, H.M.; Lu, X.X. Discriminating earthquakes and explosion events by seismic signals basing on BP-Adaboost classifier. In Proceedings of the 2016 2nd IEEE International Conference on Computer and Communications (ICCC), Chengdu, China, 14–17 October 2016. [Google Scholar] [CrossRef]
- Astuti, W.; Akmeliawati, R.; Sediono, W.; Salami, M.J.E. Hybrid technique using singular value decomposition (SVD) and support vector machine (SVM) approach for earthquake prediction. IEEE J. Sel. Top. Appl. Earth Observ. Remote Sens. 2014, 7, 1719–1728. [Google Scholar] [CrossRef]
- Long, Y.; Chen, T.X.; Xu, S.D. Recognition of mining rock fracture signal based on waveform feature and decision tree classification algorithm. China Min. Mag. 2022, 31, 158–164. [Google Scholar] [CrossRef]
- Provost, F.; Hibert, C.; Malet, J.P. Automatic classification of endogenous landslide seismicity using the Random Forest supervised classifier. Geophys. Res. Lett. 2017, 44, 113–120. [Google Scholar] [CrossRef]
- Langet, N.; Silverberg, F.M.J. Automated classification of seismic signals recorded on the Åknes rockslope, Western Norway, using a Convolutional Neural Network. Earth Surf. Dyn. 2023, 11, 89–115. [Google Scholar] [CrossRef]
- Malfante, M.; Dalla Mura, M.; Métaxian, J.P.; Mars, J.I.; Macedo, O.; Inza, A. Machine learning for volcano-seismic signals: Challenges and perspectives. IEEE Signal Process. Mag. 2018, 35, 20–30. [Google Scholar] [CrossRef]
- Maggi, A.; Ferrazzini, V.; Hibert, C.; Beauducel, F.; Boissier, P.; Amemoutou, A. Implementation of a Multistation Approach for Automated Event Classification at Piton de la Fournaise Volcano. Seismol. Res. Lett. 2017, 88, 878–891. [Google Scholar] [CrossRef]
- Peng, K.; Tang, Z.; Dong, L.J.; Sun, D.Y. Machine learning based identification of microseismic signals using characteristic parameters. Sensors 2021, 21, 6967. [Google Scholar] [CrossRef]
- Hibert, C.; Malet, J.P.; Bourrier, F.; Provost, F.; Berger, F.; Bornemann, P.; Tardif, P.; Mermin, E. Single-block rockfall dynamics inferred from seismic signal analysis. Earth Surf. Dynam. 2017, 5, 283–292. [Google Scholar] [CrossRef]
- Wenner, M.; Hibert, C.; Meier, L.; Walter, F. Near real-time automated classification of seismic signals of slope failures with continuous random forests. Nat. Hazard. Earth Sys. 2020, 21, 339–361. [Google Scholar] [CrossRef]
- Saritas, M.M.; Yasar, A. Performance analysis of ANN and Naive Bayes classification algorithm for data classification. Int. J. Intell. Syst. Appl. Eng. 2019, 7, 88–91. [Google Scholar] [CrossRef]
- Snoek, J.; Larochelle, H.; Adams, R.P. Practical bayesian optimization of machine learning algorithms. Adv. Neural Inf. Process. Syst. 2012, 25, 2960–2968. [Google Scholar]
- Abdalzaher, M.S.; Moustafa, S.S.R.; Abd-Elnaby, M.; Elwekeil, M. Comparative performance assessments of machine-learning methods for artificial seismic sources discrimination. IEEE Access 2021, 9, 65524–65535. [Google Scholar] [CrossRef]
- Osuna, E.; Freund, R.; Girosi, F. An improved training algorithm for support vector machines. In Neural Networks for Signal Processing VII. 1997 IEEE Signal Processing Society Workshop, Amelia Island, FL, USA, 21–23 July 1997; IEEE: Piscataway, NJ, USA, 1997; pp. 276–285. [Google Scholar] [CrossRef]
- QI, H.N. Support vector machines and application research overview. Comput. Eng. 2004, 30, 6–9. [Google Scholar]
- Noble, W.S. What is a support vector machine? Nat. Biotechnol. 2006, 24, 1565–1567. [Google Scholar] [CrossRef]
- Martinez, A.M.; Kak, A.C. Pca versus lda. IEEE Trans. Pattern Anal. Mach. Intell. 2001, 23, 228–233. [Google Scholar] [CrossRef]
- Jelodar, H.; Wang, Y.L.; Yuan, C.; Feng, X.; Jiang, X.H.; Li, Y.C.; Zhao, L. Latent Dirichlet allocation (LDA) and topic modeling: Models, applications, a survey. Multimed. Tools Appl. 2019, 78, 15169–15211. [Google Scholar] [CrossRef]
- Cramer, G.M.; Ford, R.A.; Hall, R.L. Estimation of toxic hazard—A decision tree approach. Food Cosmet. Toxicol. 1976, 16, 255–276. [Google Scholar] [CrossRef] [PubMed]
- Song, Y.Y.; LU, Y. Decision tree methods: Applications for classification and prediction. Shanghai Arch. Psychiatry 2015, 27, 130. [Google Scholar] [CrossRef] [PubMed]
- Ma, X.L.; Ding, C.; Luan, S.; Wang, Y.; Wang, Y.P. Prioritizing influential factors for freeway incident clearance time prediction using the gradient boosting decision trees method. IEEE Trans. Intell. Transp. Syst. 2017, 18, 2303–2310. [Google Scholar] [CrossRef]
- Chen, T.Q.; Guestrin, C. Xgboost: A scalable tree boosting system. In Proceedings of the 22nd ACM SIGKDD International Conference on Knowledge Discovery and Data Mining, KDD ’16: The 22nd ACM SIGKDD International Conference on Knowledge Discovery and Data Mining, San Francisco, CA, USA, 13–17 August 2016; pp. 785–794. [Google Scholar] [CrossRef]
- Kohavi, R. A study of cross-validation and bootstrap for accuracy estimation and model selection. In Proceedings of the 1995 International Joint Conference on AI, Palais de Congres, Montreal, QC, Canada, 20–25 August 1995. [Google Scholar]
- Wen, B.; Dong, W.H.; Xie, W.J.; Jun, M. Parameter optimization method for random forest based on improved grid search algorithm. Comput. Eng. Appl. 2018, 4, 154–157. [Google Scholar]
- Feng, L.; Pazzi, V.; Intrieri, E.; Gracchi, T.; Gigli, G. Rockfall seismic features analysis based on in situ tests: Frequency, amplitude, and duration. J. Mt. Sci. 2019, 16, 955–970. [Google Scholar] [CrossRef]


| Type of Events | Train Set | Test Set |
|---|---|---|
| HF | 219 | 68 |
| HFS | 176 | 56 |
| HLF | 376 | 84 |
| HLFS | 86 | 23 |
| LF | 1082 | 298 |
| LFS | 177 | 35 |
| N | 1175 | 260 |
| Rockfall | 13 | 3 |
| Machine Learning Algorithm | Mean of Accuracy (%) | Variance |
|---|---|---|
| NB | 67.71 | 12.9 |
| LR | 87.91 | 1.01 |
| SVM | 85.73 | 1.39 |
| LDA | 82.59 | 1.31 |
| PCT | 86.46 | 3.43 |
| DT | 88.75 | 1.29 |
| RF | 93.59 | 0.63 |
| GB | 94.20 | 0.49 |
| XGB | 93.47 | 0.62 |
| LGBM | 94.20 | 0.52 |
| Model | Parameter | Range | Optimal Value |
|---|---|---|---|
| RF | n_estimators | (1, 1000) | 122 |
| max_depth | (1, 40) | 16 | |
| min_samples_leaf | (1, 40) | 1 | |
| min_samples_split | (2, 40) | 19 | |
| max_features | (1, 40) | 33 | |
| criterion | [“gini”, “entropy”] | “gini” | |
| class_weight | [None, “balanced”] | “balanced” | |
| GB | n_estimators | (1, 1000) | 263 |
| learning_rate | [0.1, 0.5, 0.01] | 0.1 | |
| max_depth | (1, 40) | 9 | |
| min_samples_split | (2, 40) | 12 | |
| min_samples_leaf | (1, 40) | 17 | |
| XGB | n_estimators | (1, 1000) | 61 |
| learning_rate | [0.1, 0.5, 0.01] | 0.15 | |
| max_depth | (1, 40) | 6 | |
| min_child_weight | (1, 10) | 5 | |
| gamma | [0.1, 0.2, 0.3, 0.4, 0.5, 0.6, 0.7, 0.8, 0.9, 1.0] | 0.2 | |
| subsample | [0.1, 0.2, 0.3, 0.4, 0.5, 0.6, 0.7, 0.8, 0.9, 1.0] | 1.0 | |
| colsample_bytree | [0.1, 0.2, 0.3, 0.4, 0.5, 0.6, 0.7, 0.8, 0.9, 1.0] | 1.0 | |
| reg_alpha | [0, 0.1, 0.3, 0.5, 0.7, 0.9, 1.0, 1 × 10⁻², 1 × 10⁻³, 1 × 10⁻⁴, 1 × 10⁻⁵] | 1 × 10⁻⁴ | |
| LGBM | n_estimators | (1, 1000) | 131 |
| learning_rate | [0.1, 0.5, 0.01] | 0.1 | |
| max_depth | (1, 40) | 18 | |
| num_leaves | (1, 40) | 31 | |
| min_child_samples | (1,40) | 20 | |
| reg_alpha | [0, 0.1, 0.3, 0.5, 0.7, 0.9, 1.0, 1 × 10⁻², 1 × 10⁻³, 1 × 10⁻⁴, 1 × 10⁻⁵] | 1 × 10⁻³ | |
| reg_lambda | [0, 0.1, 0.3, 0.5, 0.7, 0.9, 1.0, 1 × 10⁻², 1 × 10⁻³, 1 × 10⁻⁴, 1 × 10⁻⁵] | 1 × 10⁻⁵ |
Disclaimer/Publisher’s Note: The statements, opinions and data contained in all publications are solely those of the individual author(s) and contributor(s) and not of MDPI and/or the editor(s). MDPI and/or the editor(s) disclaim responsibility for any injury to people or property resulting from any ideas, methods, instructions or products referred to in the content. |
© 2024 by the authors. Licensee MDPI, Basel, Switzerland. This article is an open access article distributed under the terms and conditions of the Creative Commons Attribution (CC BY) license (https://creativecommons.org/licenses/by/4.0/).
Share and Cite
Xin, B.; Huang, Z.; Huang, S.; Feng, L. Ensemble Learning Improves the Efficiency of Microseismic Signal Classification in Landslide Seismic Monitoring. Sensors 2024, 24, 4892. https://doi.org/10.3390/s24154892
Xin B, Huang Z, Huang S, Feng L. Ensemble Learning Improves the Efficiency of Microseismic Signal Classification in Landslide Seismic Monitoring. Sensors. 2024; 24(15):4892. https://doi.org/10.3390/s24154892
Chicago/Turabian StyleXin, Bingyu, Zhiyong Huang, Shijie Huang, and Liang Feng. 2024. "Ensemble Learning Improves the Efficiency of Microseismic Signal Classification in Landslide Seismic Monitoring" Sensors 24, no. 15: 4892. https://doi.org/10.3390/s24154892
APA StyleXin, B., Huang, Z., Huang, S., & Feng, L. (2024). Ensemble Learning Improves the Efficiency of Microseismic Signal Classification in Landslide Seismic Monitoring. Sensors, 24(15), 4892. https://doi.org/10.3390/s24154892