
Sitting Pressure Measurements in Wheelchair Users—Can the Effects of Daily Relief Activities Be Depicted?


Abstract
1. Introduction
2. Materials and Methods
2.1. Participants
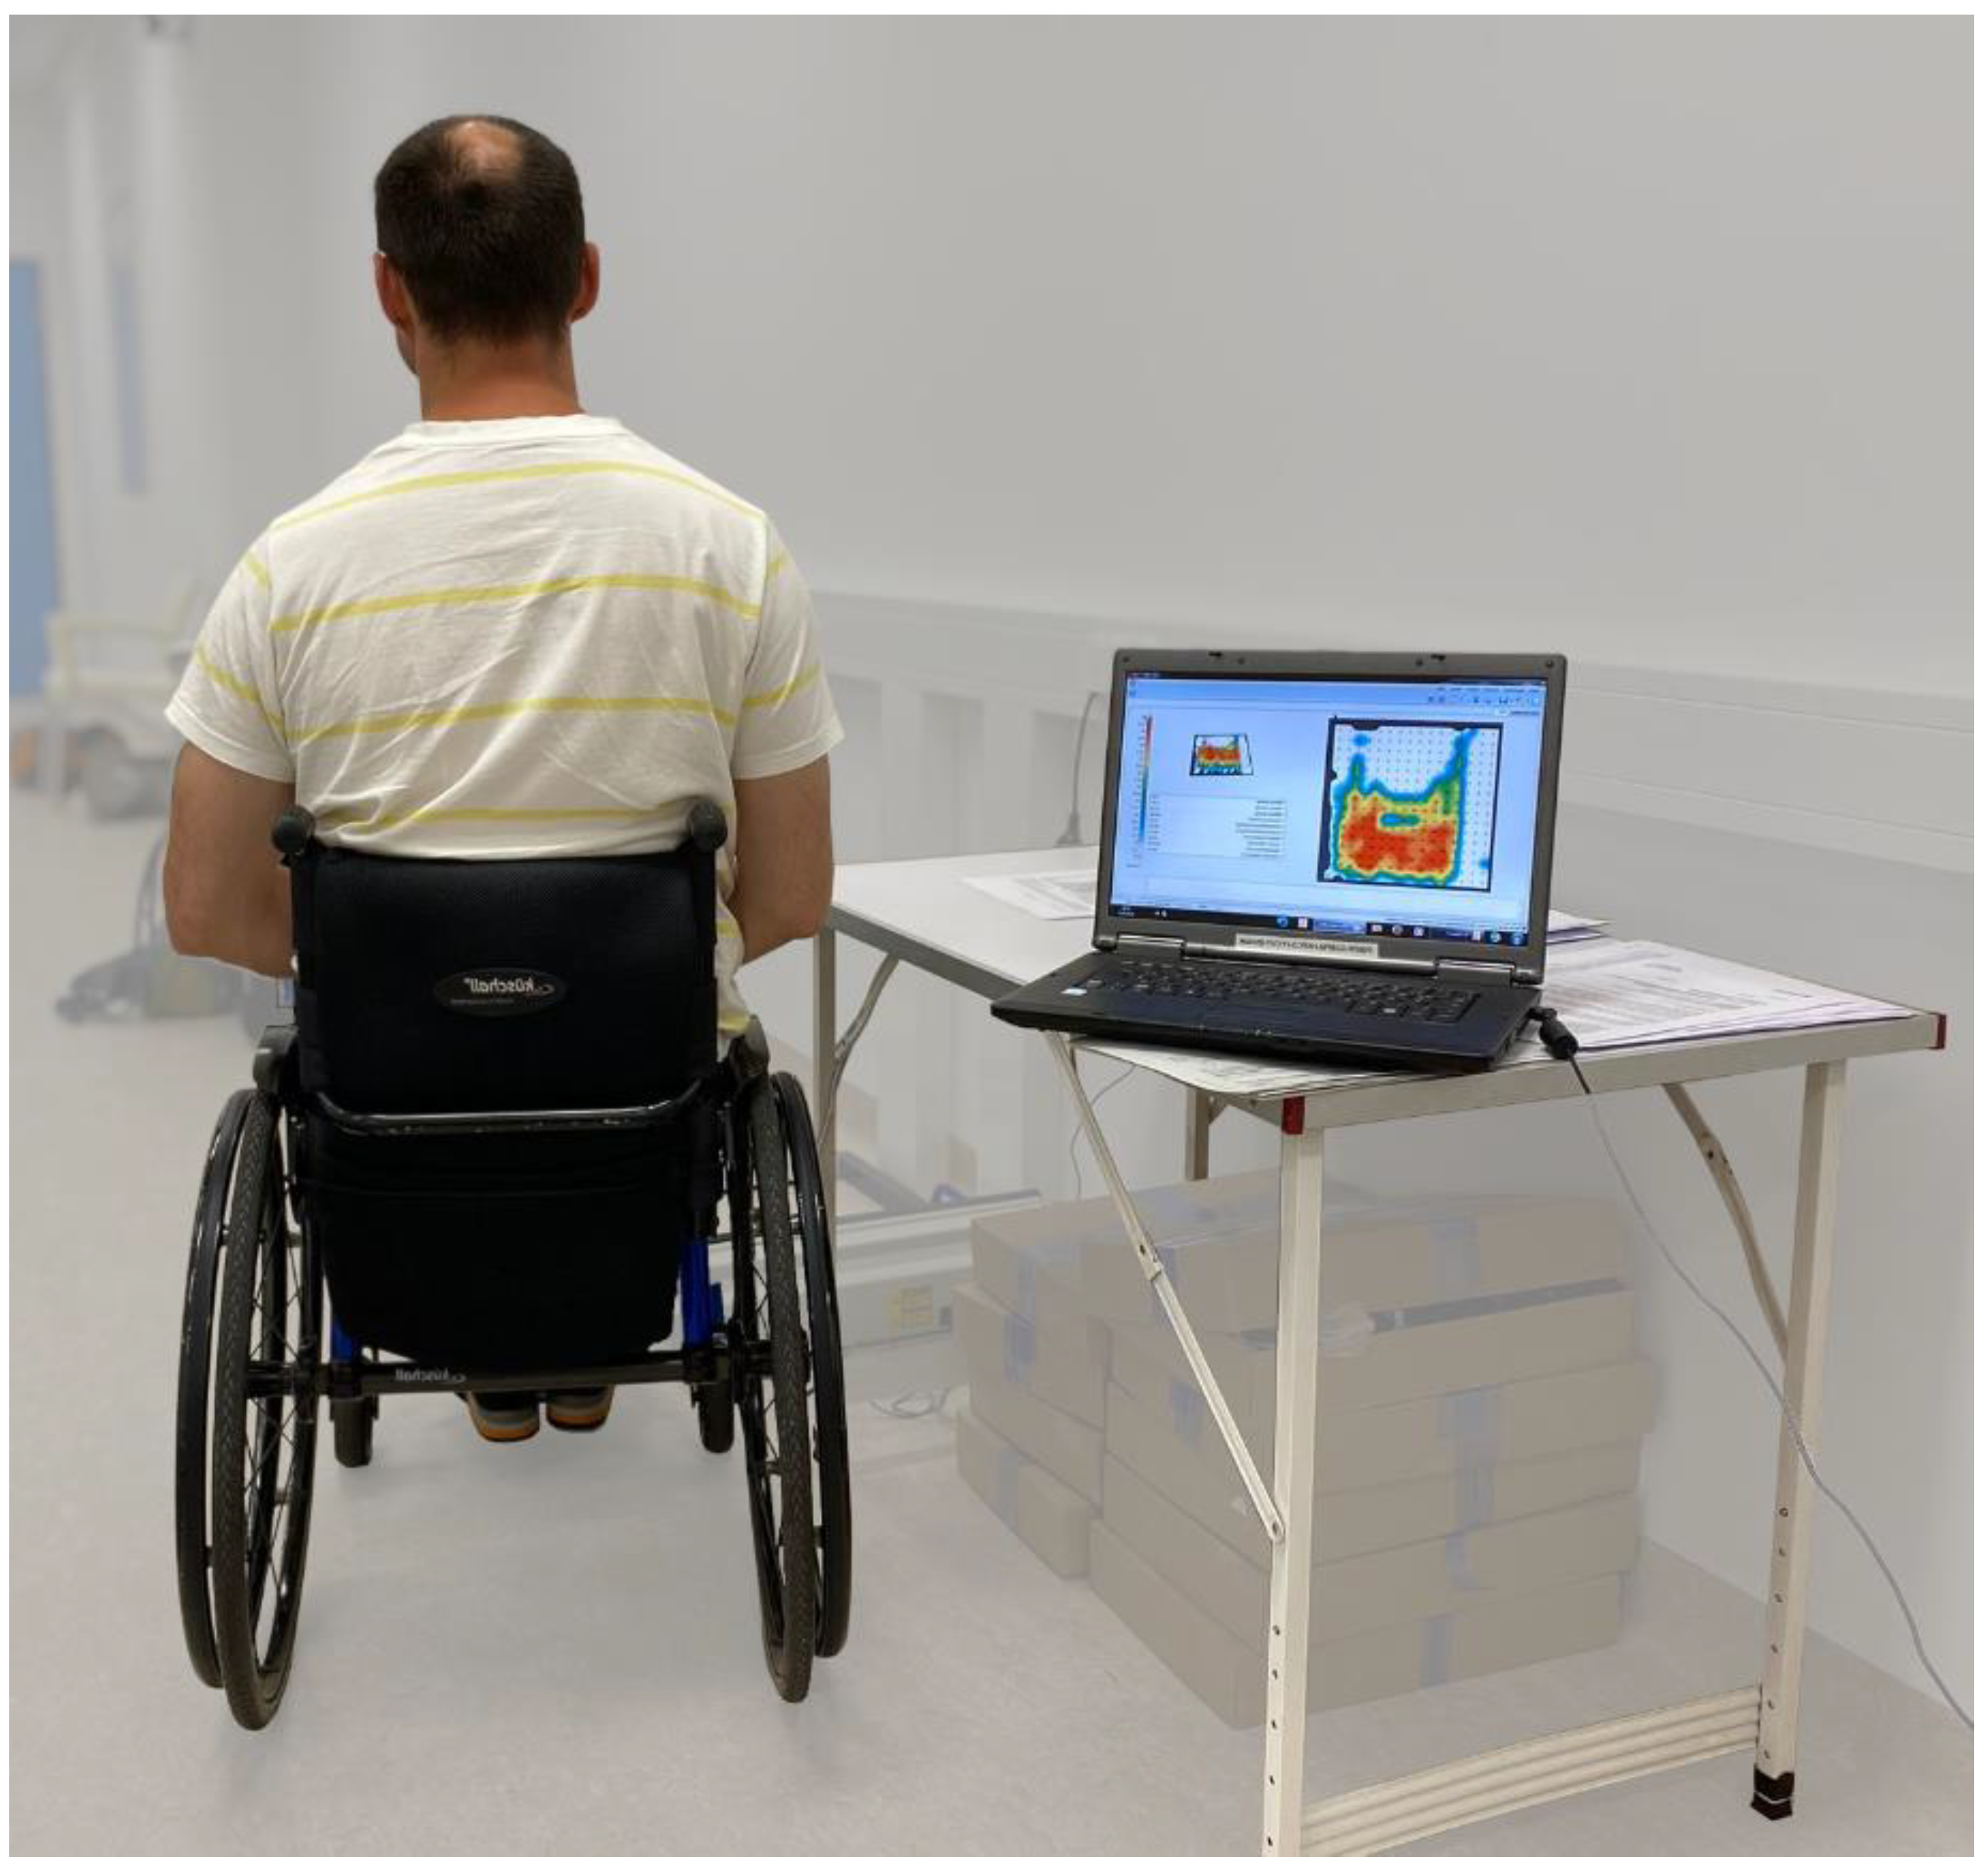
2.2. Measurements
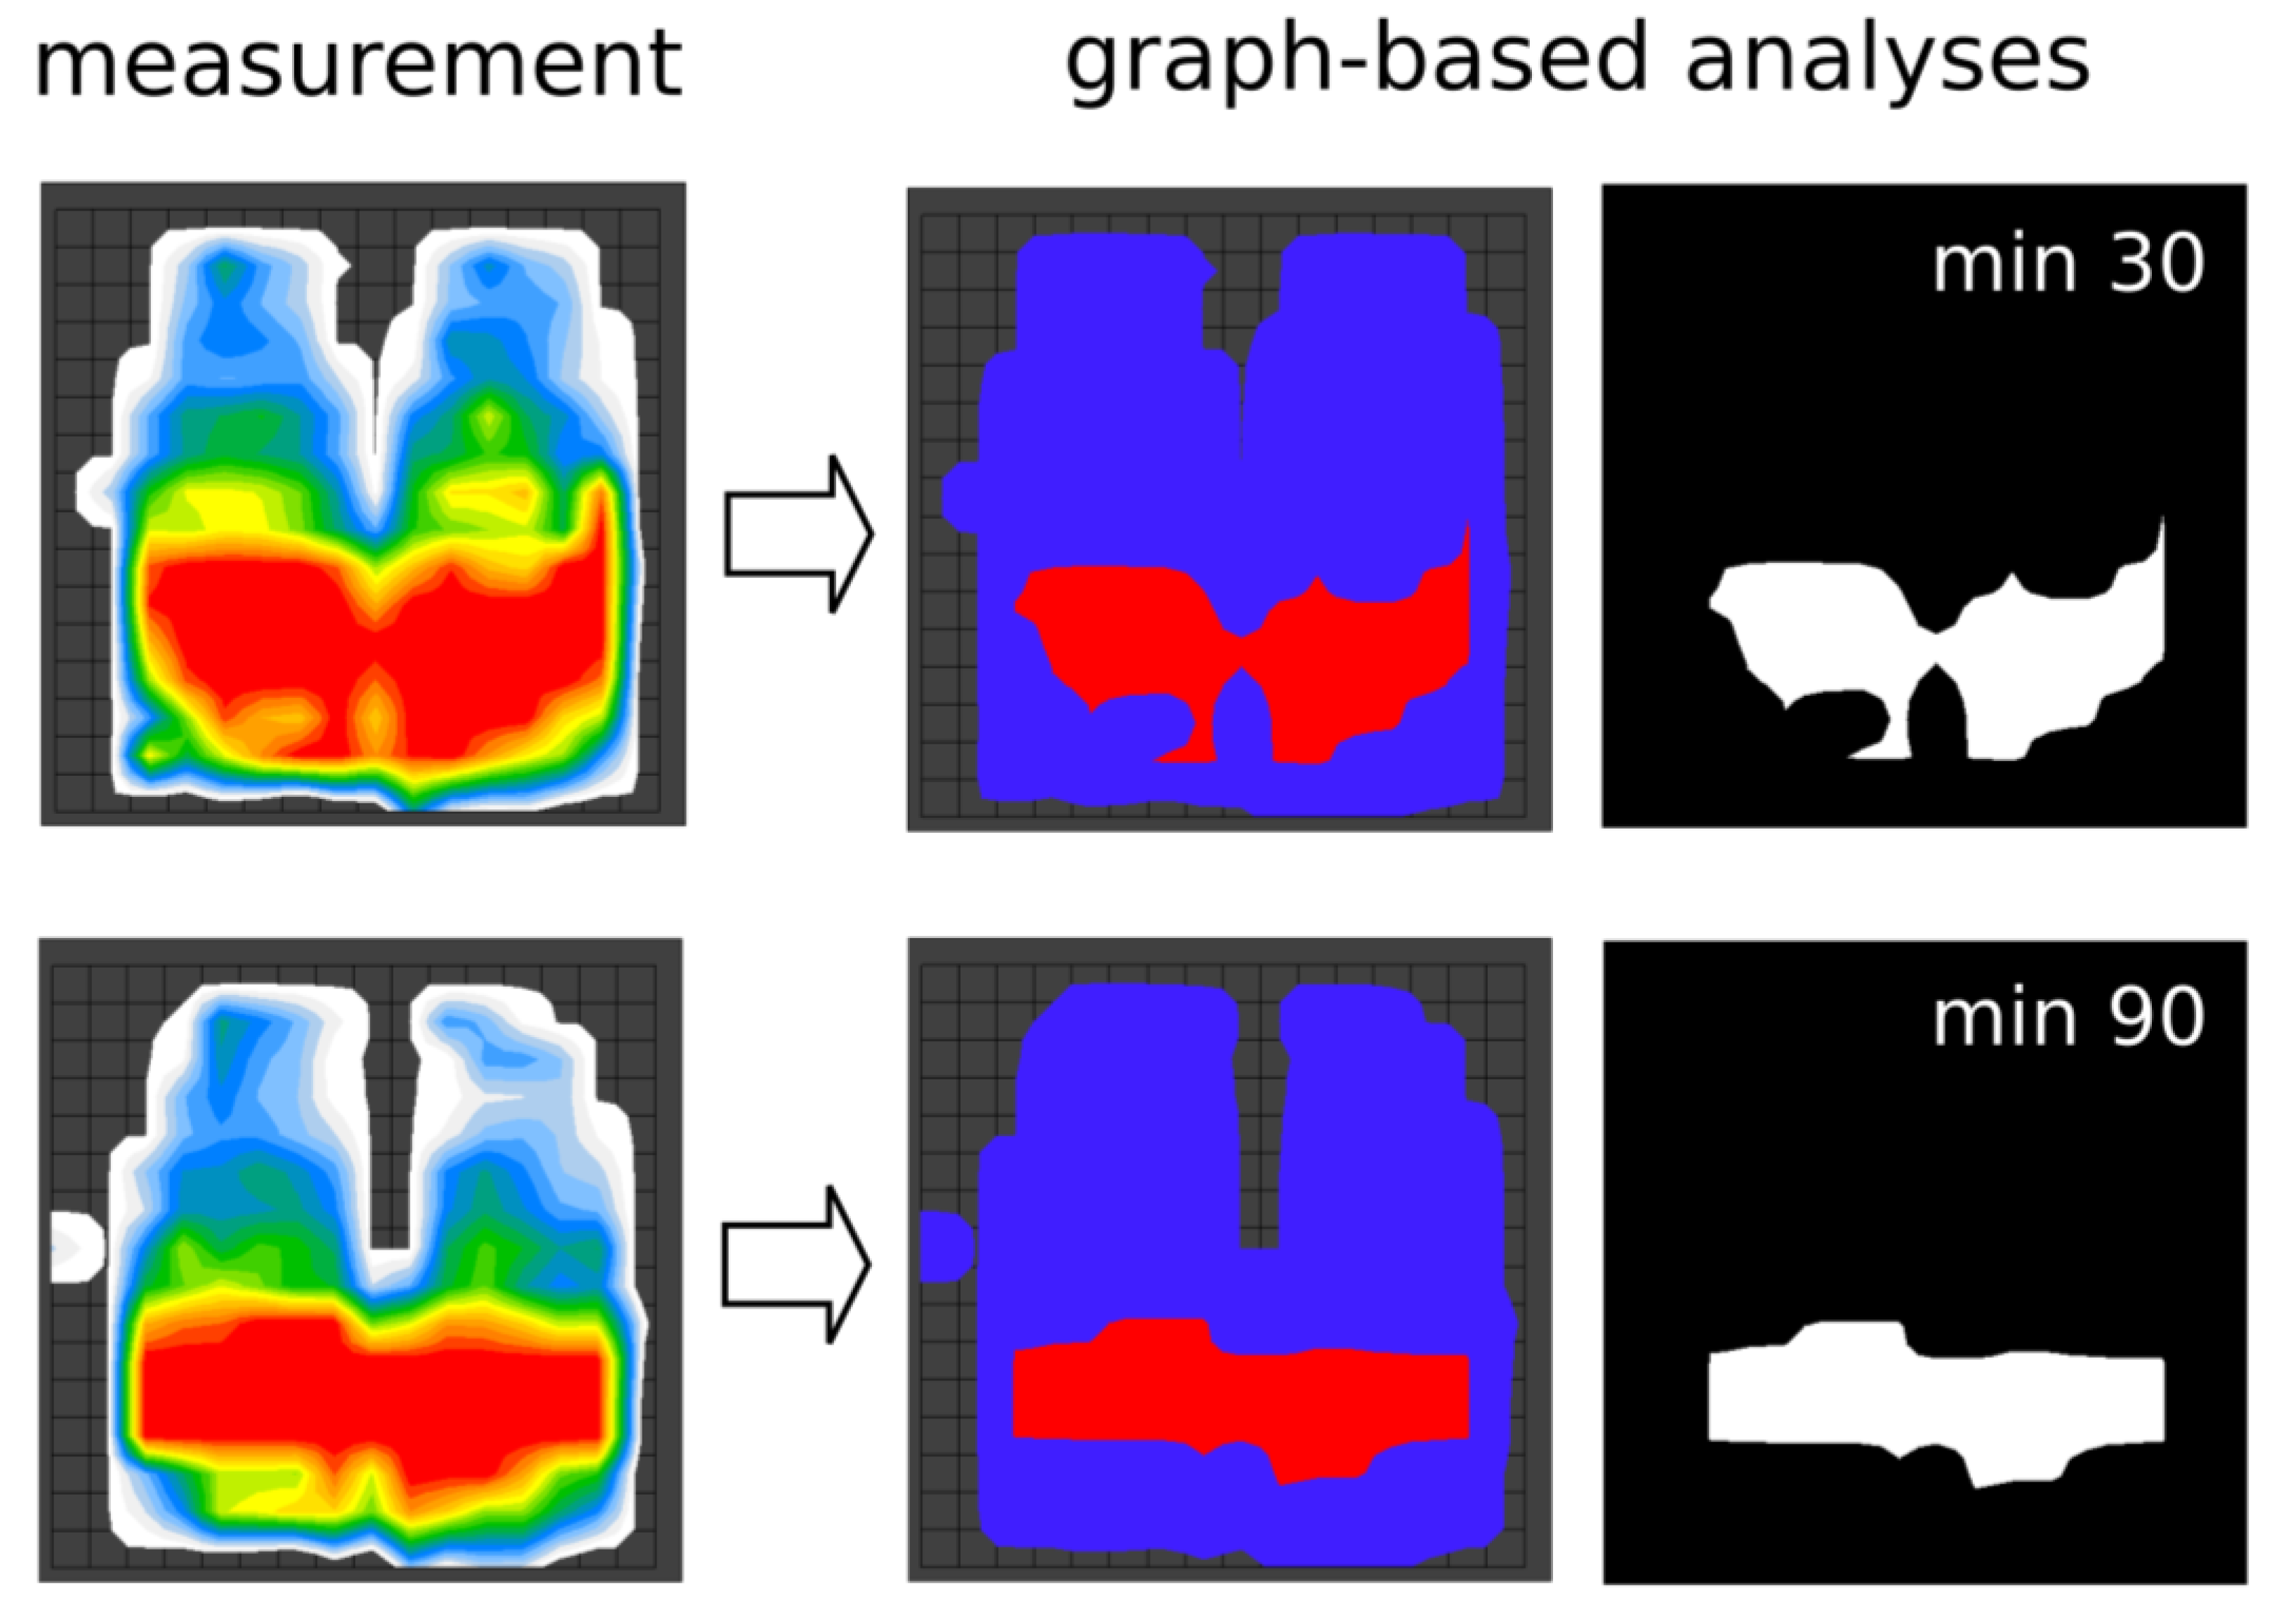
2.3. Data Processing
2.4. Statistical Analyses
3. Results
4. Discussion
5. Conclusions
Author Contributions
Funding
Institutional Review Board Statement
Informed Consent Statement
Data Availability Statement
Acknowledgments
Conflicts of Interest
References
- Regan, M.A.; Teasell, R.W.; Wolfe, D.L.; Keast, D.; Mortenson, W.B.; Aubut, J.A.L.; Spinal Cord Injury Rehabilitation Evidence Research Team. A systematic review of therapeutic interventions for pressure ulcers after spinal cord injury. Arch. Phys. Med. Rehabil. 2009, 90, 213–231. [Google Scholar] [CrossRef]
- Regan, M.; Teasell, R.W.; Keast, D.; Aubut, J.L.; Foulon, B.L.; Mehta, S. Pressure Ulcers following Spinal Cord Injury. Spinal Cord Injury Rehabilitation Evidence. 2010. Version 3. Available online: https://www.researchgate.net/profile/Robert-Teasell/publication/265027345_Pressure_Ulcers_Following_Spinal_Cord_Injury/links/547f64920cf2ccc7f8b92048/Pressure-Ulcers-Following-Spinal-Cord-Injury.pdf (accessed on 6 June 2024).
- Gelis, A.; Dupeyron, A.; Legros, P.; Benaim, C.; Pelissier, J.; Fattal, C. Pressure ulcer risk factors in persons with spinal cord injury part 2: The chronic stage. Spinal Cord 2009, 47, 651–661. [Google Scholar] [CrossRef]
- Gutierrez, E.M.; Alm, M.; Hultling, C.; Saraste, H. Measuring seating pressure, area, and asymmetry in persons with spinal cord injury. Eur. Spine J. 2004, 13, 374–379. [Google Scholar] [CrossRef]
- Sprigle, S.; Sonenblum, S. Assessing evidence supporting redistribution of pressure for pressure ulcer prevention: A review. J. Rehabil. Res. Dev. 2011, 48, 203–213. [Google Scholar] [CrossRef]
- Stockton, L.; Rithalia, S. Is dynamic seating a modality worth considering in the prevention of pressure ulcers? J. Tissue Viability 2008, 17, 15–21. [Google Scholar] [CrossRef]
- Carrigan, W.; Nuthi, P.; Pande, C.; Wijesundara, M.B.; Chung, C.S.; Grindle, G.G.; Brown, J.D.; Gebrosky, B.; Cooper, R.A. Design and operation verification of an automated pressure mapping and modulating seat cushion for pressure ulcer prevention. Med. Eng. Phys. 2019, 69, 17–27. [Google Scholar] [CrossRef]
- Mannella, D.; Bellusci, M.; Graziani, F.; Ferraresi, C.; Muscolo, G.G. Modelling, design and control of a new seat-cushion for pressure ulcers prevention. Proc. Inst. Mech. Eng. Part H J. Eng. Med. 2022, 236, 592–602. [Google Scholar] [CrossRef]
- Stinson, M.; Schofield, R.; Gillan, C.; Morton, J.; Gardner, E.; Sprigle, S.; Porter-Armstrong, A. Spinal cord injury and pressure ulcer prevention: Using functional activity in pressure relief. Nurs. Res. Pract. 2013, 2013, 860396. [Google Scholar] [CrossRef]
- Stinson, M.; Porter, A.; Eakin, P. Measuring interface pressure: A laboratory-based investigation into the effects of repositioning and sitting. Am. J. Occup. Ther. 2002, 56, 185–190. [Google Scholar] [CrossRef]
- Stinson, M.D.; Porter-Armstrong, A.P.; Eakin, P.A. Pressure mapping systems: Reliability of pressure map interpretation. Clin. Rehabil. 2003, 17, 504–511. [Google Scholar] [CrossRef]
- Eitzen, I. Pressure mapping in seating: A frequency analysis approach. Arch. Phys. Med. Rehabil. 2004, 85, 1136–1140. [Google Scholar] [CrossRef]
- Sprigle, S.; Sonenblum, S.E.; Feng, C. Pressure redistributing in-seat movement activities by persons with spinal cord injury over multiple epochs. PLoS ONE 2019, 14, e0210978. [Google Scholar] [CrossRef]
- Sonenblum, S.E.; Sprigle, S.H.; Martin, J.S. Everyday sitting behavior of full-time wheelchair users. J. Rehabil. Res. Dev. 2016, 53, 585–598. [Google Scholar] [CrossRef]
- Ho, C.; Ocampo, W.; Southern, D.A.; Sola, D.; Baylis, B.; Conly, J.M.; Hogan, D.B.; Kaufman, J.; Stelfox, H.T.; Ghali, W.A. Effect of a Continuous Bedside Pressure Mapping System for Reducing Interface Pressures: A Randomized Clinical Trial. JAMA Netw. Open 2023, 6, e2316480. [Google Scholar] [CrossRef] [PubMed]
- Wong, H.; Kaufman, J.; Baylis, B.; Conly, J.M.; Hogan, D.B.; Stelfox, H.T.; Southern, D.A.; Ghali, W.A.; Ho, C.H. Efficacy of a pressure-sensing mattress cover system for reducing interface pressure: Study protocol for a randomized controlled trial. Trials 2015, 16, 434. [Google Scholar] [CrossRef]
- Behrendt, R.; Ghaznavi, A.M.; Mahan, M.; Craft, S.; Siddiqui, A. Continuous bedside pressure mapping and rates of hospital-associated pressure ulcers in a medical intensive care unit. Am. J. Crit. Care 2014, 23, 127–133. [Google Scholar] [CrossRef] [PubMed]
- Oette, C.; Müller, R.; Schreff, L.; Abel, R. How Do Everyday Life Activities Affect Seating Pressure Measurements? Int. J. Spine Surg. 2023, 17, 698–705. [Google Scholar] [CrossRef] [PubMed]
- Childs, B.R.; Moore, T.A.; Como, J.J.; Vallier, H.A. American spinal injury association impairment scale predicts the need for tracheostomy after cervical spinal cord injury. Spine 2015, 40, 1407–1413. [Google Scholar] [CrossRef]
- Dattoli, S.; Colucci, M.; Soave, M.G.; De Santis, R.; Segaletti, L.; Corsi, C.; Tofani, M.; Valente, D.; Galeoto, G. Evaluation of pelvis postural systems in spinal cord injury patients: Outcome research. J. Spinal Cord Med. 2020, 43, 185–192. [Google Scholar] [CrossRef]
- de Mare, L.; de Groot, B.; de Koning, F.; Geers, R.; Tetteroo, D. The influence of a contoured seating base on pressure distribution and discomfort. Disabil. Rehabil. Assist. Technol. 2023, 18, 1–7. [Google Scholar] [CrossRef]
- Maurer, C.L.; Sprigle, S. Effect of seat inclination on seated pressures of individuals with spinal cord injury. Phys. Ther. 2004, 84, 255–261. [Google Scholar] [CrossRef] [PubMed]
- Sprigle, S.; Dunlop, W.; Press, L. Reliability of bench tests of interface pressure. Assist. Technol. 2003, 15, 49–57. [Google Scholar] [CrossRef]
- Crawford, S.A.; Stinson, M.D.; Walsh, D.M.; Porter-Armstrong, A.P. Impact of sitting time on seat-interface pressure and on pressure mapping with multiple sclerosis patients. Arch. Phys. Med. Rehabil. 2005, 86, 1221–1225. [Google Scholar] [CrossRef] [PubMed]

| Active Participants (N = 24) | Inactive Participants (N = 9) | |
|---|---|---|
| weight | 73.4 ± 17.2 | 78.0 ± 24.5 |
| size | 173.2 ± 12.0 | 177.4 ± 8.5 |
| age | 45.3 ± 18.4 | 54.2 ± 12.5 |
| sex | 20 male/4 female | 7 male/2 female |
| cervical spine lesion | NA | 8 incomplete/1 complete |
| thoracic spine lesion | 10 incomplete/12 complete | NA |
| lumbar spine lesion | 1 incomplete/1 complete | NA |
| ASIA Scale 1 | 13 A/1 B/6 C/4 D | 1 A/2 B/4 C/2 D |
| decubitus ulcer in the past | 15 no/9 yes | 3 no/6 yes |
| Parameter of the Pressure Mat | |||
|---|---|---|---|
| min 30 | min 90 | ||
| pressure-loaded measurement area (m2) | all participants | 0.129 ± 0.029 | 0.129 ± 0.030 |
| active participants | 0.130 ± 0.030 | 0.128 ± 0.031 | |
| inactive participants | 0.126 ± 0.027 | 0.132 ± 0.028 | |
| Parameter of graph-based analyses | |||
| min 30 | min 90 | ||
| pressure-loaded measurement area (m2) | all participants | 0.161 ± 0.031 | 0.161 ± 0.031 |
| active participants | 0.162 ± 0.033 | 0.160 ± 0.034 | |
| inactive participants | 0.158 ± 0.026 | 0.163 ± 0.026 | |
| area of maximum pressure (m2) | all participants | 0.021 ± 0.014 | 0.023 ± 0.017 |
| active participants | 0.023 ± 0.015 | 0.021 ± 0.017 | |
| inactive participants | 0.015 ± 0.011 | 0.028 ± 0.018 | |
| pressure–area ratio | all participants | 13.31 ± 8.36 | 13.89 ± 9.71 |
| active participants | 13.92 ± 8.95 | 12.44 ± 9.22 | |
| inactive participants | 11.68 ± 6.75 | 17.77 ± 10.47 * | |
Disclaimer/Publisher’s Note: The statements, opinions and data contained in all publications are solely those of the individual author(s) and contributor(s) and not of MDPI and/or the editor(s). MDPI and/or the editor(s) disclaim responsibility for any injury to people or property resulting from any ideas, methods, instructions or products referred to in the content. |
© 2024 by the authors. Licensee MDPI, Basel, Switzerland. This article is an open access article distributed under the terms and conditions of the Creative Commons Attribution (CC BY) license (https://creativecommons.org/licenses/by/4.0/).
Share and Cite
Müller, R.; Oette, C.; Oette, C.; Schreff, L.; Abel, R. Sitting Pressure Measurements in Wheelchair Users—Can the Effects of Daily Relief Activities Be Depicted? Sensors 2024, 24, 3806. https://doi.org/10.3390/s24123806
Müller R, Oette C, Oette C, Schreff L, Abel R. Sitting Pressure Measurements in Wheelchair Users—Can the Effects of Daily Relief Activities Be Depicted? Sensors. 2024; 24(12):3806. https://doi.org/10.3390/s24123806
Chicago/Turabian StyleMüller, Roy, Clara Oette, Cedric Oette, Lucas Schreff, and Rainer Abel. 2024. "Sitting Pressure Measurements in Wheelchair Users—Can the Effects of Daily Relief Activities Be Depicted?" Sensors 24, no. 12: 3806. https://doi.org/10.3390/s24123806
APA StyleMüller, R., Oette, C., Oette, C., Schreff, L., & Abel, R. (2024). Sitting Pressure Measurements in Wheelchair Users—Can the Effects of Daily Relief Activities Be Depicted? Sensors, 24(12), 3806. https://doi.org/10.3390/s24123806