
Vision-Based Estimation of Force Balance of Near-Suspended Melt Pool for Drooping and Collapsing Prediction

 ,
, 

 and
and
Abstract
1. Introduction
2. Methods
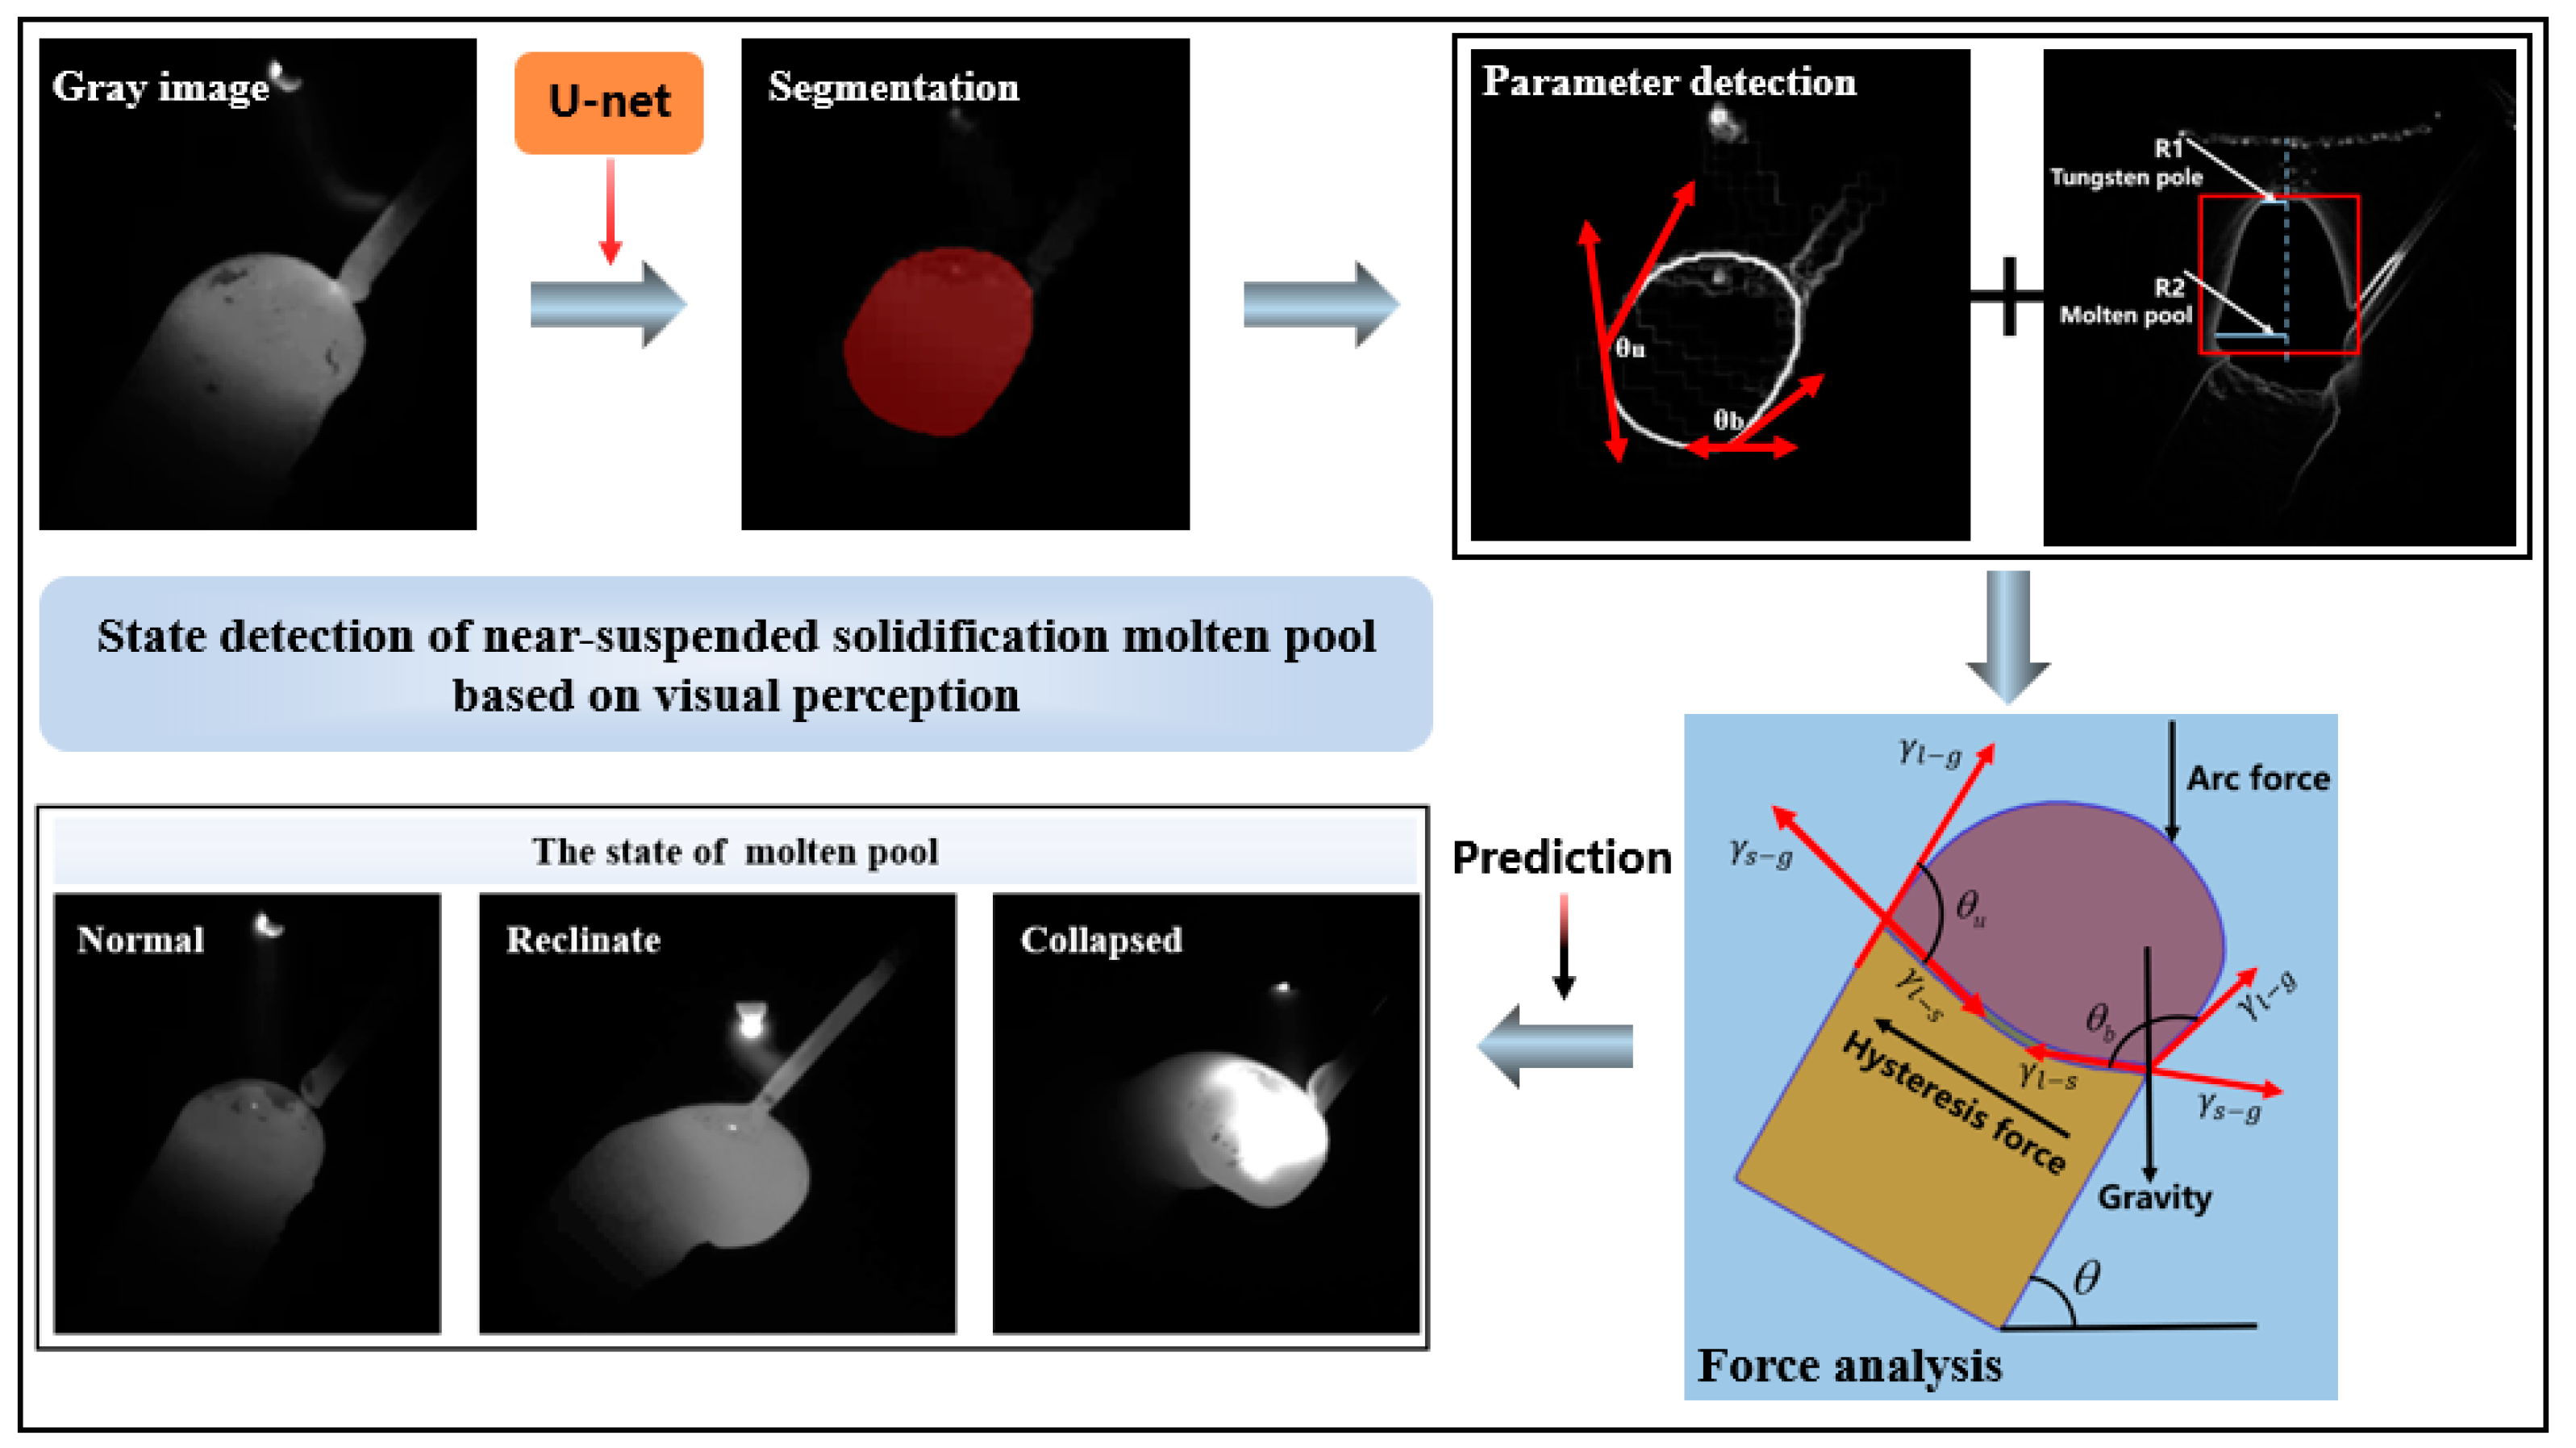
2.1. Principle
2.2. Image Segmentation of the Melt Pool
2.2.1. Image Processing
2.2.2. Dataset
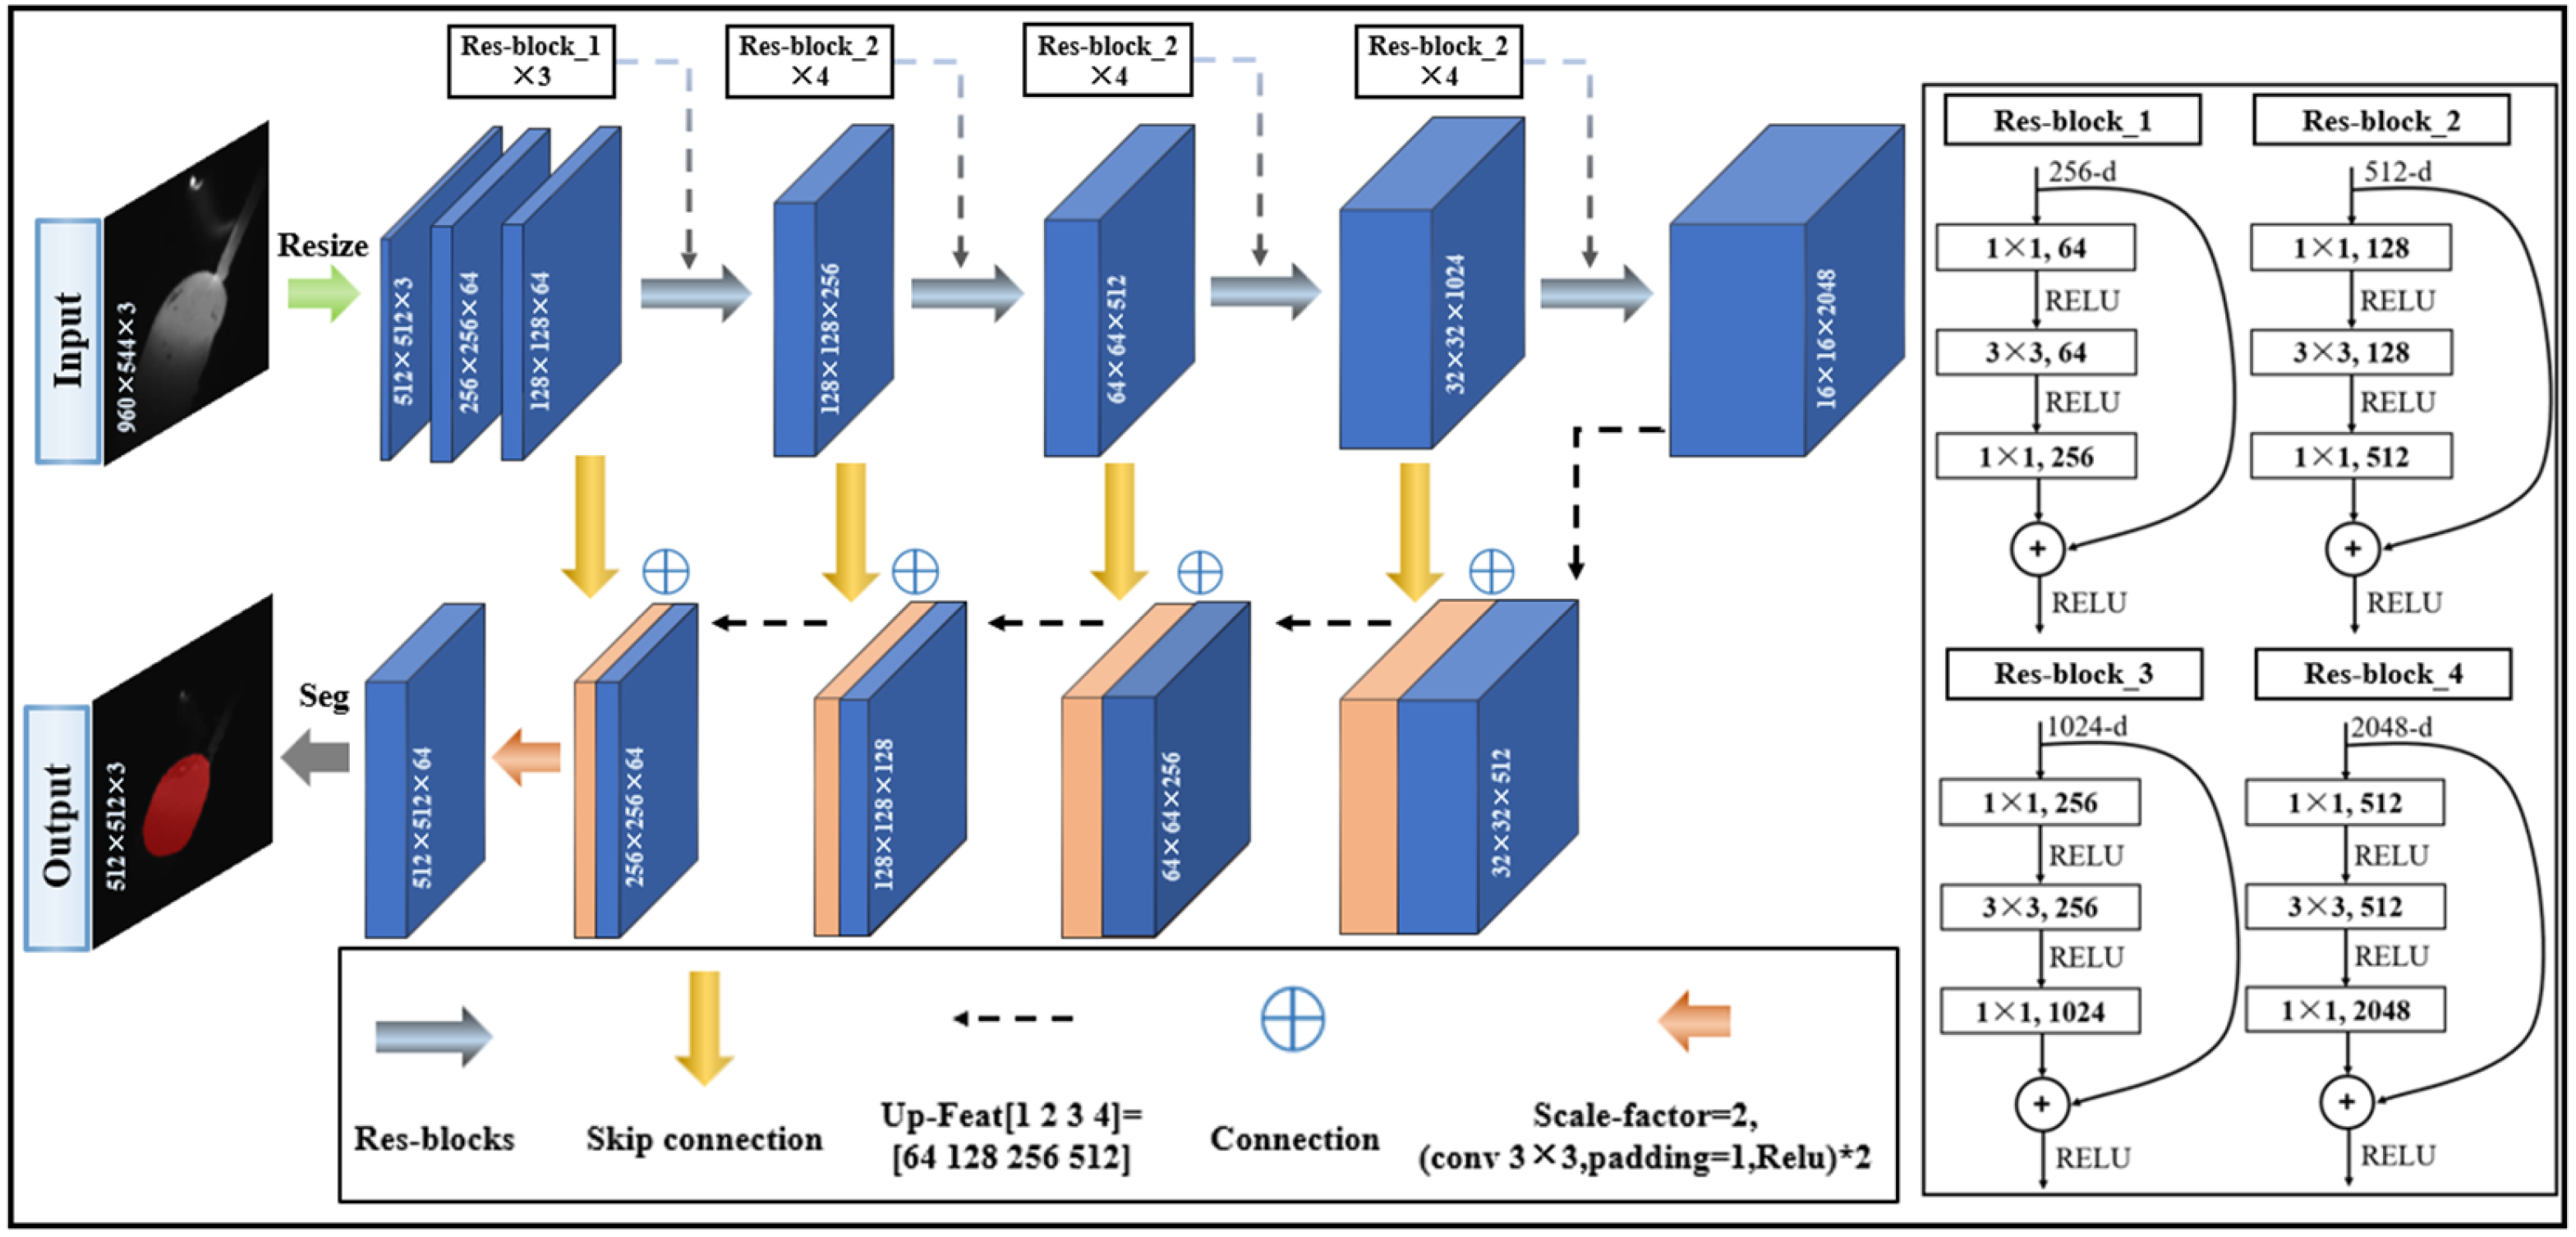
2.2.3. Structure of the Network
2.2.4. Model Training and Testing
2.3. Force Balance Estimation for Melt Pool
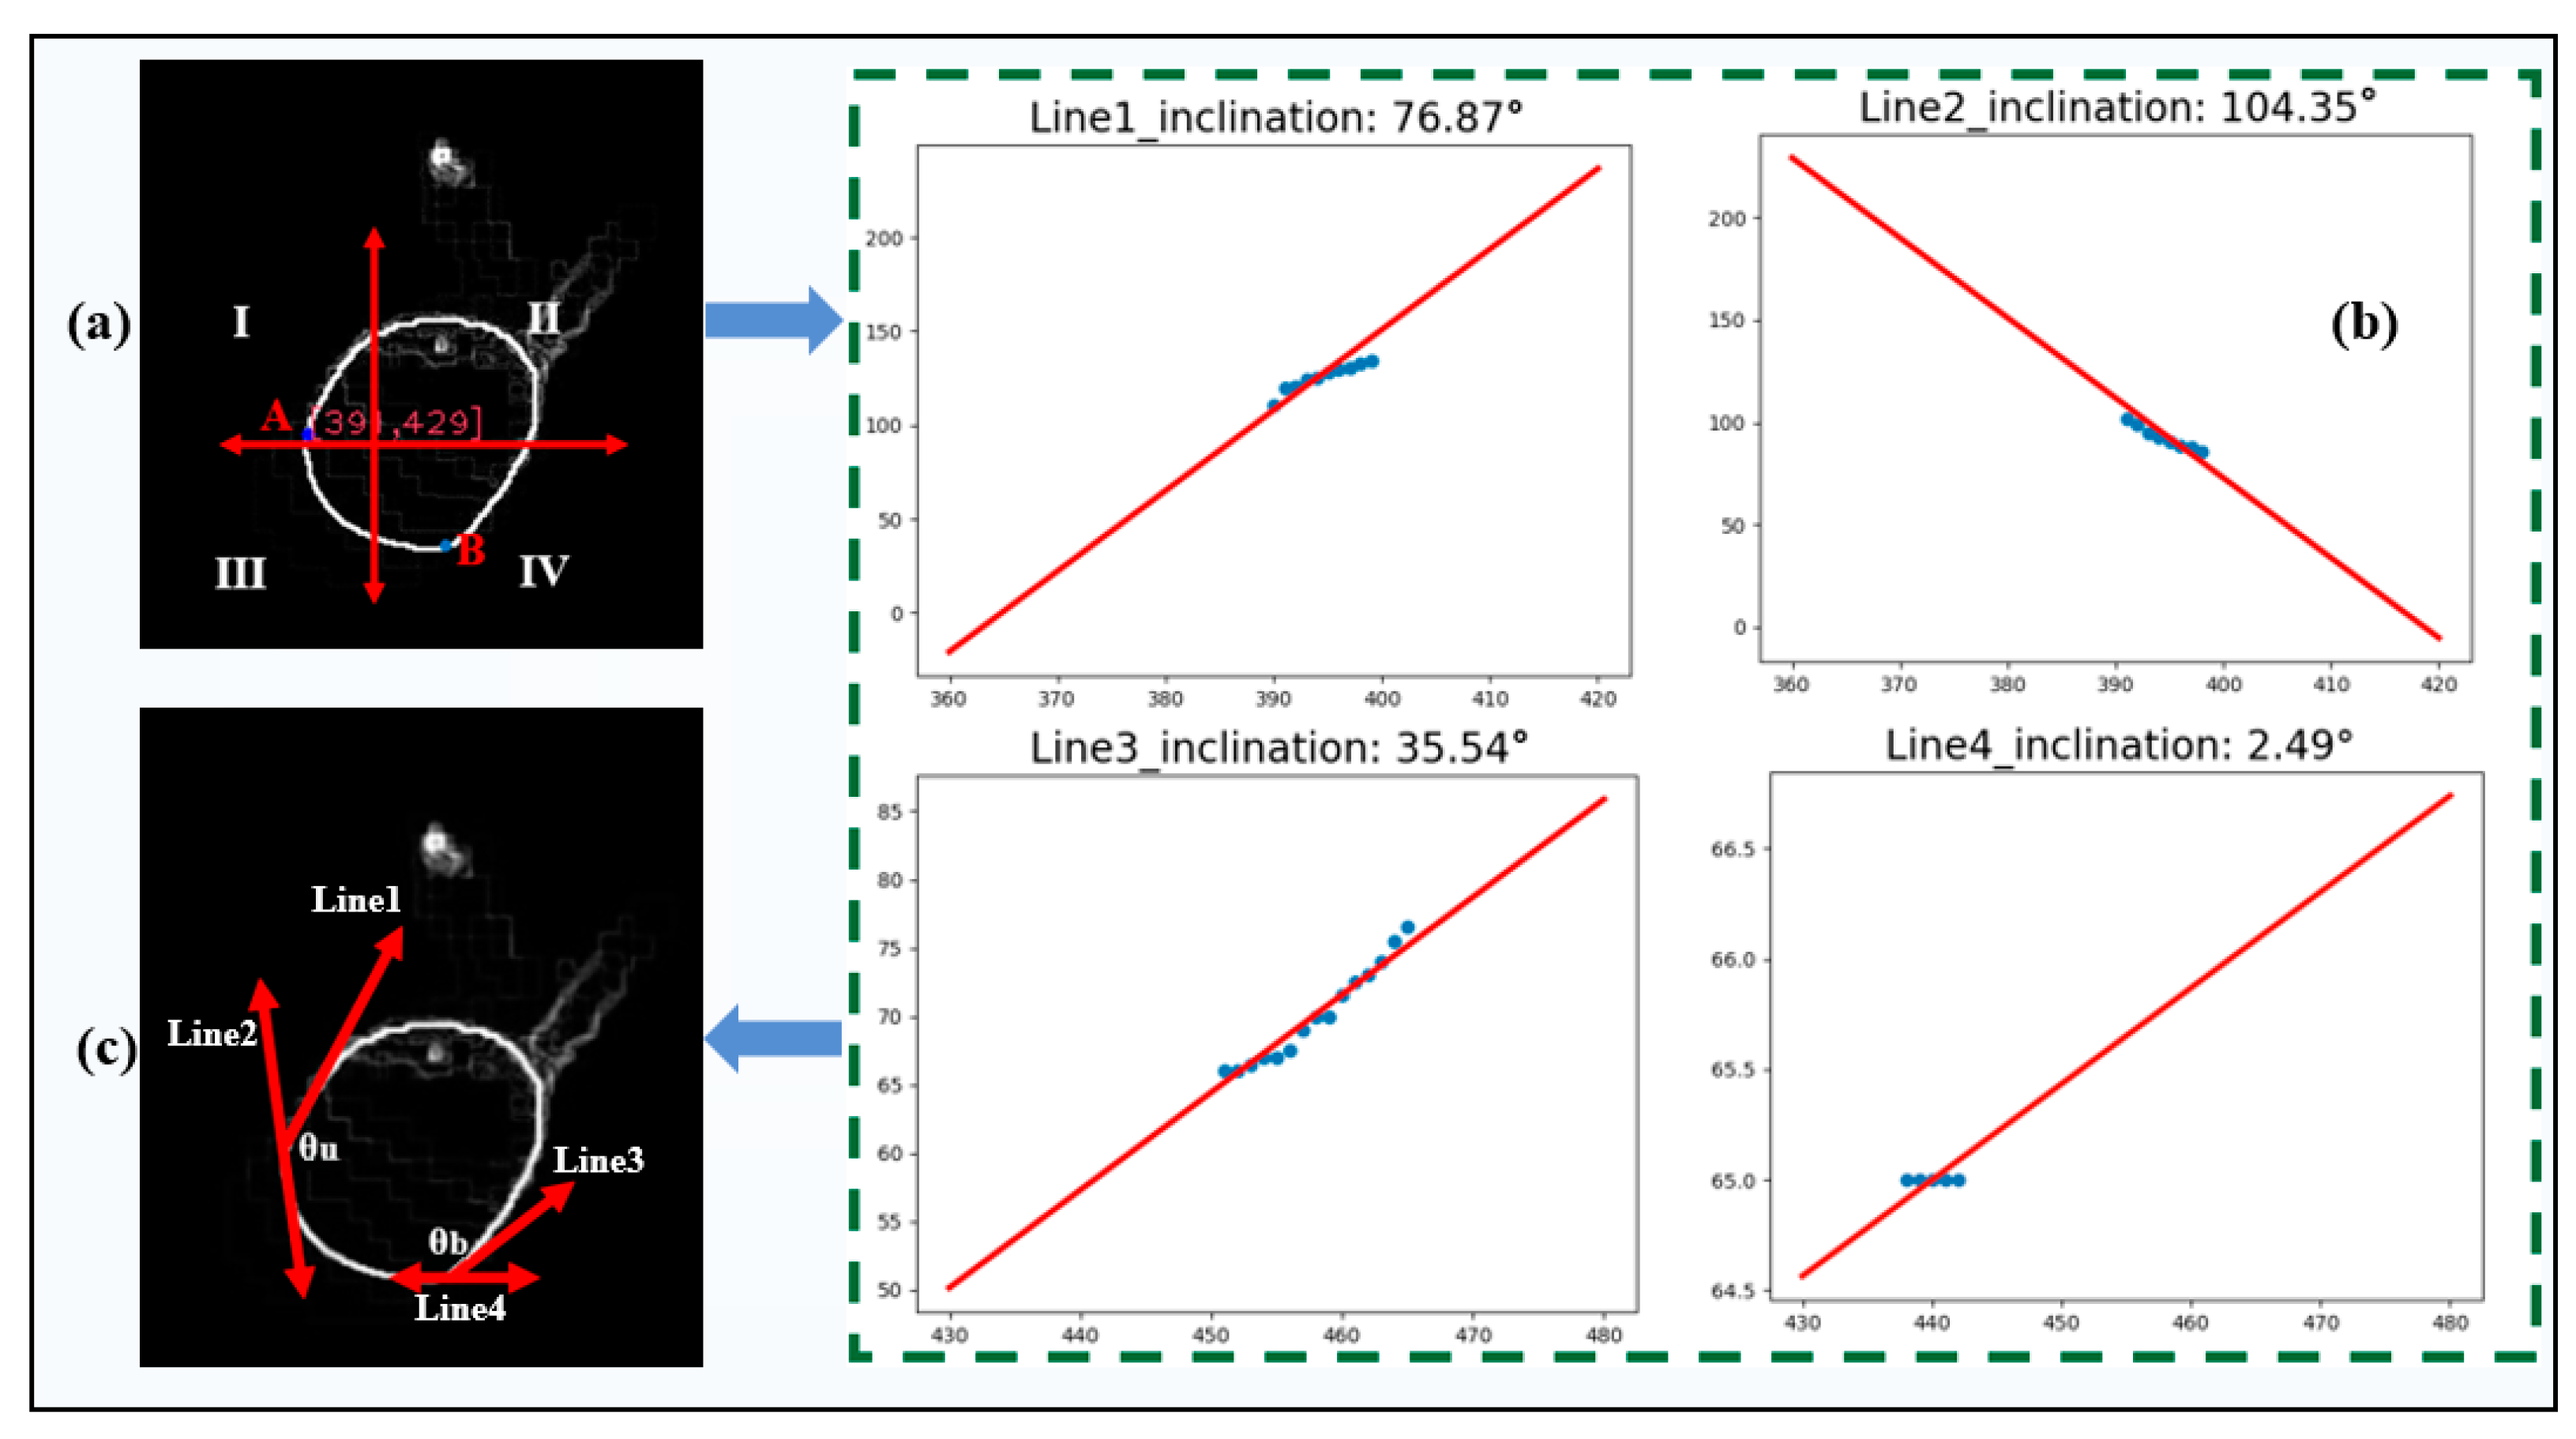
2.3.1. Contact Angle Estimation
2.3.2. Arc Radius Detection
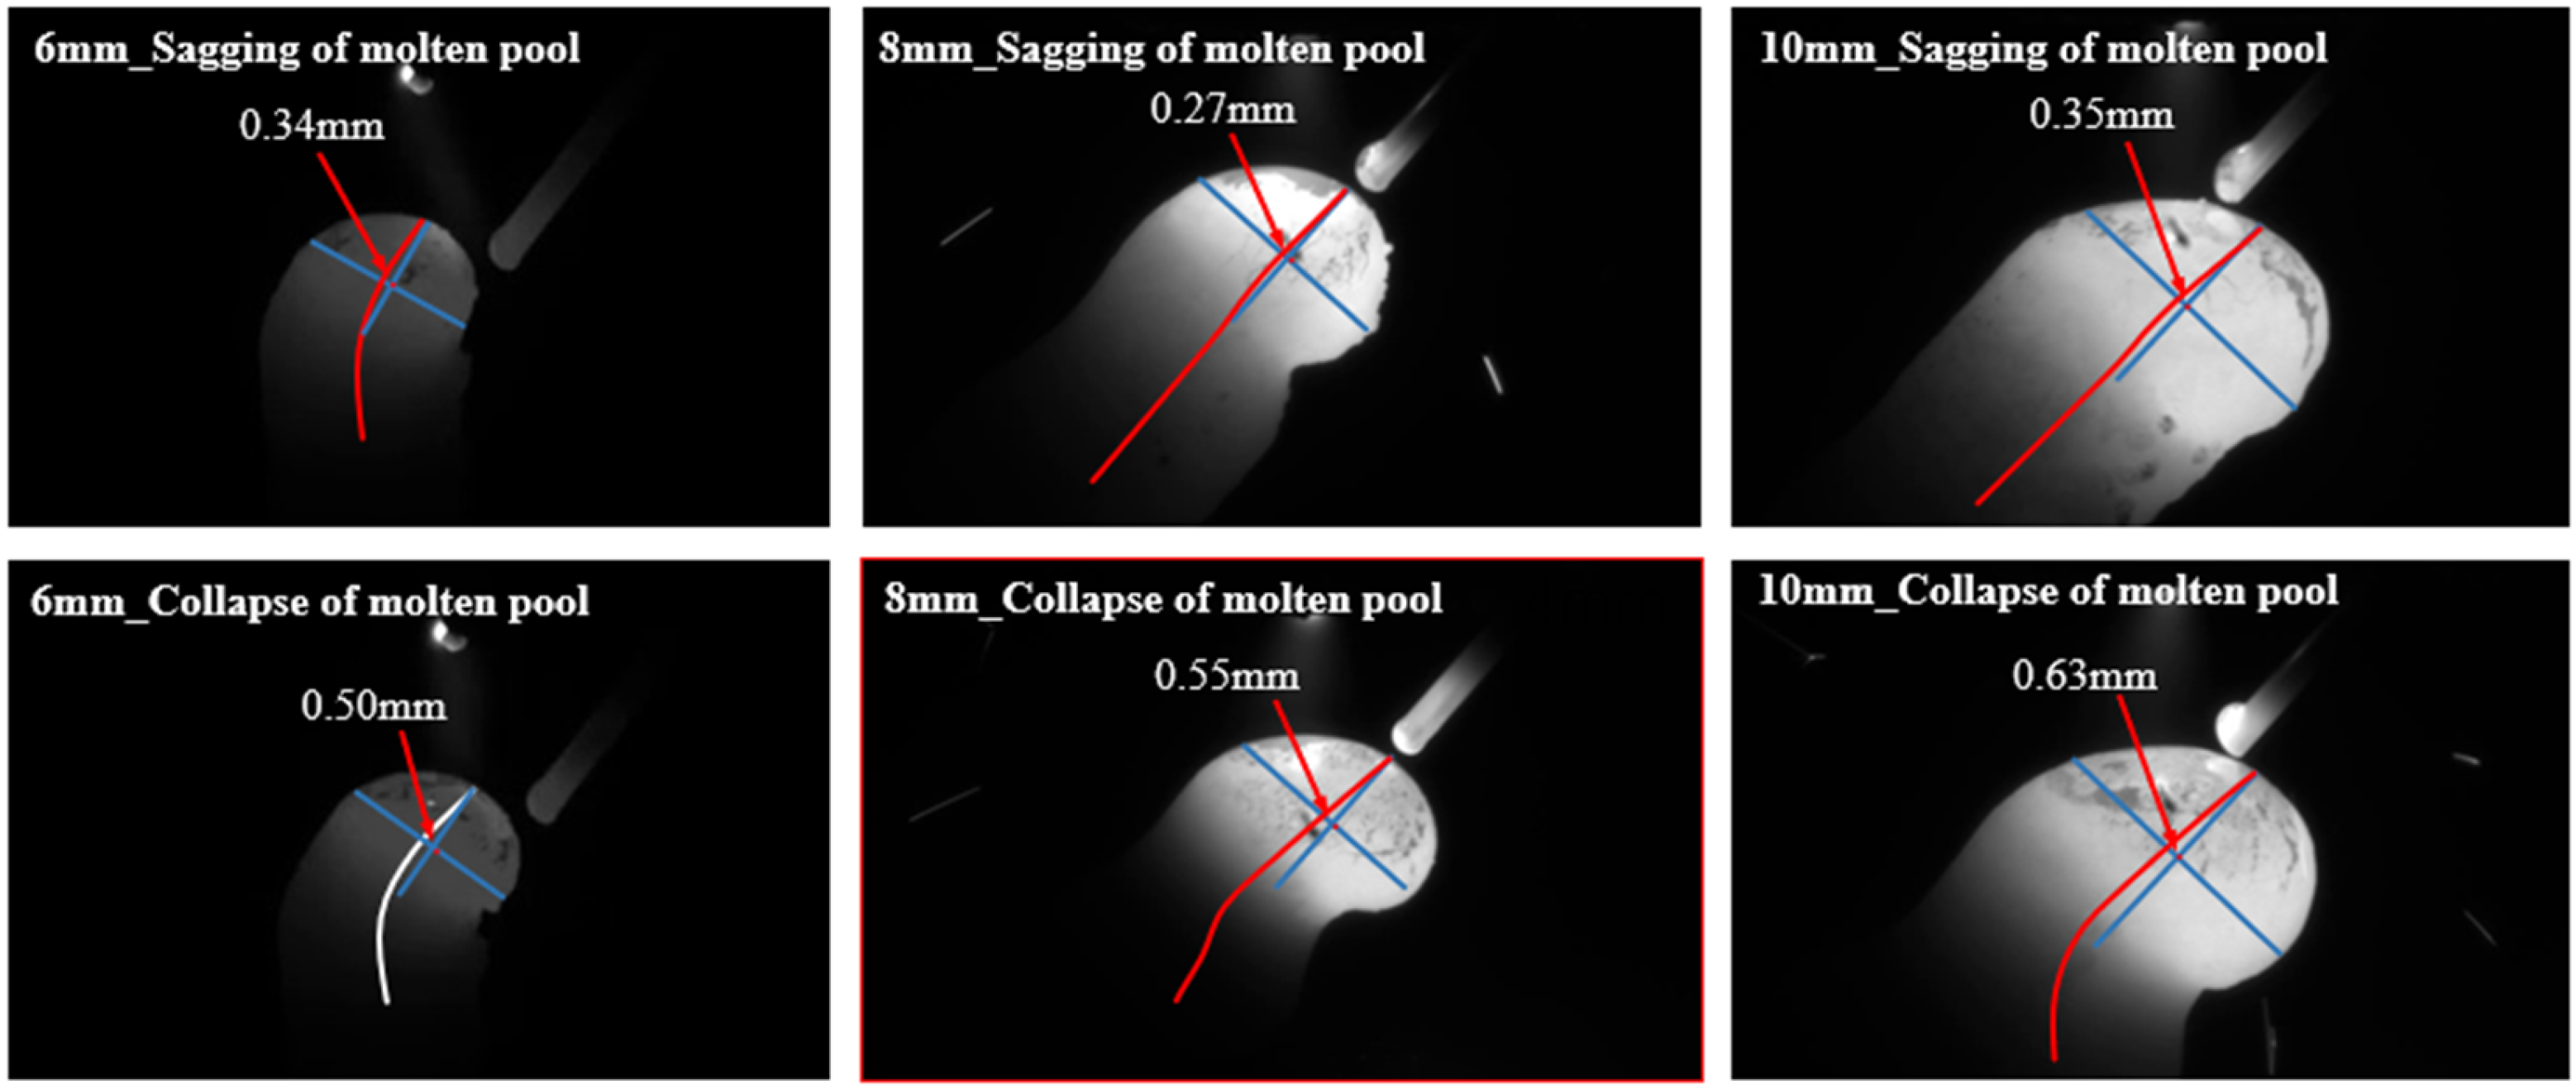
2.3.3. Quantitative Definition of Drooping and Collapsing Melt Pool States
2.3.4. Force Analysis
3. Experiment
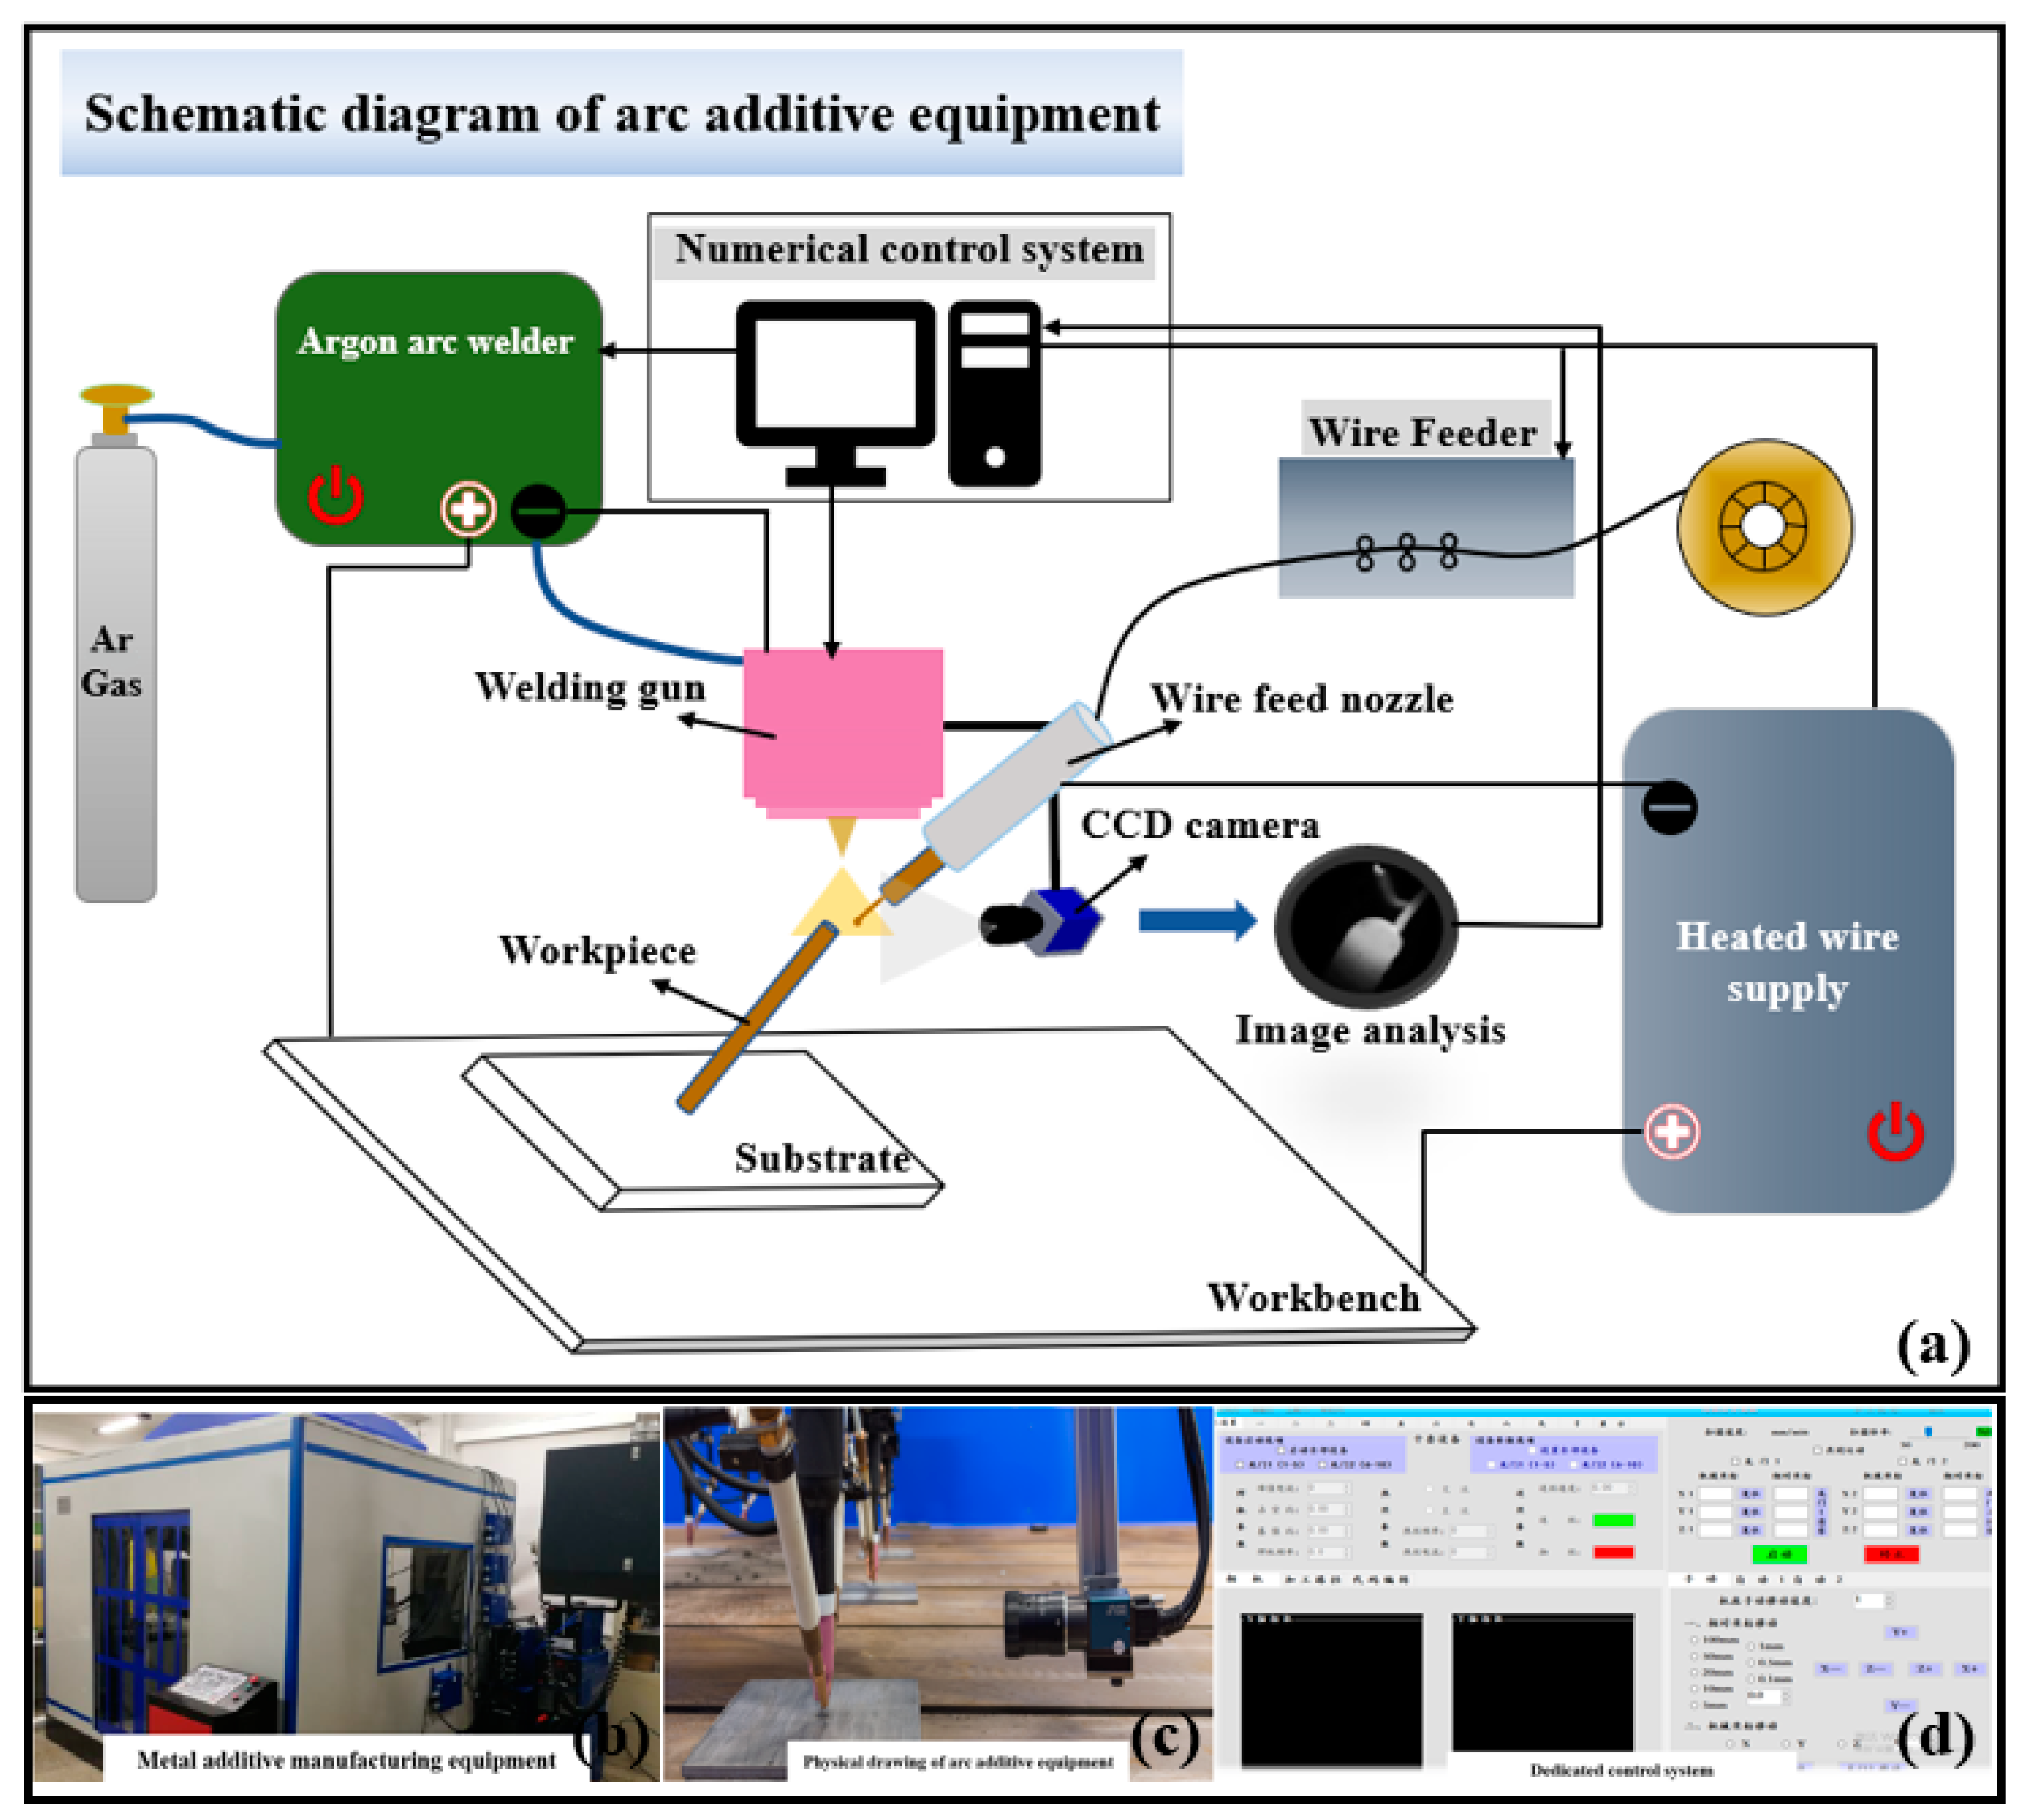
3.1. Experimental Setup
3.2. Material Parameter
3.3. Experimental Design
4. Results and Analysis
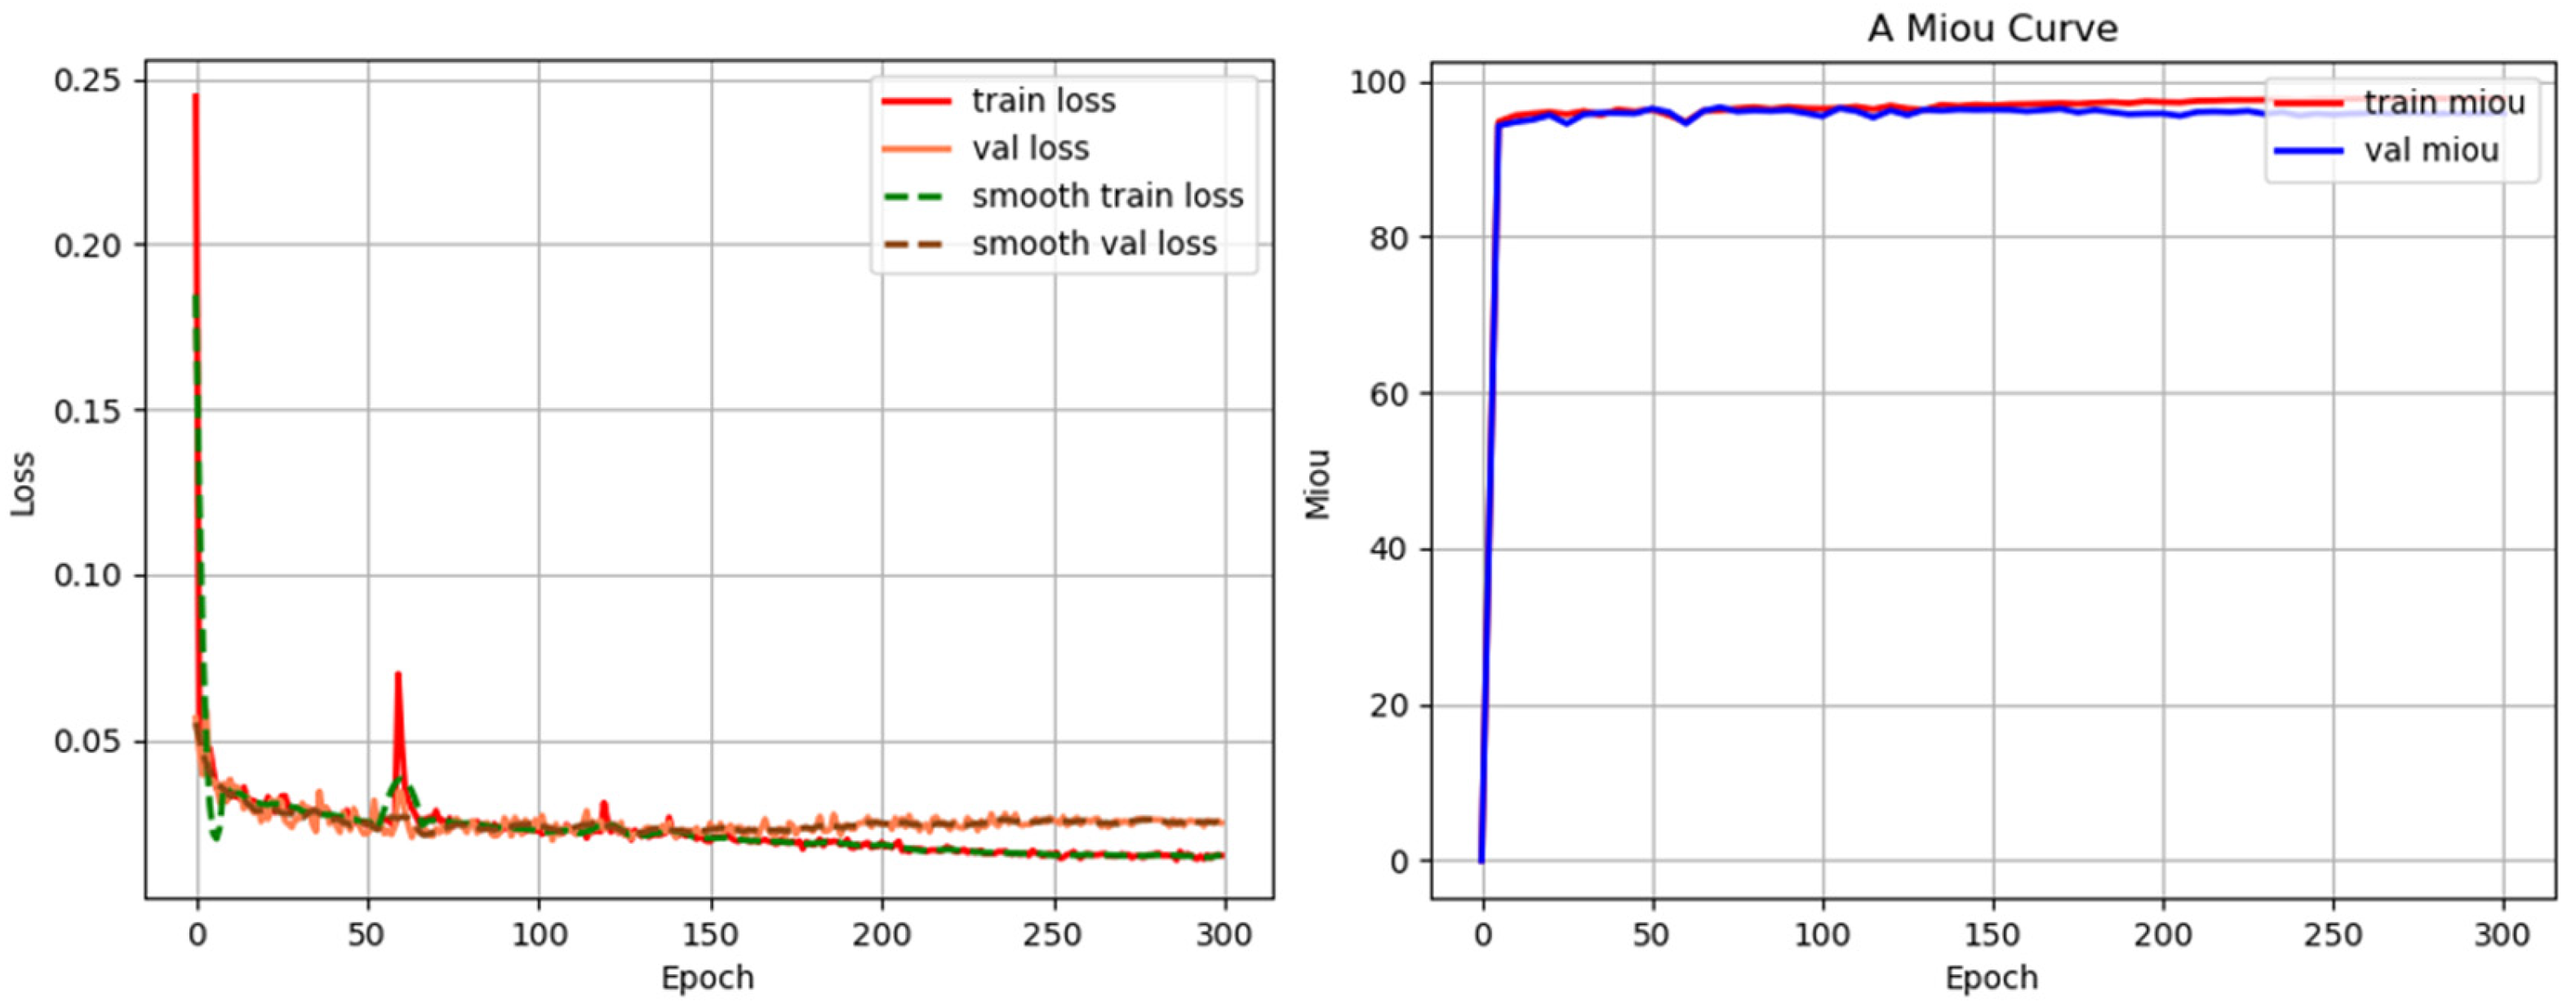
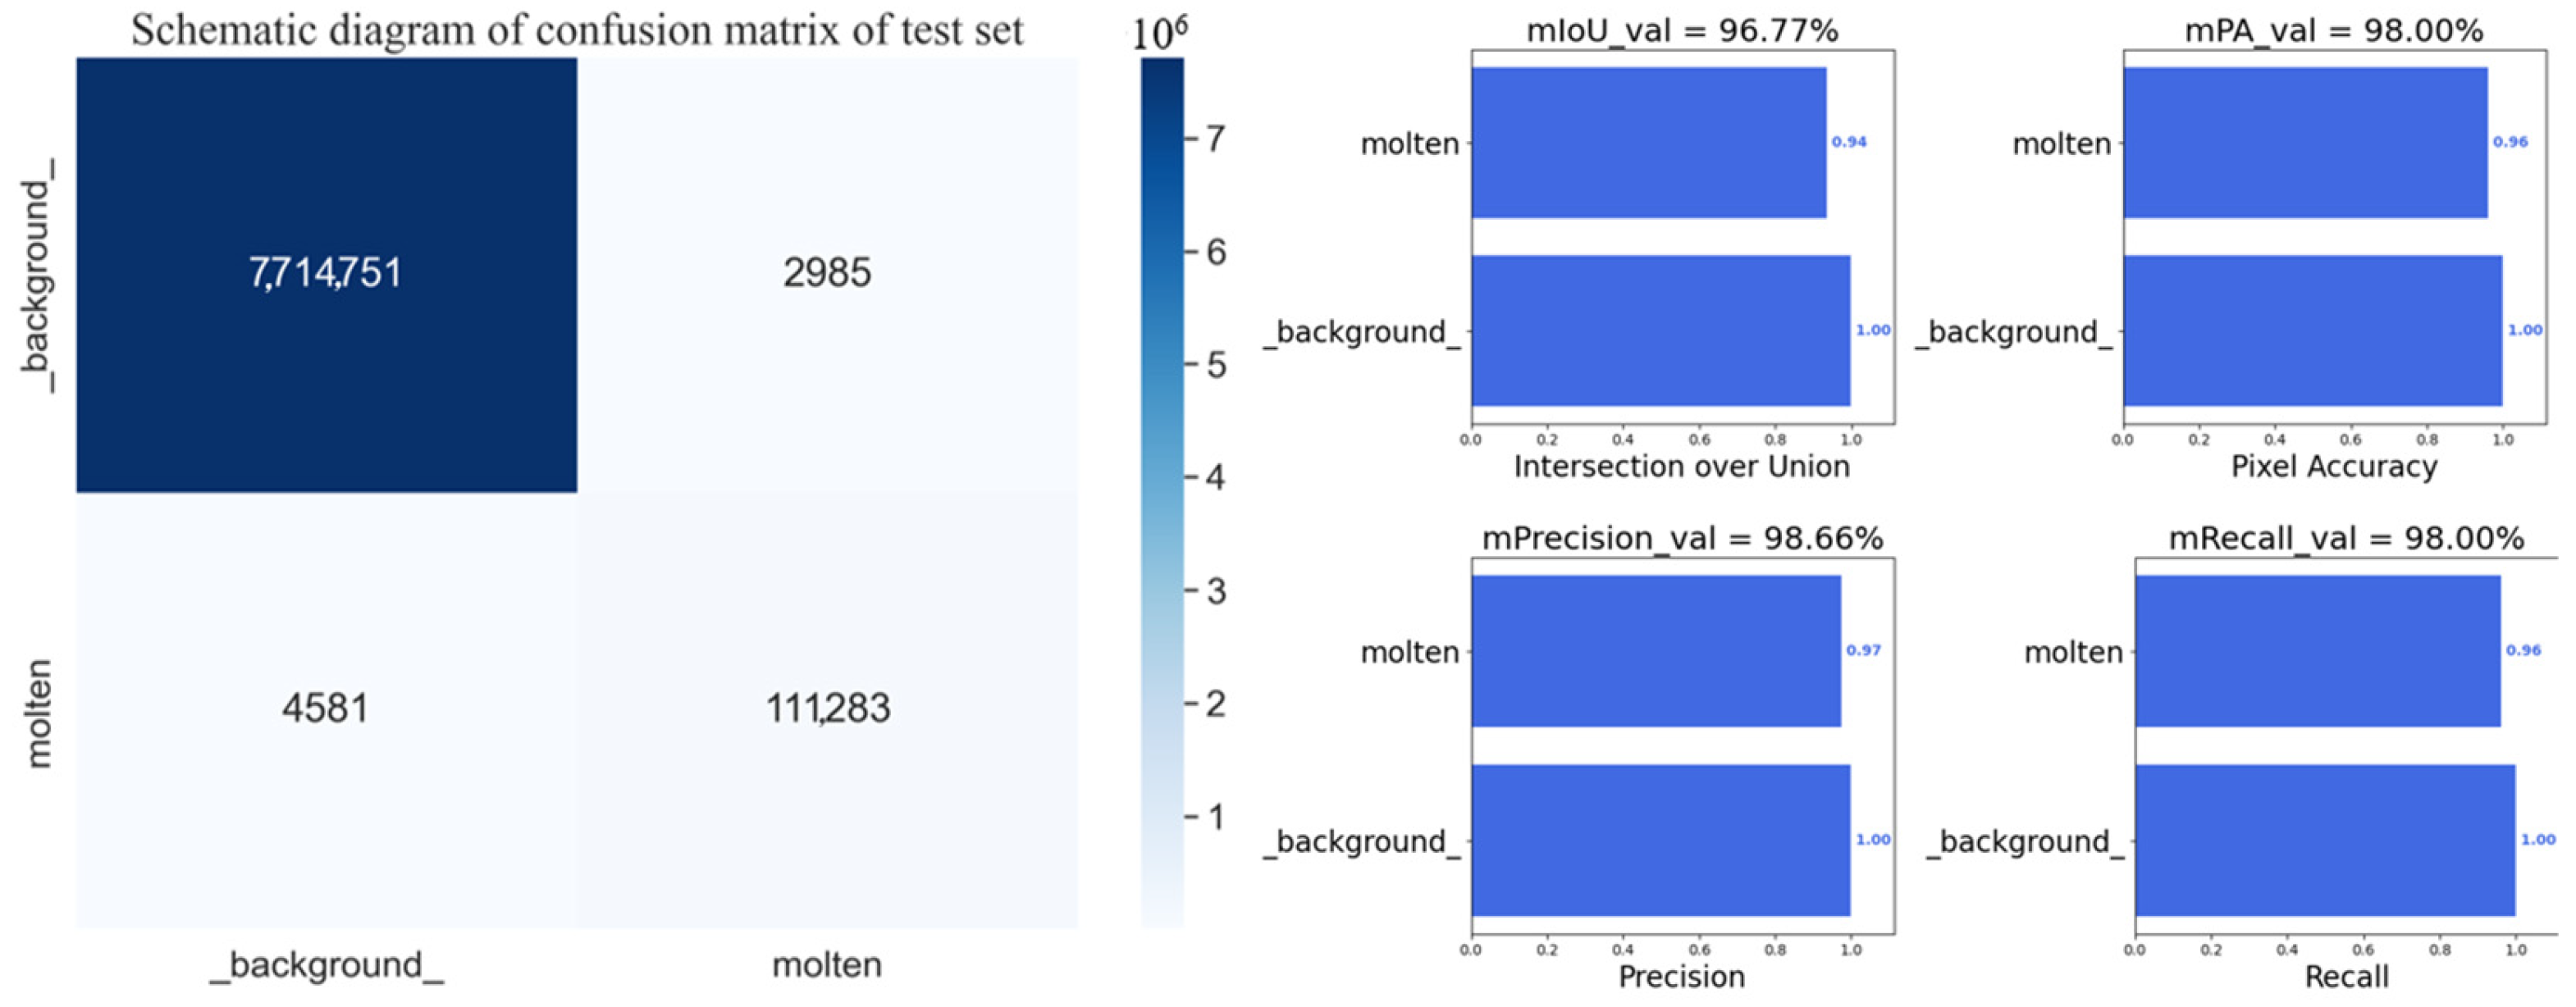
4.1. Evaluation of Network
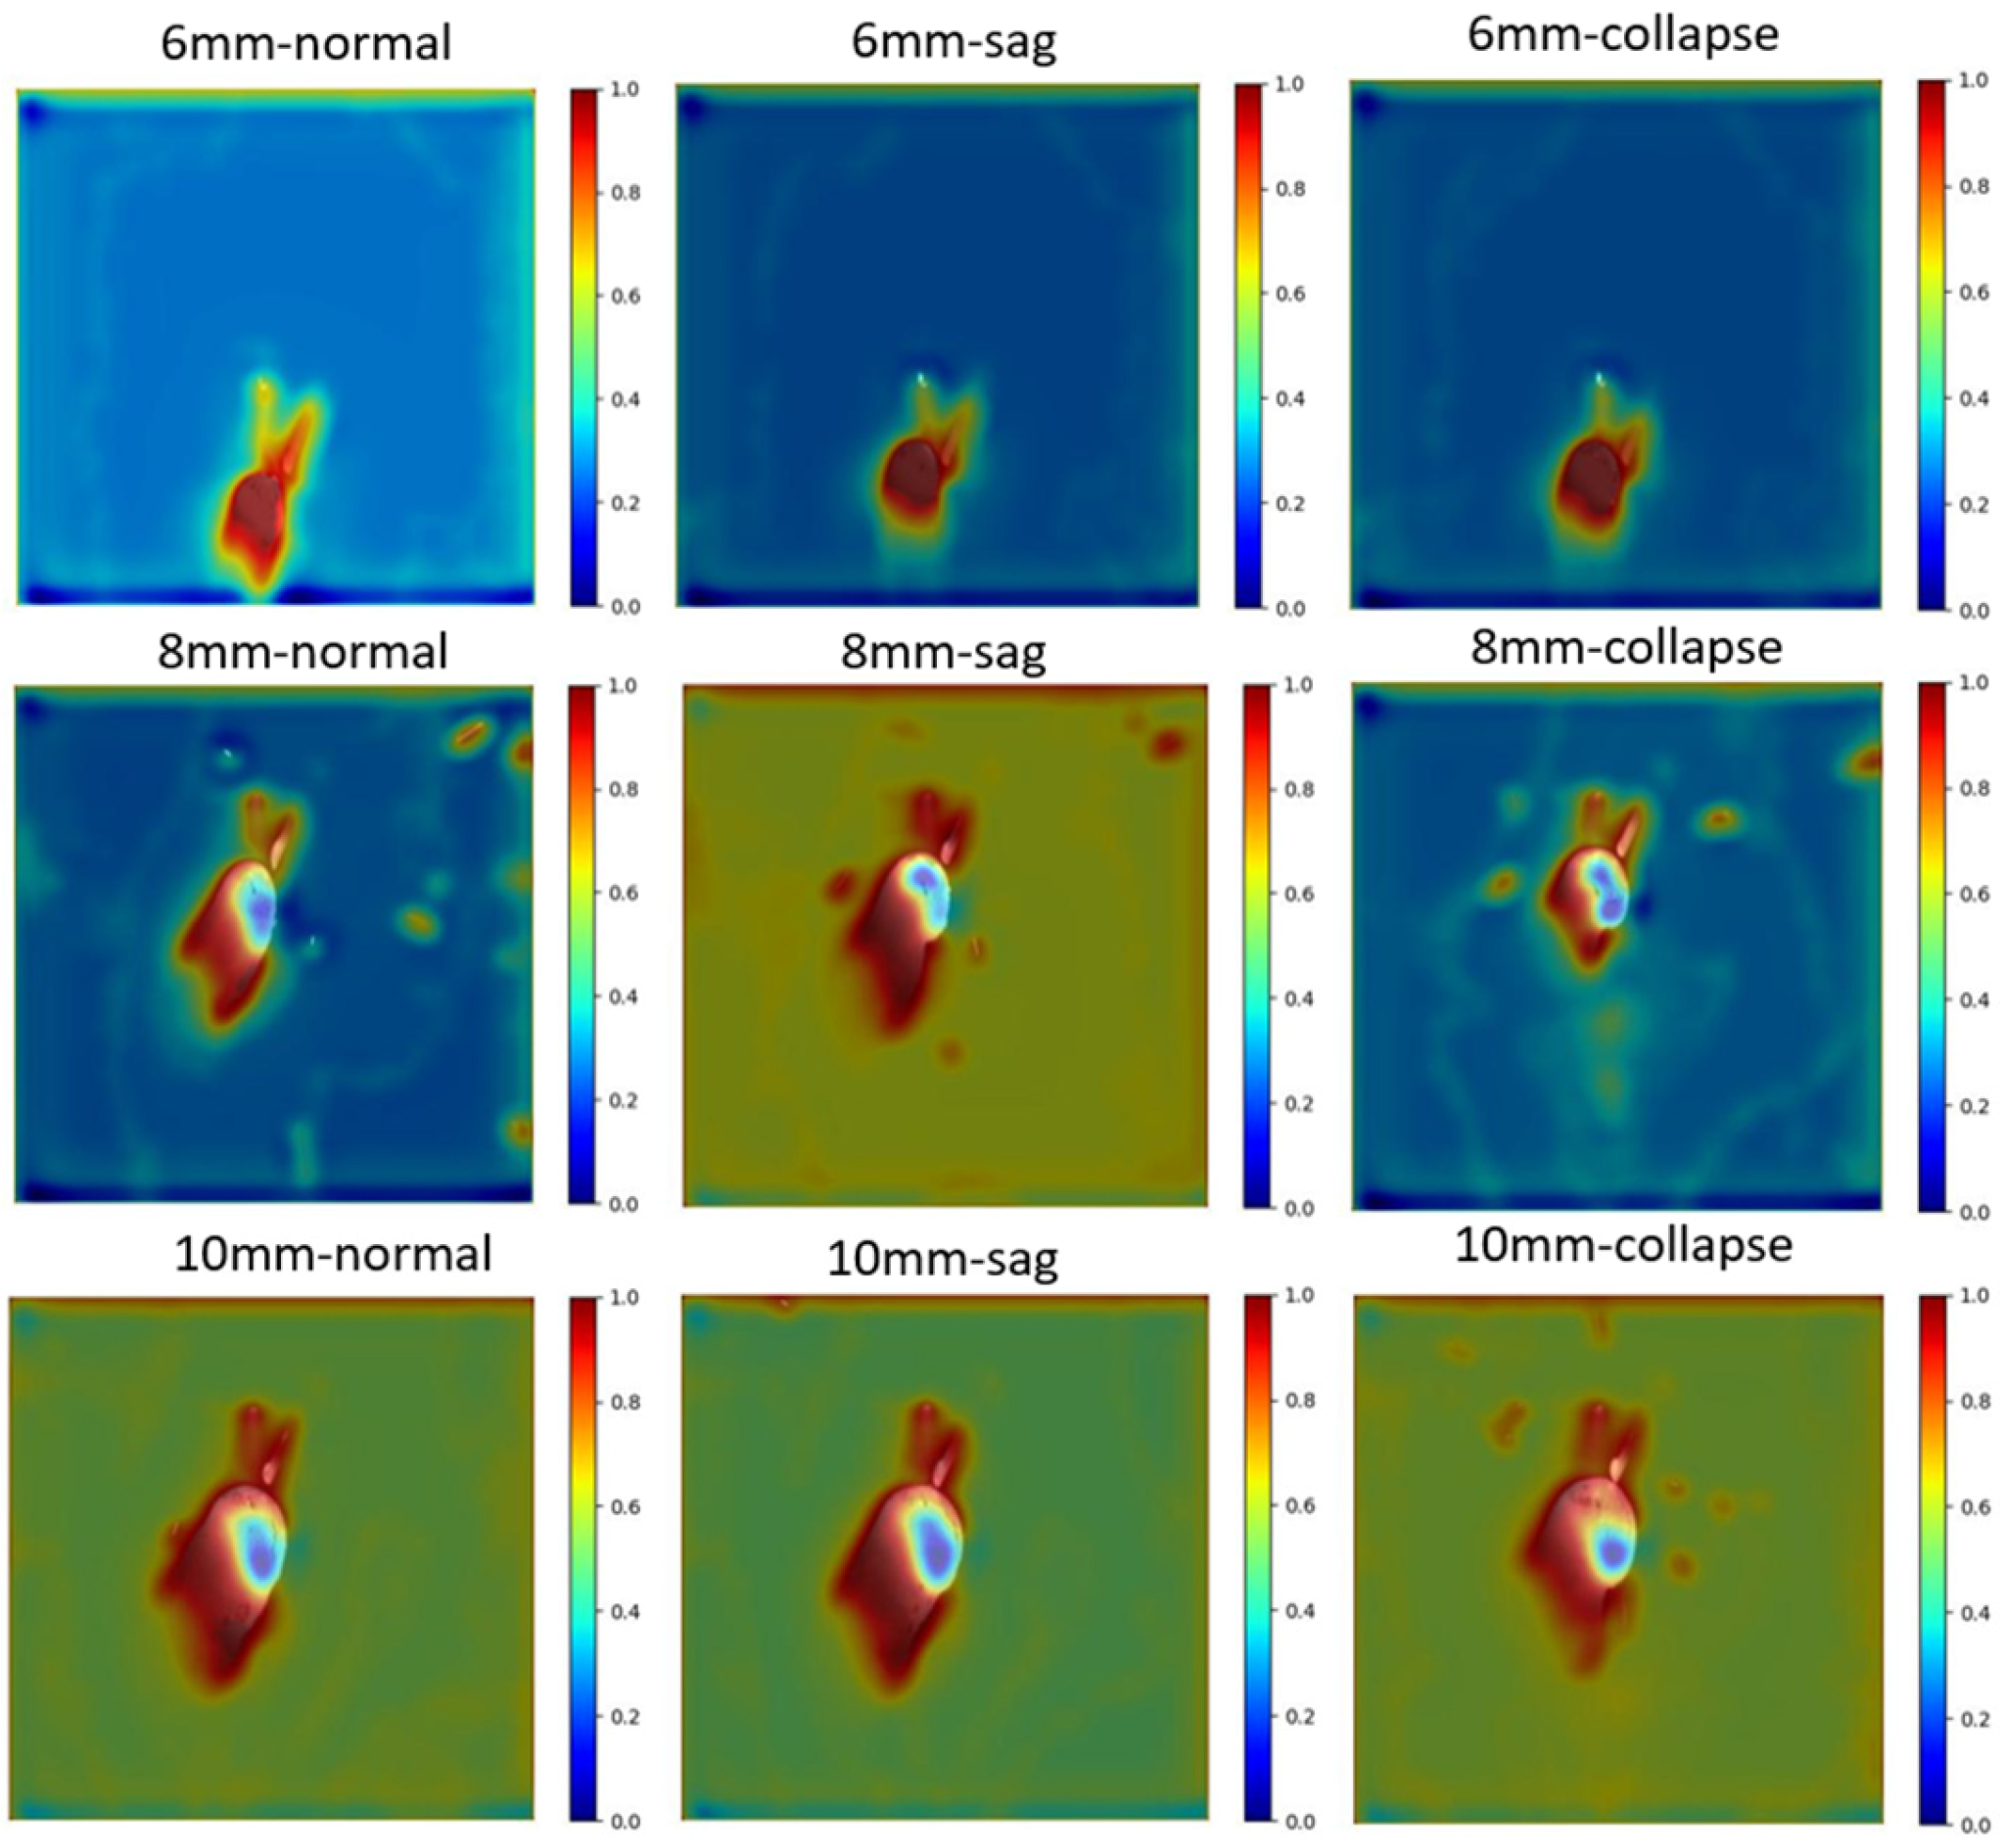
4.2. Interpretability
4.3. Experimental Verification of Force Estimation and Drooping and Collapsing Prediction Methods
5. Discussion
5.1. Experimental Evaluation
5.2. Result Discussion
5.3. Limitations
5.3.1. The Diameter of Unsupported Rods
5.3.2. The Quantity and Quality of Samples
6. Conclusions
- Through experiments and computer vision preprocess technology, the experimental datasets of non-supported rods with 6 mm, 8 mm, and 10 mm diameters were obtained;
- Based on the unique characteristics of the melt pool imagery, we optimized and adjusted the existing network level of the U-net model. The experimental outcomes demonstrate that the optimized U-net has attained an impressive accuracy of 98.18%, with an MIOU value of 96.64% and an average recall rate of 98.34%;
- According to the characteristics of the melt pool image, we optimized and adjusted the network design of the U-net model. The experimental results demonstrate that the optimized U-net performed well in the melt pool segmentation task, achieving a high accuracy of 98.18% on the testing set. Additionally, its MIOU value reached 96.64%, and the average recall rate was 98.34%;
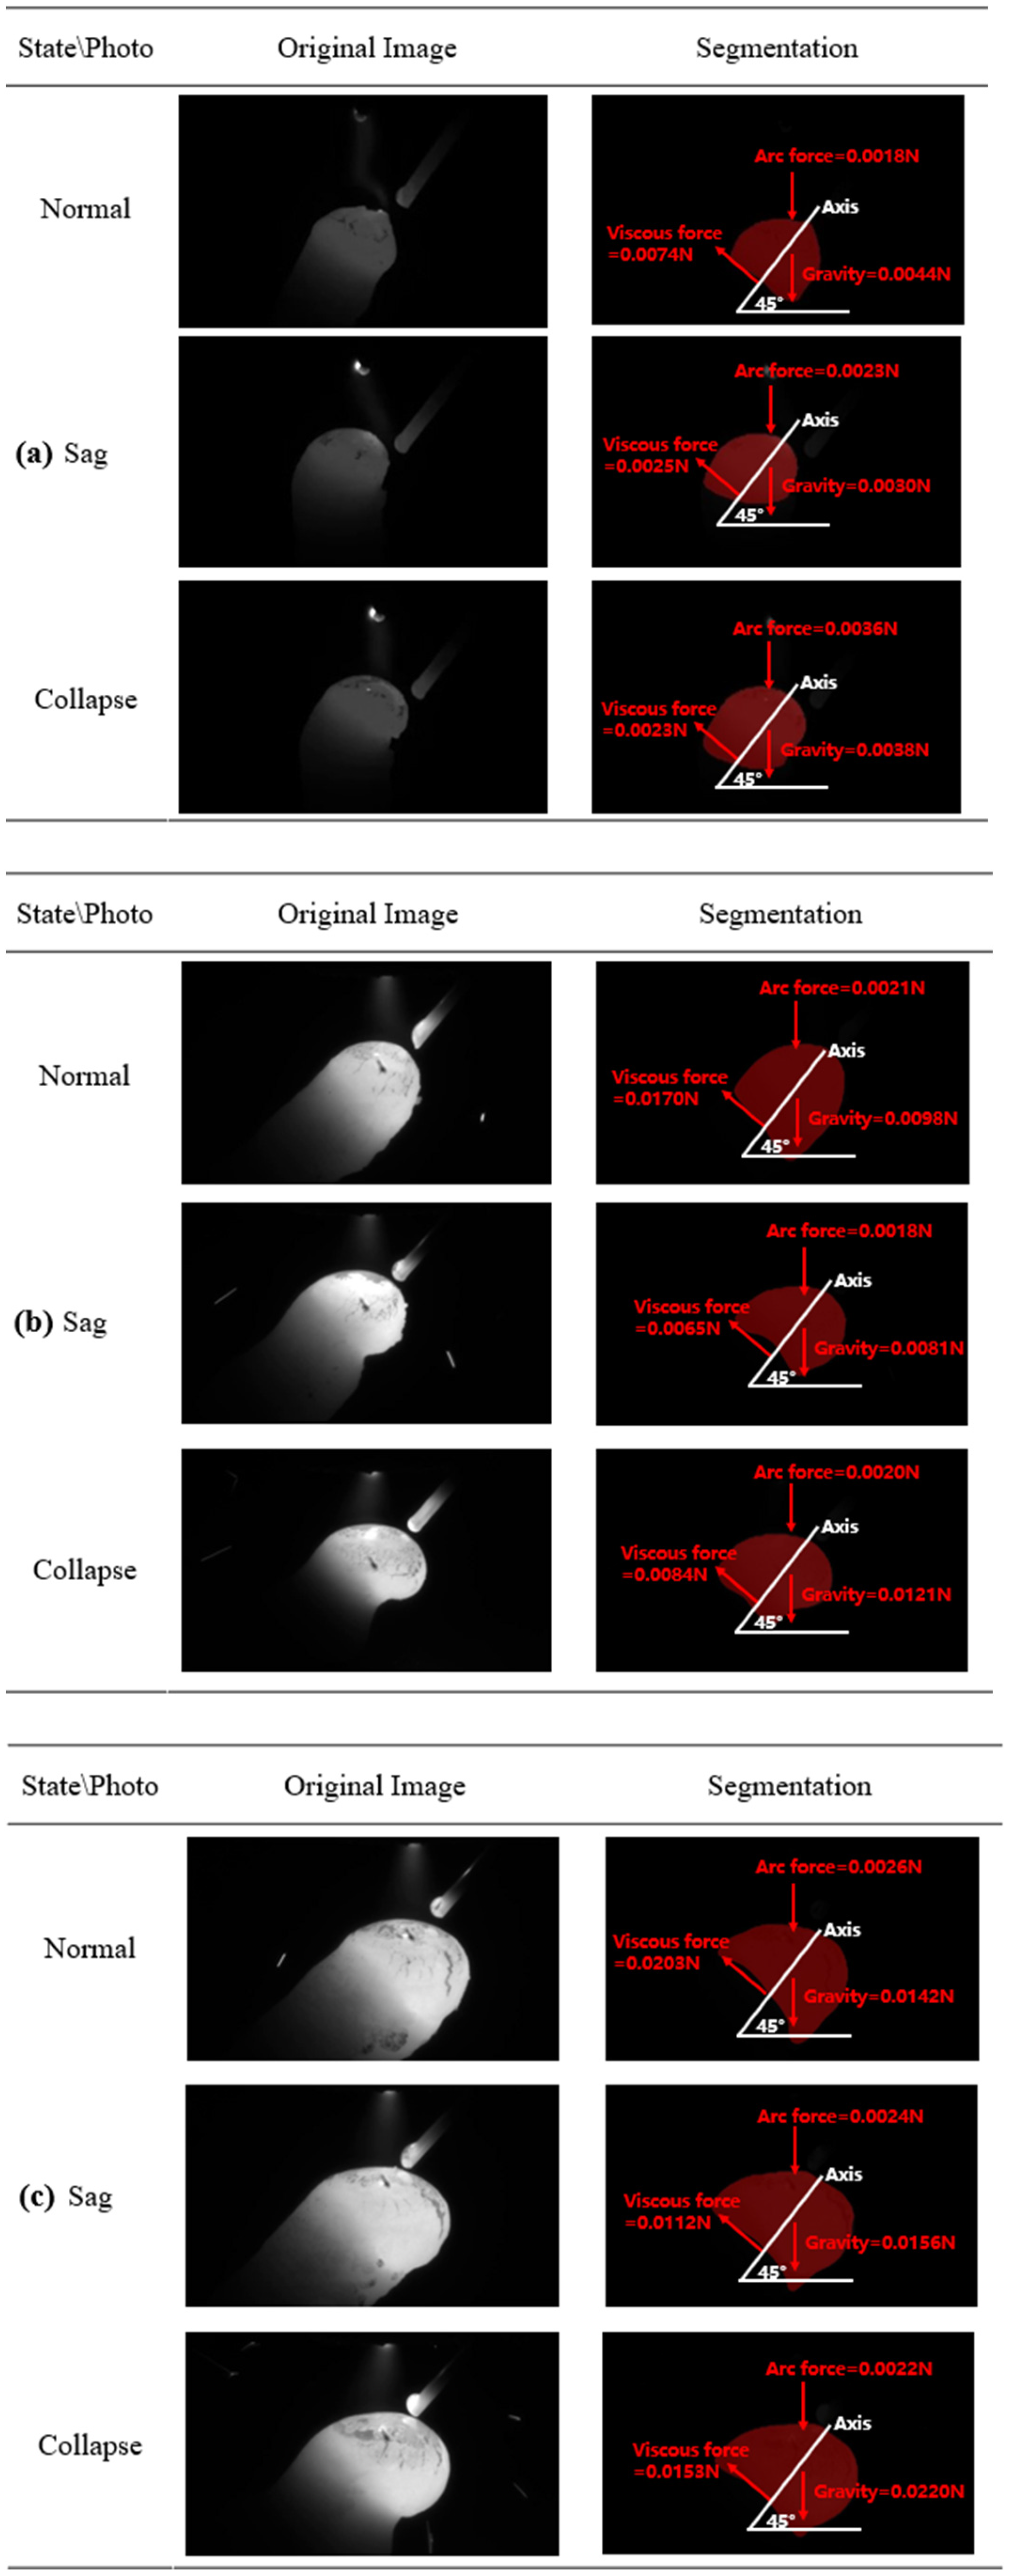
- We successfully obtained key parameters such as the upper contact angle, lower contact angle, top arc length, and bottom arc length from segmented melt pool images via computer vision methods. The forces were then estimated to evaluate the force balance condition, indicating different melt pool states. The results show that the accuracy of our method in predicting the melt pool’s normal, drooping, and collapsing state is as high as 90%.
Author Contributions
Funding
Institutional Review Board Statement
Informed Consent Statement
Data Availability Statement
Conflicts of Interest
References
- Lu, B.; Li, D.; Tian, X. Development Trends in Additive Manufacturing and 3D Printing. Engineering 2015, 1, 85–89. [Google Scholar] [CrossRef]
- Jiang, J. A novel fabrication strategy for additive manufacturing processes. J. Clean. Prod. 2020, 272, 122916. [Google Scholar] [CrossRef]
- Jiang, J.; Xiong, Y.; Zhang, Z.; Rosen, D.W. Machine learning integrated design for additive manufacturing. J. Intell. Manuf. 2020, 33, 1073–1086. [Google Scholar] [CrossRef]
- Panchagnula, J.S.; Simhambhatla, S. Manufacture of complex thin-walled metallic objects using weld-deposition based additive manufacturing. Robot. Comput.-Integr. Manuf. 2018, 49, 194–203. [Google Scholar] [CrossRef]
- Ge, J.; Lin, J.; Lei, Y.; Fu, H. Location-related thermal history, microstructure, and mechanical properties of arc additively manufactured 2Cr13 steel using cold metal transfer welding. Mater. Sci. Eng. A 2018, 715, 144–153. [Google Scholar] [CrossRef]
- Haselhuhn, A.S.; Wijnen, B.; Anzalone, G.C.; Sanders, P.G.; Pearce, J.M. In situ formation of substrate release mechanisms for gas metal arc weld metal 3-D printing. J. Mater. Process. Technol. 2015, 226, 50–59. [Google Scholar] [CrossRef]
- Yang, D.; Wang, G.; Zhang, G. Thermal analysis for single-pass multi-layer GMAW based additive manufacturing using infrared thermography. J. Mater. Process. Technol. 2017, 244, 215–224. [Google Scholar] [CrossRef]
- Wadley, H. Fabrication and structural performance of periodic cellular metal sandwich structures. Compos. Sci. Technol. 2003, 63, 2331–2343. [Google Scholar] [CrossRef]
- Buchanan, C.; Gardner, L. Metal 3D printing in construction: A review of methods, research, applications, opportunities and challenges. Eng. Struct. 2019, 180, 332–348. [Google Scholar] [CrossRef]
- Thompson, M.K.; Moroni, G.; Vaneker, T.; Fadel, G.; Campbell, R.I.; Gibson, I.; Bernard, A.; Schulz, J.; Graf, P.; Ahuja, B.; et al. Design for Additive Manufacturing: Trends, opportunities, considerations, and constraints. CIRP Ann. 2016, 65, 737–760. [Google Scholar] [CrossRef]
- Laghi, V.; Palermo, M.; Gasparini, G.; Trombetti, T. Computational design and manufacturing of a half-scaled 3D-printed stainless steel diagrid column. Addit. Manuf. 2020, 36, 101505. [Google Scholar] [CrossRef]
- Li, Y.; Yu, S.; Chen, Y.; Yu, R.; Shi, Y. Wire and arc additive manufacturing of aluminum alloy lattice structure. J. Manuf. Process. 2020, 50, 510–519. [Google Scholar] [CrossRef]
- Wu, B.; Pan, Z.; Ziping, Y.; van Duin, S.; Li, H.; Pierson, E. Robotic skeleton arc additive manufacturing of aluminium alloy. Int. J. Adv. Manuf. Technol. 2021, 114, 2945–2959. [Google Scholar] [CrossRef]
- Mao, H.; Jing, C.; Kong, F.; Xu, T.; Xiao, X.; Li, K.; Ling, X.; Liu, C. Improve the manufacturing efficiency of steel bars by using hot-wire pulse arc additive manufacturing. J. Manuf. Process. 2023, 89, 430–443. [Google Scholar] [CrossRef]
- Jing, C.; Mao, H.; Xu, T.; Wu, Q.; Liu, B.; Lu, J.; Liang, X.; Liu, C. Fabricating 316 L stainless steel unsupported rods by controlling the flow of molten pool via wire arc additive manufacturing. J. Mater. Process. Technol. 2023, 319, 118066. [Google Scholar] [CrossRef]
- Le, T.-N.; Lee, M.-H.; Lin, Z.-H.; Tran, H.-C.; Lo, Y.-L. Vision-based in-situ monitoring system for melt-pool detection in laser powder bed fusion process. J. Manuf. Process. 2021, 68, 1735–1745. [Google Scholar] [CrossRef]
- He, H.; Lu, J.; Zhang, Y.; Han, J.; Zhao, Z. Quantitative prediction of additive manufacturing deposited layer offset based on passive visual imaging and deep residual network. J. Manuf. Process. 2021, 72, 195–202. [Google Scholar] [CrossRef]
- Xia, C.; Pan, Z.; Li, Y.; Chen, J.; Li, H. Vision-based melt pool monitoring for wire-arc additive manufacturing using deep learning method. Int. J. Adv. Manuf. Technol. 2022, 120, 551–562. [Google Scholar] [CrossRef]
- Zhang, T.; Wang, L.; Xu, C.; Cheng, J.; Wang, K. Early-Warning System for Copper Alloy Abnormal Molten Pool in Wire-Arc Additive Manufacturing via Convolutional Neural Network Method. J. Mater. Eng. Perform. 2023, 32, 11230–11239. [Google Scholar] [CrossRef]
- Shin, S.-J.; Lee, J.-H.; Jadhav, S.; Kim, D.B. Material-Adaptive Anomaly Detection Using Property-Concatenated Transfer Learning in Wire Arc Additive Manufacturing. Int. J. Precis. Eng. Manuf. 2023, 25, 383–408. [Google Scholar] [CrossRef]
- Ronneberger, O.; Fischer, P.; Brox, T. U-Net: Convolutional Networks for Biomedical Image Segmentation. In Medical Image Computing and Computer-Assisted Intervention–MICCAI 2015; Lecture Notes in Computer Science; Springer: Berlin/Heidelberg, Germany, 2015; pp. 234–241. [Google Scholar]
- He, K.; Zhang, X.; Ren, S.; Sun, J. Deep Residual Learning for Image Recognition. In Proceedings of the 2016 IEEE Conference on Computer Vision and Pattern Recognition (CVPR), Las Vegas, NV, USA, 27–30 June 2016; pp. 770–778. [Google Scholar]
- Shelhamer, E.; Long, J.; Darrell, T. Fully Convolutional Networks for Semantic Segmentation. IEEE Trans. Pattern Anal. Mach. Intell. 2017, 39, 640–651. [Google Scholar] [CrossRef] [PubMed]
- Olivier, R.; Cao, H. Nearest Neighbor Value Interpolation. Int. J. Adv. Comput. Sci. Appl. 2012, 3, 25–30. [Google Scholar] [CrossRef]
- Wang, J.; Chen, K.; Xu, R.; Liu, Z.; Loy, C.C.; Lin, D. CARAFE: Content-Aware ReAssembly of FEatures. In Proceedings of the IEEE/CVF International Conference on Computer Vision (ICCV), Seoul, Republic of Korea, 27 Ocober–2 November 2019; pp. 3007–3016. [Google Scholar] [CrossRef]
- Lin, T.-Y.; Dollar, P.; Girshick, R.; He, K.; Hariharan, B.; Belongie, S. Feature Pyramid Networks for Object Detection. In Proceedings of the 2017 IEEE Conference on Computer Vision and Pattern Recognition (CVPR), Honolulu, HI, USA, 21–26 July 2017; pp. 936–944. [Google Scholar]
- Cai, W.; Jiang, P.; Shu, L.; Geng, S.; Zhou, Q. Real-time identification of molten pool and keyhole using a deep learning-based semantic segmentation approach in penetration status monitoring. J. Manuf. Process. 2022, 76, 695–707. [Google Scholar] [CrossRef]
- Ruder, S. An overview of gradient descent optimization. arXiv 2016. [Google Scholar] [CrossRef]
- Kingma, D.P.; Ba, J. A Method for Stochastic Optimization. arXiv 2014. [Google Scholar] [CrossRef]
- Fischler, M.A.; Bolles, R.C. Random Sample Conesensus A paradigm for Model Fitting with Applications to Image Analysis and automated Cartography. Read. Comput. Vis. 1981, 24, 381–395. [Google Scholar] [CrossRef]
- Wu, Q.; Ma, Z.; Chen, G.; Liu, C.; Ma, D.; Ma, S. Obtaining fine microstructure and unsupported overhangs by low heat input pulse arc additive manufacturing. J. Manuf. Process. 2017, 27, 198–206. [Google Scholar] [CrossRef]
- McNallan, M.J.; Debroy, T. Effect of Temperature and Composition on Surface-Tension in Fe-Ni-Cr Alloys Containing Sulfur. Met. Trans. B 1991, 22, 557–560. [Google Scholar] [CrossRef]
- Sahoo, P.; Debroy, T.; Mcnallan, M.J. Surface-Tension of Binary Metal-Surface-Active Solute Systems under Conditions Relevant To Welding Metallurgy. Met. Trans. B 1988, 19, 483–491. [Google Scholar] [CrossRef]
- Burleigh, T.D.; Eagar, T.W. Measurement of the Force Exerted by a Welding Arc. Met. Trans. A 1983, 14, 1223–1224. [Google Scholar] [CrossRef]
- Ma, C.; Li, Y.; Cheng, L.; Zhao, Y.; Wang, J.; Zhan, X. Numerical analysis of gravity-induced coupling dynamics of keyhole and molten pool in laser welding. Int. J. Therm. Sci. 2024, 201, 108987. [Google Scholar] [CrossRef]
- Xiong, J.; Shi, M.; Liu, Y.; Yin, Z. Virtual binocular vision sensing and control of molten pool width for gas metal arc additive manufactured thin-walled components. Addit. Manuf. 2020, 33, 101121. [Google Scholar] [CrossRef]


| Module | Characteristic Layer | Dimension |
|---|---|---|
| Resize | Layer_1 | 512 × 512 × 3 |
| Layer_2 | 256 × 256 × 64 | |
| Layer_3 | 128 × 128 × 64 | |
| Res_block | Layer_4 | 128 × 128 × 256 |
| Layer_5 | 64 × 64 × 512 | |
| Layer_6 | 32 × 32 × 1024 | |
| Layer_7 | 16 × 16 × 2048 |
| Module | Characteristic Layer | Dimension |
|---|---|---|
| Addition | Layer_8 | 32 × 32 × 512 |
| Layer_9 | 64 × 64 × 256 | |
| Layer_10 | 128 × 128 × 128 | |
| Layer_11 | 256 × 256 × 64 | |
| Recover | Layer_12 | 512 × 512 × 64 |
| Segmentation | Layer_13 | 512 × 512 × 3 |
| Element | Fe | C | Cr | Ni | Mo | Mn | Si | Cu | S | P |
|---|---|---|---|---|---|---|---|---|---|---|
| Wt. (%) | Bal. | 0.023 | 19.00 | 11.70 | 2.12 | 1.85 | 0.51 | 0.10 | 0.013 | 0.016 |
| Inclined Angle | Diameter | Parameter Control in the Rod Manufacturing Process |
|---|---|---|
| 45° | 6/8/10 mm | (1) Normal manufacturing in the first 30 s, melt pool drooping in 30–60 s, normal manufacturing in 60–90 s, and melt pool collapsing in 90–120 s. |
| (2) Normal manufacturing in the first 30 s, melt pool collapsing in 30–60 s, normal manufacturing in 60–90 s, and melt pool drooping in 90–120 s. | ||
| (3) Normal manufacturing in the first 45 s, melt pool drooping in 45–75 s, normal manufacturing in 75–90 s, and melt pool collapsing in 90–120 s. | ||
| (4) Normal manufacturing in the first 45 s, melt pool collapsing in 45–75 s, normal manufacturing in 75–90 s, and melt pool drooping in 90–120 s. |
| Diameter\Status (Unit: 10−3 N) | Normal | Sag | Collapse | ||||||
|---|---|---|---|---|---|---|---|---|---|
| Viscous Force | Gravity | Arc Force | Viscous Force | Gravity | Arc Force | Viscous Force | Gravity | Arc Force | |
| 6 mm | 7.4 | 4.4 | 1.8 | 2.5 | 3.0 | 2.3 | 2.3 | 3.8 | 3.6 |
| 8 mm | 17.0 | 9.8 | 2.1 | 6.5 | 8.1 | 1.8 | 8.4 | 12.1 | 2.0 |
| 10 mm | 20.3 | 14.2 | 2.6 | 11.2 | 15.6 | 2.4 | 15.3 | 22.0 | 2.2 |
Disclaimer/Publisher’s Note: The statements, opinions and data contained in all publications are solely those of the individual author(s) and contributor(s) and not of MDPI and/or the editor(s). MDPI and/or the editor(s) disclaim responsibility for any injury to people or property resulting from any ideas, methods, instructions or products referred to in the content. |
© 2024 by the authors. Licensee MDPI, Basel, Switzerland. This article is an open access article distributed under the terms and conditions of the Creative Commons Attribution (CC BY) license (https://creativecommons.org/licenses/by/4.0/).
Share and Cite
Luo, L.; Qian, E.; Lu, T.; Pan, J.; Liu, M.; Liu, C.; Guo, Y.; Bi, L. Vision-Based Estimation of Force Balance of Near-Suspended Melt Pool for Drooping and Collapsing Prediction. Sensors 2024, 24, 3270. https://doi.org/10.3390/s24113270
Luo L, Qian E, Lu T, Pan J, Liu M, Liu C, Guo Y, Bi L. Vision-Based Estimation of Force Balance of Near-Suspended Melt Pool for Drooping and Collapsing Prediction. Sensors. 2024; 24(11):3270. https://doi.org/10.3390/s24113270
Chicago/Turabian StyleLuo, Longxi, Enze Qian, Tao Lu, Jingren Pan, Minghao Liu, Changmeng Liu, Yueling Guo, and Luzheng Bi. 2024. "Vision-Based Estimation of Force Balance of Near-Suspended Melt Pool for Drooping and Collapsing Prediction" Sensors 24, no. 11: 3270. https://doi.org/10.3390/s24113270
APA StyleLuo, L., Qian, E., Lu, T., Pan, J., Liu, M., Liu, C., Guo, Y., & Bi, L. (2024). Vision-Based Estimation of Force Balance of Near-Suspended Melt Pool for Drooping and Collapsing Prediction. Sensors, 24(11), 3270. https://doi.org/10.3390/s24113270