
Age-Related Changes in Episodic Processing of Scenes: A Functional Activation and Connectivity Study

 , ,
, , 
Abstract
1. Introduction
2. Method
2.1. Participants
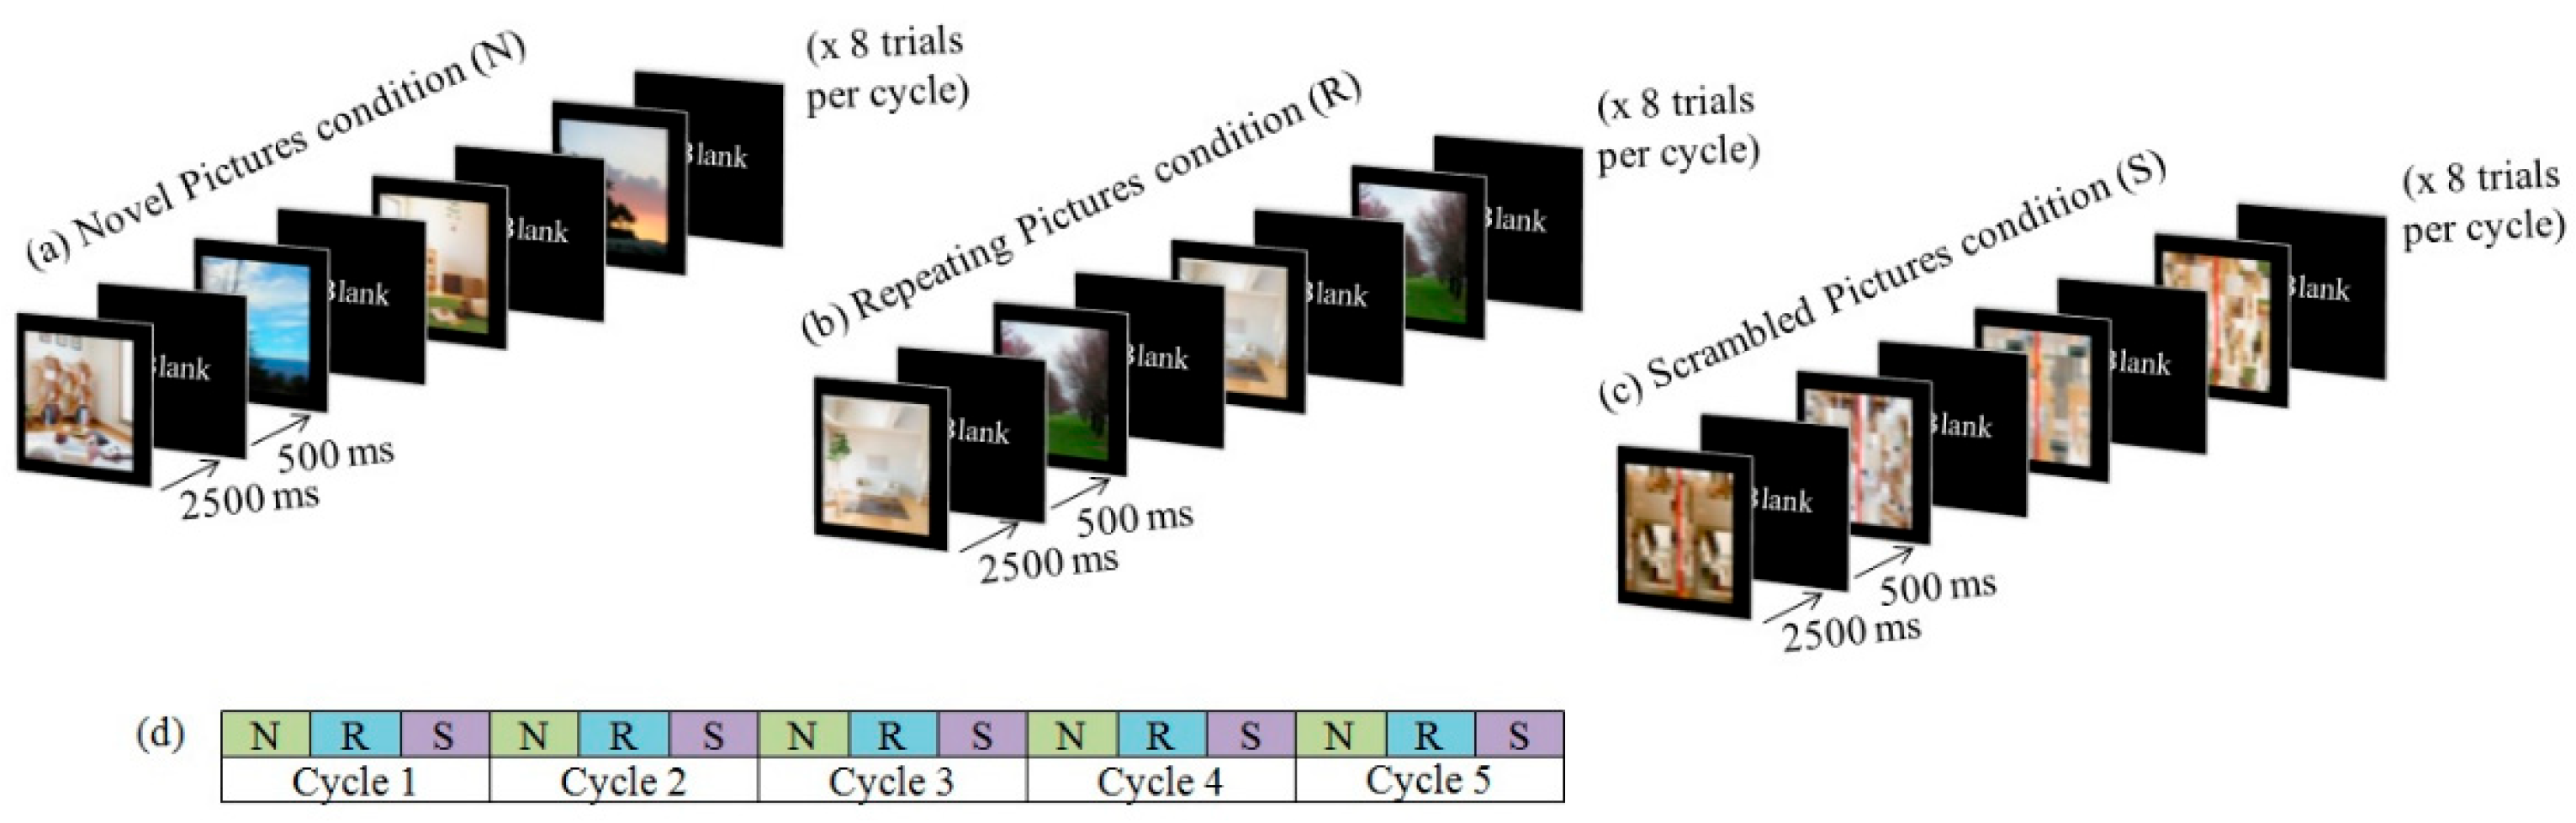
2.2. Task
2.3. Image Acquisition and Preprocesses
2.4. Design for Statistical Tests
2.4.1. Behavioral Data
2.4.2. Imaging Data
3. Results
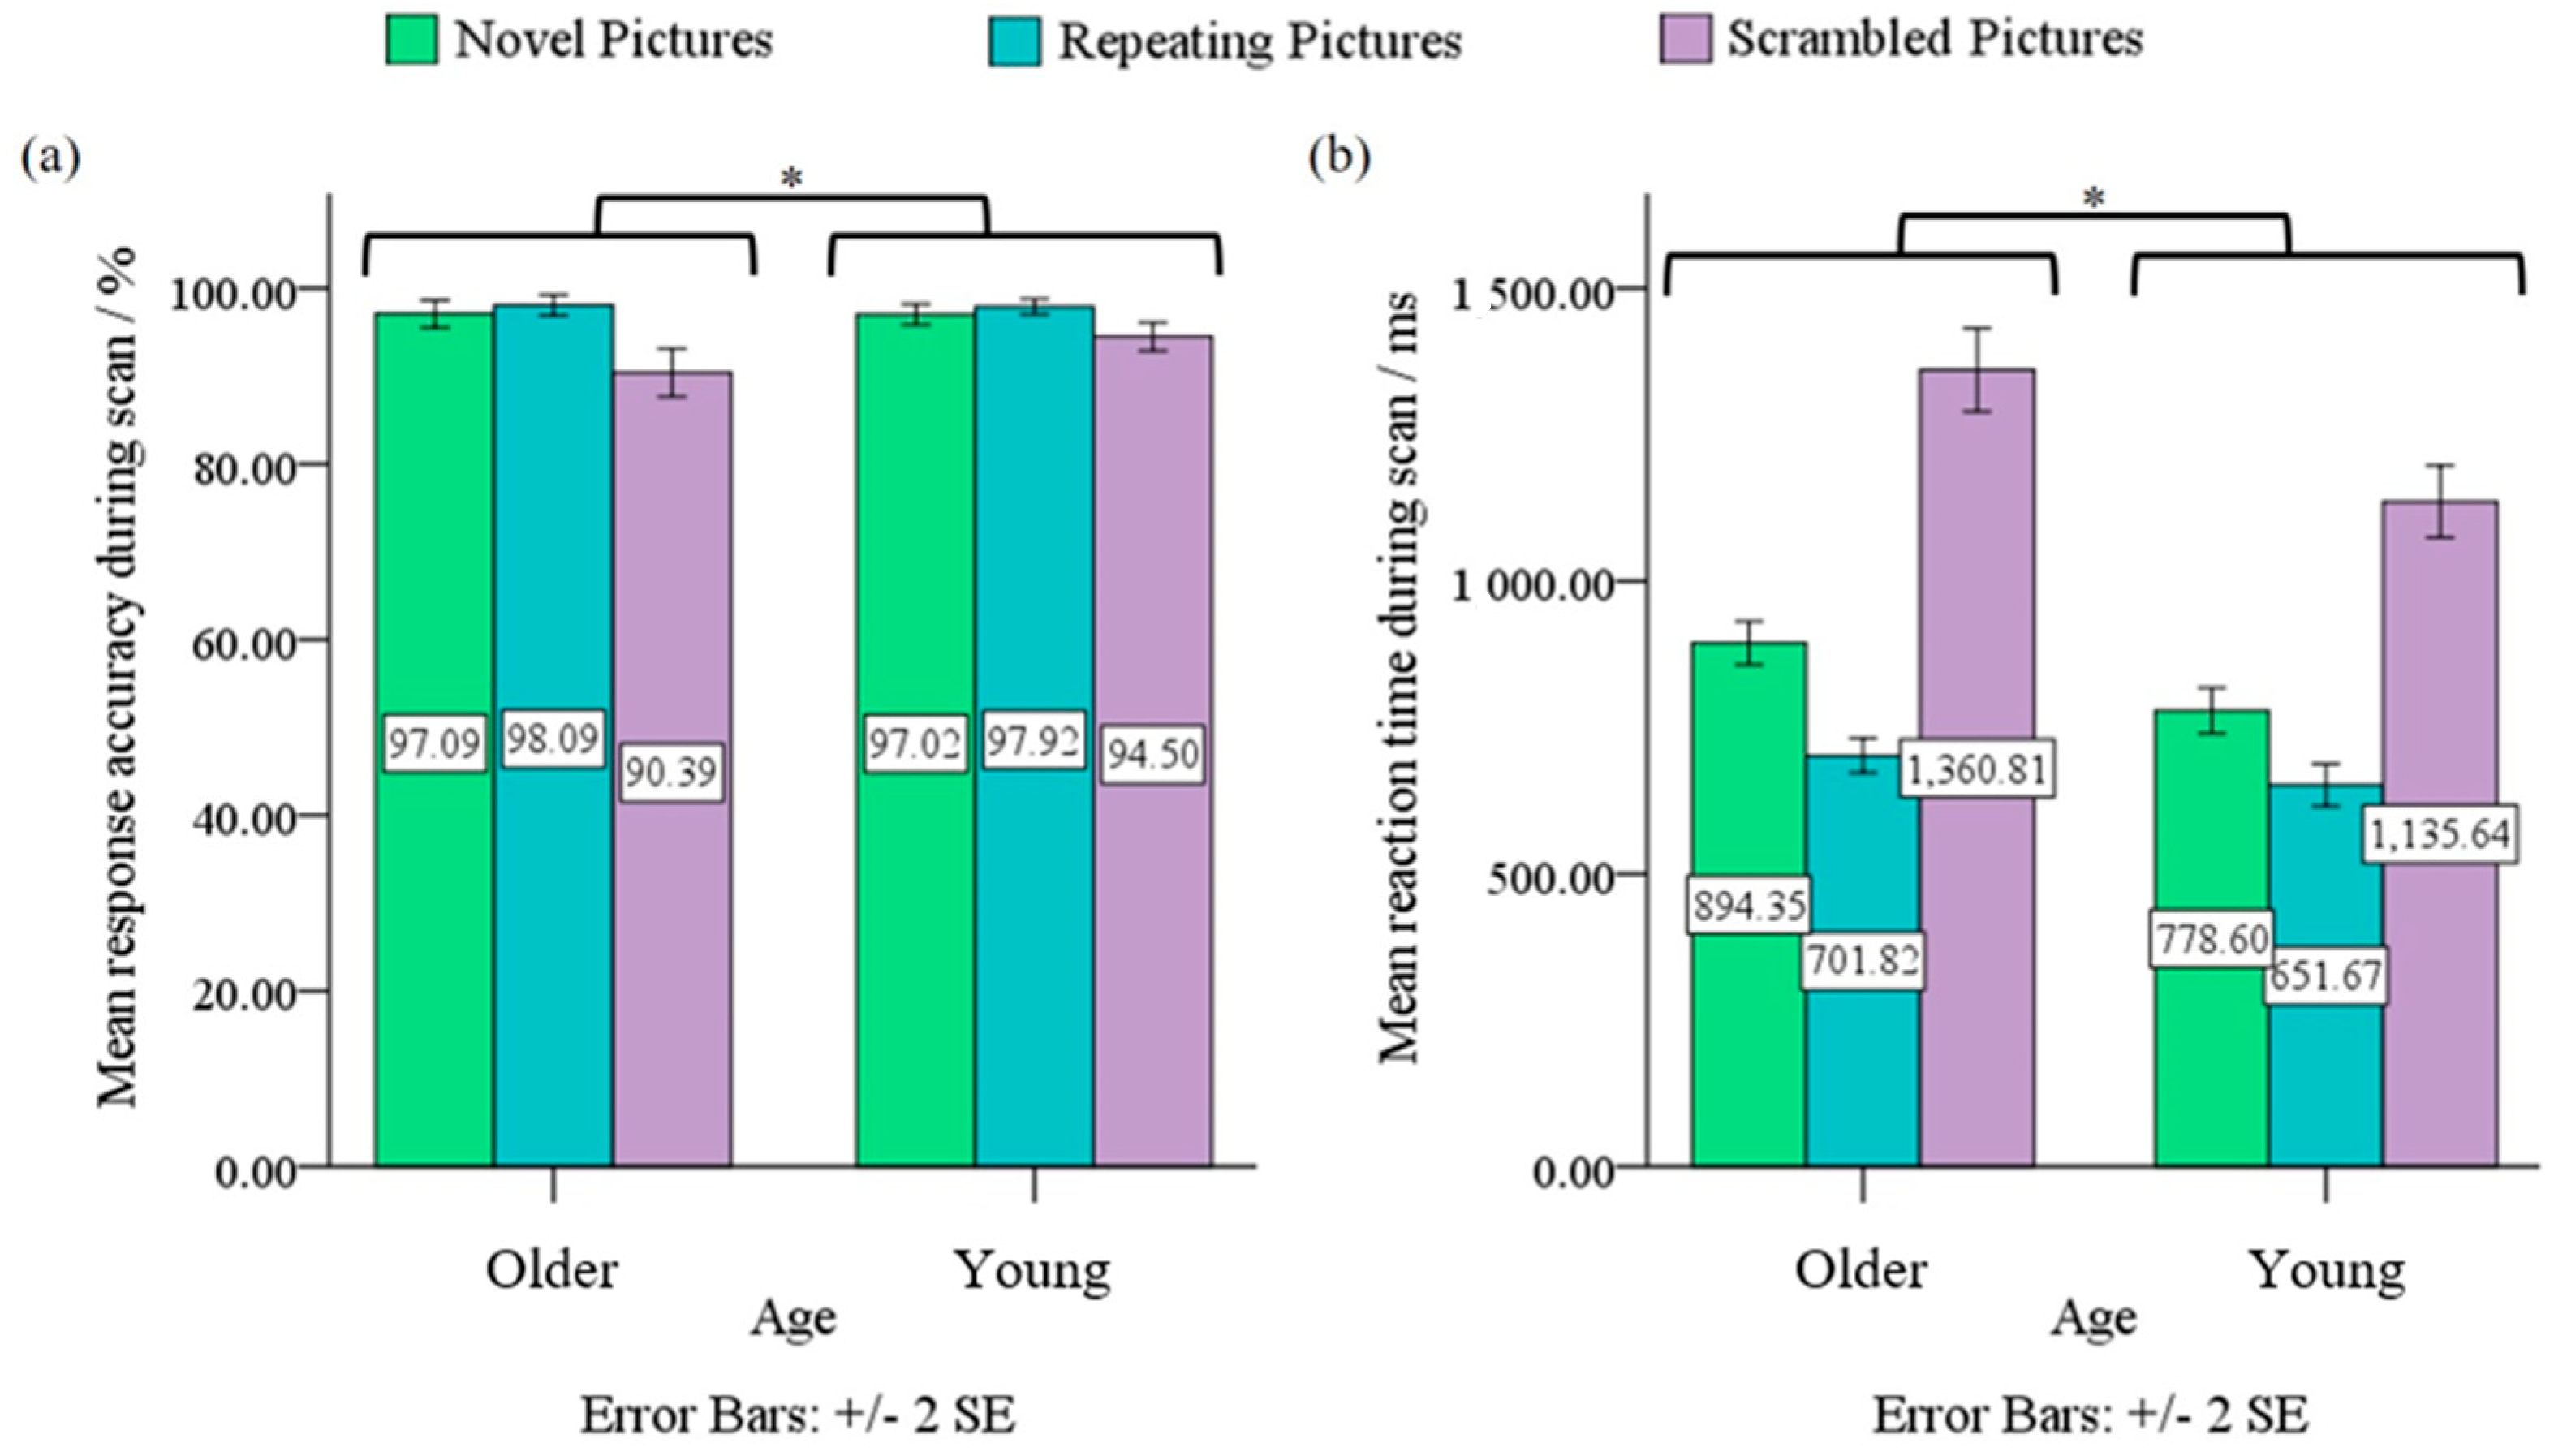
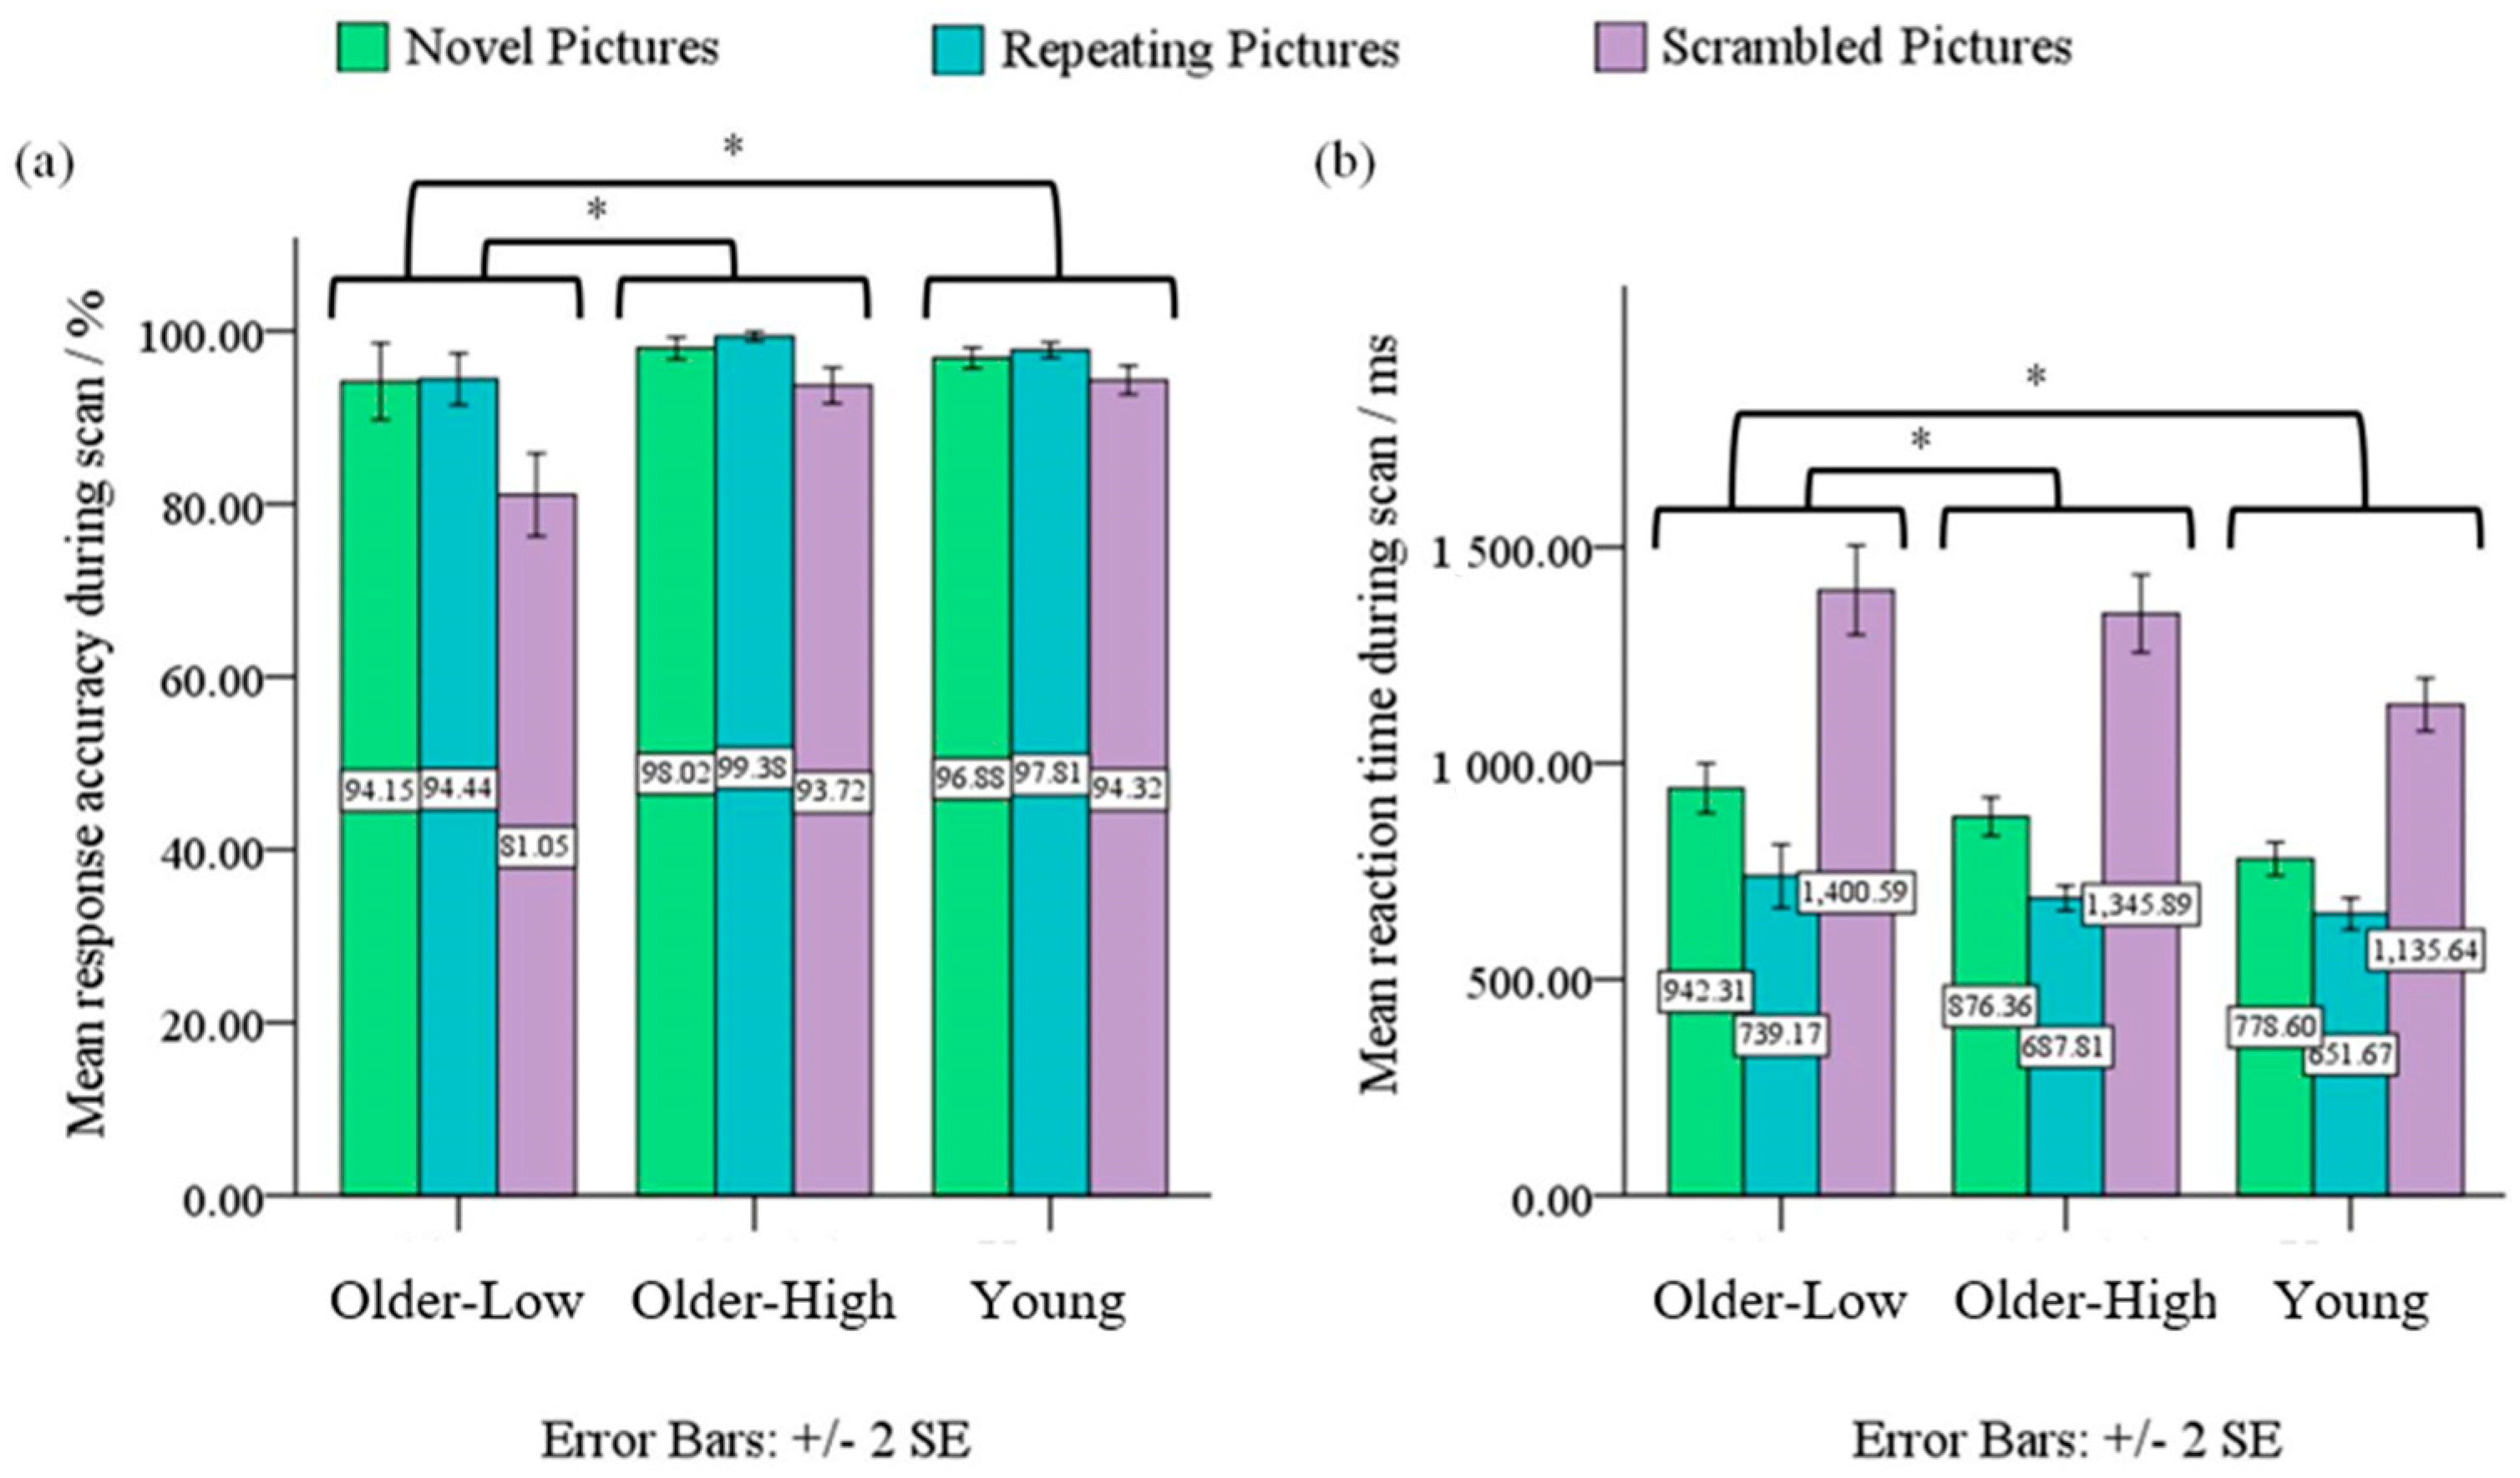
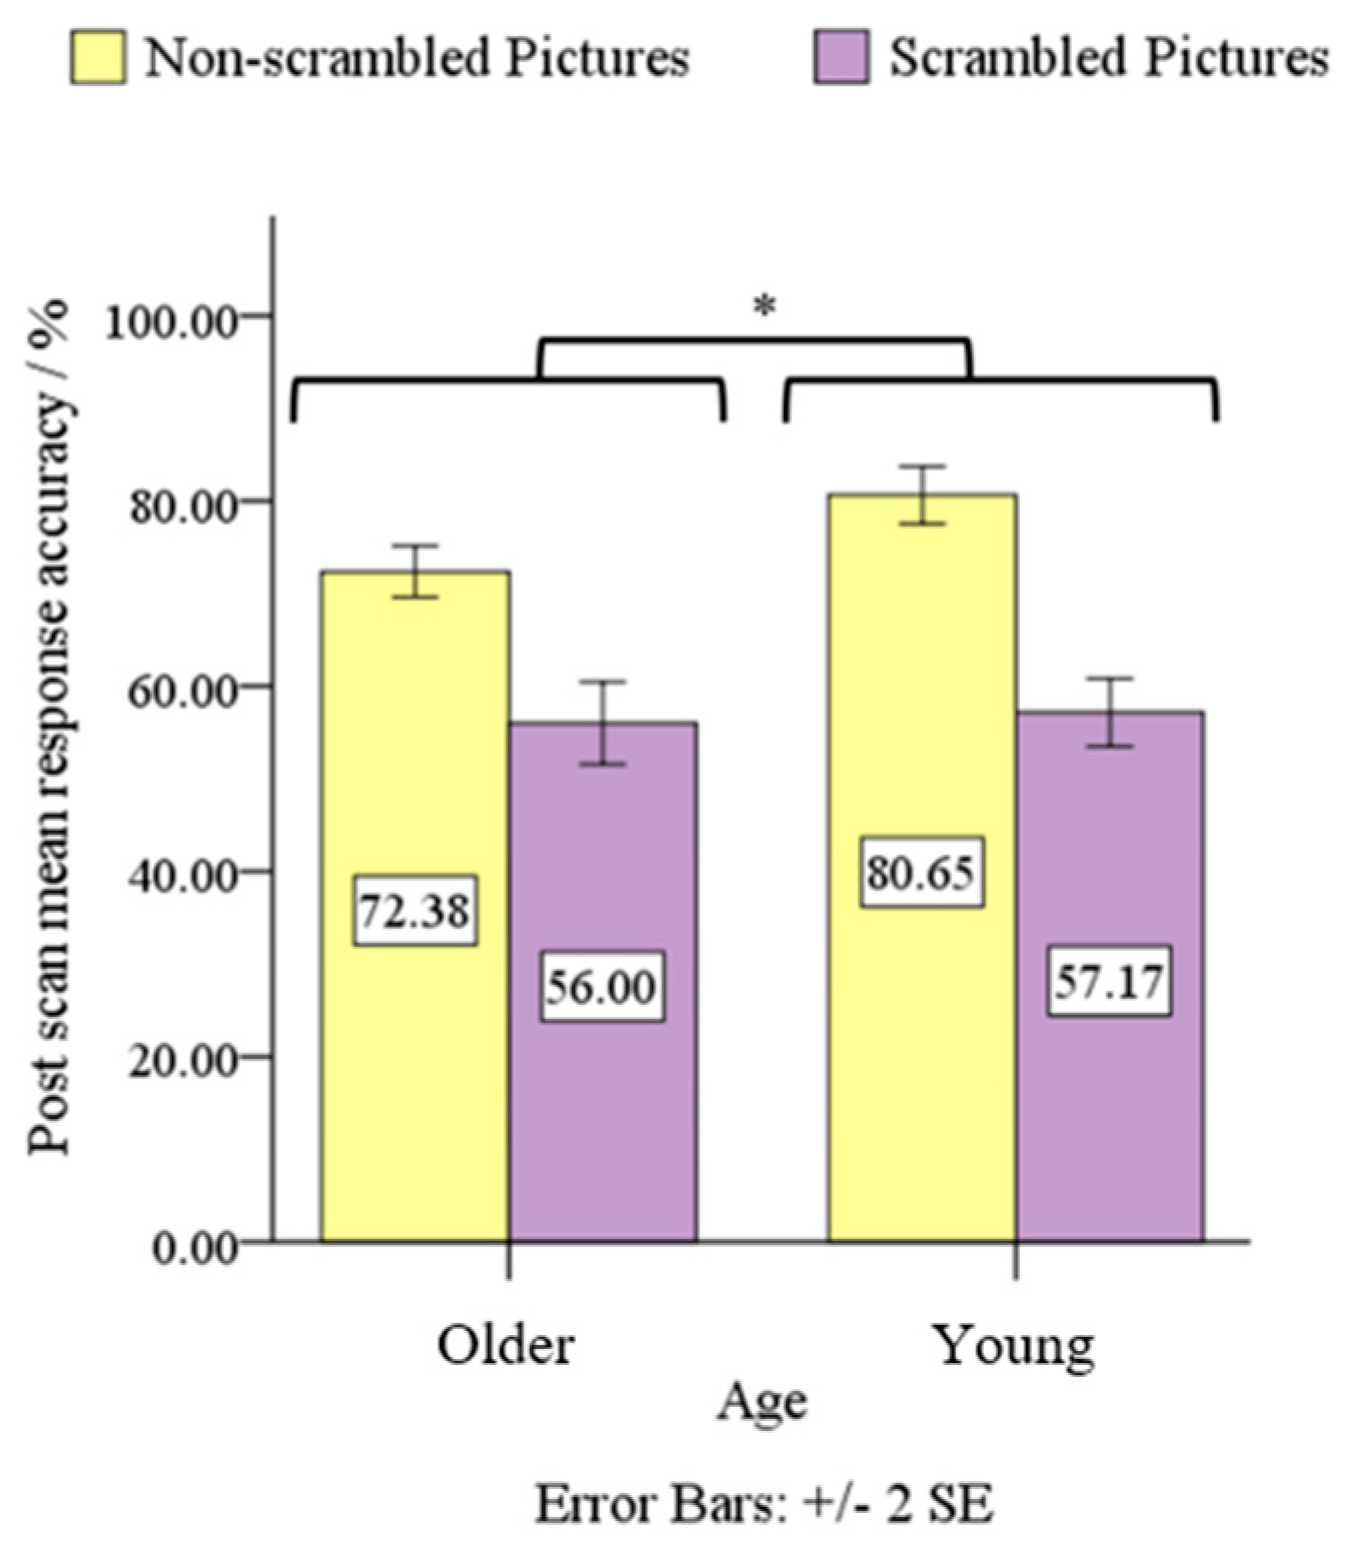
3.1. Behavioral Data
3.2. Functional Activation Analyses
3.3. Functional Connectivity Analyses
4. Discussion
4.1. The Extended PASA Model between IFG and Hippocampus/Parahippocampus
4.2. The Frontal Aspect of the PASA Model Was Not Replicated
4.3. Compensation vs. Dedifferentiation
4.4. Cerebellar Participation
4.5. Other Thoughts on the Analysis Method
4.6. Limitations and Future Directions
5. Conclusions
Author Contributions
Funding
Institutional Review Board Statement
Informed Consent Statement
Data Availability Statement
Acknowledgments
Conflicts of Interest
References
- Cabeza, R.; Grady, C.L.; Nyberg, L.; McIntosh, A.R.; Tulving, E.; Kapur, S.; Jennings, J.M.; Houle, S.; Craik, F.I. Age-related differences in neural activity during memory encoding and retrieval: A positron emission tomography study. J. Neurosci. 1997, 17, 391–400. [Google Scholar] [CrossRef] [PubMed]
- Madden, D.J.; Turkington, T.G.; Provenzale, J.M.; Denny, L.L.; Hawk, T.C.; Gottlob, L.R.; Coleman, R.E. Adult age differences in the functional neuroanatomy of verbal recognition memory. Hum. Brain Mapp. 1999, 7, 115–135. [Google Scholar] [CrossRef]
- Cabeza, R.; Anderson, N.D.; Locantore, J.K.; McIntosh, A.R. Aging gracefully: Compensatory brain activity in high-performing older adults. Neuroimage 2002, 17, 1394–1402. [Google Scholar] [CrossRef] [PubMed]
- Manenti, R.; Cotelli, M.; Miniussi, C. Successful physiological aging and episodic memory: A brain stimulation study. Behav. Brain Res. 2011, 216, 153–158. [Google Scholar] [CrossRef] [PubMed]
- Daselaar, S.M.; Fleck, M.S.; Dobbins, I.G.; Madden, D.J.; Cabeza, R. Effects of healthy aging on hippocampal and rhinal memory functions: An event-related fMRI study. Cereb. Cortex 2006, 16, 1771–1782. [Google Scholar] [CrossRef]
- Grady, C.L.; Maisog, J.M.; Horwitz, B.; Ungerleider, L.G.; Mentis, M.J.; Salerno, J.A.; Pietrini, P.; Wagner, E.; Haxby, J.V. Age-related changes in cortical blood flow activation during visual processing of faces and location. J. Neurosci. 1994, 14, 1450–1462. [Google Scholar] [CrossRef]
- Davis, S.W.; Dennis, N.A.; Daselaar, S.M.; Fleck, M.S.; Cabeza, R. Que PASA? The posterior-anterior shift in aging. Cereb. Cortex 2008, 18, 1201–1209. [Google Scholar] [CrossRef]
- Sala-Llonch, R.; Junqué, C.; Arenaza-Urquijo, E.M.; Vidal-Piñeiro, D.; Valls-Pedret, C.; Palacios, E.M.; Domènech, S.; Salvà, A.; Bargalló, N.; Bartrés-Faz, D. Changes in whole-brain functional networks and memory performance in aging. Neurobiol. Aging 2014, 35, 2193–2202. [Google Scholar] [CrossRef]
- Myrum, C. Is PASA passé?: Rethinking compensatory mechanisms in cognitive aging. J. Neurosci. 2019, 39, 786–787. [Google Scholar] [CrossRef]
- Phillips, L.H.; Andrés, P. The cognitive neuroscience of aging: New findings on compensation and connectivity. Cortex 2010, 46, 421–424. [Google Scholar] [CrossRef]
- Binder, J.R.; Bellgowan, P.S.F.; Hammeke, T.A.; Possing, E.T.; Frost, J.A. A comparison of two FMRI protocols for eliciting hippocampal activation. Epilepsia 2005, 46, 1061–1070. [Google Scholar] [CrossRef] [PubMed]
- Brewer, J.B.; Zhao, Z.; Desmond, J.E.; Glover, G.H.; Gabrieli, J.D. Making memories: Brain activity that predicts how well visual experience will be remembered. Science 1998, 281, 1185–1187. [Google Scholar] [CrossRef]
- Gutchess, A.H.; Welsh, R.C.; Hedden, T.; Bangert, A.; Minear, M.; Liu, L.L.; Park, D.C. Aging and the neural correlates of successful picture encoding: Frontal activations compensate for decreased medial-temporal activity. J. Cogn. Neurosci. 2005, 17, 84–96. [Google Scholar] [CrossRef] [PubMed]
- Ta, A.T.; Huang, S.-E.; Chiu, M.-J.; Hua, M.-S.; Tseng, W.-Y.I.; Chen, S.-H.A.; Qiu, A. Age-related vulnerabilities along the hippocampal longitudinal axis. Hum. Brain Mapp. 2012, 33, 2415–2427. [Google Scholar] [CrossRef] [PubMed]
- Miyakoshi, M.; Chen, S.-H.A.; Matsuo, K.; Wu, C.-Y.; Suzuki, A.; Nakai, T. Extensive stimulus repetition leads older adults to show delayed functional magnetic resonance imaging adaptation. Brain Imaging Behav. 2012, 6, 357–365. [Google Scholar] [CrossRef] [PubMed]
- Raz, N.; Gunning-Dixon, F.M.; Head, D.; Dupuis, J.H.; Acker, J.D. Neuroanatomical correlates of cognitive aging: Evidence from structural magnetic resonance imaging. Neuropsychology 1998, 12, 95–114. [Google Scholar] [CrossRef]
- Echávarri, C.; Aalten, P.; Uylings, H.B.M.; Jacobs, H.I.L.; Visser, P.J.; Gronenschild, E.H.B.M.; Verhey, F.R.J.; Burgmans, S. Atrophy in the parahippocampal gyrus as an early biomarker of Alzheimer’s disease. Brain Struct. Funct. 2011, 215, 265–271. [Google Scholar] [CrossRef] [PubMed]
- Folstein, M.F.; Folstein, S.E.; McHugh, P.R. Mini-mental state”. A practical method for grading the cognitive state of patients for the clinician. J. Psychiatr. Res. 1975, 12, 189–198. [Google Scholar] [CrossRef]
- Oldfield, R.C. The assessment and analysis of handedness: The Edinburgh inventory. Neuropsychologia 1971, 9, 97–113. [Google Scholar] [CrossRef]
- Friedman, L.; Glover, G.H.; Fbirn Consortium. Reducing interscanner variability of activation in a multicenter fMRI study: Controlling for signal-to-fluctuation-noise-ratio (SFNR) differences. Neuroimage 2006, 33, 471–481. [Google Scholar] [CrossRef]
- Giannelli, M.; Diciotti, S.; Tessa, C.; Mascalchi, M. Effect of echo spacing and readout bandwidth on basic performances of EPI-fMRI acquisition sequences implemented on two 1.5 T MR scanner systems. Med. Phys. 2010, 37, 303–310. [Google Scholar] [CrossRef] [PubMed]
- Friston, K.J.; Holmes, A.P.; Worsley, K.J.; Poline, J.P.; Frith, C.D.; Frackowiak, R.S.J. Statistical parametric maps in functional imaging: A general linear approach. Hum. Brain Mapp. 1994, 2, 189–210. [Google Scholar] [CrossRef]
- Ashburner, J. A fast diffeomorphic image registration algorithm. Neuroimage 2007, 38, 95–113. [Google Scholar] [CrossRef] [PubMed]
- Bergouignan, L.; Chupin, M.; Czechowska, Y.; Kinkingnéhun, S.; Lemogne, C.; Le Bastard, G.; Lepage, M.; Garnero, L.; Colliot, O.; Fossati, P. Can voxel based morphometry, manual segmentation and automated segmentation equally detect hippocampal volume differences in acute depression? Neuroimage 2009, 45, 29–37. [Google Scholar] [CrossRef]
- Peelle, J.E.; Cusack, R.; Henson, R.N.A. Adjusting for global effects in voxel-based morphometry: Gray matter decline in normal aging. Neuroimage 2012, 60, 1503–1516. [Google Scholar] [CrossRef]
- Casanova, R.; Srikanth, R.; Baer, A.; Laurienti, P.J.; Burdette, J.H.; Hayasaka, S.; Flowers, L.; Wood, F.; Maldjian, J.A. Biological parametric mapping: A statistical toolbox for multimodality brain image analysis. Neuroimage 2007, 34, 137–143. [Google Scholar] [CrossRef]
- Chai, X.J.; Castañón, A.N.; Ongür, D.; Whitfield-Gabrieli, S. Anticorrelations in resting state networks without global signal regression. Neuroimage 2012, 59, 1420–1428. [Google Scholar] [CrossRef]
- Whitfield-Gabrieli, S.; Nieto-Castanon, A. Conn: A functional connectivity toolbox for correlated and anticorrelated brain networks. Brain Connect. 2012, 2, 125–141. [Google Scholar] [CrossRef]
- Walter, B.; Blecker, C.; Kirsch, P.; Sammer, G.; Schienle, A.; Stark, R. MARINA: An Easy to use Tool for the Creationof MAsks for Region of Interest Analyses. 2003. Available online: https://www.researchgate.net/publication/286632632_MARINA_An_easy_to_use_tool_for_the_creation_of_MAsks_for_Region_of_INterest_Analyses (accessed on 3 March 2023).
- Brett, M.; Anton, J.L.; Valabrgue, R.; Poline, J.B. Region of Interest Analysis Using an SPM Toolbox. In Proceedings of the 8th International Conference on Functional Mapping of the Human Brain., Sendai, Japan, 2–6 June 2002; Volume 16. [Google Scholar] [CrossRef]
- Grady, C.L.; McIntosh, A.R.; Craik, F.I.M. Age-related differences in the functional connectivity of the hippocampus during memory encoding. Hippocampus 2003, 13, 572–586. [Google Scholar] [CrossRef]
- Tang, L.; Pruitt, P.J.; Yu, Q.; Homayouni, R.; Daugherty, A.M.; Damoiseaux, J.S.; Ofen, N. Differential functional connectivity in anterior and posterior hippocampus supporting the development of memory formation. Front. Hum. Neurosci. 2020, 14, 204. [Google Scholar] [CrossRef]
- Chai, X.J.; Ofen, N.; Jacobs, L.F.; Gabrieli, J.D.E. Scene complexity: Influence on perception, memory, and development in the medial temporal lobe. Front. Hum. Neurosci. 2010, 4, 21. [Google Scholar] [CrossRef] [PubMed]
- Bar, M. The proactive brain: Using analogies and associations to generate predictions. Trends Cogn. Sci. Regul. Ed. 2007, 11, 280–289. [Google Scholar] [CrossRef] [PubMed]
- Leshikar, E.D.; Gutchess, A.H.; Hebrank, A.C.; Sutton, B.P.; Park, D.C. The impact of increased relational encoding demands on frontal and hippocampal function in older adults. Cortex 2010, 46, 507–521. [Google Scholar] [CrossRef] [PubMed]
- Simons, J.S.; Koutstaal, W.; Prince, S.; Wagner, A.D.; Schacter, D.L. Neural mechanisms of visual object priming: Evidence for perceptual and semantic distinctions in fusiform cortex. Neuroimage 2003, 19, 613–626. [Google Scholar] [CrossRef] [PubMed]
- Kirchhoff, B.A.; Wagner, A.D.; Maril, A.; Stern, C.E. Prefrontal-temporal circuitry for episodic encoding and subsequent memory. J. Neurosci. 2000, 20, 6173–6180. [Google Scholar] [CrossRef]
- Schacter, D.L.; Wagner, A.D. Medial temporal lobe activations in fMRI and PET studies of episodic encoding and retrieval. Hippocampus 1999, 9, 7–24. [Google Scholar] [CrossRef]
- Buckner, R.L.; Kelley, W.M.; Petersen, S.E. Frontal cortex contributes to human memory formation. Nat. Neurosci. 1999, 2, 311–314. [Google Scholar] [CrossRef]
- Garrett, H.E. A developmental theory of intelligence. Am. Psychol. 1946, 1, 372–378. [Google Scholar] [CrossRef]
- Addis, D.R.; Moloney, E.E.J.; Tippett, L.J.; P Roberts, R.; Hach, S. Characterizing cerebellar activity during autobiographical memory retrieval: ALE and functional connectivity investigations. Neuropsychologia 2016, 90, 80–93. [Google Scholar] [CrossRef]
- Andreasen, N.C.; O’Leary, D.S.; Paradiso, S.; Cizadlo, T.; Arndt, S.; Watkins, G.L.; Ponto, L.L.B.; Hichwa, R.D. The cerebellum plays a role in conscious episodic memory retrieval. Hum. Brain Mapp. 1999, 8, 226–234. [Google Scholar] [CrossRef]
- Fliessbach, K.; Trautner, P.; Quesada, C.M.; Elger, C.E.; Weber, B. Cerebellar contributions to episodic memory encoding as revealed by fMRI. Neuroimage 2007, 35, 1330–1337. [Google Scholar] [CrossRef] [PubMed]
- Gatti, D.; Vecchi, T.; Mazzoni, G. Cerebellum and semantic memory: A TMS study using the DRM paradigm. Cortex 2021, 135, 78–91. [Google Scholar] [CrossRef] [PubMed]
- Hughes, M.L.; Agrigoroaei, S.; Jeon, M.; Bruzzese, M.; Lachman, M.E. Change in Cognitive Performance from Midlife Into Old Age: Findings from the Midlife in the United States (MIDUS) Study. J. Int. Neuropsychol. Soc. 2018, 24, 805–820. [Google Scholar] [CrossRef] [PubMed]


| Brain Region | Hemisphere | BA | Cluster Size | Peak Activation | MNI Coordinates | ||||
|---|---|---|---|---|---|---|---|---|---|
| p-Value (FDR-Corrected) | t-Value | x | y | z | |||||
| Old adults | |||||||||
| Superior frontal gyrus | R | 6 | 37 | <0.01 | 3.49 | 21 | −6 | 75 | |
| Precentral gyrus | R | 6 | 22 | <0.01 | 3.70 | 63 | 3 | 26.25 | |
| <0.05 | 2.38 | 63 | 6 | 15 | |||||
| 4 | 34 | <0.05 | 3.16 | 45 | −9 | 60 | |||
| <0.05 | 2.68 | 39 | −21 | 67.5 | |||||
| Postcentral gyrus | R | 1 | <0.05 | 2.41 | 54 | −18 | 56.25 | ||
| Superior temporal gyrus | L | 21 | 45 | <0.01 | 3.25 | −54 | −9 | −15 | |
| 22 | <0.01 | 3.24 | −63 | 3 | −11.25 | ||||
| Middle temporal gyrus | L | 21 | <0.05 | 2.86 | −60 | 6 | −22.5 | ||
| Fusiform gyrus | L | 19 | 13,263 | <0.001 | 12.51 | −27 | −60 | −7.5 | |
| Parahippocampal gyrus | L | 36 | <0.001 | 11.74 | −24 | −42 | −7.5 | ||
| R | <0.001 | 10.54 | 33 | −33 | −15 | ||||
| Cerebellum (Cbl) Lobule 9 | R | 106 | <0.001 | 4.83 | 21 | −42 | −48.75 | ||
| Old-High adults | |||||||||
| Middle frontal gyrus | R | 6 | 23 | <0.05 | 3.28 | 30 | 18 | 63.75 | |
| <0.05 | 2.80 | 33 | 27 | 56.25 | |||||
| Precentral gyrus | R | 6 | 104 | <0.01 | 3.78 | 60 | 3 | 26.25 | |
| 4 | <0.01 | 3.60 | 69 | −9 | 30 | ||||
| 6 | <0.01 | 3.57 | 66 | 9 | 15 | ||||
| 4 | 40 | <0.05 | 3.05 | 45 | −12 | 60 | |||
| Postcentral gyrus | R | 3 | <0.05 | 3.30 | 36 | −24 | 71.25 | ||
| <0.05 | 2.56 | 48 | −24 | 63.75 | |||||
| Superior temporal gyrus | R | 22 | 46 | <0.005 | 4.02 | 63 | 0 | −11.25 | |
| <0.005 | 3.97 | 63 | 9 | −11.25 | |||||
| Middle temporal gyrus | L | 21 | 77 | <0.01 | 3.72 | −63 | 0 | −15 | |
| <0.01 | 3.64 | −54 | −15 | −18.75 | |||||
| <0.05 | 3.42 | −60 | 6 | −22.5 | |||||
| Fusiform gyrus | L | 19 | 12,670 | <0.001 | 11.61 | −27 | −63 | −7.5 | |
| Hippocampus | R | <0.001 | 10.12 | 33 | −30 | −15 | |||
| Parahippocampal gyrus | L | 36 | <0.001 | 10.03 | −24 | −42 | −7.5 | ||
| Cbl Lobule 9 | R | 48 | <0.005 | 3.94 | 21 | −42 | −48.75 | ||
| Cbl Lobule 8 | <0.05 | 2.78 | 33 | −48 | −52.5 | ||||
| Cbl Louble 9 | <0.05 | 2.61 | 15 | −54 | −45 | ||||
| Young adults | |||||||||
| Middle frontal gyrus | R | 46 | 38 | <0.005 | 3.32 | 51 | 42 | 15 | |
| Fusiform gyrus | R | 37 | 23,638 | <0.001 | 16.38 | 33 | −45 | −15 | |
| Hippocampus | R | <0.001 | 15.79 | 36 | −36 | −11.25 | |||
| Parahippocampal gyrus | L | 36 | <0.001 | 18.01 | −30 | −42 | −7.5 | ||
| Brain Region | Hemisphere | BA | Cluster Size | Peak Activation | MNI Coordinates | ||||
|---|---|---|---|---|---|---|---|---|---|
| p-Value (FDR-Corrected) | t-Value | x | y | z | |||||
| Old adults | |||||||||
| Superior frontal gyrus | L | 9 | 563 | <0.001 | 5.66 | −12 | 60 | 11.25 | |
| Superior temporal gyrus | R | 39 | 199 | <0.001 | 7.10 | 57 | −57 | 22.5 | |
| L | 38 | 226 | <0.001 | 7.10 | −54 | −3 | −11.25 | ||
| <0.005 | 4.71 | −45 | 9 | −30 | |||||
| R | 22 | 86 | <0.005 | 4.26 | 60 | 3 | −11.25 | ||
| Middle temporal gyrus | L | 39 | 302 | <0.001 | 9.06 | −42 | −72 | 33.75 | |
| 21 | 226 | <0.01 | 3.97 | −54 | −18 | −18.75 | |||
| Angular gyrus | L | 39 | 302 | <0.001 | 9.53 | −42 | −75 | 41.25 | |
| Middle temporal gyrus | R | 21 | 86 | <0.005 | 4.40 | 51 | −9 | −18.75 | |
| Insula | R | 13 | 95 | <0.001 | 5.24 | 39 | −18 | 18.75 | |
| L | 27 | <0.005 | 4.22 | −36 | −24 | 22.5 | |||
| Cingulate gyrus | L | 31 | 716 | <0.001 | 5.57 | 3 | −60 | 30 | |
| Anterior cingulate | L | 24 | 563 | <0.001 | 7.64 | 0 | 24 | −15 | |
| 32 | <0.001 | 6.05 | 0 | 51 | −11.25 | ||||
| Posterior cingulate | L | 30 | 716 | <0.001 | 9.85 | −9 | −54 | 15 | |
| R | 23 | <0.001 | 8.00 | 12 | −54 | 18.75 | |||
| Hippocampus | L | 372 | <0.001 | 8.86 | −30 | −27 | −15 | ||
| Parahippocampal gyrus | L | 36 | 372 | <0.001 | 10.45 | −27 | −42 | −7.5 | |
| R | 325 | <0.001 | 7.74 | 30 | −45 | −7.5 | |||
| 35 | <0.001 | 7.14 | 30 | −30 | −15 | ||||
| 28 | <0.001 | 6.25 | 21 | −12 | −18.75 | ||||
| Old-High adults | |||||||||
| Superior frontal gyrus | L | 9 | 590 | <0.001 | 6.91 | −12 | 60 | 11.25 | |
| Superior temporal gyrus | R | 39 | 183 | <0.001 | 8.43 | 57 | −57 | 22.5 | |
| L | 38 | 210 | <0.001 | 6.68 | −54 | −3 | −11.25 | ||
| <0.005 | 4.67 | −45 | 9 | −30 | |||||
| R | 38 | 93 | <0.005 | 4.72 | 60 | 0 | −15 | ||
| Middle temporal gyrus | L | 39 | 296 | <0.001 | 8.76 | −45 | −72 | 33.75 | |
| 21 | 210 | <0.005 | 5.19 | −54 | −12 | −18.75 | |||
| Inferior temporal gyrus | R | 20 | 93 | <0.01 | 4.22 | 51 | −9 | −22.5 | |
| Angular gyrus | L | 39 | 296 | <0.001 | 8.98 | −42 | −75 | 41.25 | |
| Superior occipital gyrus | L | 19 | 296 | <0.001 | 9.73 | −42 | −81 | 33.75 | |
| Insula | R | 13 | 76 | <0.005 | 5.48 | 39 | −18 | 18.75 | |
| L | 13 | 27 | <0.01 | 4.34 | −36 | −18 | 18.75 | ||
| <0.05 | 4.06 | −42 | −12 | 15 | |||||
| Cingulate gyrus | L | 31 | 642 | <0.005 | 5.62 | 3 | −60 | 30 | |
| Anterior cingulate | L | 32 | 590 | <0.001 | 7.12 | −9 | 48 | −3.75 | |
| <0.001 | 6.90 | −3 | 51 | −11.25 | |||||
| R | 24 | 25 | <0.01 | 4.36 | 3 | 27 | 11.25 | ||
| Posterior cingulate | L | 23 | 642 | <0.001 | 9.37 | −9 | −57 | 18.75 | |
| R | 23 | 642 | <0.001 | 7.77 | 12 | −54 | 18.75 | ||
| Parahippocampal gyrus | L | 36 | 337 | <0.001 | 8.75 | −27 | −42 | −7.5 | |
| <0.001 | 7.66 | −30 | −30 | −18.75 | |||||
| <0.001 | 6.44 | −24 | −12 | −22.5 | |||||
| R | 36 | 294 | <0.001 | 6.92 | 27 | −45 | −7.5 | ||
| 35 | <0.001 | 6.11 | 30 | −30 | −15 | ||||
| 28 | <0.005 | 5.35 | 21 | −12 | −18.75 | ||||
| Young adults | |||||||||
| Inferior frontal gyrus | R | 47 | 30 | <0.001 | 5.05 | 33 | 33 | −11.25 | |
| Middle temporal gyrus | L | 39 | 13,094 | <0.001 | 16.56 | −45 | −72 | 30 | |
| Posterior cingulate | L | 30 | 13,094 | <0.001 | 16.82 | −12 | −54 | 15 | |
| Parahippocampal gyrus | L | 36 | 13,094 | <0.001 | 17.72 | −30 | −42 | −11.25 | |
| Cbl Crus I | R | 237 | <0.001 | 7.70 | 45 | −75 | −37.5 | ||
| Cbl Crus II | L | 54 | <0.001 | 4.50 | −12 | −90 | −37.5 | ||
| R | 237 | <0.001 | 7.58 | 18 | −90 | −33.75 | |||
| Cbl Crus I | <0.001 | 6.76 | 33 | −90 | −33.75 | ||||
| Cbl Crus II | L | 54 | <0.001 | 4.74 | −27 | −90 | −33.75 | ||
| Cbl Lobule 9 | R | 37 | <0.005 | 3.77 | 6 | −51 | −45 | ||
| <0.005 | 3.63 | 3 | −57 | −52.5 | |||||
| Young > Old adults | |||||||||
| Superior frontal gyrus | L | 6 | 125 | <0.05 | 3.90 | −24 | 21 | 56.25 | |
| R | 6 | 38 | <0.05 | 3.47 | 12 | 18 | 56.25 | ||
| <0.05 | 3.30 | 21 | 21 | 48.75 | |||||
| 10 | 29 | <0.05 | 3.47 | 33 | 57 | 3.75 | |||
| Middle frontal gyrus | L | 6 | 125 | <0.05 | 3.56 | −27 | 12 | 45 | |
| R | 8 | 38 | <0.05 | 3.54 | 27 | 30 | 41.25 | ||
| Inferior frontal gyrus | L | 45 | 33 | <0.05 | 4.64 | −60 | 21 | 0 | |
| Medial frontal gyrus | L | 8 | 125 | <0.05 | 4.97 | −9 | 27 | 45 | |
| R | 6 | 360 | <0.05 | 4.73 | 6 | −18 | 63.75 | ||
| <0.05 | 4.06 | 6 | −12 | 52.5 | |||||
| Precentral gyrus | L | 6 | 360 | <0.05 | 4.30 | −15 | −12 | 63.75 | |
| Inferior parietal lobule | R | 40 | 50 | <0.05 | 4.21 | 57 | −45 | 45 | |
| Precuneus | L | 7 | 229 | <0.05 | 4.42 | −9 | −60 | 45 | |
| <0.05 | 4.05 | −6 | −72 | 48.75 | |||||
| R | 39 | 58 | <0.05 | 3.74 | 45 | −69 | 41.25 | ||
| Superior temporal gyrus | R | 13 | 22 | <0.05 | 3.70 | 51 | −48 | 18.75 | |
| Middle temporal gyrus | L | 39 | 30 | <0.05 | 4.26 | −48 | −78 | 15 | |
| R | 39 | 58 | <0.05 | 3.96 | 48 | −75 | 33.75 | ||
| 21 | 60 | <0.05 | 3.92 | 69 | −42 | 0 | |||
| 22 | <0.05 | 3.83 | 57 | −45 | 0 | ||||
| 21 | <0.05 | 3.12 | 69 | −48 | 11.25 | ||||
| Cuneus | R | 19 | 229 | <0.05 | 4.36 | 21 | −81 | 41.25 | |
| L | 18 | 22 | <0.05 | 3.54 | −12 | −84 | 33.75 | ||
| Lingual gyrus | L | 18 | 58 | <0.05 | 4.75 | −27 | −99 | 0 | |
| R | 18 | 25 | <0.05 | 3.23 | 18 | −90 | −11.25 | ||
| Cingulate gyrus | L | 31 | 22 | <0.05 | 4.20 | −24 | −42 | 26.25 | |
| Anterior cingulate | R | 32 | 143 | <0.05 | 5.05 | 12 | 51 | −11.25 | |
| <0.05 | 4.93 | 18 | 39 | 0 | |||||
| <0.05 | 4.83 | 15 | 42 | −7.5 | |||||
| Posterior cingulate | L | 30 | 35 | <0.05 | 3.96 | −24 | −57 | 15 | |
| <0.05 | 3.54 | −6 | −66 | 18.75 | |||||
| Parahippocampal gyrus | R | 36 | 31 | <0.05 | 4.13 | 30 | −33 | −15 | |
| 30 | 33 | <0.05 | 4.06 | 24 | −45 | 11.25 | |||
| <0.05 | 3.22 | 18 | −42 | 0 | |||||
| L | 30 | 48 | <0.05 | 3.66 | −18 | −42 | −7.5 | ||
| <0.05 | 3.55 | −15 | −42 | 0 | |||||
| R | 21 | <0.05 | 3.52 | 33 | −15 | −22.5 | |||
| Fusiform gyrus | L | 48 | <0.05 | 3.78 | −21 | −42 | −15 | ||
| Cbl Crus I | R | 25 | <0.05 | 3.34 | 21 | −87 | −18.75 | ||
| Cbl Lobule 7b | R | 180 | <0.05 | 3.95 | 30 | −75 | −48.75 | ||
| Cbl Crus II | L | 86 | <0.05 | 3.67 | −30 | −75 | −45 | ||
| <0.05 | 3.61 | −39 | −72 | −37.5 | |||||
| <0.05 | 3.57 | −27 | −87 | −37.5 | |||||
| Cbl Lobule 8 | R | 180 | <0.05 | 4.53 | 36 | −54 | −52.5 | ||
| Cbl Crus I | <0.05 | 4.33 | 39 | −63 | −41.25 | ||||
| Cbl Lobule 9 | 33 | <0.05 | 4.00 | 6 | −60 | −52.5 | |||
| Young > Old-Low adults | |||||||||
| Parahippocampal gyrus | L | 36 | 25 | <0.05 | 5.32 | −30 | −24 | −26.25 | |
| R | 35 | 49 | <0.05 | 4.62 | 30 | −30 | −18.75 | ||
| 36 | <0.05 | 4.42 | 36 | −27 | −26.25 | ||||
| <0.05 | 4.34 | 36 | −24 | −18.75 | |||||
| ROI-ROI | β | p-Value (FDR-Corrected) | t-Value | |
|---|---|---|---|---|
| Old-Low adults | ||||
| Left parahippocampus–Right parahippocampus | 0.12 | <0.05 | 5.83 | |
| Young adults | ||||
| Left hippocampus–Right hippocampus | 0.12 | <0.05 | 2.92 | |
| Young > Old-Low adults | ||||
| Left IFG–Right hippocampus | −0.15 | 0.06 | −2.05 | |
| Left IFG–Right parahippocampus | −0.23 | 0.06 | −2.20 | |
Disclaimer/Publisher’s Note: The statements, opinions and data contained in all publications are solely those of the individual author(s) and contributor(s) and not of MDPI and/or the editor(s). MDPI and/or the editor(s) disclaim responsibility for any injury to people or property resulting from any ideas, methods, instructions or products referred to in the content. |
© 2023 by the authors. Licensee MDPI, Basel, Switzerland. This article is an open access article distributed under the terms and conditions of the Creative Commons Attribution (CC BY) license (https://creativecommons.org/licenses/by/4.0/).
Share and Cite
Miyakoshi, M.; Archer, J.A.; Wu, C.-Y.; Nakai, T.; Chen, S.-H.A. Age-Related Changes in Episodic Processing of Scenes: A Functional Activation and Connectivity Study. Sensors 2023, 23, 4107. https://doi.org/10.3390/s23084107
Miyakoshi M, Archer JA, Wu C-Y, Nakai T, Chen S-HA. Age-Related Changes in Episodic Processing of Scenes: A Functional Activation and Connectivity Study. Sensors. 2023; 23(8):4107. https://doi.org/10.3390/s23084107
Chicago/Turabian StyleMiyakoshi, Makoto, Josephine Astrid Archer, Chiao-Yi Wu, Toshiharu Nakai, and Shen-Hsing Annabel Chen. 2023. "Age-Related Changes in Episodic Processing of Scenes: A Functional Activation and Connectivity Study" Sensors 23, no. 8: 4107. https://doi.org/10.3390/s23084107
APA StyleMiyakoshi, M., Archer, J. A., Wu, C.-Y., Nakai, T., & Chen, S.-H. A. (2023). Age-Related Changes in Episodic Processing of Scenes: A Functional Activation and Connectivity Study. Sensors, 23(8), 4107. https://doi.org/10.3390/s23084107