1. Introduction
Gaseous ammonia has a chemical formula NH
3, a molecular weight 17,031 g/mol, and dipole moment 1.42 D [
1]. Thanks to its electro-positivity, an ammonium cation is easily produced, showing alkaline behavior in an aqueous environment.
Gaseous ammonia is one of the gases we can consider as a normal part of our environment. It is one of the metabolites produced by the rotary bacterium, and, for example, in a mixture of gases exhaled by humans in indoor conditions, it is contained at concentrations of 10–70 ppb [
2]. It is worth noting that, in the latter case, the ammonia content provides important information on metabolic processes in the body and is an indicator of a number of severe diseases such as lung cancer.
At an industrial scale, ammonia gas is synthesized by catalytic Haber–Bosch reaction from N
2 and H
2 and further used as a starting reactant for the production of nitrates and ammonium salts. Thanks to its gas/liquid phase transformation critical points at temperature 405.4 K and pressure 11.3 MPa [
3], ammonia gas is used as a cooling medium in large-scale freezing systems (food storage, cooling trucks and boats, artificial skating rinks and hockey halls, etc.). Significant release of ammonia gas also occurs in farming (poultry or cattle breeding).
The human sense of smell perceives (unpleasantly) the presence of ammonia at concentrations of ca. 50 ppm in the air. At higher concentrations, ammonia gas acts as irritating to the breathing apparatus. Concentration levels of ca. 5000 ppm and higher are considered dangerous to fatal. Ammonia poisoning is manifested by a nerve paralysis of muscles, preventing the affected victim from leaving the place of exposure [
4].
Quantitatively exact, sensitive, reversible, and chemically selective detection of gaseous ammonia is thus needed for many practical reasons, among which belong primarily systems of early warning of ammonia leaks in industrial production localities, and also precise and continuous analysis of the content of ammonia in breath implemented as one of the possible functions of a personal physical function monitor. Major detection principles used recently in ammonia gas sensing (involving electric conductometry, electrochemistry, tunable diode laser spectroscopy, surface acoustic waves analysis, field effect transistor structures, and carbon nanomaterials—cf. e.g., the recent reviews [
5,
6,
7]) comply with the requirements of industrial applications; for a wider employment in personnel medicine, however, the current detectors are still unsatisfactory, both in the concentration sensitivity and temporal response speed, and also in the sensing selectivity and reversibility.
One of the ways in which to increase the detector sensitivity limit is to use the high level of electric field gain provided by the excitation of electronic plasmon oscillations in metals (further on, we restrict exclusively to optical excitation of plasmon oscillations). By placing a suitably responding transducer into a space with a high level of the plasmonic evanescent field, a significant reinforcement of the transmitter response can be achieved based on the continuity of the electric field back to the optical excitation and registration system. This physical principle has been developed in a number of sophisticated detection schemes in the last 50 years and new properties are still being discovered [
8,
9,
10,
11,
12]. The plasmonic detection schemes that can be, in principle, divided into two groups are: the systems relying on surface plasmon polaritons excited on the continuous metal surface (propagating surface plasmons), and the systems in which local plasmonic modes occur in isolated nanostructures (localized surface plasmons). The design of the sensing element presented in this contribution is based on the use of the second of these two options. Specific target gas sensitivity is ensured by the use of organometallic reagent successfully applied in our previous studies dealing with ammonia gas detection by means of sensors based on modified optical fibers [
13,
14].
2. Materials and Methods
2.1. Preparation and Characterization of Sensing Structures
Deposition system HVD RHVm42 (Hoch Vakuum Dresden, Dresden, Germany) was employed in preparation of starting Au plasmonic layers by physical vapor deposition (PVD) method in vacuum (5 × 10
−5 Pa) from Au melt prepared in a Mo electrically heated boat. The layers with thickness within 50–60 nm were deposited on glass BK-7 substrates covered by an intermediate Cr layer. The raw metals were supplied by Sigma-Aldrich s.r.o., Prague, Czech Republic. The layers’ thickness was checked by the Fresnel fit to the attenuated total reflection (ATR) spectrum containing the minimum corresponding to the resonant surface plasmon polariton (SPP) excitation. The measurements were performed in monochromatic Kretschmann configuration (λ = 633 nm) on our home-made ATR system [
14]. Dielectric permittivity value ε = 11.8 + 1.5i was used in a Fresnel fitting procedure for the Au layer.
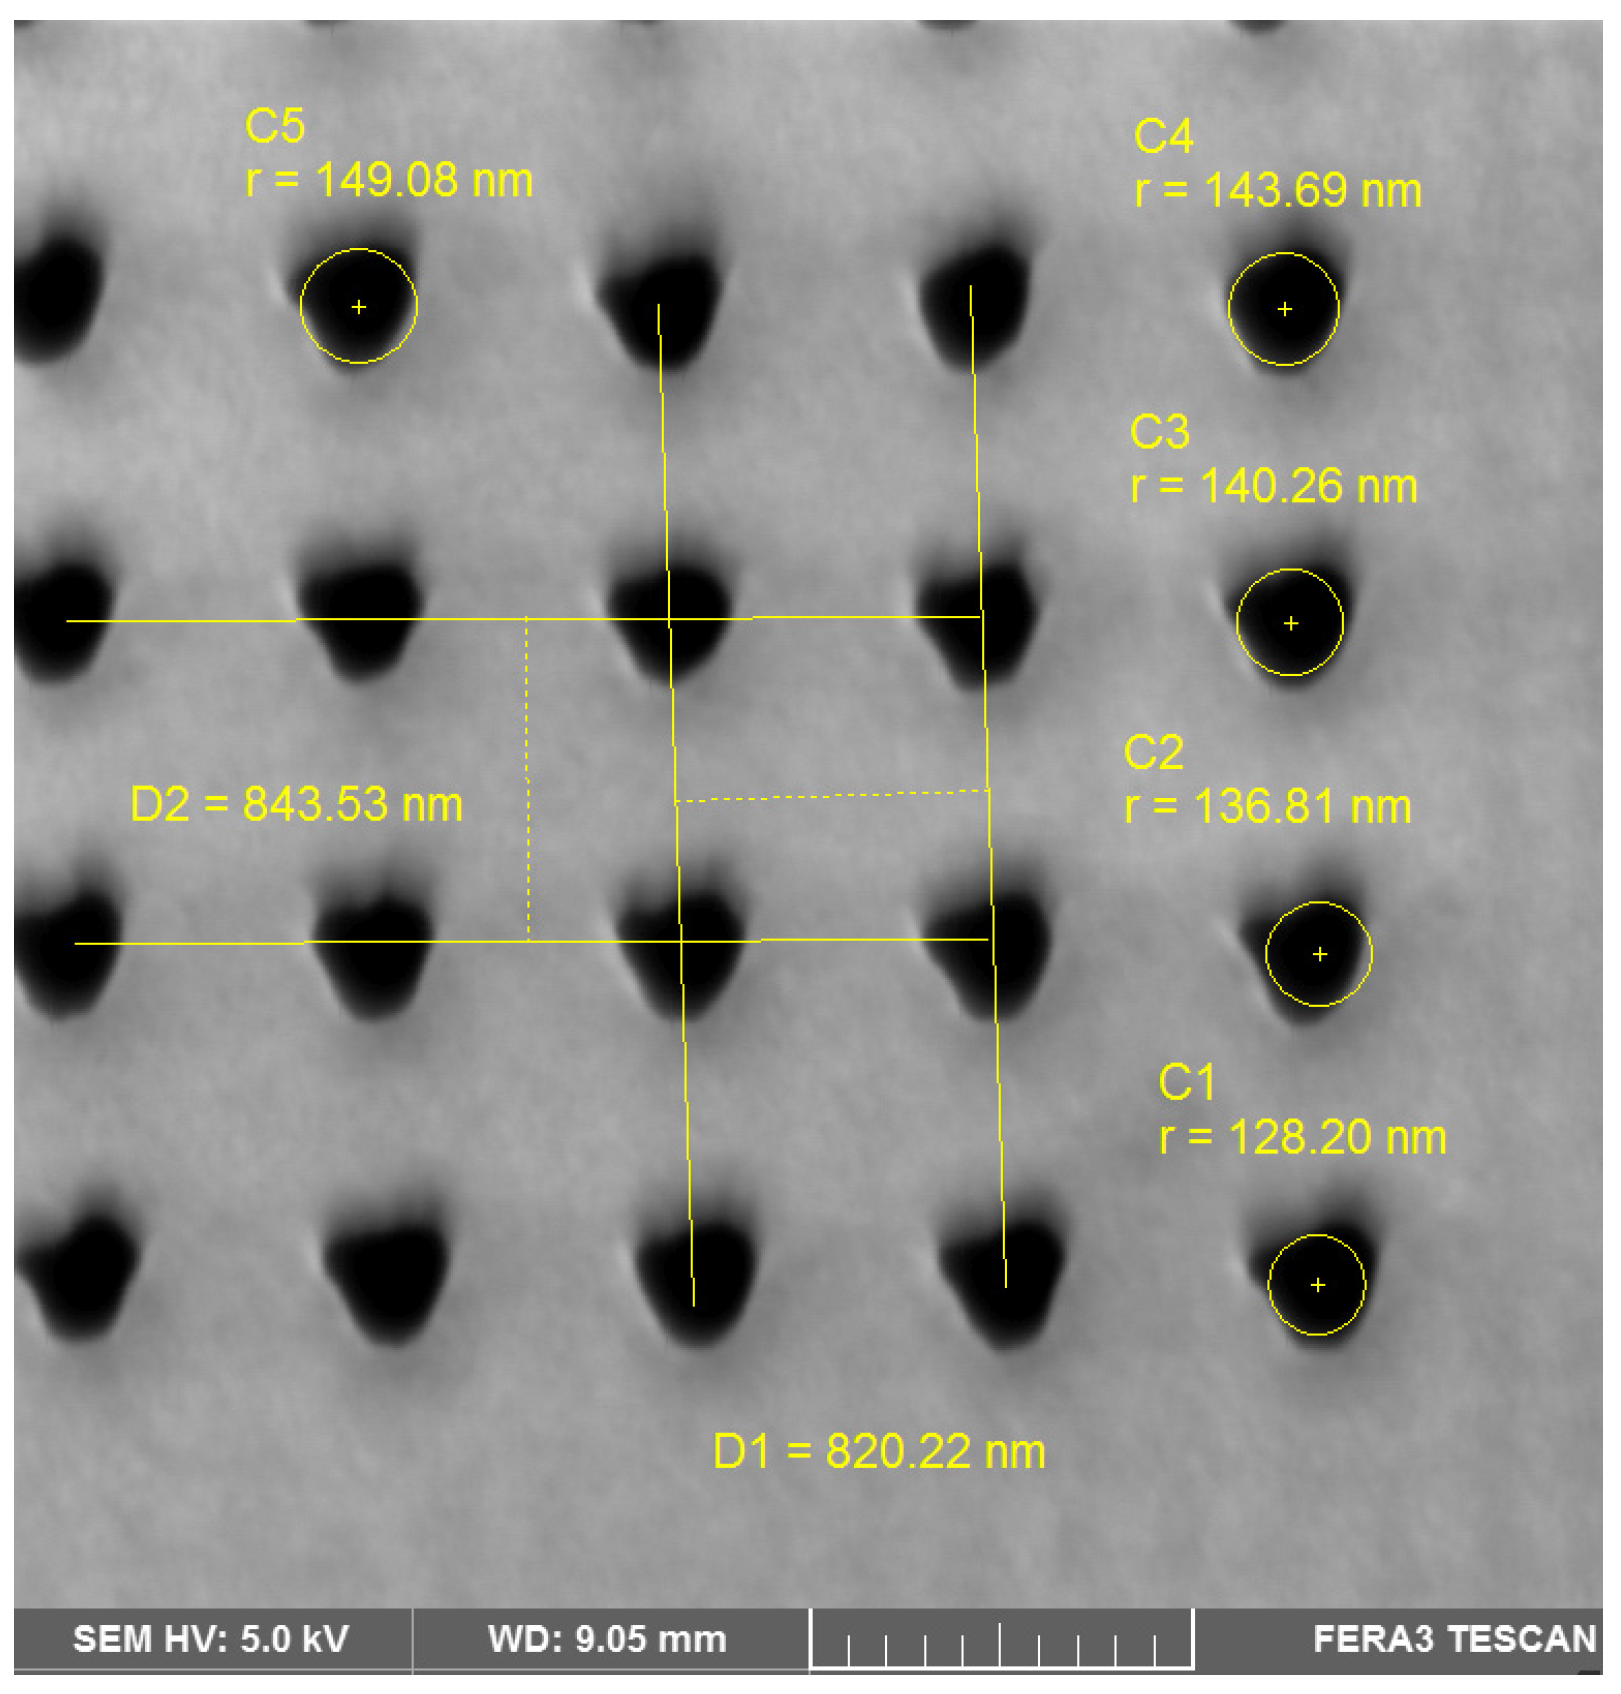
A periodic rectangular grid of nanoholes was then drilled in the prepared Au layers by focused ionic beam (FIB) method. The drilling was performed on the TESCAN Ferra 3 scanning electron microscope (SEM) equipped with Xe-FIB device (Tescan Orsay Holding a.s., Brno, Czech Republic). After necessary optimization of the drilling parameters, the final 200 × 200 square grid of nanoholes was obtained with the diameter and perpendicular translation periods set to 300 nm and 830 nm, respectively. A detailed view of one of the obtained grid corners is shown in
Figure 1. Certain imperfections in the drilled structure shape and dimensions are apparent.
Using a standard spin-coating technique, the Au layer with the prepared nano-grid was then covered by a thin layer composed of polydimethylsiloxane (PDMS). Thermally cured PDMS formulation Sylgard 184 (Dow Corning, Midland, MI, USA) was used. The mean thickness 160 ± 10 nm of the PDMS layer was obtained from atomic force microscope (AFM) scan performed over a scratch made in the PDMS slab beside the nano-grid area. LiteScope AFM (NenoVision s.r.o., Brno, Czech Republic) equipped with Akyiama self-sensing probe was used.
The PDMS coating covering the nano-grid was then sensitized by soaking the selected organometallic reagent consisting of Co
2+ complex with 5-(4′-dioctylamino-phenylimino)-quinoline-8-one ligands (Co-DPQ) in the PDMS buffer, providing the required sensitivity of the whole sensing structure to ammonia gas. More details about the reagent synthesis, PDMS sensitization procedure, optical properties, and reaction mechanism of the reagent with ammonia gas have been given in our former reports [
13,
14].
2.2. Experimental Setup Used to Test Response to Ammonia Gas
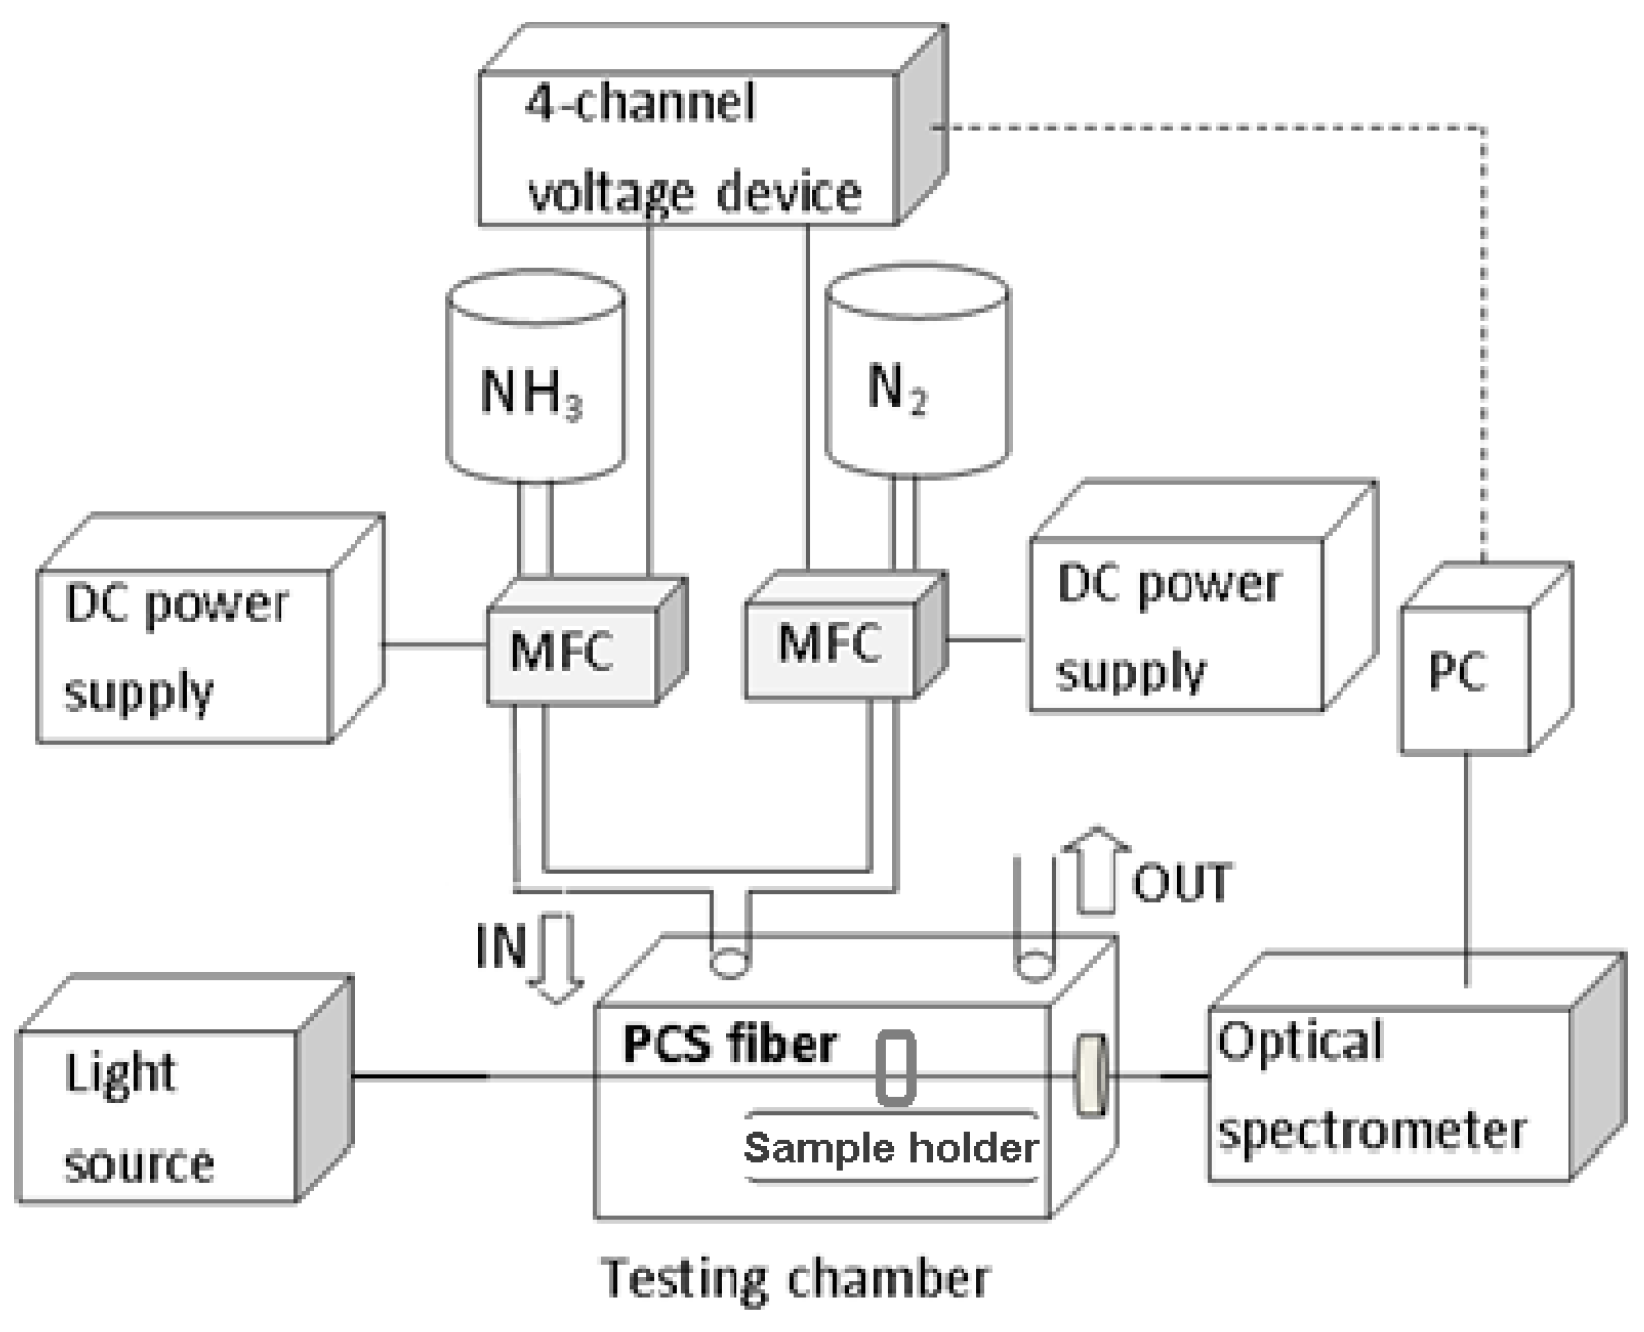
The schema of experimental setup used to characterize the spectral properties of the prepared structure and its reaction to the presence of ammonia gas of different concentrations in the nitrogen carrier is shown in
Figure 2.
The optical setup used involves a white wideband deuterium/wolfram light source (Heraeus FiberLight DTM 6/10 UV/VIS Lamp module; Heraeus Noblelight GmbH, Hanum, Germany), sample holder providing X-Y micrometric positioning, illuminating and collecting fiber optic ports equipped with cylindrical lenses (Newport LGI 830-6, Irvine, CA, USA), and fiber optic spectrometer covering the spectral range 200–1200 nm (S1000, Ocean Optics, Orlando, FL, USA). All the components are optically interconnected by PCS multimode optical fiber (SQS SMA/PCF-S 900 μm patch-cord, Nová Paka, Czech Republic). The optical transmittance spectra measured on the tested grid region are referred to the transmittance of the sample part covered with the continuous gold layer.
The gas preparation and delivering setup used in experiments consists of NH3 and N2 pure gas sources (pressure cylinders; purity class 4.5; Linde Gas a.s., Prague, Czech Republic), pressure reduction valves, gas mass flow controllers (MFC; UFC 1661C; Celerity Fluid Systems, Dublin, Ireland), a gas exposition glass bell covering the sample holder, and interconnecting stainless tubes. Before recording the observed spectra, each preset gas concentration was released to blow through the exposition chamber for 20 min, in order to achieve a steady state of the tested sample. Operation of both setup parts is fully controlled by a dedicated PC SW.
3. Theoretical Part
3.1. Basics of Plasmonic Extraordinary Optical Transmission
Extraordinary optical transmittance (EOT) of a plasmonic structure formed by a two-dimensional (2D) periodic array of holes produced in a plasmonic layer of metal (such as Au, Ag) was first described by Ebbesen [
15]. This first pioneering work dealing with EOT was later followed by other studies devoted to the topic of enhanced light transmission through one-dimensional (1D) [
16] and 2D [
17] periodic arrays of slits and holes of subwavelength characteristic size. A number of complementary and, in some cases, conflicting interpretations of the origin of this phenomenon have gradually been proposed. A significant role has been attributed to the resonant interaction of light with the surface plasmon polariton propagating on the metal surface, mediated by the existence of a periodic structure ensuring phase-matching between the incident light and the SPP. This concept is consistent with the shape of the dispersion relation of the SPP, which corresponds to the spectral positions of the EOT [
18]. Gradually, also with the contribution of the authors of this paper [
19,
20], the present established theory of EOT has emerged based on a combination of several processes involved in subwavelength transmission: non-resonant processes, related to the simple passage of light through subwavelength apertures, and resonant ones, taking into account the interaction of the incident light with the periodic arrangement of the apertures. The approaches/phenomena used include (i) the excitation of cavity modes (CM) inside individual holes/slits, the latter considered as open Fabry–Perot (FP) resonators, (ii) the resonant tunneling phenomenon consisting in the coupling of the SPP on both horizontal surfaces of the metallic lattice structure via evanescent waves passing through the holes, (iii) the existence of a “creeping” wave [
21], and (iv) the effective medium theory (EMT) approach.
Apart from such microscopic theory, the rigorous treatment of the EOT analysis is, in general, performed using the rigorous numerical technique. In our case, due to the structural periodicity, our in-house software package is effectively used with the implemented Fourier Modal Method (also traditionally called the rigorous coupled-wave analysis, RCWA) [
22,
23].
3.2. Optical Model of the Studied Sensing Structure
In order to interpret the obtained experimental data, plasmonic EOT spectrum is theoretically simulated by the FMM method [
23]. The FMM technique is currently considered as one of the most efficient and accurate electromagnetic analysis frameworks for optics and photonics, in terms of allowing general structure modulation, oblique incidence, and analysis of sharp resonance, as required in this paper. We have relied on our previous profound experience with both periodic (1D and 2D cases) and aperiodic (i.e., isolated structures—for 2D and 3D cases) versions of the FMM technique, with several important technical extensions, such as proper Fourier factorization, adaptive spatial resolution [
23], the normal vector method, symmetrization techniques, and recently also non-locality [
24], applied extensively to various rather complex problems, including, e.g., high-Q optical nanocavities [
25], plasmonic gratings, metasurfaces, and waveguides [
26], plasmonic sensor structures [
27], magneto-optic structures [
28], periodic arrays exhibiting the EOT effects [
29,
30], bound modes in the continuum [
29], or graphene plasmons [
30,
31].
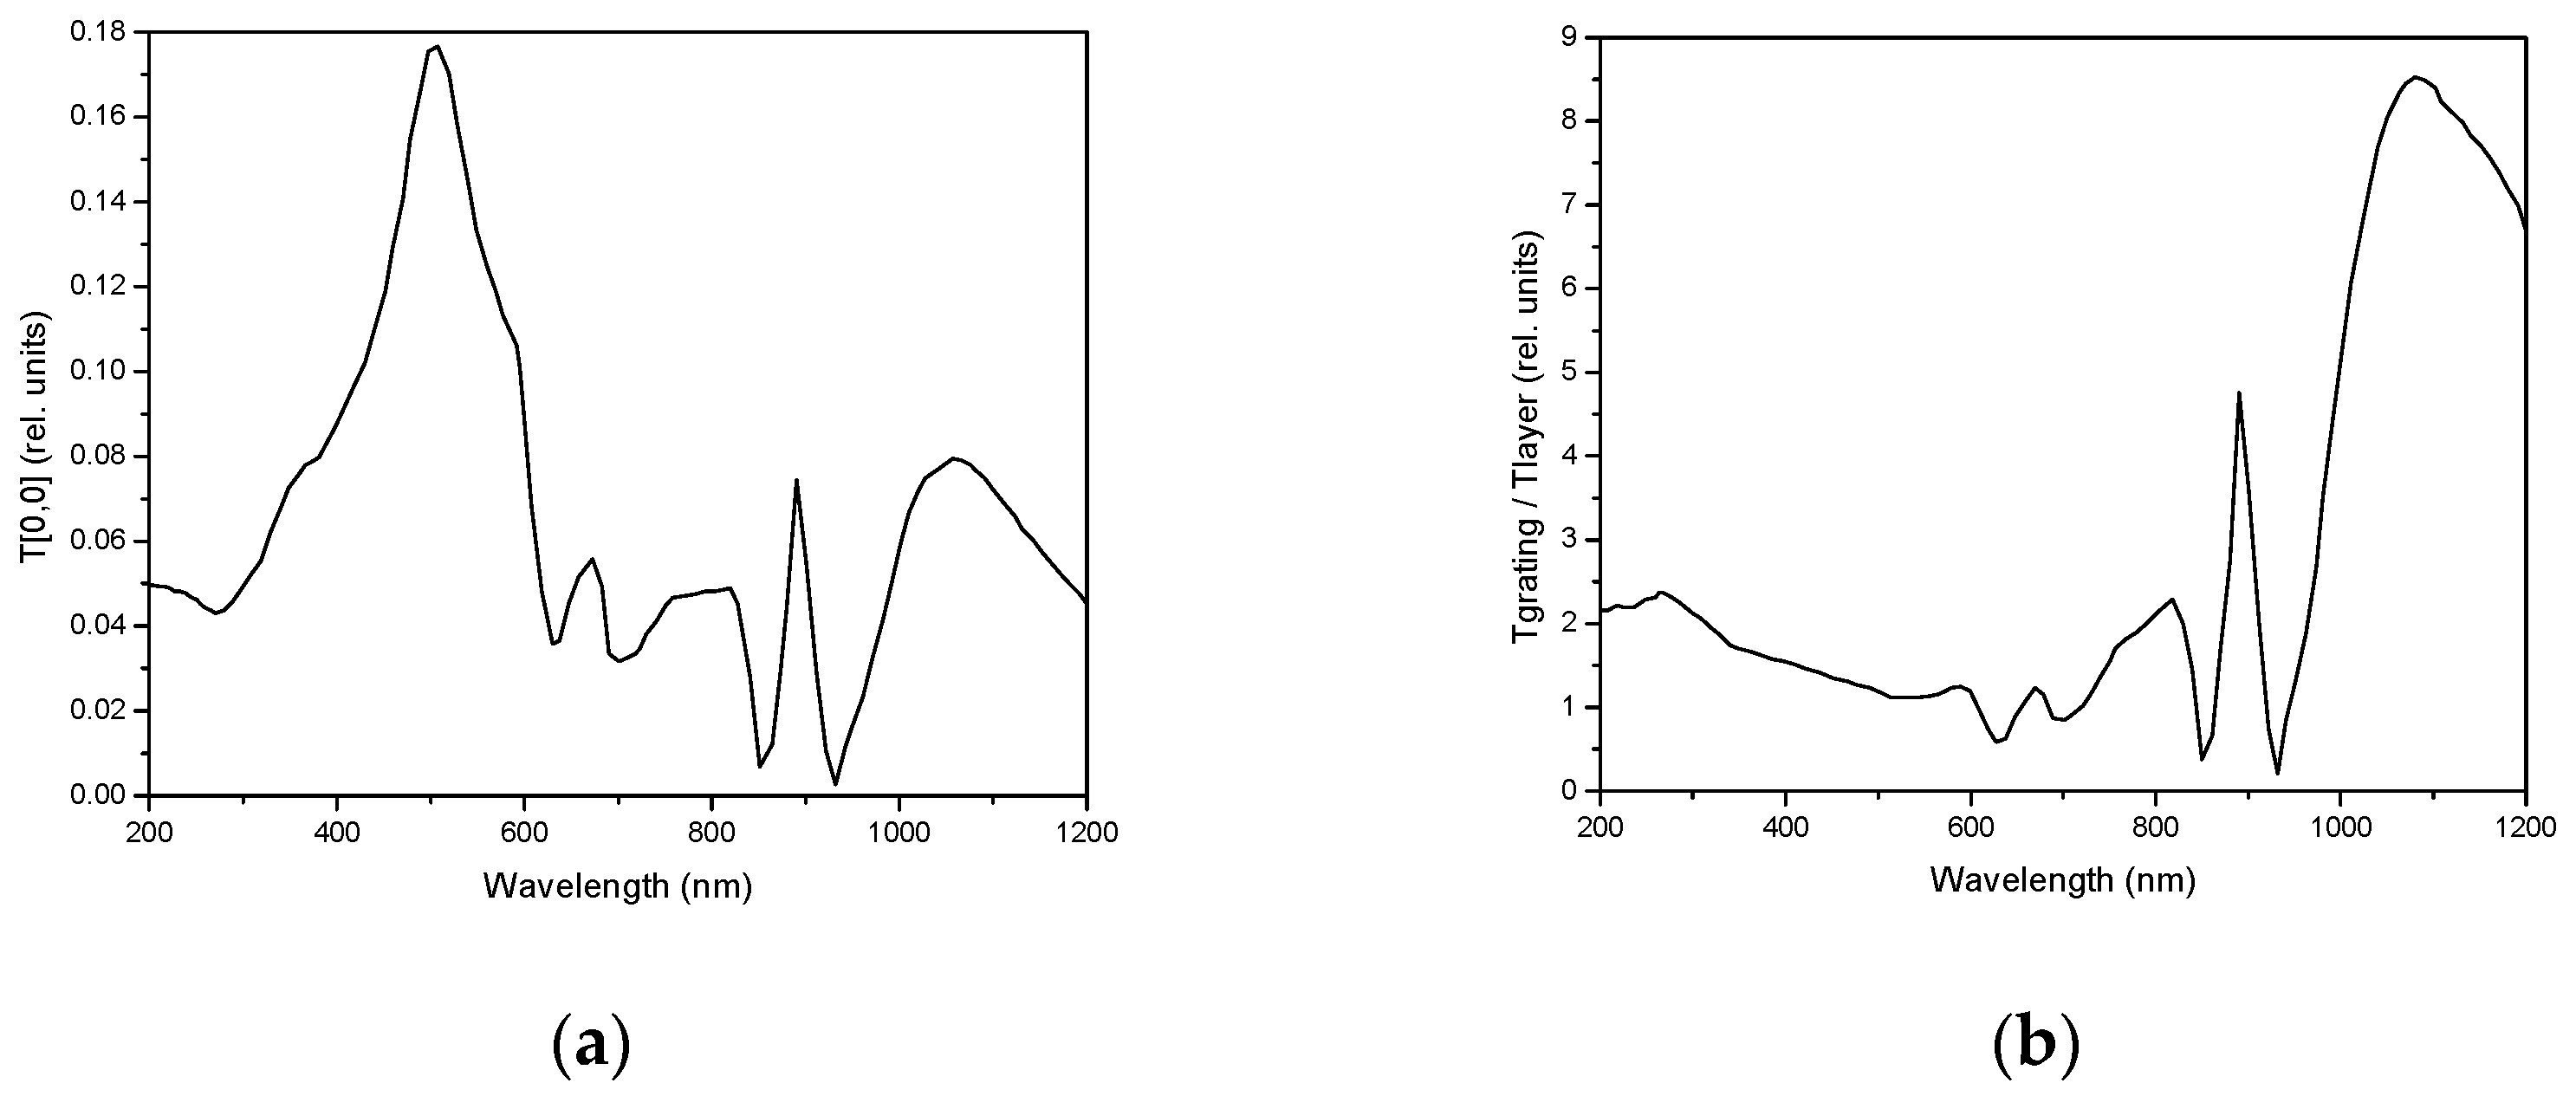
The following structure is considered for the theoretical analysis and prediction of the properties: a regular rectangular array of 441 cylindrical holes with the diameter 300 nm and the period 830 nm, made in the metallic slab formed by Au layer (51 nm) with the intermediate Cr layer (1.5 nm) prepared on (infinite) BK7 glass substrate, covered by (infinite) PDMS superstrate. Perpendicular incident light beam orientation is considered. The calculated EOT spectrum is shown in
Figure 3. As can be seen in
Figure 3a, the spectral transmittance T [0, 0] shows a significant resonances in the spectral region of 400–600 nm and also of 1000–1200 nm. When taken relatively, with respect to the response of a continuous Au/Cr/Bk-7 slab (
Figure 3b), this second resonance is enhanced, reaching the values of the enhancement over this layer close to 9. In the region of small wavelengths, there is a slight maximum around 300 nm, in good correspondence with the observed experimental data. We have also compared the effect of actual realistic shapes of the subwavelength holes (see
Figure 1) with the idealized circular shapes, finding only very small differences located in the spectral region around 700 nm, out of the two resonant areas.
Note that the position of spectral transmittance maxima depends significantly on the regularity, translation period, hole shape, and hole diameter of the metallic structure, as well as on the angle of incidence and polarization state of the primary light beam rays. The theoretical and experimental discussion of these topics is the subject of a number of original publications (see e.g., [
15,
32,
33,
34,
35,
36,
37]). Approximately, prolonging the hole lattice period results generally in a red shift of the observed spectral transmission patterns [
36]; reducing the hole diameter increases the strengths of EOT modes linked to surface plasmon polaritons, but leads also to their broadening and a slight blue shift [
37].
Figure 4 then shows the calculated 2D contour graphs of spectral transmittance of 2D regular rectangular plasmonic holes arrays (with the same translation parameters as those used in
Figure 3), as a function of the gold layer thickness d
gold and wavelength. The sensitivity of the spectral transmittance to the actual thickness of the gold layer is apparent. Also, for large thicknesses, the resonant maximum becomes slightly broader.
Figure 4b shows the relative transmission enhancement compared to continuous Au layer, with the relative increase of the second (long-wavelength) maximum.
3.3. Sensing Mechanism
As we previously confirmed, the used organometallic reagent Co-DPQ provides selective sensitivity to ammonia gas exposition [
8], the latter resulting in decomposition of the original reagent complex and freeing the quinoline ligand (
L) molecules.
Here,
m and
n denote the corresponding coordination numbers of ammonia and DPQ in the cobalt complex. Related changes of electronic structure lead to a blue shift of the optical absorption band in the visible region. Clearly, the particular spectral positions of the absorption bands corresponding to the initial complex and resulting free ligand depend on the permittivity of the surrounding matrix; in PDMS, the respective centroid/FWHM values are ca. 825/200 nm and 610/150 nm [
13]. It is worth noticing that the mentioned simplified reaction schema (1) can be, in reality, more complex, involving, e.g., possible presence of water or chlorine groups appearing at ligand positions.
4. Results and Discussion
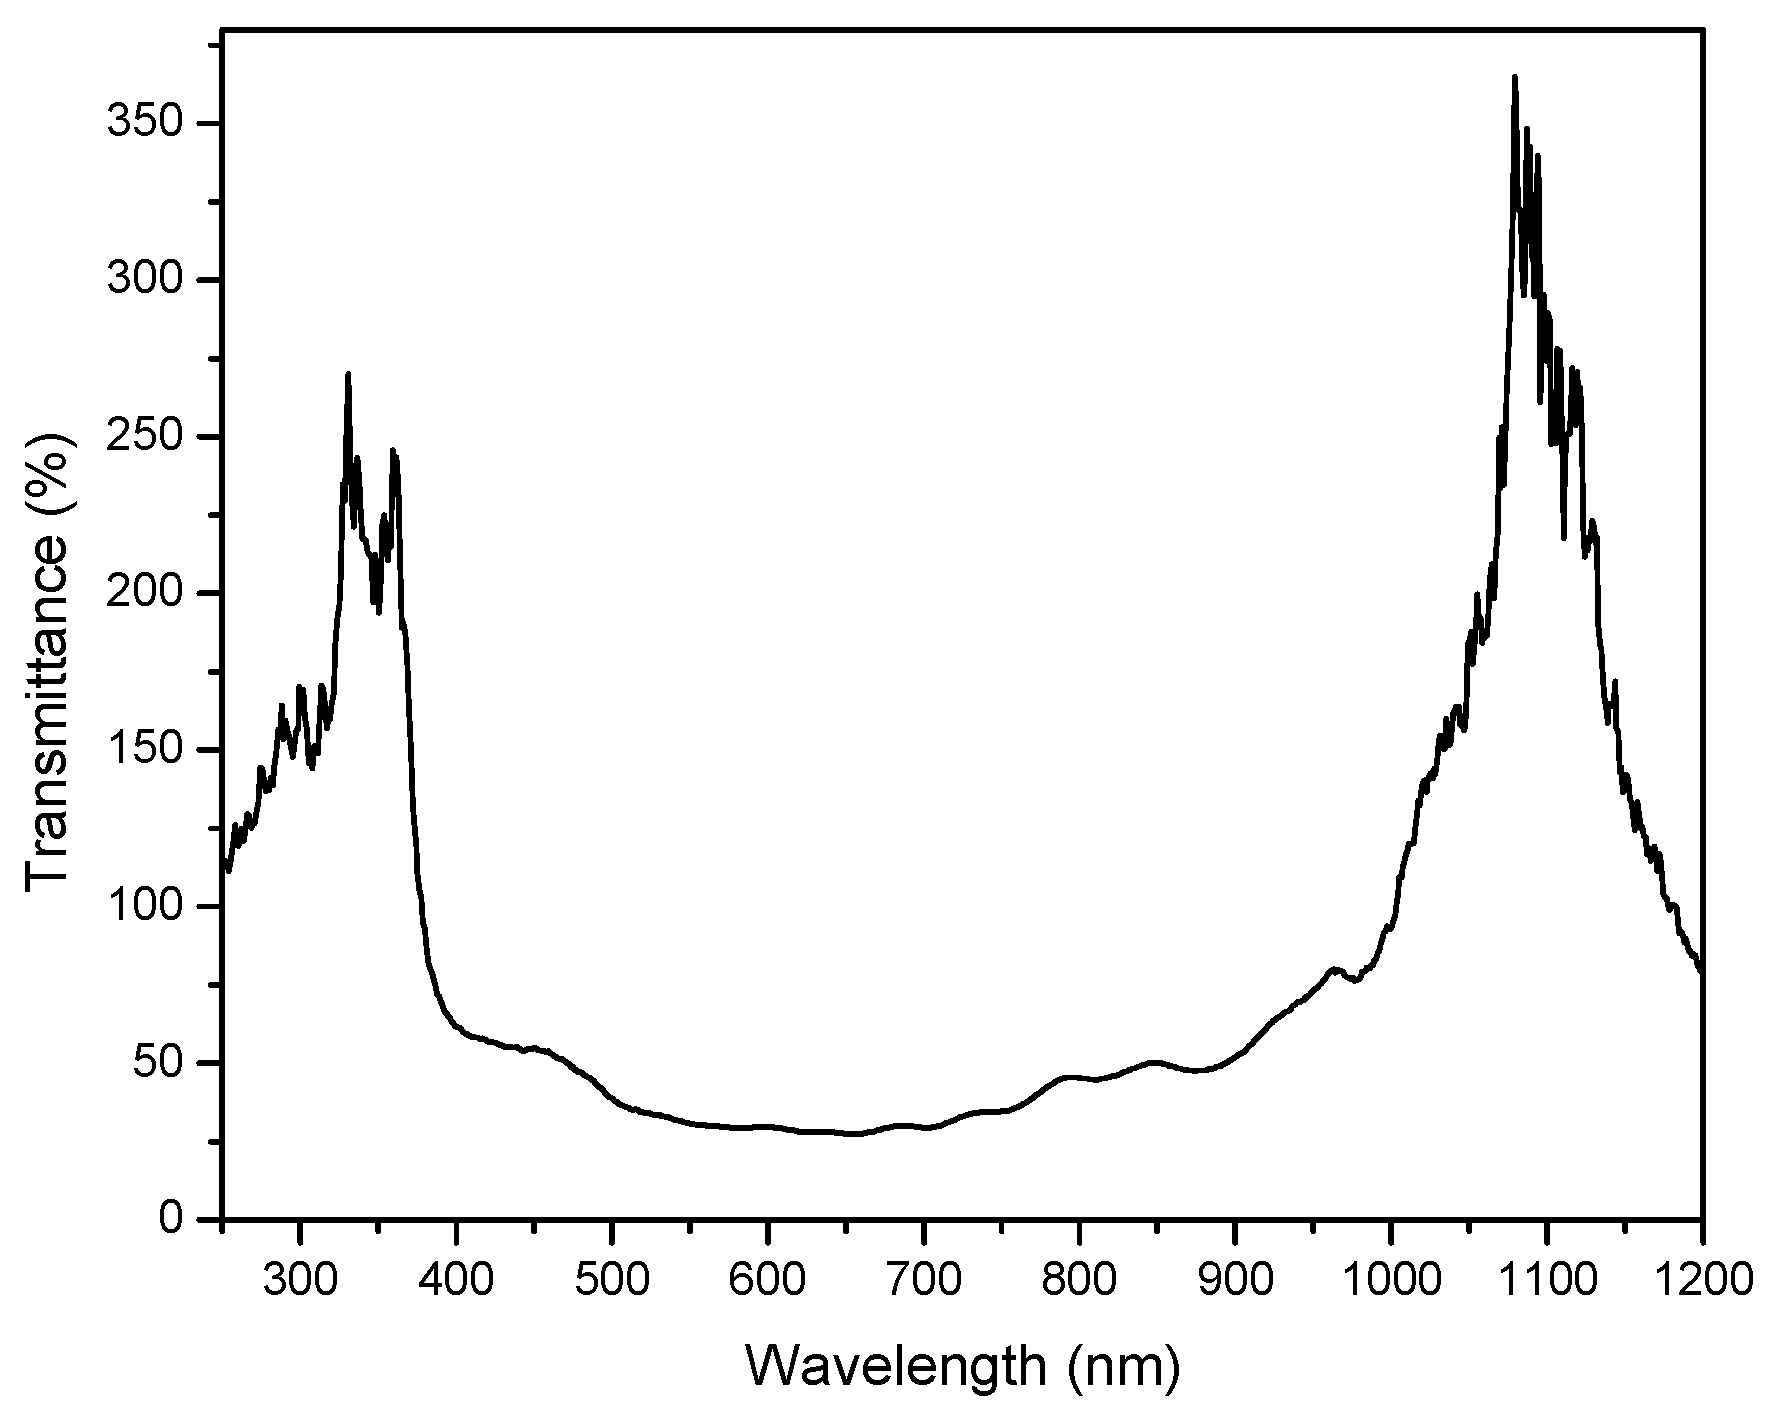
The initial transmittance (T) spectrum recorded under pure N
2 atmosphere on the tested structure is shown in
Figure 5. There are two extremes corresponding to extraordinary optical transmission of the Au grid situated at low (ca. 360 nm) and high (ca. 1080 nm) wavelengths. It is worth noticing that both observed maxima positions might be slightly influenced by constituting parts of the used experimental setup, in particular by the absorption edge of the BK-7 substrate and the light emission limit of the wolfram source on the short- and long-wavelength sides of the spectrum, respectively.
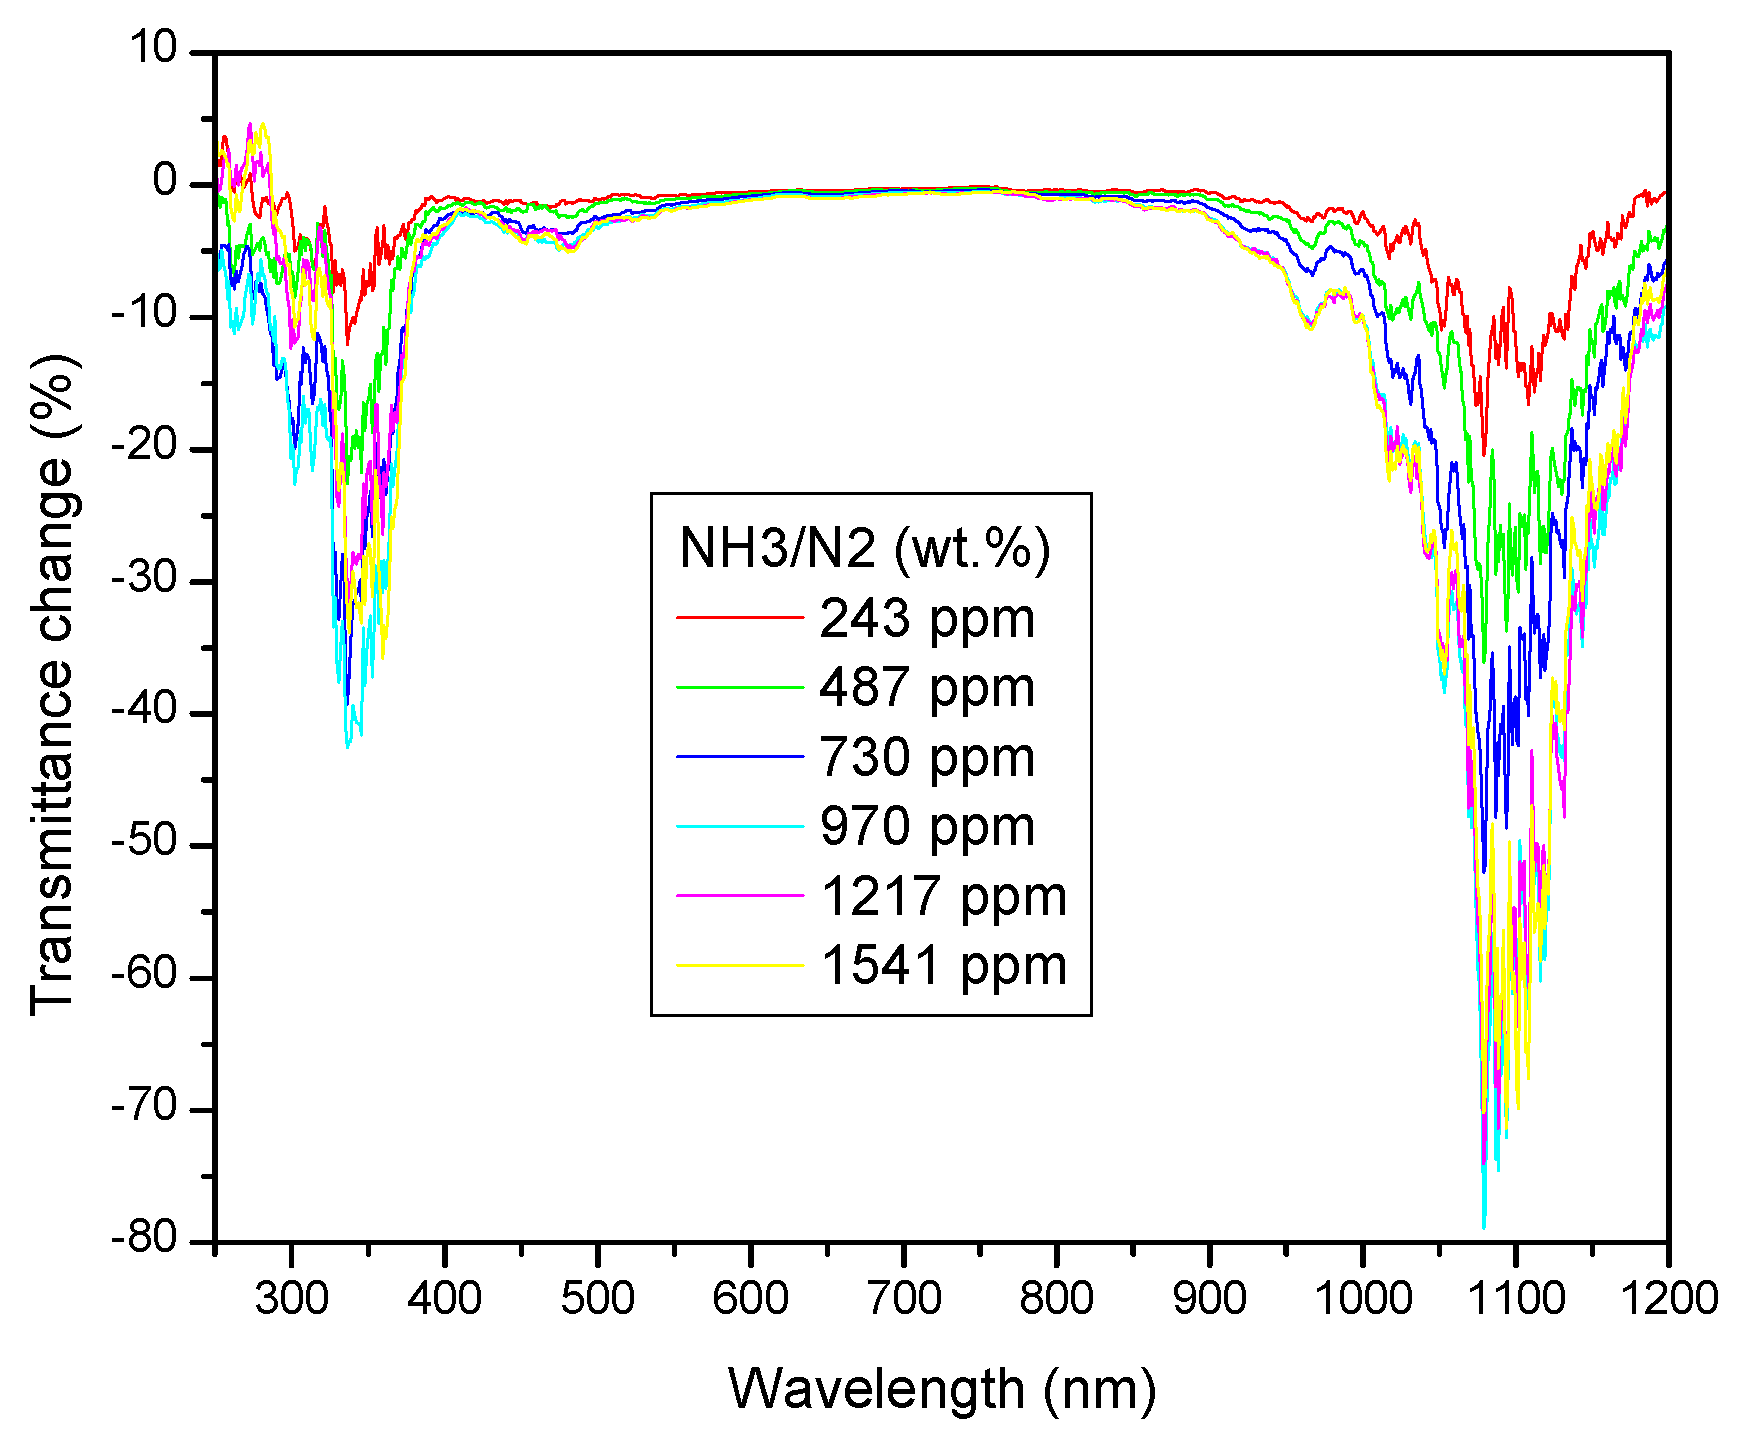
Figure 6 shows absolute spectral changes in transmittance (ΔT
abs = T
NH3/N2 − T
N2) under exposition to NH
3/N
2 gas mixtures of different mass concentration. Apparently, a decrease in the transmittance is observed at the short- and long-wavelength limits of the scanned spectral interval. The observed transmittance drop is proportional to the ammonia gas concentration increase. At c ≈ 1000 ppm, a saturated state is achieved. The observed spectral regions of the most remarkable absolute transmittance changes clearly overlap with the spectral regions of the maximal transmittance of the tested structure (cf.
Figure 5 and
Figure 6).
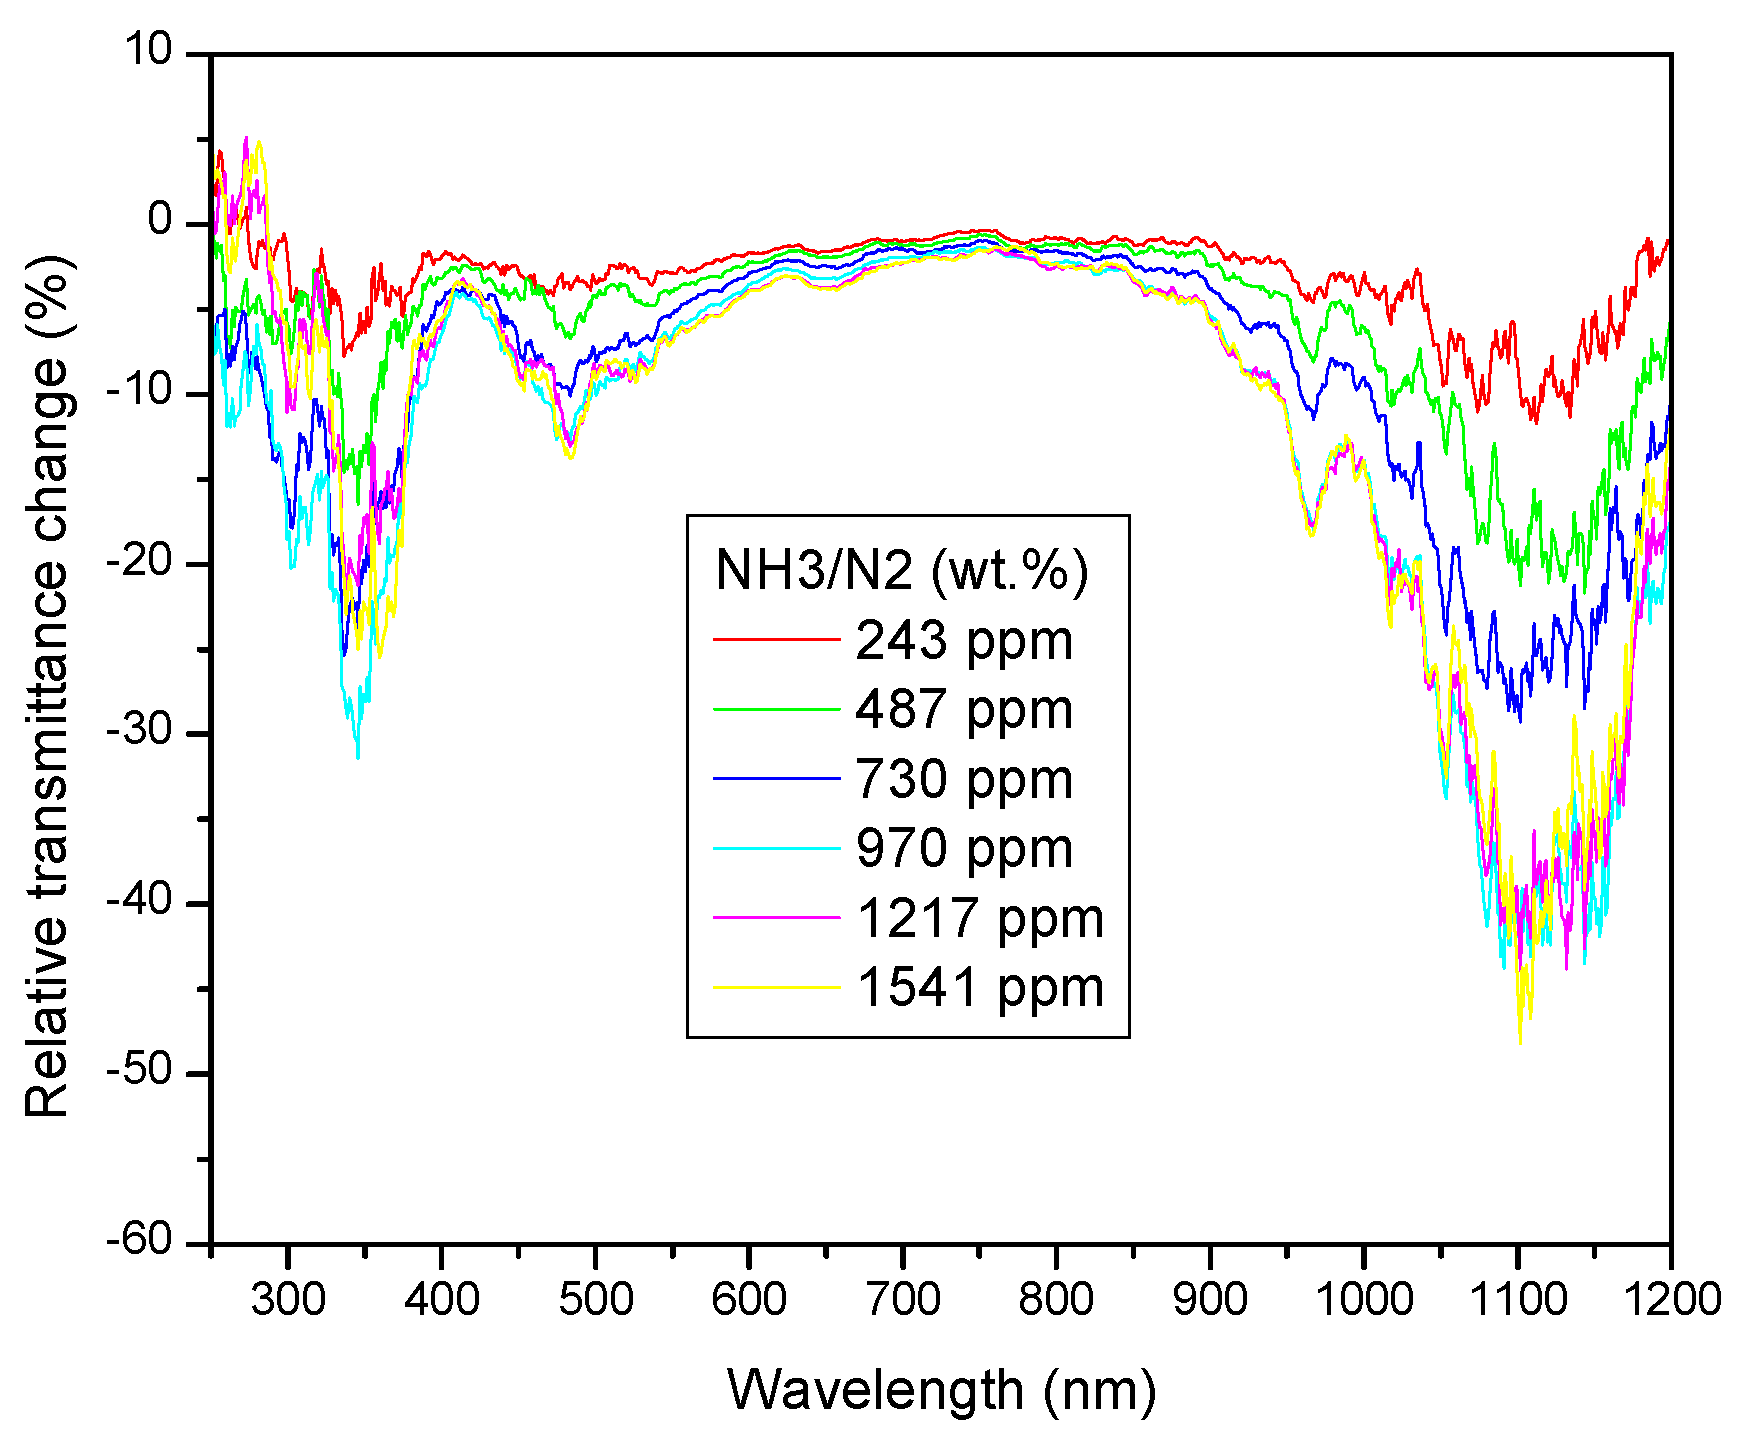
Changing from absolute to the relative transmittance (ΔT
rel = ΔT
abs/T
N2), the details of spectral changes become even more apparent (
Figure 7). The split of the short-wavelength transmittance band is well resolved, with the first stronger extreme of transmittance change at ca. 350 nm, and the second one at ca. 480 nm. At the long-wavelength side, a broad extreme dominates, centered on about 1100 nm, accompanied by a weaker side-peak at ca. 950 nm.
The most pronounced observed drop of transmittance occurs in the spectral regions outside the spectral intervals where the optical absorption bands of either the bare quinoline ligand or its Co complex reside. For interpretation of the observed spectral changes, we have to consider also optical properties of the species appearing on the right side of the reaction schema, given by Equation (1), represented here by the [Co(NH3)m]2+ Br2 complex. As already mentioned, the structure of the latter can be further modified by optional presence of other ligands. We propose that the observed decrease in transmittance is the result of the decomposition of the original reagent complex under influence of ammonia, and subsequent formation of a new complex coordinated by ammonium groups (possibly supplemented by other ligands, such as water or chlorine, whose presence in the reagent matrix cannot be excluded). The optical absorption bands corresponding to Co2+ d-electrons transitions in ammine complexes are known to be located at the UV-VIS spectral boundary, the position being compatible with the observed short-wavelength drop of transmittance. Increase in optical absorption at the long-wavelength side may possibly suggest that action also takes place with ligands from beginning of the spectroscopic series (such as OH− or Cl−) characterized by a small value of ligand-field splitting parameter. Concentration change of these species during the exposition of chemo-optic transducer layer by dry ammonia gas may occur due to the strong proton absorption ability of the latter, and the known presence of water and PtCl6 catalyst residua in the thermally cured PDMS matrix.
5. Conclusions
Sensing structure based on a plasmonic EOT array fabricated by FIB technique in thin Au layer overlaid by chemo-optical transducer consisting of PDMS matrix filled with Co-DPQ organo-metallic reagent was prepared, characterized, and its spectral optical transmittance tested under NH3/N2 atmosphere of various ammonia gas concentration ranging from 0 to 1541 ppm.
Well-resolved changes of transmittance were observed conformal with the reaction of chemo-optical transducer under ammonia exposition, confirming sensing applicability of the proposed EOT-based structure. Most pronounced spectral changes appeared at the short- and long-wavelength margins of the tested spectral region 200–1200 nm, with the maxima located at ca. 350 nm, 480 nm, 950 nm, and 1100 nm. Saturation of the sensor response was observed for ammonia concentration exceeding ca. 1000 ppm.
Interpretation of the mechanism behind the observed spectral changes is proposed, based on the theoretical description of the used plasmonic nanostructure, the known chemical reaction of the reagent with ammonia gas, and the composition of the applied chemo-optical transducer.
Further experimental and theoretical research is, however, necessary in order to clarify the observed sensing mechanism in details, and test the dependence between parameters of the sensing structure and its sensitivity margins, as well as kinetics and repeatability of the detection process.
Comparing with the principles used nowadays, regarding ammonia gas sensors, the proposed EOT sensing head provides several potential assets, such as absence of electricity connections allowing for its usage in a ‘zone zero’ explosive environment, and its ease to be adapted to various local as well as non-local fiber optics interrogation schemes.
Author Contributions
Methodology, L.K., P.K., I.R. and J.K.; Software, M.B. and P.K.; Validation, L.K.; Formal analysis, P.K. and I.R.; Investigation, L.K., J.J., M.B., P.K., I.R. and J.K.; Resources, J.K.; Writing—original draft, L.K. and I.R.; Supervision, L.K. and I.R.; Project administration, L.K. All authors have read and agreed to the published version of the manuscript.
Funding
The research has been performed with the support of the Czech Science Foundation, grant number GA21-05259S, and the MEYS of the Czech Republic grant number CZ.02.1.01/0.0/0.0/16_019/0000778 of the European Structural and Investments Funds. We also acknowledge CzechNanoLab Research Infrastructure supported by MEYS CR (LM2023051).
Institutional Review Board Statement
Not applicable.
Informed Consent Statement
Not applicable.
Data Availability Statement
Data available from the authors upon the personal request.
Conflicts of Interest
The authors declare no conflict of interest.
References
- Nelson, R.D., Jr.; Lide, D.R.; Maryott, A.A. Selected Values of Electric Dipole Moments for Molecules in the Gas Phase; NSRDS-NBS10, National Standard Reference Data System: Washing, DC, USA, 1967. [CrossRef]
- Li, M.; Weschler, C.J.; Beko, G.; Wargocki, P.; Lucic, G.J. Williams: Human Ammonia Emission Rates under Various Indoor Environmental Conditions. Environ. Sci. Technol. 2020, 54, 5419–5428. [Google Scholar] [CrossRef] [PubMed]
- Brunner, E. Fluid Mixtures at High Pressures VI. Phase Separation and Critical Phenomena in 18 (n-Alkane + Ammonia) and 4 (n-Alkane _ Methanol) Mixtures. J. Chem. Thermodyn. 1988, 20, 273–297. [Google Scholar] [CrossRef]
- Padappayil, R.P.; Borger, J. Ammonia Toxicity; StatPearls Publishing: Treasure Island, FL, USA, 2023. Available online: https://www.ncbi.nlm.nih.gov/books/NBK546677/ (accessed on 11 March 2023).
- Kwak, D.; Leic, Y.; Maric, R. Ammonia gas sensors: A comprehensive review. Talanta 2019, 204, 713–730. [Google Scholar] [CrossRef] [PubMed]
- Bannov, A.G.; Popov, M.V.; Brester, A.E.; Kurmashov, P.B. Recent Advances in Ammonia Gas Sensors Based on Carbon Nanomaterials. Micromachines 2021, 12, 186. [Google Scholar] [CrossRef] [PubMed]
- Timmer, B.; Olthuis, W.; van den Berg, A. Ammonia sensors and their applications—A review. Sens. Actuators B 2005, 107, 666–677. [Google Scholar] [CrossRef]
- Sayed, M.; Yu, J.; Liu, G.; Jaroniec, M. Non-Noble Plasmonic Metal-Based Photocatalysts. Chem. Rev. 2022, 122, 10484–10537. [Google Scholar] [CrossRef]
- Weisman, D.; Carmesin, M.; Rozenman, G.G.; Efremov, M.A.; Shemer, L.; Schleich, W.P.; Arie, A. Diffractive guiding of waves by a periodic array of slits. Phys. Rev. Lett. 2021, 127, 014303. [Google Scholar] [CrossRef]
- Wang, L.; Kafshgari, M.H.; Meunier, M. Optical properties and applications of plasmonic-metal nanoparticles. Adv. Funct. Mater. 2020, 30, 2005400. [Google Scholar] [CrossRef]
- Jauffred, L.; Samadi, A.; Klingberg, H.; Bendix, P.M.; Oddershede, L.B. Plasmonic heating of nanostructures. Chem. Rev. 2019, 119, 8087–8130. [Google Scholar] [CrossRef]
- Zhao, J.; Xue, S.; Ji, R.; Lia, B.; Li, J. Localized surface plasmon resonance for enhanced electrocatalysis. Chem. Soc. Rev. 2021, 50, 12070–12097. [Google Scholar] [CrossRef]
- Aubrecht, J.; Kalvoda, L. Development of Ammonia Gas Sensor Using Optimized Organometallic Reagent. J. Sens. 2016, 2016, 8425758. [Google Scholar] [CrossRef]
- Levinský, P.; Kalvoda, L.; Aubrecht, J.; Fojtíková, J. Diffusion of ammonia gas in PDMS characterized by ATR spectroscopy. In Proceedings of the Volume 9450, Photonics, Devices, and Systems VI, Prague, Czech Republic, 27–29 August 2014; p. 94500D. [Google Scholar] [CrossRef]
- Ebbesen, T.W.; Lezec, H.J.; Ghaemi, H.F.; Thio, T.; Wolff, P.A. Extraordinary optical transmission through sub-wavelength hole arrays. Nature 1998, 391, 667. [Google Scholar] [CrossRef]
- Martin-Moreno, L.; Garcia-Vidal, F.J.; Lezec, H.J.; Pellerin, K.M.; Thio, T.; Ebbesen, T.W. Theory of extraordinary optical transmission through subwavelength hole arrays. Phys. Rev. Lett. 2001, 86, 1114. [Google Scholar] [CrossRef] [PubMed]
- Martin-Moreno, L.; Garcia-Vidal, F.J. Optical transmission through circular hole arrays in optically thick metal films. Opt. Express 2004, 12, 3619. [Google Scholar] [CrossRef] [PubMed]
- Rahman, A.T.M.A.; Majewski, P.; Vasilev, K. Extraordinary optical transmission: Coupling of the Wood-Rayleigh anomaly and the Fabry-Perot resonance. Opt. Lett. 2012, 37, 1742. [Google Scholar] [CrossRef]
- Fiala, J.; Richter, I. Mechanisms Responsible for Extraordinary Optical Transmission Through One-Dimensional Periodic Arrays of Infinite Sub-wavelength Slits: The Origin of Previous EOT Position Prediction Misinterpretations. Plasmonics 2018, 13, 835–844. [Google Scholar] [CrossRef]
- Fiala, J.; Richter, I. Explanation of extraordinary transmission on 1-D and 2-D metallic gratings. In Proceedings of the SPIE 9450, Photonics, Devices, and Systems VI, Prague, Czech Republic, 27–29 August 2014; Volume 9450, p. 94501T. [Google Scholar] [CrossRef]
- Liu, H.; Lalanne, P. Comprehensive microscopic model of the extraordinary optical transmission. J. Opt. Soc. Am. A 2010, 27, 2542–2550. [Google Scholar] [CrossRef]
- Moharam, M.G.; Gaylord, T.K. Rigorous coupled-wave analysis of planar-grating diffraction. J. Opt. Soc. Am. A 1981, 71, 811. [Google Scholar] [CrossRef]
- Čtyroký, J.; Kwiecien, P.; Richter, I. Fourier series-based bidirectional propagation algorithm with adaptive spatial resolution. J. Light. Technol. 2010, 28, 2969. [Google Scholar] [CrossRef]
- Kwiecien, P.; Burda, M.; Richter, I. A nonlocal Fourier modal method for analyzing nonlocal plasmonic periodic nanostructures. J. Opt. Soc. Am. B 2023, 40, 491. [Google Scholar] [CrossRef]
- Maes, B.; Petráček, J.; Burger, S.; Kwiecien, P.; Luksch, J.; Richter, I. Simulations of high-Q optical nanocavities with a gradual 1D bandgap. Opt. Express 2013, 21, 6794–6806. [Google Scholar] [CrossRef] [PubMed]
- Čtyroký, J.; Kwiecien, P.; Richter, I. Analysis of hybrid dielectric-plasmonic slot waveguide structures with 3D Fourier Modal Methods. J. Eur. Opt. Soc. Rapid Publ. 2013, 8, 13024. [Google Scholar] [CrossRef]
- Špačková, B.; Lebrušková, P.; Šípová, H.; Kwiecien, P.; Richter, I.; Homola, J. Ambiguous Refractive Index Sensitivity of Fano Resonance on an Array of Gold Nanoparticles. Plasmonics 2014, 9, 729. [Google Scholar] [CrossRef]
- Kwiecien, P.; Richter, I.; Kuzmiak, V.; Čtyroký, J. Nonreciprocal waveguiding structures for THz region based on InSb. J. Opt. Soc. Am. A 2017, 34, 892–903. [Google Scholar] [CrossRef] [PubMed]
- Čtyroký, J.; Petráček, J.; Kuzmiak, V.; Richter, I. Bound modes in the continuum in integrated photonic LiNbO3 waveguides: Are they always beneficial? Opt. Express 2023, 31, 44. [Google Scholar] [CrossRef] [PubMed]
- Čtyroký, J.; Petráček, J.; Kuzmiak, V.; Kwiecien, P.; Richter, I. Silicon waveguides with graphene: Coupling of waveguide mode to surface plasmons. J. Opt. 2020, 22, 095801. [Google Scholar] [CrossRef]
- Čtyroký, J.; Petráček, J.; Kwiecien, P.; Richter, I.; Kuzmiak, V. Graphene on an optical waveguide: Comparison of simulation approaches. Opt. Quantum Electron. 2020, 52, 149. [Google Scholar] [CrossRef]
- Krishnan, A.; Thio, T.; Kim, T.J.; Lezec, H.J.; Ebbesen, T.W.; Wolff, P.A.; Pendry, J.; Martin-Moreno, L.; Garcia-Vidal, F.J. Evanescently coupled resonance in surface plasmon enhanced transmission. Opt. Commun. 2023, 200, 1–7. [Google Scholar] [CrossRef]
- Baida, F.I.; Van Labeke, D. Light transmission by subwavelength annular aperture arrays in metallic films. Opt. Commun. 2002, 209, 17–22. [Google Scholar] [CrossRef]
- Prikulis, J.; Hanarp, P.; Olofsson, L.; Sutherland, D.; Käll, M. Optical Spectroscopy of Nanometric Holes in Thin Gold Films. Nano Lett. 2004, 4, 1003–1007. [Google Scholar] [CrossRef]
- Gordon, R.; Brolo, A.G.; McKinnon, A.; Rajora, A.; Leathem, B.; Kavanagh, K.L. Strong Polarization in the Optical Transmission through Elliptical Nanohole Arrays. Phys. Rev. Lett. 2004, 92, 037401. [Google Scholar] [CrossRef] [PubMed]
- Degiron, A.; Ebbesen, T.W. The role of localized surface plasmon modes in the enhanced transmission of periodic subwavelength apertures. J. Opt. A Pure Appl. Opt. 2005, 7, S90–S96. [Google Scholar] [CrossRef]
- Lin, L.; Reeves, R.J.; Blaikie, R.J. Surface-plasmon-enhanced light transmission through planar metallic films. Phys. Rev. B 2006, 74, 155407. [Google Scholar] [CrossRef]
| Disclaimer/Publisher’s Note: The statements, opinions and data contained in all publications are solely those of the individual author(s) and contributor(s) and not of MDPI and/or the editor(s). MDPI and/or the editor(s) disclaim responsibility for any injury to people or property resulting from any ideas, methods, instructions or products referred to in the content. |
© 2023 by the authors. Licensee MDPI, Basel, Switzerland. This article is an open access article distributed under the terms and conditions of the Creative Commons Attribution (CC BY) license (https://creativecommons.org/licenses/by/4.0/).
