


Low-Cost Internet-of-Things Water-Quality Monitoring System for Rural Areas
 , ,
, ,
Abstract
1. Introduction
1.1. Measured Parameters
- Excellent: <300 ppm;
- Satisfactory: 300–600 ppm;
- Suitable/appropriate: 600–900 ppm;
- Scarce: 900–1200 ppm;
- Inadmissible: >1200 ppm.
- Between 50 and 150 ppm—excellent for consumption;
- 150–250 ppm—good;
- 250–300 ppm—equitable;
- 300–500 ppm—scarce;
- >1200 ppm—inadmissible.
2. Previous Work
2.1. Specific Water-Quality Monitoring Applications
2.2. Groundwater-Quality Monitoring
2.3. Surface Water-Quality Monitoring
2.4. Potable Water-Quality Monitoring
2.5. Machine Learning for Water-Quality Monitoring
3. Materials and Components
- Discuss the measured parameters that the project is aiming at (Section 1);
- Build a low-cost prototype capable of measuring different water parameters from different water sources (Section 3 and Section 3.1);
- Implement a mobile application to receive data from the sensors, such as the DS18B20 temperature sensor, SEN0161 pH sensor, TDS SEN0244 sensor, and turbidity sensor SKU SEN0189 (Section 4);
- Calibrate the sensors in order to obtain accurate values from different measurements (Section 5);
- Perform the measurement of different water parameters from several water sources in a rural setting (Section 6);
- Analyze and discuss the obtained results, as well as make the results available to the public through their apps (Section 6).
3.1. Setup and Connections
- Arduino microcontroller (label 1, in Figure 4);
- Power source (label 2);
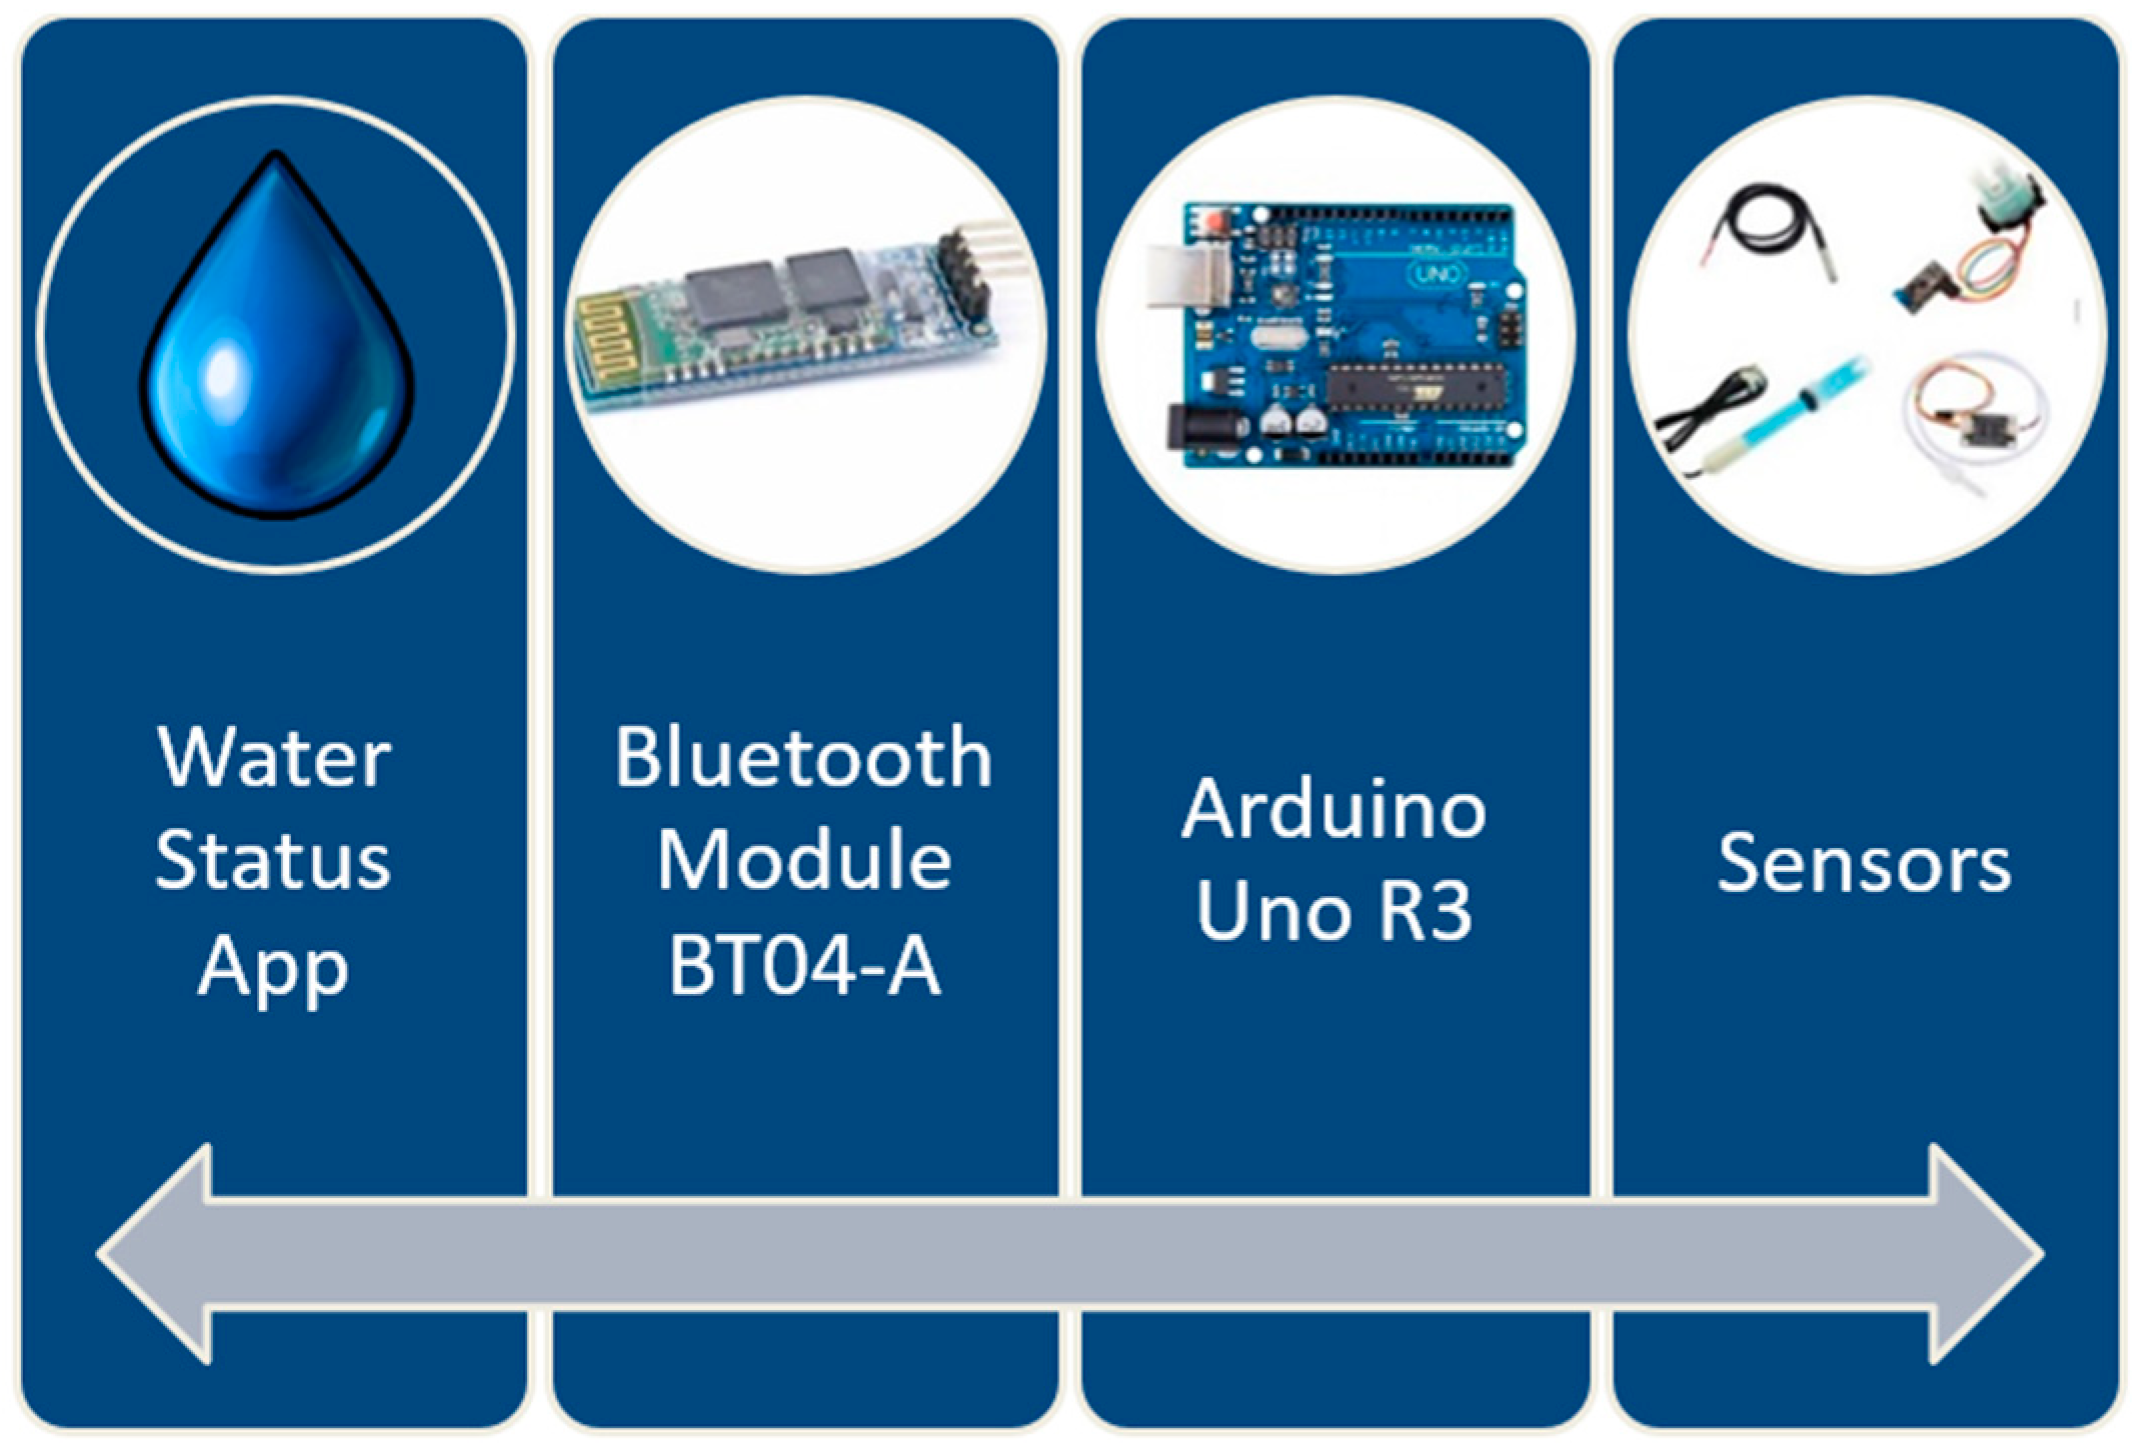
- BT04-A Bluetooth module (label 3) for data transmission to the dedicated mobile app;
- Sensors—DS18B20 temperature sensor (label A), SEN0161 pH sensor (label B), SEN0244 TDS sensor (label C), and turbidity sensor SKU SEN0189 (label D).
- Arduino board: connected through a USB cable to a power source (or laptop/PC);
- Bluetooth BT04-A module: GND to Arduino GND (black wire), VCC to 5 V (red wire), Tx to Arduino Rx—pin 0 (blue wire), Rx to Arduino Tx—pin 1 (yellow wire);
- DS18B20 temperature sensor: connected to GND (black wire), to 5 V (red wire), and to pin 13 of the Arduino board (yellow wire), by using a 1.2 KΩ resistor;
- SEN0161 pH sensor: connected to GND (black wire), to 5 V (orange wire), and to pin A2 of the Arduino board (blue wire);
- TDS SEN0244 sensor: connected to GND (black wire), to 5 V (red wire), and to pin A1 of the Arduino board (green wire);
- SKU SEN0189 turbidity sensor: connected to GND (black wire), to 5 V (orange wire), and to pin A0 of the Arduino board (blue wire).
- The DS18B20 temperature sensor is a programmable sensor with a single wire and it is used for measuring the temperature in different environments; due to its waterproof case, it is used for measuring the water temperature. This sensor is easy to use and its connection to the Arduino board requires only one data pin, along with a pull-up resistor.
- The SEN0161 pH sensor is an analog sensor for pH measurement, which is particularly designed for Arduino development boards, featuring simple characteristics and connections. It contains an LED for supply voltage indication, a BNC connector, and a PH0.2 interface.
- The TDS SEN0244 sensor (for total dissolved solids) is also an analog sensor, easy to use, and Arduino-compatible, which measures the TDS value of water and it transmits it to the system.
- The turbidity sensor SKU SEN0189 is also an analog sensor, easy to use, and Arduino-compatible. This offers a response depending on the light amount that passes through a liquid, thereby being able to detect the number of total suspended solids—TSS.
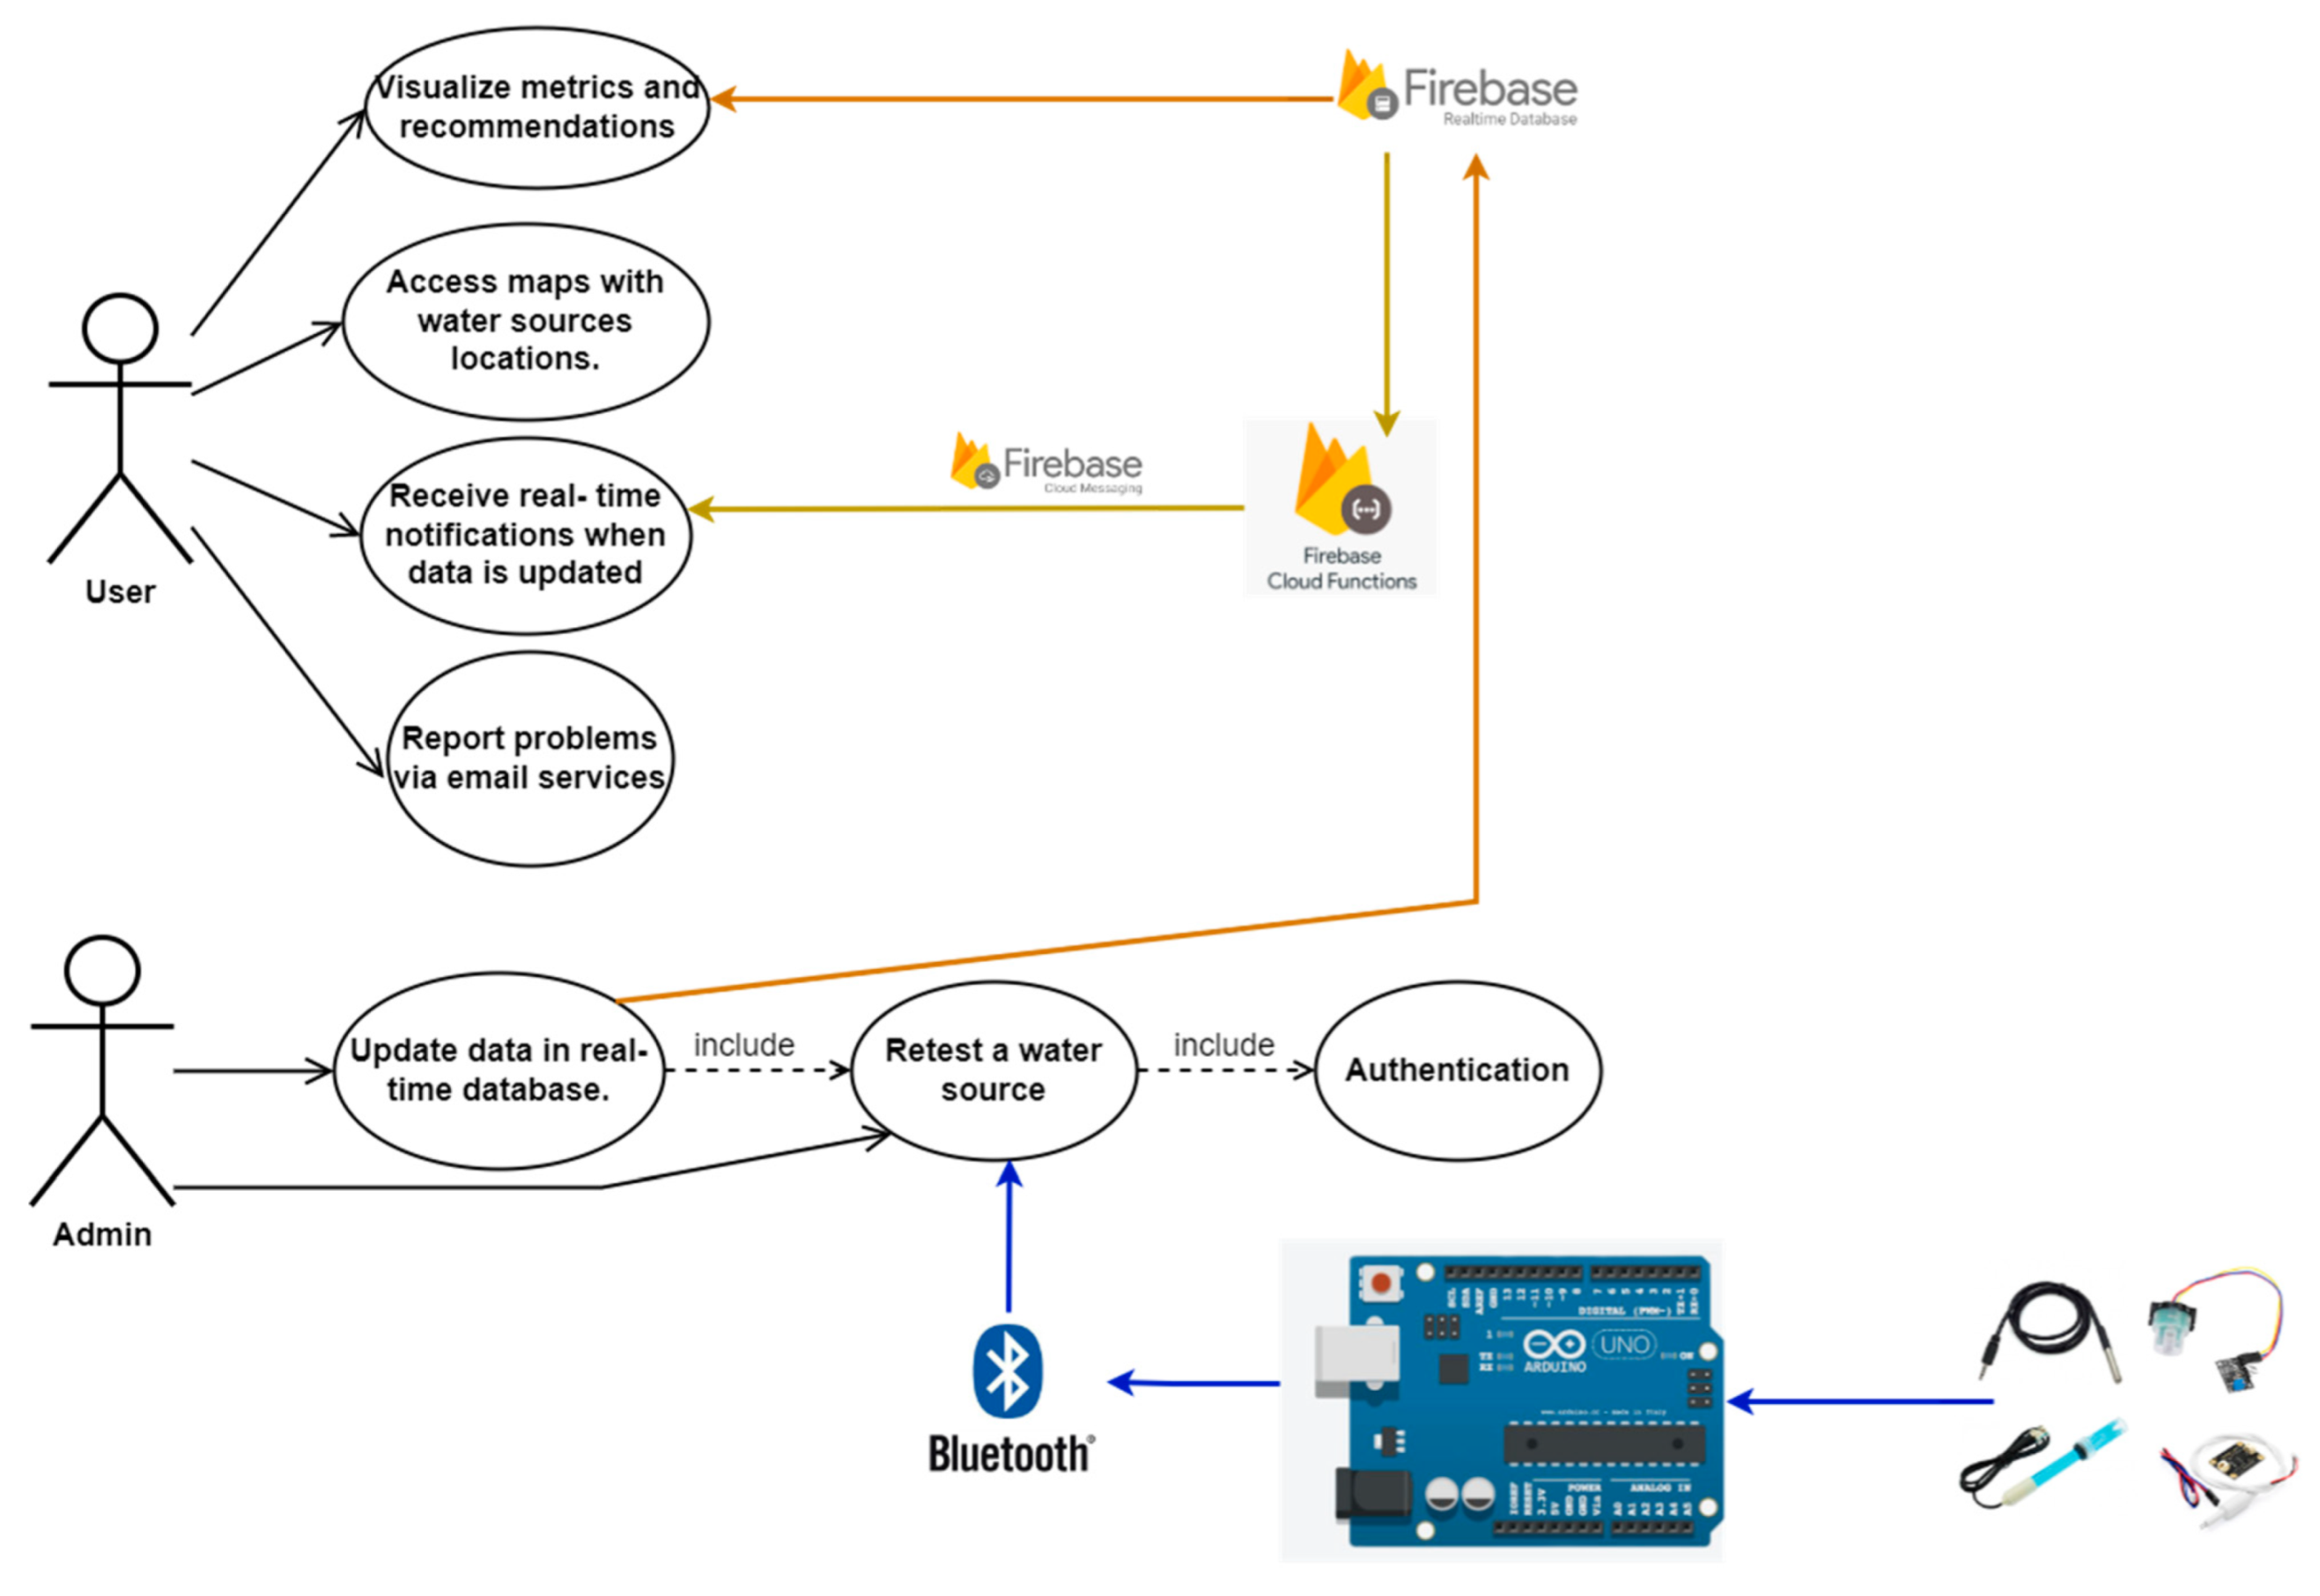
4. Software Architecture
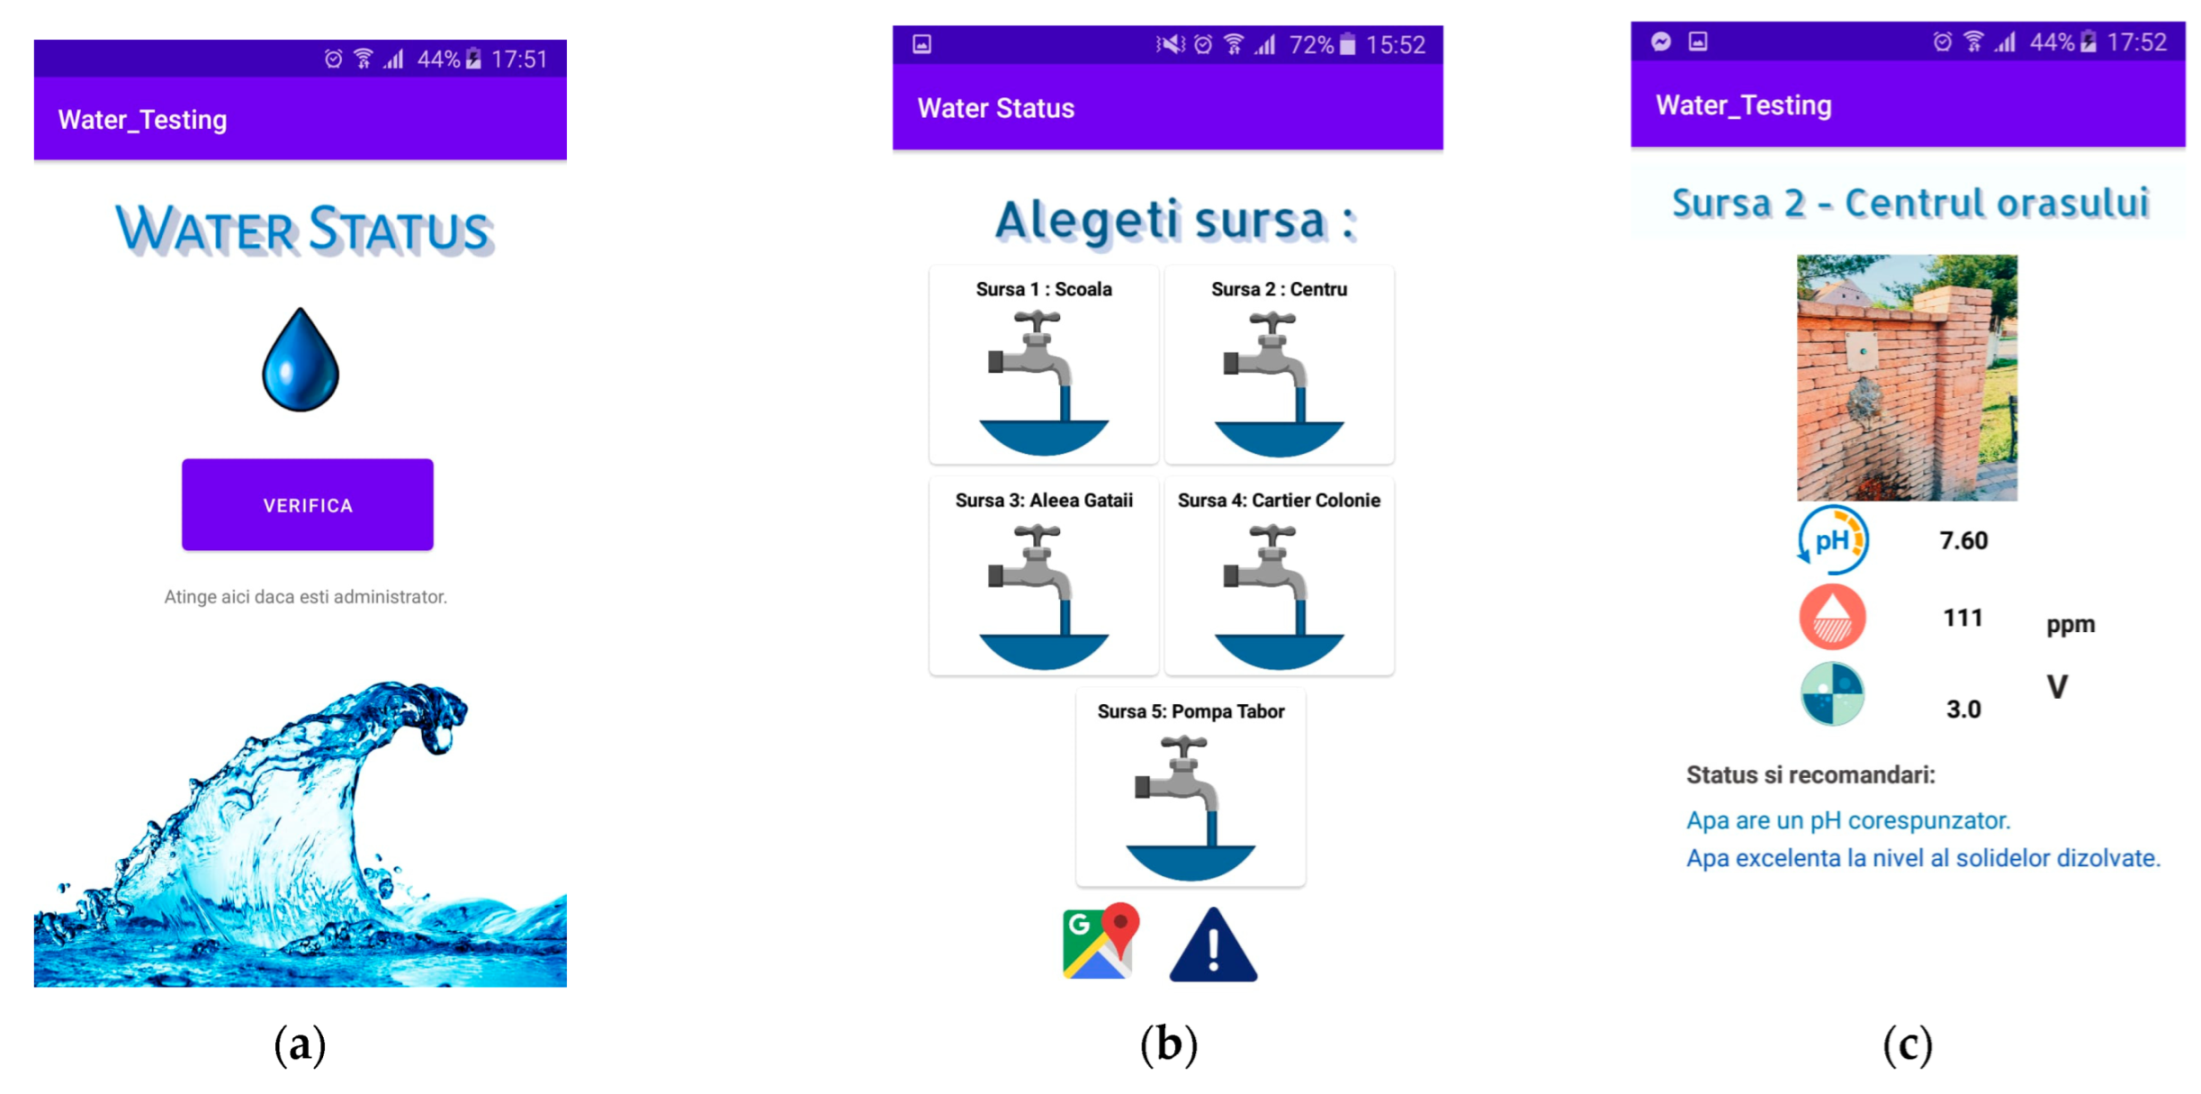
4.1. Water Status Mobile Application
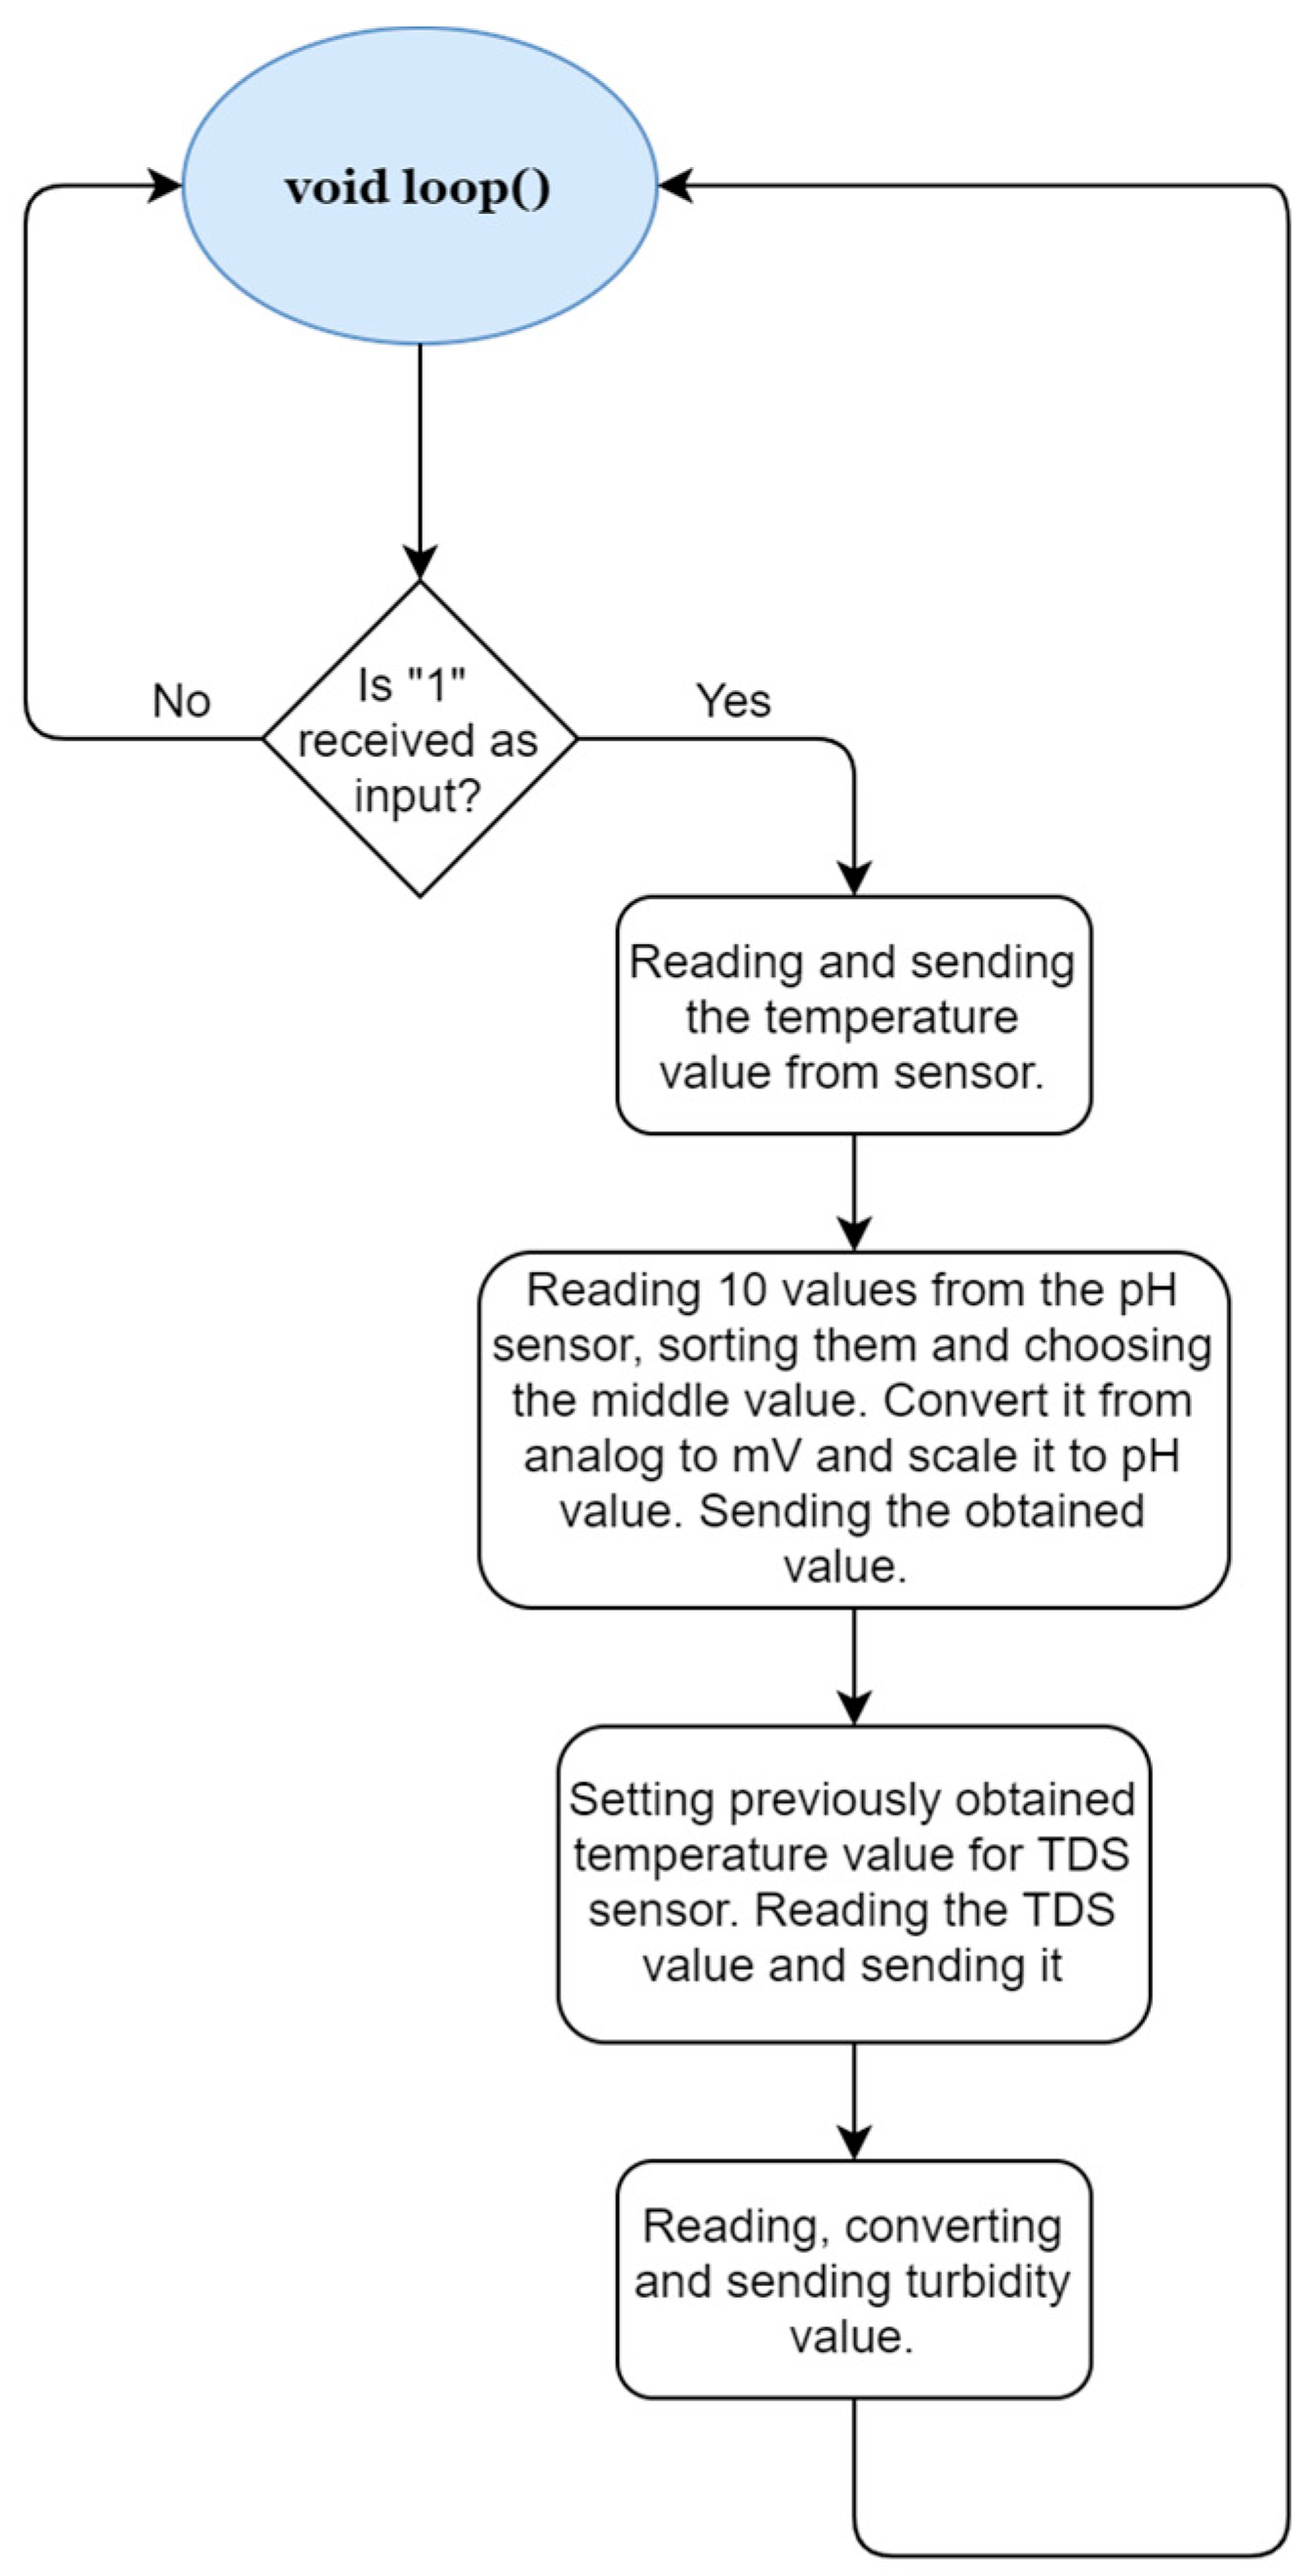
4.2. Software for the Arduino Board
5. Calibration of Sensors
- 1.
- Prepare two buffer solutions with different pH. In the scientific literature [8], the minimum of this pH is 4.00, while the maximum we found to be either pH 7.00 or pH 9.20;
- 2.
- Dip the SEN0161 pH sensor in the pH 4.00 buffer solution;
- 3.
- Set the sensor to read the pH as having a value of 4.00;
- 4.
- Clear the probe with distilled water;
- 5.
- Dip the SEN0161 pH sensor in the pH 9.20 buffer solution;
- 6.
- Check the sensor reading;
- 7.
- Record the difference in the sensor reading, this is the error;
- 8.
- Clear the probe with distilled water;
- 9.
- Dip the SEN0161 pH sensor in the solution for which the pH should be obtained;
- 10.
- Calculate the actual pH with the following equation:
- 11.
- For the pH sensor value to be relevant and in accordance to reality, we have collected 10 successive values, we have sorted the vector, and we have used the average value. Hereafter, we have transformed this value in millivolts by using Equation (3).
- 12.
- We have multiplied by 3.5 the value from step 11, in order to obtain the pH value.
- Prepare a standard buffer solution as previously described or a TDS pen;
- Dip the TDS SEN0244 sensor in the buffer solution;
- Clear the probe with distilled water;
- Dip the TDS SEN0244 sensor in the solution to be measured;
- Check the sensor reading;
- Record the difference in the sensor reading, this is the error;
- Clear the probe with distilled water;
- Calculate the actual TDS value with the following equation:
6. Testing of the Setup
7. Conclusions
Author Contributions
Funding
Institutional Review Board Statement
Informed Consent Statement
Data Availability Statement
Acknowledgments
Conflicts of Interest
References
- World Health Organization. Guidelines for Drinking Water Quality, Recommendations; WHO Library Cataloguing-in-Publication Data: Geneva, Switzerland, 2017; Volume 1.
- Almaviva, S.; Artuso, F.; Giardina, I.; Lai, A.; Pasquo, A. Fast Detection of Different Water Contaminants by Raman Spectroscopy and Surface-Enhanced Raman Spectroscopy. Sensors 2022, 22, 8338. [Google Scholar] [CrossRef] [PubMed]
- Lin, L.; Yang, H.; Xu, X. Effects of Water Pollution on Human Health and Disease Heterogeneity: A Review. Front. Environ. Sci. 2022, 10, 880246. [Google Scholar] [CrossRef]
- Alvizuri-Tintaya, P.A.; Villena-Martínez, E.M.; Avendaño-Acosta, N.; Lo-Iacono-Ferreira, V.G.; Torregrosa-López, J.I.; Lora-García, J. Contamination of Water Supply Sources by Heavy Metals: The Price of Development in Bolivia, a Latin American Reality. Water 2022, 14, 3470. [Google Scholar] [CrossRef]
- Lazar, L.; Rodino, S.; Pop, R.; Tiller, R.; D’Haese, N.; Viaene, P.; De Kok, J.-L. Sustainable Development Scenarios in the Danube Delta—A Pilot Methodology for Decision Makers. Water 2022, 14, 3484. [Google Scholar] [CrossRef]
- Bashir, I.; Lone, F.A.; Bhat, R.A.; Mir, S.A.; Dar, Z.A.; Dar, S.A. Concerns and Threats of Contamination on Aquatic Ecosystems. In Bioremediation and Biotechnology; Springer: Cham, Switzerland, 2020; Volume 27, pp. 1–26. [Google Scholar]
- FAO (Food and Agriculture Organization of the United Nations). The State of the World’s Land and Water Resources: Managing Systems at Risk; Food and Agriculture Organization of the United Nations: Rome, Italy, 2011.
- Singh, R.; Baz, M.; Gehlot, A.; Rashid, M.; Khurana, M.; Akram, S.V.; Alshamrani, S.S.; AlGhamdi, A.S. Water Quality Monitoring and Management of Building Water Tank Using Industrial Internet of Things. Sustainability 2021, 13, 8452. [Google Scholar] [CrossRef]
- Dunca, A. Water Pollution and Water Quality Assessment of Major Transboundary Rivers from Banat (Romania). J. Chem. 2018, 2018, 9073763. [Google Scholar] [CrossRef]
- Breaban, I.G.; Breaban, A.I. Causes and Effects of Water Pollution in Romania. In Water Resources Management in Romania, 1st ed.; Negm, A., Romanescu, G., Zeleňáková, G., Eds.; Springer: Cham, Switzerland, 2020. [Google Scholar]
- WHO. pH in Drinking-Water. In WHO Guidelines for Drinking-Water Quality; WHO: Geneva, Switzerland, 2007. [Google Scholar]
- WHO. Total Dissolved Solids in Drinking-Water. In WHO Guidelines for Drinking-Water Quality; WHO: Geneva, Switzerland, 2003. [Google Scholar]
- Hafeez, S.; Wong, M.S.; Ho, H.C.; Nazeer, M.; Nichol, J.; Abbas, S.; Tang, D.; Lee, K.H.; Pun, L. Comparison of Machine Learning Algorithms for Retrieval of Water Quality Indicators in Case-II Waters: A Case Study of Hong Kong. Remote Sens. 2019, 11, 617. [Google Scholar] [CrossRef]
- Zompanti, A.; Grasso, S.; Sabatini, A.; Vollero, L.; Pennazza, G.; Santonico, M. A Multi-Sensor System for Sea Water Iodide Monitoring and Seafood Quality Assurance: Proof-of-Concept Study. Sensors 2021, 21, 4464. [Google Scholar] [CrossRef]
- Lu, Q.; Si, W.; Wei, L.; Li, Z.; Xia, Z.; Ye, S.; Xia, Y. Retrieval of Water Quality from UAV-Borne Hyperspectral Imagery: A Comparative Study of Machine Learning Algorithms. Remote Sens. 2021, 13, 3928. [Google Scholar] [CrossRef]
- Liu, H.; Yu, T.; Hu, B.; Hou, X.; Zhang, Z.; Liu, X.; Liu, J.; Wang, X.; Zhong, J.; Tan, Z.; et al. UAV-Borne Hyperspectral Imaging Remote Sensing System Based on Acousto-Optic Tunable Filter for Water Quality Monitoring. Remote Sens. 2021, 13, 4069. [Google Scholar] [CrossRef]
- Chang, H.-C.; Hsu, Y.-L.; Hung, S.-S.; Ou, G.-R.; Wu, J.-R.; Hsu, C. Autonomous Water Quality Monitoring and Water Surface Cleaning for Unmanned Surface Vehicle. Sensors 2021, 21, 1102. [Google Scholar] [CrossRef] [PubMed]
- Tang, W.; Biglari, A.; Ebarb, R.; Pickett, T.; Smallidge, S.; Ward, M. A Smart Sensing System of Water Quality and Intake Monitoring for Livestock and Wild Animals. Sensors 2021, 8, 2885. [Google Scholar] [CrossRef] [PubMed]
- Behjati, M.; Mohd Noh, A.B.; Alobaidy, H.A.H.; Zulkifley, M.A.; Nordin, R.; Abdullah, N.F. LoRa Communications as an Enabler for Internet of Drones towards Large-Scale Livestock Monitoring in Rural Farms. Sensors 2021, 21, 5044. [Google Scholar] [CrossRef] [PubMed]
- Frau, I.; Wylie, S.; Byrne, P.; Onnis, P.; Cullen, J.; Mason, A.; Korostynska, O. Microwave Sensors for In Situ Monitoring of Trace Metals in Polluted Water. Sensors 2021, 21, 3147. [Google Scholar] [CrossRef] [PubMed]
- Abdulsattar, R.K.; Elwi, T.A.; Abdul Hassain, Z.A. A New Microwave Sensor Based on the Moore Fractal Structure to Detect Water Content in Crude Oil. Sensors 2021, 21, 7143. [Google Scholar] [CrossRef] [PubMed]
- Zeng, R.; Mannaerts, C.M.; Shang, Z. A Low-Cost Digital Colorimetry Setup to Investigate the Relationship between Water Color and Its Chemical Composition. Sensors 2021, 21, 6699. [Google Scholar] [CrossRef]
- Shadrin, D.; Nikitin, A.; Tregubova, P.; Terekhova, V.; Jana, R.; Matveev, S.; Pukalchik, M. An Automated Approach to Groundwater Quality Monitoring—Geospatial Mapping Based on Combined Application of Gaussian Process Regression and Bayesian Information Criterion. Water 2021, 13, 400. [Google Scholar] [CrossRef]
- De Jesus, K.L.M.; Senoro, D.B.; Dela Cruz, J.C.; Chan, E.B. A Hybrid Neural Network–Particle Swarm Optimization Informed Spatial Interpolation Technique for Groundwater Quality Mapping in a Small Island Province of the Philippines. Toxics 2021, 9, 273. [Google Scholar] [CrossRef]
- Hussein, E.A.; Thron, C.; Ghaziasgar, M.; Bagula, A.; Vaccari, M. Groundwater Prediction Using Machine-Learning Tools. Algorithms 2020, 13, 300. [Google Scholar] [CrossRef]
- Paepae, T.; Bokoro, P.N.; Kyamakya, K. From Fully Physical to Virtual Sensing for Water Quality Assessment: A Comprehensive Review of the Relevant State-of-the-Art. Sensors 2021, 21, 6971. [Google Scholar] [CrossRef]
- Mosavi, A.; Hosseini, F.S.; Choubin, B.; Abdolshahnejad, M.; Gharechaee, H.; Lahijanzadeh, A.; Dineva, A.A. Susceptibility Prediction of Groundwater Hardness Using Ensemble Machine Learning Models. Water 2020, 12, 2770. [Google Scholar] [CrossRef]
- Ferencz, B.; Dawidek, J. Assessment of Spatial and Vertical Variability of Water Quality: Case Study of a Polymictic Polish Lake. Int. J. Environ. Res. Public Health 2021, 18, 8620. [Google Scholar] [CrossRef] [PubMed]
- El Ouali, A.; El Hafyani, M.; Roubil, A.; Lahrach, A.; Essahlaoui, A.; Hamid, F.E.; Muzirafuti, A.; Paraforos, D.S.; Lanza, S.; Randazzo, G. Modeling and Spatiotemporal Mapping of Water Quality through Remote Sensing Techniques: A Case Study of the Hassan Addakhil Dam. Appl. Sci. 2021, 11, 9297. [Google Scholar] [CrossRef]
- Budiarti, R.P.N.; Tjahjono, A.; Hariadi, M.; Purnomo, M.H. Development of IoT for Automated Water Quality Monitoring System. In Proceedings of the 2019 International Conference on Computer Science, Information Technology, and Electrical Engineering (ICOMITEE), Jember, Indonesia, 16–17 October 2019; pp. 211–216. [Google Scholar]
- Zhao, L.; Hong, M.; Wang, X. Has Third-Party Monitoring Improved Water Pollution Data Quality? Evidence from National Surface Water Assessment Sections in China. Water 2021, 13, 2917. [Google Scholar] [CrossRef]
- Zhu, W.; Dai, Z.; Gu, H.; Zhu, X. Water Extraction Method Based on Multi-Texture Feature Fusion of Synthetic Aperture Radar Images. Sensors 2021, 21, 4945. [Google Scholar] [CrossRef]
- Naloufi, M.; Lucas, F.S.; Souihi, S.; Servais, P.; Janne, A.; Wanderley Matos De Abreu, T. Evaluating the Performance of Machine Learning Approaches to Predict the Microbial Quality of Surface Waters and to Optimize the Sampling Effort. Water 2021, 13, 2457. [Google Scholar] [CrossRef]
- Rodríguez, R.; Pastorini, M.; Etcheverry, L.; Chreties, C.; Fossati, M.; Castro, A.; Gorgoglione, A. Water-Quality Data Imputation with a High Percentage of Missing Values: A Machine Learning Approach. Sustainability 2021, 13, 6318. [Google Scholar] [CrossRef]
- Huangfu, K.; Li, J.; Zhang, X.; Zhang, J.; Cui, H.; Sun, Q. Remote Estimation of Water Quality Parameters of Medium- and Small-Sized Inland Rivers Using Sentinel-2 Imagery. Water 2020, 12, 3124. [Google Scholar] [CrossRef]
- Hong, W.J.; Shamsuddin, N.; Abas, E.; Apong, R.A.; Masri, Z.; Suhaimi, H.; Gödeke, S.H.; Noh, M.N.A. Water Quality Monitoring with Arduino Based Sensors. Environments 2021, 8, 6. [Google Scholar] [CrossRef]
- Osman, S.O.; Mohamed, M.Z.; Suliman, A.M.; Mohammed, A.A. Design and Implementation of a Low-Cost Real-Time In-Situ Drinking Water Quality Monitoring System Using Arduino. In Proceedings of the 2018 International Conference on Computer, Control, Electrical, and Electronics Engineering (ICCCEEE), Khartoum, Sudan, 12–14 August 2018; pp. 1–7. [Google Scholar]
- Feng, C.; Yuan, J.; Sun, Y.; You, J. Design of Water Quality Monitoring System. In Proceedings of the 2020 International Conference on Artificial Intelligence and Computer Engineering (ICAICE), Beijing, China, 23–25 October 2020; pp. 264–267. [Google Scholar]
- Taru, Y.K.; Karwankar, A. Water monitoring system using arduino with labview. In Proceedings of the 2017 International Conference on Computing Methodologies and Communication (ICCMC), Erode, India, 18–19 July 2017; pp. 416–419. [Google Scholar]
- Sowmya, C.; Naidu, C.D.; Somineni, R.P.; Reddy, D.R. Implementation of Wireless Sensor Network for Real Time Overhead Tank Water Quality Monitoring. In Proceedings of the 2017 IEEE 7th International Advance Computing Conference (IACC), Hyderabad, India, 5–7 January 2017; pp. 546–551. [Google Scholar]
- Almojela, I.F.; Gonzales, S.M.; Gutierrez, K.; Santos, A.; Malabanan, F.; Tabin, J.N.; Ezcarez, C. WatAr: An Arduino-based Drinking Water Quality Monitoring System using Wireless Sensor Network and GSM Module. In Proceedings of the 2020 IEEE REGION 10 CONFERENCE (TENCON), Osaka, Japan, 16–19 November 2020; pp. 550–555. [Google Scholar]
- Sabari, M.; Aswinth, P.; Karthik, T.; Kumar, B.C. Water Quality Monitoring System Based on IoT. In Proceedings of the 2020 5th International Conference on Devices, Circuits and Systems (ICDCS), Coimbatore, India, 5–6 March 2020; pp. 279–282. [Google Scholar]
- Abdulwahid, A.H. IoT Based Water Quality Monitoring System for Rural Areas. In Proceedings of the 2020 9th International Conference on Renewable Energy Research and Application (ICRERA), Glasgow, UK, 27–30 September 2020; pp. 279–282. [Google Scholar]
- Moparthi, N.R.; Mukesh, C.; Vidya Sagar, P. Water Quality Monitoring System Using IOT. In Proceedings of the 2018 Fourth International Conference on Advances in Electrical, Electronics, Information, Communication and Bio-Informatics (AEEICB), Chennai, India, 27–28 February 2018; pp. 1–5. [Google Scholar]
- Lakshmanan, L.; Jesudoss, A.; Sivasangari, A.; Maran, S.; Mercy Theresa, M. Analysis of the Water Quality Monitoring System. In Proceedings of the 2020 International Conference on Communication and Signal Processing (ICCSP), Chennai, India, 28–30 July 2020; pp. 1032–1035. [Google Scholar]
- Alam, A.U.; Clyne, D.; Deen, M.J. A Low-Cost Multi-Parameter Water Quality Monitoring System. Sensors 2021, 21, 3775. [Google Scholar] [CrossRef]
- Ahmed, U.; Mumtaz, R.; Anwar, H.; Shah, A.A.; Irfan, R.; García-Nieto, J. Efficient Water Quality Prediction Using Supervised Machine Learning. Water 2019, 11, 2210. [Google Scholar] [CrossRef]
- Eldesouky, E.; Bekhit, M.; Fathalla, A.; Salah, A.; Ali, A. A Robust UWSN Handover Prediction System Using Ensemble Learning. Sensors 2021, 21, 5777. [Google Scholar] [CrossRef] [PubMed]
- Arias-Rodriguez, L.F.; Duan, Z.; Sepúlveda, R.; Martinez-Martinez, S.I.; Disse, M. Monitoring Water Quality of Valle de Bravo Reservoir, Mexico, Using Entire Lifespan of MERIS Data and Machine Learning Approaches. Remote Sens. 2020, 12, 1586. [Google Scholar] [CrossRef]
- Arias-Rodriguez, L.F.; Duan, Z.; Díaz-Torres, J.d.J.; Basilio Hazas, M.; Huang, J.; Kumar, B.U.; Tuo, Y.; Disse, M. Integration of Remote Sensing and Mexican Water Quality Monitoring System Using an Extreme Learning Machine. Sensors 2021, 21, 4118. [Google Scholar] [CrossRef]
- Pu, F.; Ding, C.; Chao, Z.; Yu, Y.; Xu, X. Water-Quality Classification of Inland Lakes Using Landsat8 Images by Convolutional Neural Networks. Remote Sens. 2019, 11, 1674. [Google Scholar] [CrossRef]
- Stajkowski, S.; Kumar, D.; Samui, P.; Bonakdari, H.; Gharabaghi, B. Genetic-Algorithm-Optimized Sequential Model for Water Temperature Prediction. Sustainability 2020, 12, 5374. [Google Scholar] [CrossRef]
- Post, C.; Brülisauer, S.; Waldschläger, K.; Hug, W.; Grüneis, L.; Heyden, N.; Schmor, S.; Förderer, A.; Reid, R.; Reid, M.; et al. Application of Laser-Induced, Deep UV Raman Spectroscopy and Artificial Intelligence in Real-Time Environmental Monitoring—Solutions and First Results. Sensors 2021, 21, 3911. [Google Scholar] [CrossRef]
- Goparaju, S.U.N.; Vaddhiparthy, S.S.S.; Pradeep, C.; Vattem, A.; Gangadharan, D. Design of an IoT System for Machine Learning Calibrated TDS Measurement in Smart Campus. In Proceedings of the 2021 IEEE 7th World Forum on Internet of Things (WF-IoT), New Orleans, LA, USA, 14 June–31 July 2021; pp. 877–882. [Google Scholar]


| Reference | Description | Addressed Points | Current Approach |
|---|---|---|---|
| [24] | The implementation of various spatial interpolation methods results in significant variations from the true spatial distribution of water quality in a specific location. This research improves the mapping prediction capabilities of spatial interpolation algorithms | Groundwater-quality mapping using a neural network approach | Water-quality monitoring system based on specific measured parameters |
| [26] | The feasibility of virtual sensing for water-quality assessment is reviewed. The review focuses on the overview of key water-quality parameters for a particular use case and the development of the corresponding cost estimates for their monitoring | Multiple solutions are analyzed in terms of modeling approaches and various parameters | The water-quality monitoring system is based on low-cost components |
| [30] | Web scrapping and Python scripts are used for analysis, aggregation, and filtering of data from the sensors | An integrated system based on internet-of-things for measuring the water quality; MQTT protocol communication; MariaDB databases; sensors’ data graph plotting | Firebase databases used for the development of the water status app |
| [34] | Several statistical and machine-learning models are used for imputing water-quality data at six monitoring stations | Water-quality data analysis using a machine learning approach | Water-quality monitoring system based on specific measured parameters. The machine learning approach is part of future work |
| [35] | This study tries to improve the image spatial resolution and to weaken the interference of mixed pixels in the image. The study is focused on the water-quality monitoring of medium- and small-sized inland rivers | Remote estimation of water-quality parameters using Sentinel-2 imagery | The measured parameters: pH, turbidity, TDS |
| [41] | Arduino-based monitoring system that measures four physicochemical parameters of water: pH, temperature, turbidity, and electrical conductivity in order to identify possible water contamination | WatAr: an Arduino-based drinking water-quality monitoring system using a wireless sensor network and GSM module | The communication used in our approach is based on Bluetooth module BT04 |
| [43] | Affordable system to control water quality in real time, based on several sensors, which measure various chemical and physical water properties, such as conductivity, pH, turbidity, and temperature. | Real-time water-quality monitoring using various sensors | The measured parameters: pH, turbidity, TDS |
| [8] | An IoT-based architecture is proposed and implemented for monitoring the level and quality of water in a domestic water tank with customized hardware based on 2.4 GHz radiofrequency (RF) communication | Real-time experimental setup for water-quality monitoring | The communication used in our approach is based on Bluetooth module BT04 and a Firebase database |
| [46] | A multi-parameter water-quality monitoring system (MWQMS) is proposed that includes an array of low-cost, easy-to-use, high-sensitivity electrochemical sensors, as well as custom-designed sensor readout circuitry and a smartphone application with wireless connectivity | Simultaneous monitoring of pH, free chlorine, and temperature with high levels of sensitivity | The measured parameters: pH, turbidity, TDS |
| Components | Price (in Euro) |
|---|---|
| Arduino UNO r3 | 39 |
| Bluetooth module BT04 | 1.4 |
| Temperature sensor DS18B20 | 2.4 |
| pH Sensor—SEN0161 | 44.4 |
| TDS Sensor—SEN0244 | 17 |
| Turbidity Sensor—SKU SEN0189 | 16 |
| Total | 120.2 |
| Date | Source 1—School | Source 2—Center | ||||||
|---|---|---|---|---|---|---|---|---|
| Temperature (Grade) | pH | Turbidity (V) | TDS (PPM) | Temperature (Grade) | pH | Turbidity (V) | TDS (PPM) | |
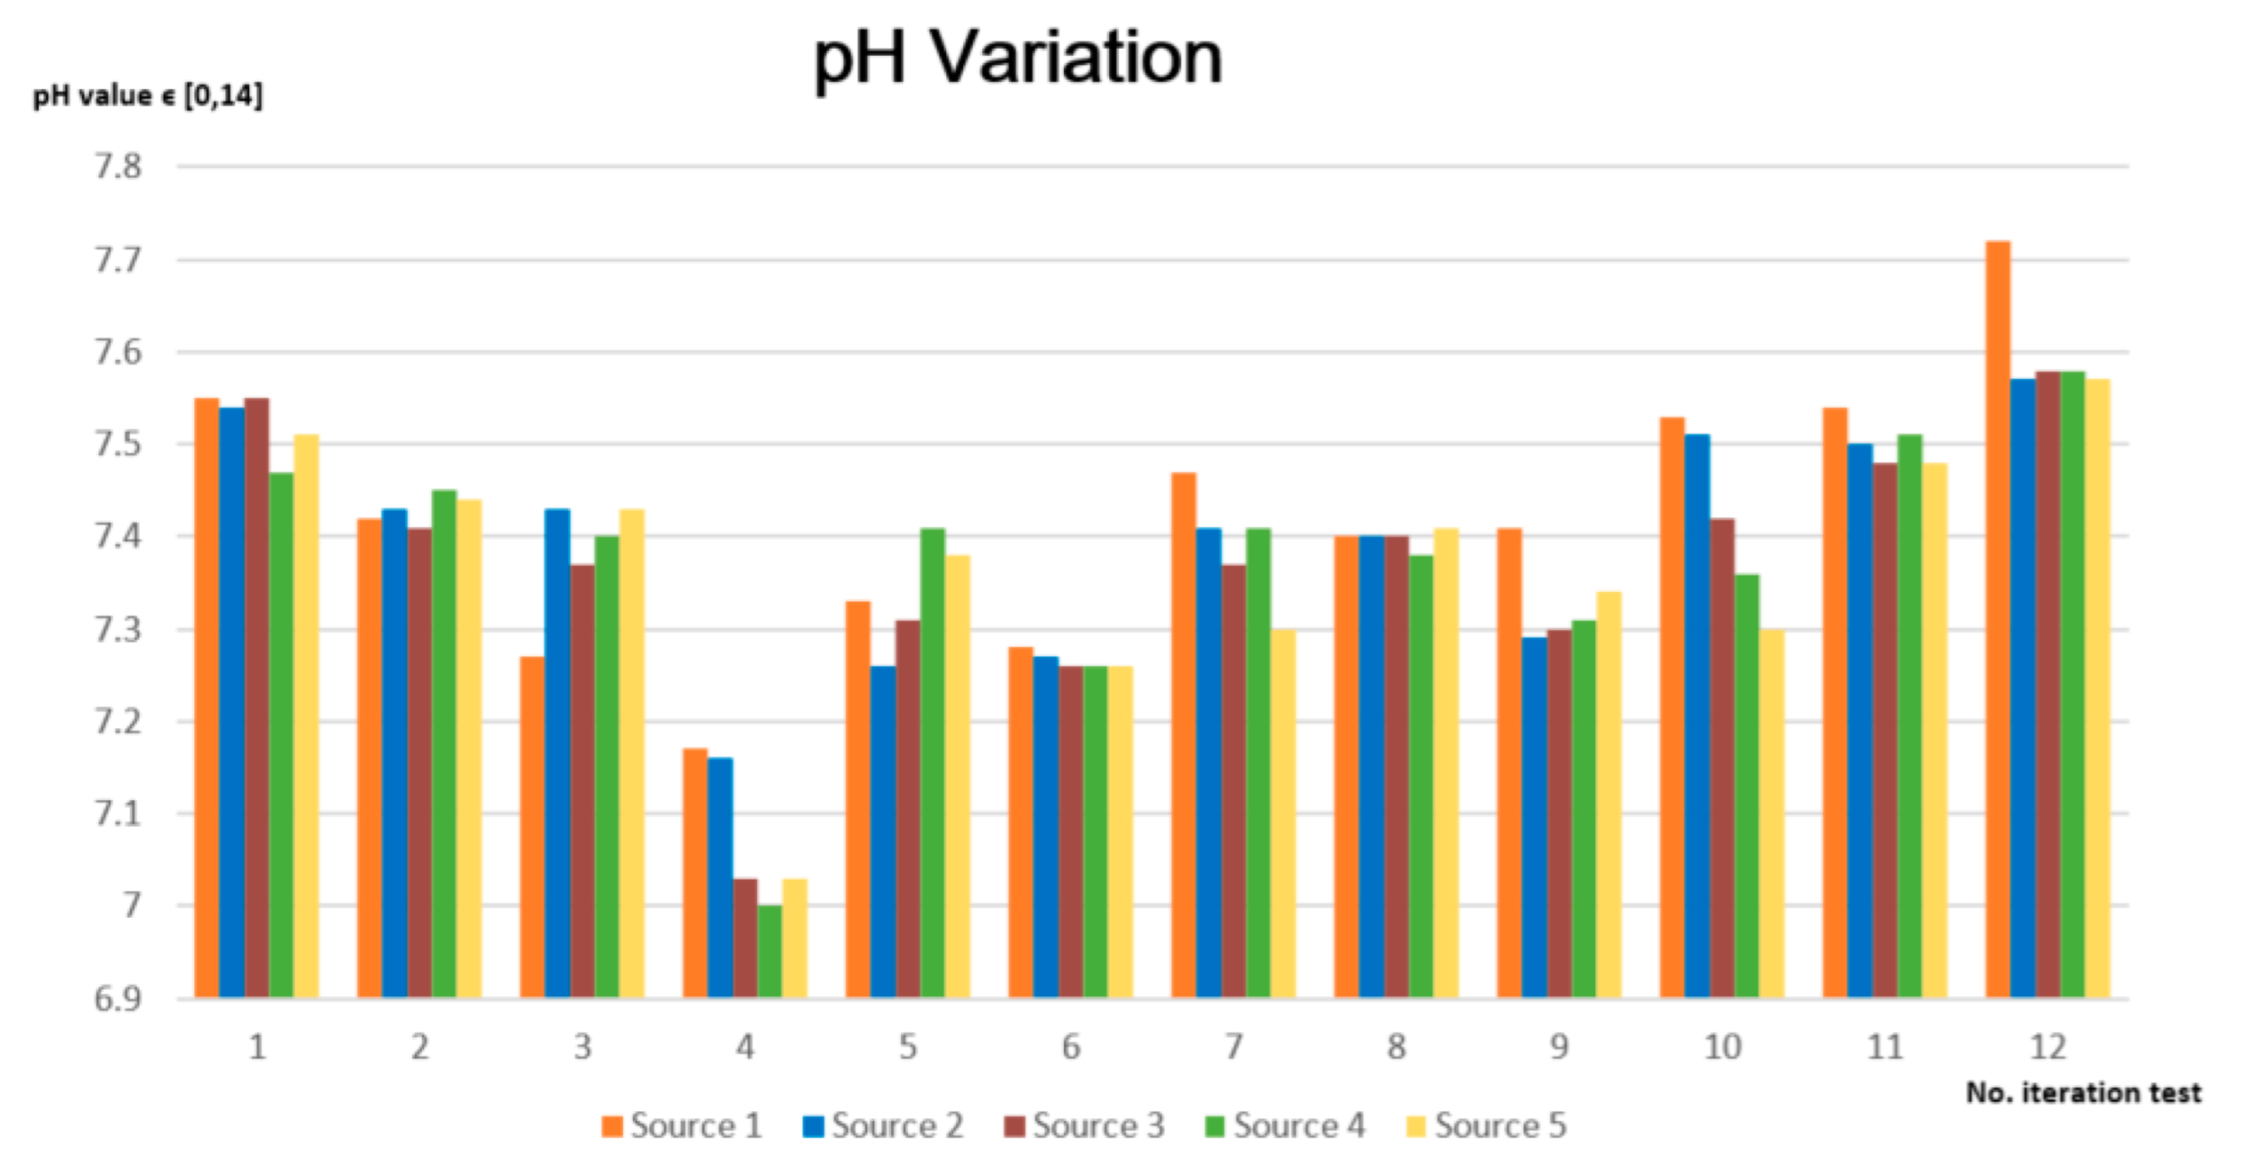
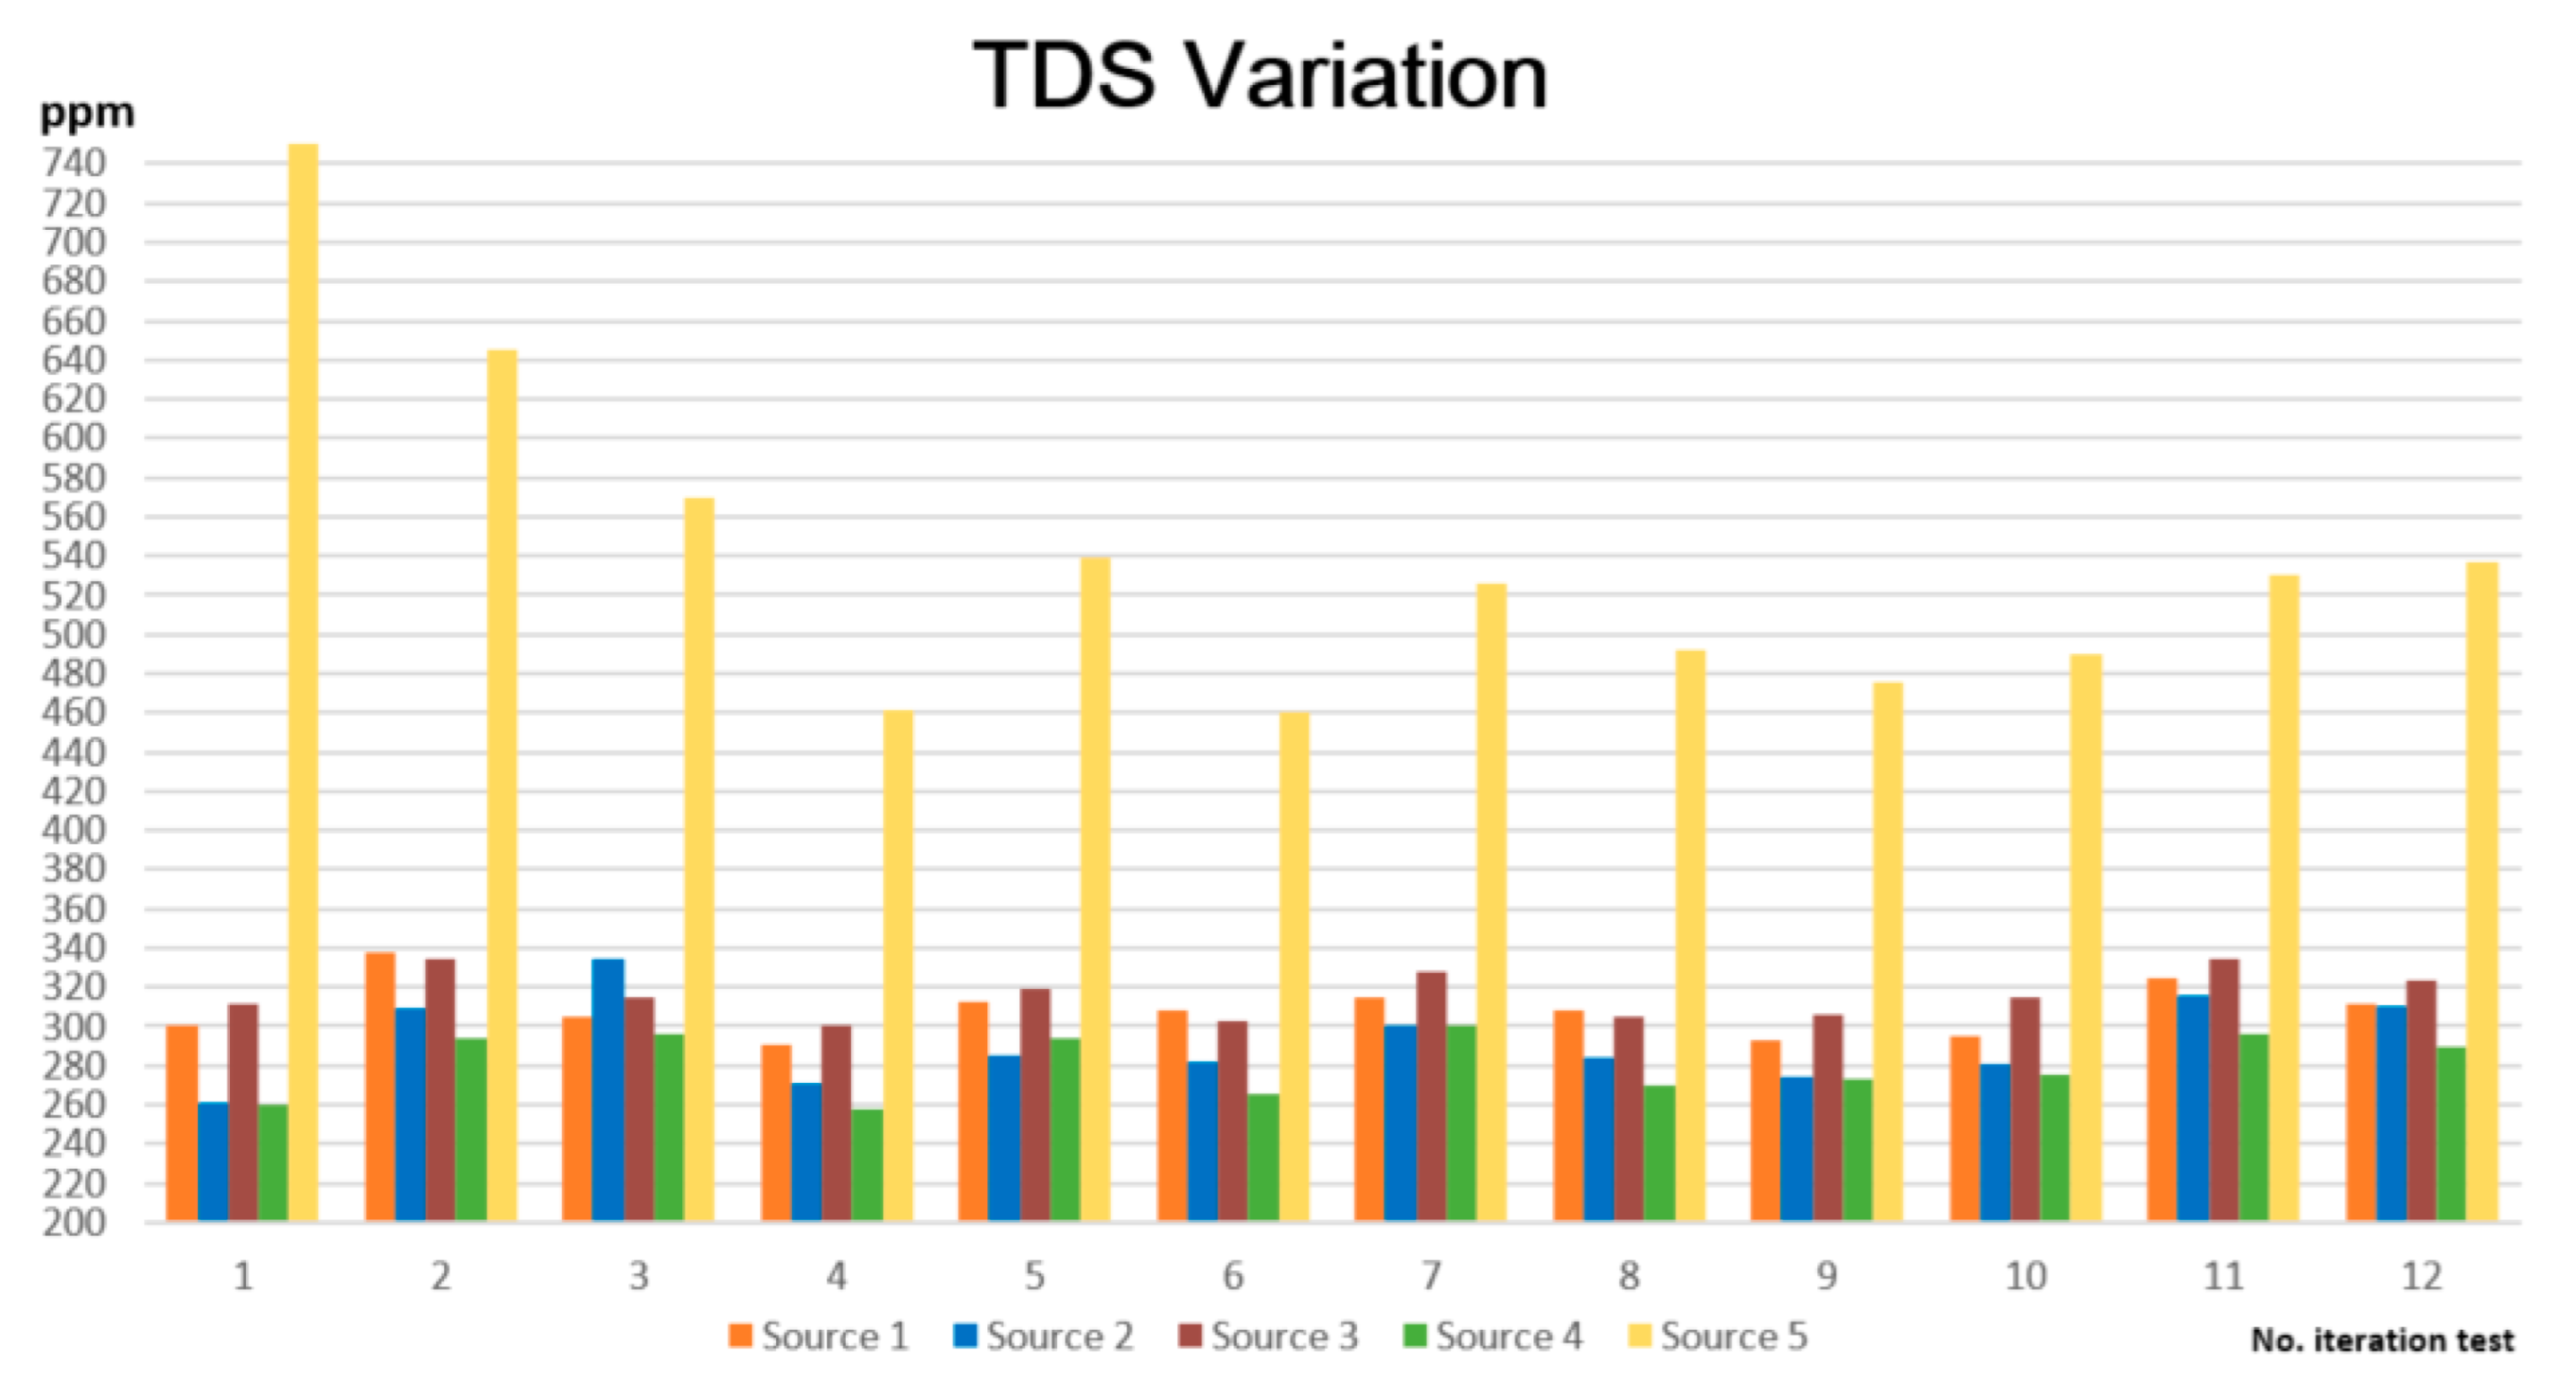
| 27 October 2022 | 21.37 | 7.55 | 4.51 | 300 | 20.87 | 7.54 | 4.50 | 261 |
| 29 October 2022 | 22.00 | 7.42 | 4.01 | 338 | 22.06 | 7.43 | 3.24 | 309 |
| 1 November 2022 | 22.94 | 7.27 | 3.89 | 305 | 23.00 | 7.43 | 3.56 | 335 |
| 12 November 2022 | 28.00 | 7.17 | 3.53 | 291 | 27.37 | 7.16 | 3.53 | 271 |
| 13 November 2022 | 22.69 | 7.33 | 3.58 | 313 | 22.50 | 7.26 | 3.59 | 285 |
| 14 November 2022 | 21.19 | 7.28 | 3.57 | 308 | 21.31 | 7.27 | 3.61 | 282 |
| 26 November 2022 | 23.56 | 7.47 | 3.48 | 315 | 23.87 | 7.41 | 3.54 | 301 |
| 27 November 2022 | 22.94 | 7.40 | 3.59 | 308 | 22.81 | 7.40 | 3.62 | 284 |
| 28 November 2022 | 24.56 | 7.41 | 3.60 | 293 | 24.81 | 7.29 | 3.56 | 274 |
| 4 December 2022 | 23.37 | 7.53 | 3.63 | 295 | 23.37 | 7.51 | 3.58 | 281 |
| 5 December 2022 | 23.12 | 7.54 | 3.59 | 325 | 23.19 | 7.50 | 3.51 | 316 |
| 6 December 2022 | 23.00 | 7.72 | 3.54 | 312 | 22.94 | 7.57 | 3.49 | 310 |
| Average: | 23.22 | 7.42 | 3.72 | 305.5 | 23.17 | 7.39 | 3.61 | 292.4 |
| Minim: | 21.19 | 7.17 | 3.48 | 291 | 20.87 | 7.16 | 3.24 | 261 |
| Maxim: | 28.00 | 7.72 | 4.51 | 338 | 27.37 | 7.57 | 4.50 | 335 |
| Date | Source 3—Gataia Street | Source 4—Colonie Neighborhood | ||||||
|---|---|---|---|---|---|---|---|---|
| Temperature (Grade) | pH | Turbidity (V) | TDS (PPM) | Temperature (Grade) | pH | Turbidity (V) | TDS (PPM) | |
| 27 October 2022 | 20.75 | 7.55 | 2.41 | 300 | 20.87 | 7.54 | 4.50 | 260 |
| 29 October 2022 | 21.94 | 7.41 | 3.43 | 338 | 22.06 | 7.43 | 3.24 | 294 |
| 1 November 2022 | 23.00 | 7.37 | 3.83 | 305 | 23.00 | 7.43 | 3.56 | 296 |
| 12 November 2022 | 27.97 | 7.03 | 3.40 | 291 | 27.37 | 7.16 | 3.53 | 258 |
| 13 November 2022 | 22.62 | 7.31 | 3.58 | 313 | 22.50 | 7.26 | 3.59 | 294 |
| 14 November 2022 | 21.19 | 7.26 | 3.59 | 308 | 21.31 | 7.27 | 3.61 | 266 |
| 26 November 2022 | 23.81 | 7.37 | 3.52 | 315 | 23.87 | 7.41 | 3.54 | 301 |
| 27 November 2022 | 22.87 | 7.40 | 3.60 | 308 | 22.81 | 7.40 | 3.62 | 270 |
| 28 November 2022 | 24.94 | 7.30 | 3.48 | 293 | 24.81 | 7.29 | 3.56 | 273 |
| 4 December 2022 | 23.00 | 7.42 | 3.51 | 295 | 23.37 | 7.51 | 3.58 | 275 |
| 5 December 2022 | 23.12 | 7.48 | 3.54 | 325 | 23.19 | 7.50 | 3.51 | 296 |
| 6 December 2022 | 22.94 | 7.58 | 3.57 | 312 | 22.94 | 7.57 | 3.49 | 290 |
| Average: | 23.17 | 7.37 | 3.45 | 308.5 | 23.17 | 7.39 | 3.61 | 281 |
| Minim: | 20.75 | 7.03 | 2.41 | 291 | 20.87 | 7.16 | 3.24 | 258 |
| Maxim: | 27.97 | 7.58 | 3.83 | 338 | 27.37 | 7.57 | 4.50 | 301 |
| Date | Source 5—Tabor | |||
|---|---|---|---|---|
| Temperature (Grade) | pH | Turbidity (V) | TDS (PPM) | |
| 27 October 2022 | 21.87 | 7.51 | 4.66 | 753 |
| 29 October 2022 | 22.19 | 7.44 | 4.01 | 645 |
| 1 November 2022 | 23.31 | 7.43 | 3.86 | 570 |
| 12 November 2022 | 27.87 | 7.03 | 3.46 | 461 |
| 13 November 2022 | 22.56 | 7.38 | 3.59 | 539 |
| 14 November 2022 | 21.31 | 7.26 | 3.59 | 460 |
| 26 November 2022 | 23.94 | 7.30 | 3.66 | 526 |
| 27 November 2022 | 23.12 | 7.41 | 3.66 | 492 |
| 28 November 2022 | 24.81 | 7.34 | 3.52 | 476 |
| 4 December 2022 | 23.25 | 7.30 | 3.63 | 490 |
| 5 December 2022 | 23.44 | 7.48 | 3.54 | 530 |
| 6 December 2022 | 23.06 | 7.57 | 3.50 | 537 |
| Average: | 23.39 | 7.37 | 3.72 | 539.9 |
| Minim: | 21.31 | 7.03 | 3.46 | 460 |
| Maxim: | 27.87 | 7.57 | 4.66 | 753 |
Disclaimer/Publisher’s Note: The statements, opinions and data contained in all publications are solely those of the individual author(s) and contributor(s) and not of MDPI and/or the editor(s). MDPI and/or the editor(s) disclaim responsibility for any injury to people or property resulting from any ideas, methods, instructions or products referred to in the content. |
© 2023 by the authors. Licensee MDPI, Basel, Switzerland. This article is an open access article distributed under the terms and conditions of the Creative Commons Attribution (CC BY) license (https://creativecommons.org/licenses/by/4.0/).
Share and Cite
Bogdan, R.; Paliuc, C.; Crisan-Vida, M.; Nimara, S.; Barmayoun, D. Low-Cost Internet-of-Things Water-Quality Monitoring System for Rural Areas. Sensors 2023, 23, 3919. https://doi.org/10.3390/s23083919
Bogdan R, Paliuc C, Crisan-Vida M, Nimara S, Barmayoun D. Low-Cost Internet-of-Things Water-Quality Monitoring System for Rural Areas. Sensors. 2023; 23(8):3919. https://doi.org/10.3390/s23083919
Chicago/Turabian StyleBogdan, Razvan, Camelia Paliuc, Mihaela Crisan-Vida, Sergiu Nimara, and Darius Barmayoun. 2023. "Low-Cost Internet-of-Things Water-Quality Monitoring System for Rural Areas" Sensors 23, no. 8: 3919. https://doi.org/10.3390/s23083919
APA StyleBogdan, R., Paliuc, C., Crisan-Vida, M., Nimara, S., & Barmayoun, D. (2023). Low-Cost Internet-of-Things Water-Quality Monitoring System for Rural Areas. Sensors, 23(8), 3919. https://doi.org/10.3390/s23083919