
Multispectral Imaging for Skin Diseases Assessment—State of the Art and Perspectives


Abstract
1. Introduction
2. Approaches of Skin Lesion Analysis
2.1. Dermoscopy
2.2. Confocal Laser Scanning Microscopy
2.3. Optical Coherence Tomography
2.4. Multispectral Imaging
2.5. Multiphoton Laser Imaging
2.6. 3D Topography—Fringe Projection
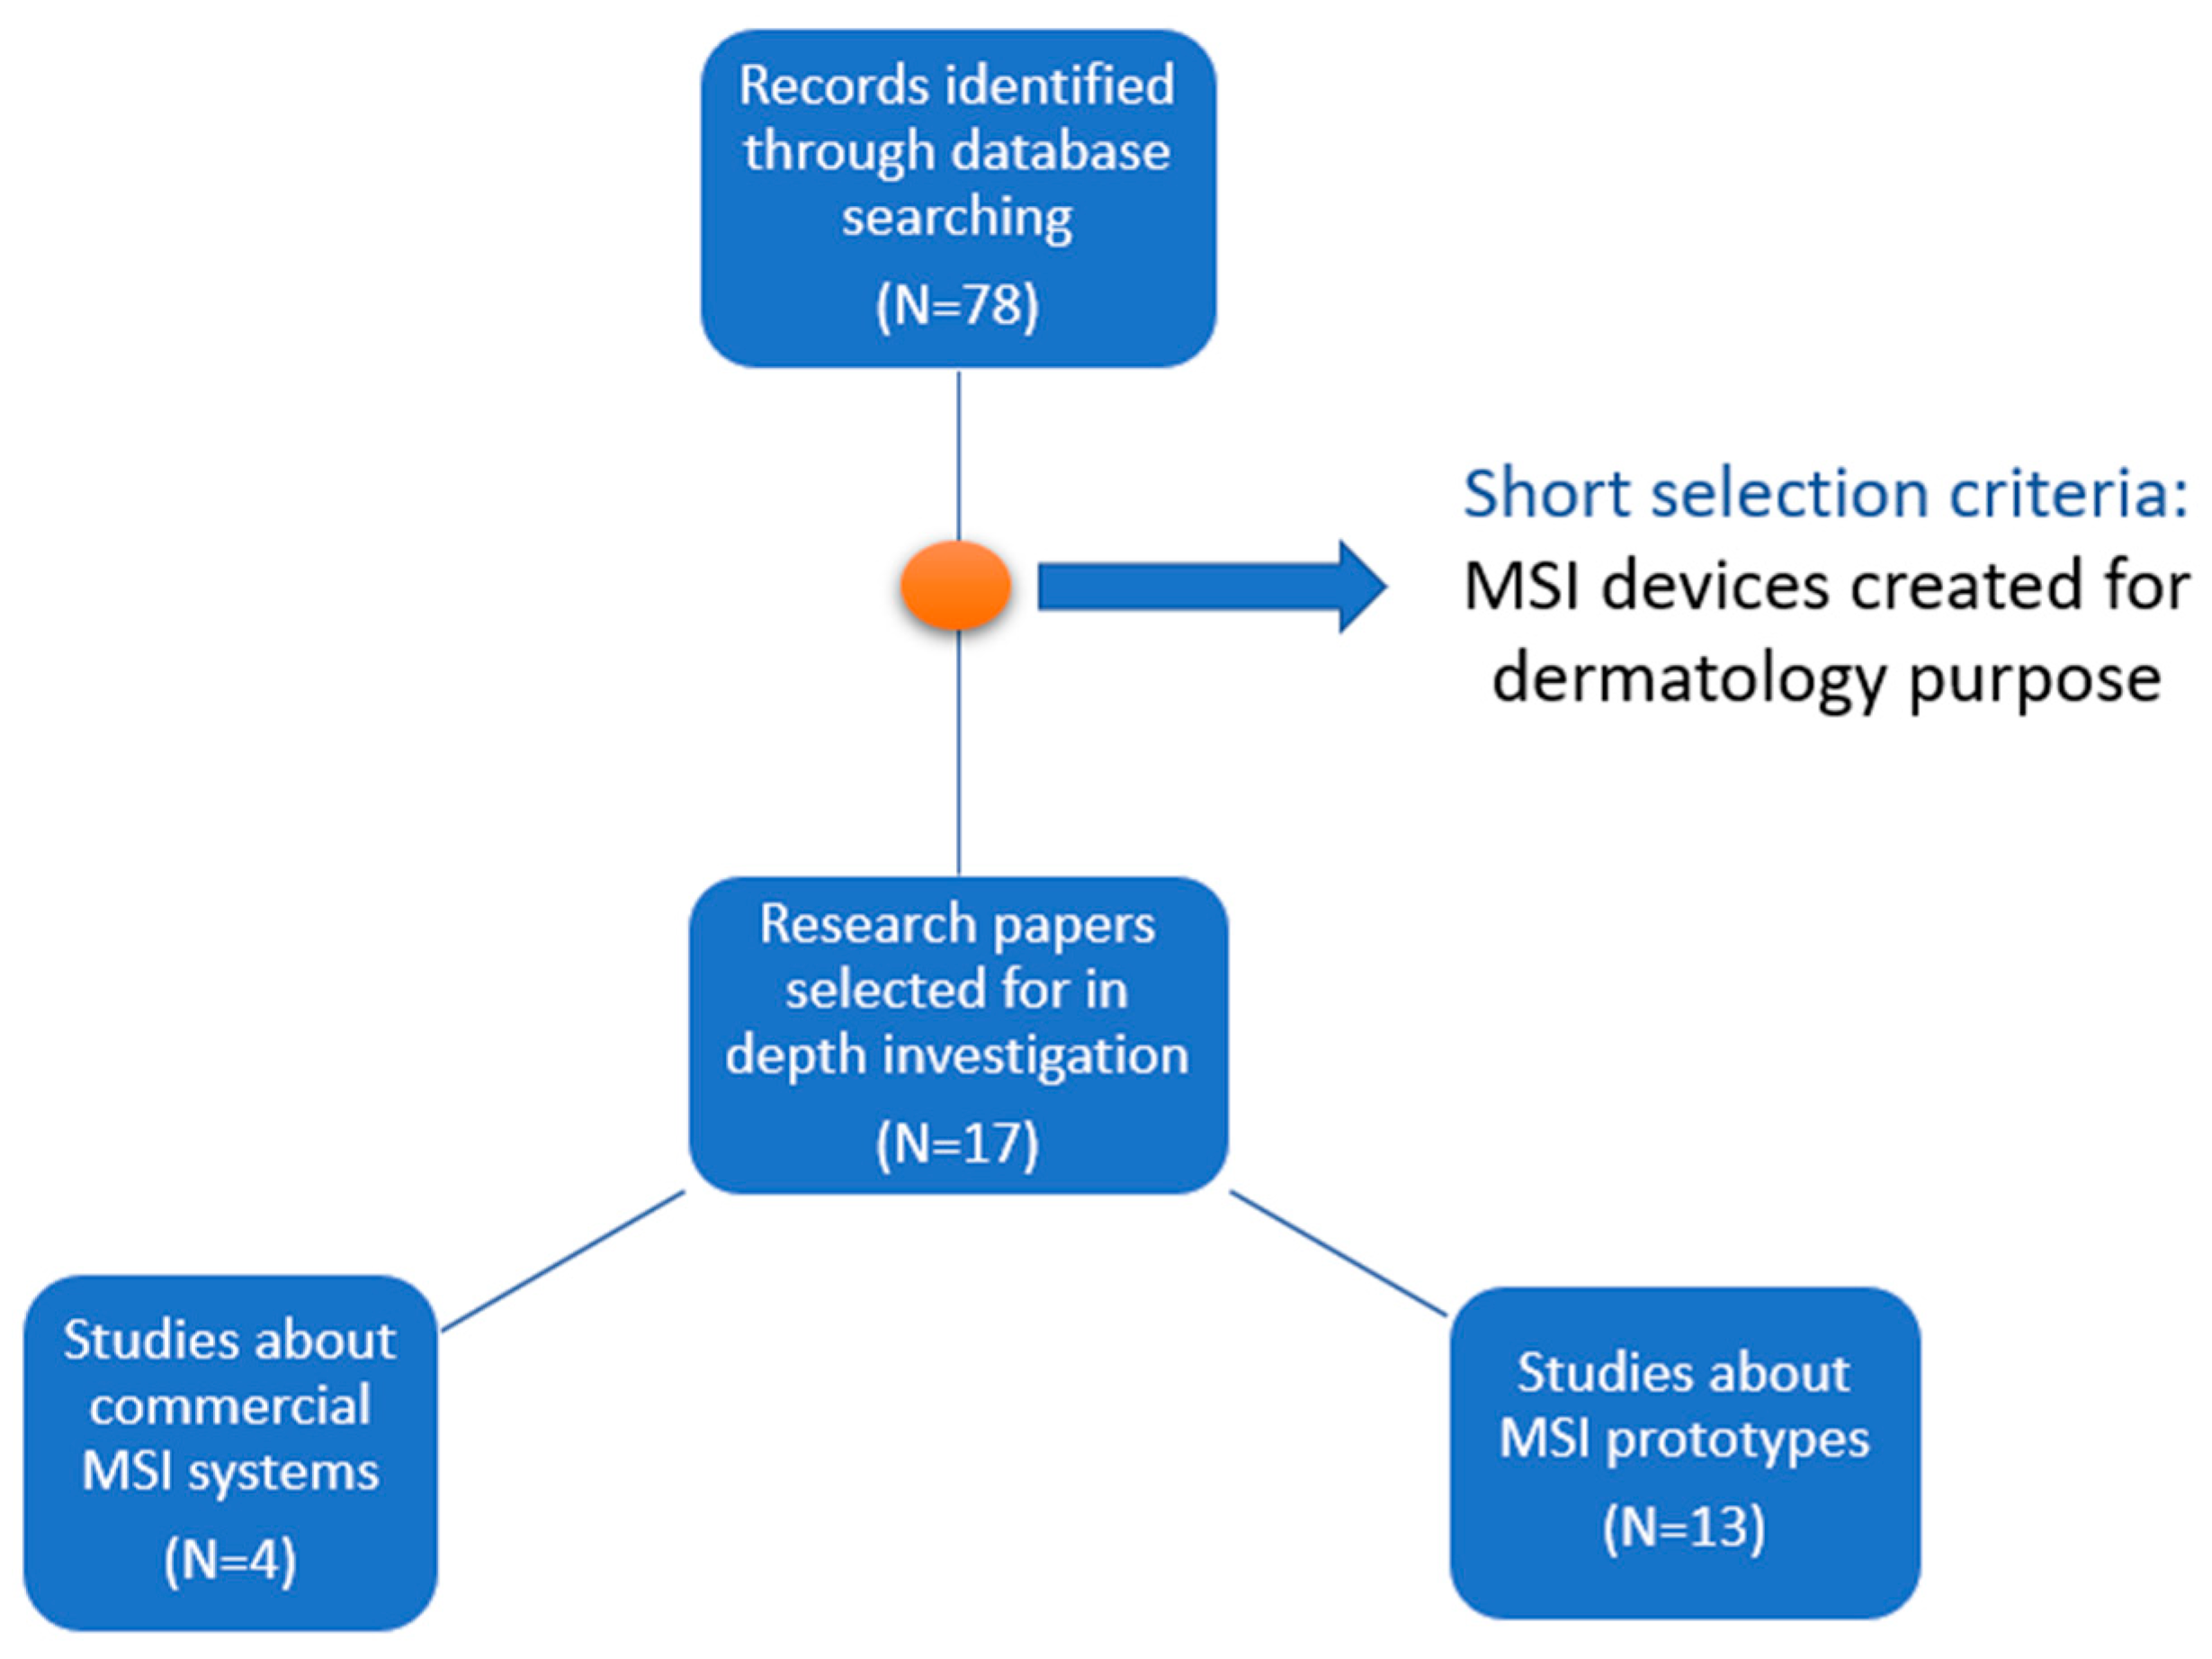
3. Multispectral Imaging Systems
3.1. The Advantages of Using Multispectral Imaging Systems for Dermatology
3.2. Commercial Systems
3.3. Prototypes
4. Discussion
5. Conclusions
Author Contributions
Funding
Institutional Review Board Statement
Informed Consent Statement
Data Availability Statement
Conflicts of Interest
References
- Heibel, H.D.; Hooey, L.; Cockerell, C.J. A Review of Noninvasive Techniques for Skin Cancer Detection in Dermatology. Am. J. Clin. Dermatol. 2020, 21, 513–524. [Google Scholar] [CrossRef]
- Uthoff, R.D.; Song, B.; Maarouf, M.; Shi, V.; Liang, R. Point-of-Care, Multispectral, Smartphone-Based Dermascopes for Dermal Lesion Screening and Erythema Monitoring. J. Biomed. Opt. 2020, 25, 066004. [Google Scholar] [CrossRef] [PubMed]
- Rey-Barroso, L.; Peña-Gutiérrez, S.; Yáñez, C.; Burgos-Fernández, F.J.; Vilaseca, M.; Royo, S. Optical Technologies for the Improvement of Skin Cancer Diagnosis: A Review. Sensors 2021, 21, 252. [Google Scholar] [CrossRef]
- Bakos, R.M.; Blumetti, T.P.; Roldán-Marín, R.; Salerni, G. Noninvasive Imaging Tools in the Diagnosis and Treatment of Skin Cancers. Am. J. Clin. Dermatol. 2018, 19, 3–14. [Google Scholar] [CrossRef]
- Schneider, S.L.; Kohli, I.; Hamzavi, I.H.; Council, M.L.; Rossi, A.M.; Ozog, D.M. Emerging Imaging Technologies in Dermatology: Part I: Basic Principles. J. Am. Acad. Dermatol. 2019, 80, 1114–1120. [Google Scholar] [CrossRef]
- Narayanamurthy, V.; Padmapriya, P.; Noorasafrin, A.; Pooja, B.; Hema, K.; Firus Khan, A.Y.; Nithyakalyani, K.; Samsuri, F. Skin Cancer Detection Using Non-Invasive Techniques. RSC Adv. 2018, 8, 28095–28130. [Google Scholar] [CrossRef]
- Pathania, Y.; Apalla, Z.; Salerni, G.; Patil, A.; Grabbe, S.; Goldust, M. Non-Invasive Diagnostic Techniques in Pigmentary Skin Disorders and Skin Cancer. J. Cosmet. Dermatol. 2022, 21, 444–450. [Google Scholar] [CrossRef]
- Aloupogianni, E.; Ishikawa, M.; Kobayashi, N.; Obi, T. Hyperspectral and Multispectral Image Processing for Gross-Level Tumor Detection in Skin Lesions: A Systematic Review. J. Biomed. Opt. 2022, 27, 060901. [Google Scholar] [CrossRef] [PubMed]
- Ortega, S.; Fabelo, H.; Iakovidis, D.K.; Koulaouzidis, A.; Callico, G.M. Use of Hyperspectral/Multispectral Imaging in Gastroenterology. Shedding Some–Different–Light into the Dark. J. Clin. Med. 2019, 8, 36. [Google Scholar] [CrossRef]
- Aggarwal, L.P., 1st; Papay, F.A. Applications of Multispectral and Hyperspectral Imaging in Dermatology. Exp. Dermatol. 2022, 31, 1128–1135. [Google Scholar] [CrossRef]
- Li, W.; Mo, W.; Zhang, X.; Squiers, J.J.; Lu, Y.; Sellke, E.W.; Fan, W.; DiMaio, J.M.; Thatcher, J.E. Outlier Detection and Removal Improves Accuracy of Machine Learning Approach to Multispectral Burn Diagnostic Imaging. J. Biomed. Opt. 2015, 20, 121305. [Google Scholar] [CrossRef] [PubMed]
- Lindholm, V.; Raita-Hakola, A.-M.; Annala, L.; Salmivuori, M.; Jeskanen, L.; Saari, H.; Koskenmies, S.; Pitkänen, S.; Pölönen, I.; Isoherranen, K.; et al. Differentiating Malignant from Benign Pigmented or Non-Pigmented Skin Tumours—A Pilot Study on 3D Hyperspectral Imaging of Complex Skin Surfaces and Convolutional Neural Networks. J. Clin. Med. 2022, 11, 1914. [Google Scholar] [CrossRef] [PubMed]
- Bozsányi, S.; Farkas, K.; Bánvölgyi, A.; Lőrincz, K.; Fésűs, L.; Anker, P.; Zakariás, S.; Jobbágy, A.; Lihacova, I.; Lihachev, A.; et al. Quantitative Multispectral Imaging Differentiates Melanoma from Seborrheic Keratosis. Diagnostics 2021, 11, 1315. [Google Scholar] [CrossRef] [PubMed]
- Hand, M.; Chien, A.; Grossman, D. Screening and Non-Invasive Evaluative Devices for Melanoma Detection A Comparison of Commercially Available Devices and Dermoscopic Evaluation. Clin. Dermatol. Ther. 2015, 2, 005. [Google Scholar] [CrossRef]
- Bashkatov, A.N.; Genina, É.A.; Kochubey, V.I.; Tuchin, V.V. Optical Properties of the Subcutaneous Adipose Tissue in the Spectral Range 400–2500 Nm. Opt. Spectrosc. 2005, 99, 836–842. [Google Scholar] [CrossRef]
- Soglia, S.; Pérez-Anker, J.; Lobos Guede, N.; Giavedoni, P.; Puig, S.; Malvehy, J. Diagnostics Using Non-Invasive Technologies in Dermatological Oncology. Cancers 2022, 14, 5886. [Google Scholar] [CrossRef]
- Meng, X.; Chen, J.; Zhang, Z.; Li, K.; Li, J.; Yu, Z.; Zhang, Y. Non-Invasive Optical Methods for Melanoma Diagnosis. Photodiagnosis Photodyn. Ther. 2021, 34, 102266. [Google Scholar] [CrossRef]
- Rajabi-Estarabadi, A.; Bittar, J.M.; Zheng, C.; Nascimento, V.; Camacho, I.; Feun, L.G.; Nasiriavanaki, M.; Kunz, M.; Nouri, K. Optical Coherence Tomography Imaging of Melanoma Skin Cancer. Lasers Med. Sci. 2019, 34, 411–420. [Google Scholar] [CrossRef]
- Turani, Z.; Fatemizadeh, E.; Blumetti, T.; Daveluy, S.; Moraes, A.F.; Chen, W.; Mehregan, D.; Andersen, P.E.; Nasiriavanaki, M. Optical Radiomic Signatures Derived from Optical Coherence Tomography Images Improve Identification of Melanoma. Cancer Res. 2019, 79, 2021–2030. [Google Scholar] [CrossRef]
- Rey-Barroso, L.; Burgos-Fernández, F.J.; Delpueyo, X.; Ares, M.; Royo, S.; Malvehy, J.; Puig, S.; Vilaseca, M. Visible and Extended Near-Infrared Multispectral Imaging for Skin Cancer Diagnosis. Sensors 2018, 18, 1441. [Google Scholar] [CrossRef]
- Koehler, M.J.; Lange-Asschenfeldt, S.; Kaatz, M. Non-Invasive Imaging Techniques in the Diagnosis of Skin Diseases. Expert Opin. Med. Diagn. 2011, 5, 425–440. [Google Scholar] [CrossRef] [PubMed]
- Rey-Barroso, L.; Burgos-Fernández, F.J.; Ares, M.; Royo, S.; Puig, S.; Malvehy, J.; Pellacani, G.; Espinar, D.; Sicilia, N.; Ricart, M.V. Morphological Study of Skin Cancer Lesions through a 3D Scanner Based on Fringe Projection and Machine Learning. Biomed. Opt. Express 2019, 10, 3404–3409. [Google Scholar] [CrossRef] [PubMed]
- Argenziano, G.; Soyer, H.P.; Chimenti, S.; Talamini, R.; Corona, R.; Sera, F.; Binder, M.; Cerroni, L.; De Rosa, G.; Ferrara, G.; et al. Dermoscopy of Pigmented Skin Lesions: Results of a Consensus Meeting via the Internet. J. Am. Acad. Dermatol. 2003, 48, 679–693. [Google Scholar] [CrossRef] [PubMed]
- Ogien, J.; Perrot, J.-L.; Daures, A.; Sourp, A.; Levecq, O.; Dubois, A. Line-Field Confocal Optical Coherence Tomography (LC-OCT) for Ex-Vivo Skin Imaging with Extended Field-of-View. In Proceedings of the Photonics in Dermatology and Plastic Surgery 2022, San Francisco, CA, USA, 3 March 2022; Volume 11934, pp. 133–140. [Google Scholar]
- Gambichler, T.; Plura, I.; Schmid-Wendtner, M.; Valavanis, K.; Kulichova, D.; Stücker, M.; Pljakic, A.; Berking, C.; Maier, T. High-Definition Optical Coherence Tomography of Melanocytic Skin Lesions. J. Biophotonics 2015, 8, 681–686. [Google Scholar] [CrossRef] [PubMed]
- Fawzy, Y.; Zeng, H. Spectral Imaging Technology—A Review on Skin and Endoscopy Applications. Recent Pat. Med. Imaging 2014, 4, 101–109. [Google Scholar] [CrossRef]
- Ilyov, S. Spectral Characteristics of Melanin-Pigmented Cutaneous Neoplasia. J. Phys. Technol. 2020, 4, 4. [Google Scholar]
- Chuah, S.; Attia, A.; Long, V.; Ho, C.; Malempati, P.; Fu, C.; Ford, S.; Lee, J.; Tan, W.; Razansky, D.; et al. Structural and Functional 3D Mapping of Skin Tumours with Non-Invasive Multispectral Optoacoustic Tomography. Ski. Res. Technol. 2017, 23, 221–226. [Google Scholar] [CrossRef]
- He, Q.; Wang, R.K. Analysis of Skin Morphological Features and Real-Time Monitoring Using Snapshot Hyperspectral Imaging. Biomed. Opt. Express 2019, 10, 5625–5638. [Google Scholar] [CrossRef]
- Ding, H.; Chen, C.; Zhao, H.; Yue, Y.; Han, C. Smartphone Based Multispectral Imager and Its Potential for Point-of-Care Testing. Analyst 2019, 144, 4380–4385. [Google Scholar] [CrossRef]
- Janssen, L.; Mylle, S.; Van Kelst, S.; De Smedt, J.; Diricx, B.; Kimpe, T.; Boone, M.; Verhaeghe, E.; Brochez, L.; Garmyn, M. Enhanced Visualization of Blood and Pigment in Multispectral Skin Dermoscopy. Ski. Res. Technol. 2020, 26, 708–712. [Google Scholar] [CrossRef]
- Winkelmann, R.R.; Yoo, J.; Tucker, N.; White, R.; Rigel, D.S. Impact of Guidance Provided by a Multispectral Digital Skin Lesion Analysis Device Following Dermoscopy on Decisions to Biopsy Atypical Melanocytic Lesions. J. Clin. Aesthet. Dermatol. 2015, 8, 21–24. [Google Scholar] [PubMed]
- Vasefi, F.; MacKinnon, N.; Farkas, D.L. Hyperspectral and Multispectral Imaging in Dermatology. In Imaging in Dermatology; Academic Press: Cambridge, MA, USA, 2016; pp. 187–201. [Google Scholar]
- MacLellan, A.N.; Price, E.L.; Publicover-Brouwer, P.; Matheson, K.; Ly, T.Y.; Pasternak, S.; Walsh, N.M.; Gallant, C.J.; Oakley, A.; Hull, P.R.; et al. The Use of Noninvasive Imaging Techniques in the Diagnosis of Melanoma: A Prospective Diagnostic Accuracy Study. J. Am. Acad. Dermatol. 2021, 85, 353–359. [Google Scholar] [CrossRef] [PubMed]
- Song, E.; Grant-Kels, J.; Swede, H.; D’Antonio, J.; Lachance, A.; Dadras, S.; Kristjansson, A.; Ferenczi, K.; Makkar, H.; Rothe, M. Paired Comparison of the Sensitivity and Specificity of Multispectral Digital Skin Lesion Analysis and Reflectance Confocal Microscopy in the Detection of Melanoma in Vivo: A Cross-Sectional Study. J. Am. Acad. Dermatol. 2016, 75, 1187–1192.e2. [Google Scholar] [CrossRef] [PubMed]
- Stamnes, J.J.; Ryzhikov, G.; Biryulina, M.; Hamre, B.; Zhao, L.; Stamnes, K. Optical Detection and Monitoring of Pigmented Skin Lesions. Biomed. Opt. Express 2017, 8, 2946–2964. [Google Scholar] [CrossRef]
- Services. Available online: https://www.deepxhealth.com/commersial (accessed on 25 July 2022).
- Van Molle, P.; De Boom, C.; Verbelen, T.; Vankeirsbilck, B.; De Vylder, J.; Diricx, B.; Simoens, P.; Dhoedt, B. Data-Efficient Sensor Upgrade Path Using Knowledge Distillation. Sensors 2021, 21, 6523. [Google Scholar] [CrossRef]
- MelaFind. Available online: https://www.ebay.com/itm/324560560610 (accessed on 15 March 2023).
- SIAscope. Available online: https://vita.ee/en/about-vitaclinika/equipment/siascope-v/ (accessed on 15 March 2023).
- DermoSight. Available online: https://www.deepxhealth.com/technology (accessed on 15 March 2023).
- Barco Demetra. Available online: https://www.inthepocket.com/work/barco-demetra (accessed on 15 March 2023).
- Ferris, L.K.; Harris, R.J. New Diagnostic Aids for Melanoma. Dermatol. Clin. 2012, 30, 535–545. [Google Scholar] [CrossRef]
- Johansen, T.H.; Møllersen, K.; Ortega, S.; Fabelo, H.; Garcia, A.; Callico, G.M.; Godtliebsen, F. Recent Advances in Hyperspectral Imaging for Melanoma Detection. Wiley Interdiscip. Rev. Comput. Stat. 2020, 12, e1465. [Google Scholar] [CrossRef]
- Emery, J.D.; Hunter, J.; Hall, P.N.; Watson, A.J.; Moncrieff, M.; Walter, F.M. Accuracy of SIAscopy for Pigmented Skin Lesions Encountered in Primary Care: Development and Validation of a New Diagnostic Algorithm. BMC Dermatol. 2010, 10, 9. [Google Scholar] [CrossRef]
- Pelagotti, A.; Ferrara, P.; Pescitelli, L.; Delfino, C.; Gerlini, G.; Piva, A.; Borgognoni, L. Multispectral Imaging for Early Diagnosis of Melanoma; SPIE: Bellingham, WA, USA, 2013; Volume 8668. [Google Scholar]
- Diebele, I.; Bekina, A.; Derjabo, A.; Kapostinsh, J.; Kuzmina, I.; Spigulis, J. Analysis of Skin Basalioma and Melanoma by Multispectral Imaging; SPIE: Bellingham, WA, USA, 2012; Volume 8427. [Google Scholar]
- Kapsokalyvas, D.; Bruscino, N.; Alfieri, D.; De Giorgi, V.; Cannarozzo, G.; Cicchi, R.; Massi, D.; Pimpinelli, N.; Pavone, F.S. Spectral Morphological Analysis of Skin Lesions with a Polarization Multispectral Dermoscope. Opt. Express 2013, 21, 4826–4840. [Google Scholar] [CrossRef]
- Delpueyo, X.; Vilaseca, M.; Royo, S.; Ares, M.; Rey-Barroso, L.; Sanabria, F.; Puig, S.; Pellacani, G.; Noguero, F.; Solomita, G.; et al. Multispectral Imaging System Based on Light-Emitting Diodes for the Detection of Melanomas and Basal Cell Carcinomas: A Pilot Study. J. Biomed. Opt. 2017, 22, 065006. [Google Scholar] [CrossRef][Green Version]
- Kim, S.; Cho, D.; Kim, J.; Kim, M.; Youn, S.; Jang, J.E.; Je, M.; Lee, D.H.; Lee, B.; Farkas, D.L.; et al. Smartphone-Based Multispectral Imaging: System Development and Potential for Mobile Skin Diagnosis. Biomed. Opt. Express 2016, 7, 5294–5307. [Google Scholar] [CrossRef]
- Freeman, K.; Dinnes, J.; Chuchu, N.; Takwoingi, Y.; Bayliss, S.E.; Matin, R.N.; Jain, A.; Walter, F.M.; Williams, H.C.; Deeks, J.J. Algorithm Based Smartphone Apps to Assess Risk of Skin Cancer in Adults: Systematic Review of Diagnostic Accuracy Studies. BMJ 2020, 368, m127. [Google Scholar] [CrossRef] [PubMed]
- Lihachev, A.; Derjabo, A.; Ferulova, I.; Lange, M.; Lihacova, I.; Spigulis, J. Autofluorescence Imaging of Basal Cell Carcinoma by Smartphone RGB Camera. J. Biomed. Opt. 2015, 20, 120502. [Google Scholar] [CrossRef] [PubMed]
- Kuzmina, I.; Lacis, M.; Spigulis, J.; Berzina, A.; Valeine, L. Study of Smartphone Suitability for Mapping of Skin Chromophores. J. Biomed. Opt. 2015, 20, 090503. [Google Scholar] [CrossRef] [PubMed]
- Spigulis, J.; Oshina, I.; Berzina, A.; Bykov, A. Smartphone Snapshot Mapping of Skin Chromophores under Triple-Wavelength Laser Illumination. J. Biomed. Opt. 2017, 22, 91508. [Google Scholar] [CrossRef]
- Lihacova, I.; Bolochko, K.; Plorina, E.V.; Lange, M.; Lihachev, A.; Bliznuks, D.; Derjabo, A. A Method for Skin Malformation Classification by Combining Multispectral and Skin Autofluorescence Imaging; SPIE: Bellingham, WA, USA, 2018; Volume 10685. [Google Scholar]
- Lange, M.; Plorina, E.V.; Lihacova, I.; Derjabo, A.; Spigulis, J. Skin Cancer Screening—Better Safe than Sorry. SHS Web Conf. 2020, 85, 02003. [Google Scholar] [CrossRef]
- Lihacova, I.; Bondarenko, A.; Chizhov, Y.; Uteshev, D.; Bliznuks, D.; Kiss, N.; Lihachev, A. Multi-Class CNN for Classification of Multispectral and Autofluorescence Skin Lesion Clinical Images. J. Clin. Med. 2022, 11, 2833. [Google Scholar] [CrossRef] [PubMed]
- Osipovs, P.; Bliznuks, D.; Lihachev, A. Cloud Infrastructure for Skin Cancer Scalable Detection System; SPIE: Bellingham, WA, USA, 2018; Volume 10679, p. 1067905. [Google Scholar] [CrossRef]
- Rey-Barroso, L.; Burgos-Fernández, F.; Royo, S.; Puig, S.; Malvehy, J.; Pellacani, G.; Delpueyo, X.; Peña, S.; Díaz-Doutón, F.; Vilaseca, M. Polarized Multispectral Imaging for the Diagnosis of Skin Cancer. Color Imaging Conf. 2019, 2019, 381–385. [Google Scholar] [CrossRef]
- Spreinat, A.; Selvaggio, G.; Erpenbeck, L.; Kruss, S. Multispectral near Infrared Absorption Imaging for Histology of Skin Cancer. J. Biophotonics 2020, 13, e201960080. [Google Scholar] [CrossRef]
- Setiadi, I.C.; Nasution, A.M.T. Design and Characterization of a LED-Based Multispectral Imaging System Applied to Dermatology. In Proceedings of the International Conference on Signals and Systems (ICSigSys), Bali, Indonesia, 1–3 May 2018; pp. 229–235. [Google Scholar]
- Van Tien, T.; Phuc, N.H.; Nhien, L.Q.; Trang, T.T.T.; Hieu, D.S.; Cat, P.N.K.; Mien, P.T.H.; Linh, H.Q. Evaluation of Scaly Levels in Psoriasis Using Multispectral Polarized Imaging; Springer: Singapore, 2018; Volume 63, pp. 97–101. [Google Scholar]


| Imaging Technique | Illumination Source, Wavelengths | Sensor | Resolution, Field of View | Depth Penetration | Accuracy, Sensitivity, Specificity | 2D, 3D | Commercial Systems |
|---|---|---|---|---|---|---|---|
| Dermoscopy [5,6,17] | LED, Tungsten Halogen Lamp, 400–700 nm (polarized/unpolarized white light) | CCD, CMOS, InGaAS | 10× magnification | 0.1–0.3 mm | Acc: 76.1% Se: 79–93% Sp: 69–89% | 2D | Dermlite (3 Gen), Delta 20 T (Heine) etc. (large variety of devices available) |
| CLSM [1,3,4,5,17] | Laser diode, 830 nm | CCD | T: 0.5–1 µm L: 0.2–1.5 µm A: 3–4 µm V: 1–2 µm FOV: 8 mm2 from 0.5 mm2 spliced frames. | 0.2–0.3 mm | Se: 92% Sp: 70% | 2D 3D | VivaScope 1500 VivaScope 3000 |
| OCT [17,18,19] | Laser diode, 1300 nm | InGaAs | T: 3–15 µm L: 3–7.5 µm A: 3–5 µm FOV: 6 mm2 | 1.5–2 mm | Se: 74.1% Sp: 92.4% | 2D 3D | VivoSight Skintell SkinDex 300 |
| MSI [1,3,20] | LED, 400–2500 nm | CCD, CMOS, InGaAs | L: 70 µm FOV: 12–24 mm2 | 2.5 mm | Se: 78.6% Sp: 84.6% | 2D | MelaFind SIAscope |
| MPT [5,6,17,21] | Femtosecond laser, 750–850 nm | CCD | T: 1 µm L: 0.5 µm A: 1.5 µm FOV: 0.35 × 0.35 mm2 | 0.2 mm | Se: 71–95% Sp: 69–97% | 2D 3D | DermaInspect |
| 3D Topography Fringe projection [3,22] | He-Ne Laser, 633 nm | CCD | L: 15 µm V: 2 µm 19 × 14 mm2 | - | Se: 80% Sp: 76.7% | 2D 3D | PRIMOS DermaTOP |
| Imaging | Advantages | Limitations | Improvements |
|---|---|---|---|
| Dermoscopy [5,6,16,17] | Standard technique used by all dermatologists. The dermoscope is easy to use and it does not extend the observation time. Accuracy of distinction between melanoma and benign lesions is improved by 50% when dermoscopy is used versus the standalone clinical evaluation. Digital dermoscopy can be performed and images of the whole body can be acquired in just 30 min. Digital images can be used to follow up the nevi over time or to observe the new skin lesion occurrences. | An accurate diagnosis is dependent on the experience of the professional. Can visualize only superficial layers of skin, up to epidermal–dermal junction. No transversal information is provided, and the depth of the excision cannot be planned. Whole-body screening involves a high quantity of data to be analyzed. Poor resolution. | Super-high magnification dermoscopy. Integrated classification using artificial intelligence. Using different or multiple sources of light. Portable/miniaturized systems to be attached to a smartphone. |
| CLSM [1,3,4,5,16,17] | Good correlation with transversal histological images. Assessment of pre-surgical skin tumor margins. Real time evaluation can be performed. Provide cellular details for a skin lesion. Monitoring the effectiveness of noninvasive treatments. | Limited depth penetration of skin tissue. High cost of equipment. Extensive training. False-negative readings when diagnostic features are below papillary dermis, and for inflamed lesion or nevi with high degree of dysplasia. Large amount of storage space required. Difficult to assess lesion densely pigmented. | Reducing the time of capturing the images. Building of systems that combine it with techniques such as OCT and dermoscopy. Fusion with artificial intelligence. |
| OCT [16,17,18,19] | Good correlation with axial histological sectioning. Refined diagnosis for BCC superficial or infiltrative. Microscopic vascular changes can be detected. High scanning speed. Refine surgical excision borders. | Limited resolution. Low specificity for early detection melanoma. Cost is high. | Improving optical resolution and contrast. Establishing diagnostic criteria. Fusion with artificial intelligence |
| MSI [1,3,16,20] | Good performances for benign versus malign skin lesion classification. High sensitivity. Fully automatic devices can be created. MSI devices can be used as prebiopsy tools. | Resolution is lower. Low specificity. | Miniaturizing MSI systems. Improving specificity. Extensive clinical validation. |
| MPT [5,6,16,17,21] | Deeper biological tissue can be viewed in a 3D image. Useful for differentiation between aging effects and pathological conditions. Subcellular resolution. Deep penetration depth. | Cell damage can occur due to three-photon excitation. High cost. Long acquisition time. Easily affected by movement artifacts. | Using in combination with other techniques, such as OCT, to improve rapid intraoperative assessment. |
| 3D Topography Fringe projection [3,22] | Skin relief can be retrieved in 3D format. Can be used together with automated classification techniques to distinguish between benign and malignant lesions. Obtains morphological parameters of skin. Skin roughness evaluation. | Image artifacts can be generated easily by the motion of the patient during the imaging procedure. | Using in combination with other techniques, such as dermoscopy or MSI, to refine the diagnosis. Fusion with artificial intelligence. |
| Device, Year of Release, Producer | Advantages | Limitations |
|---|---|---|
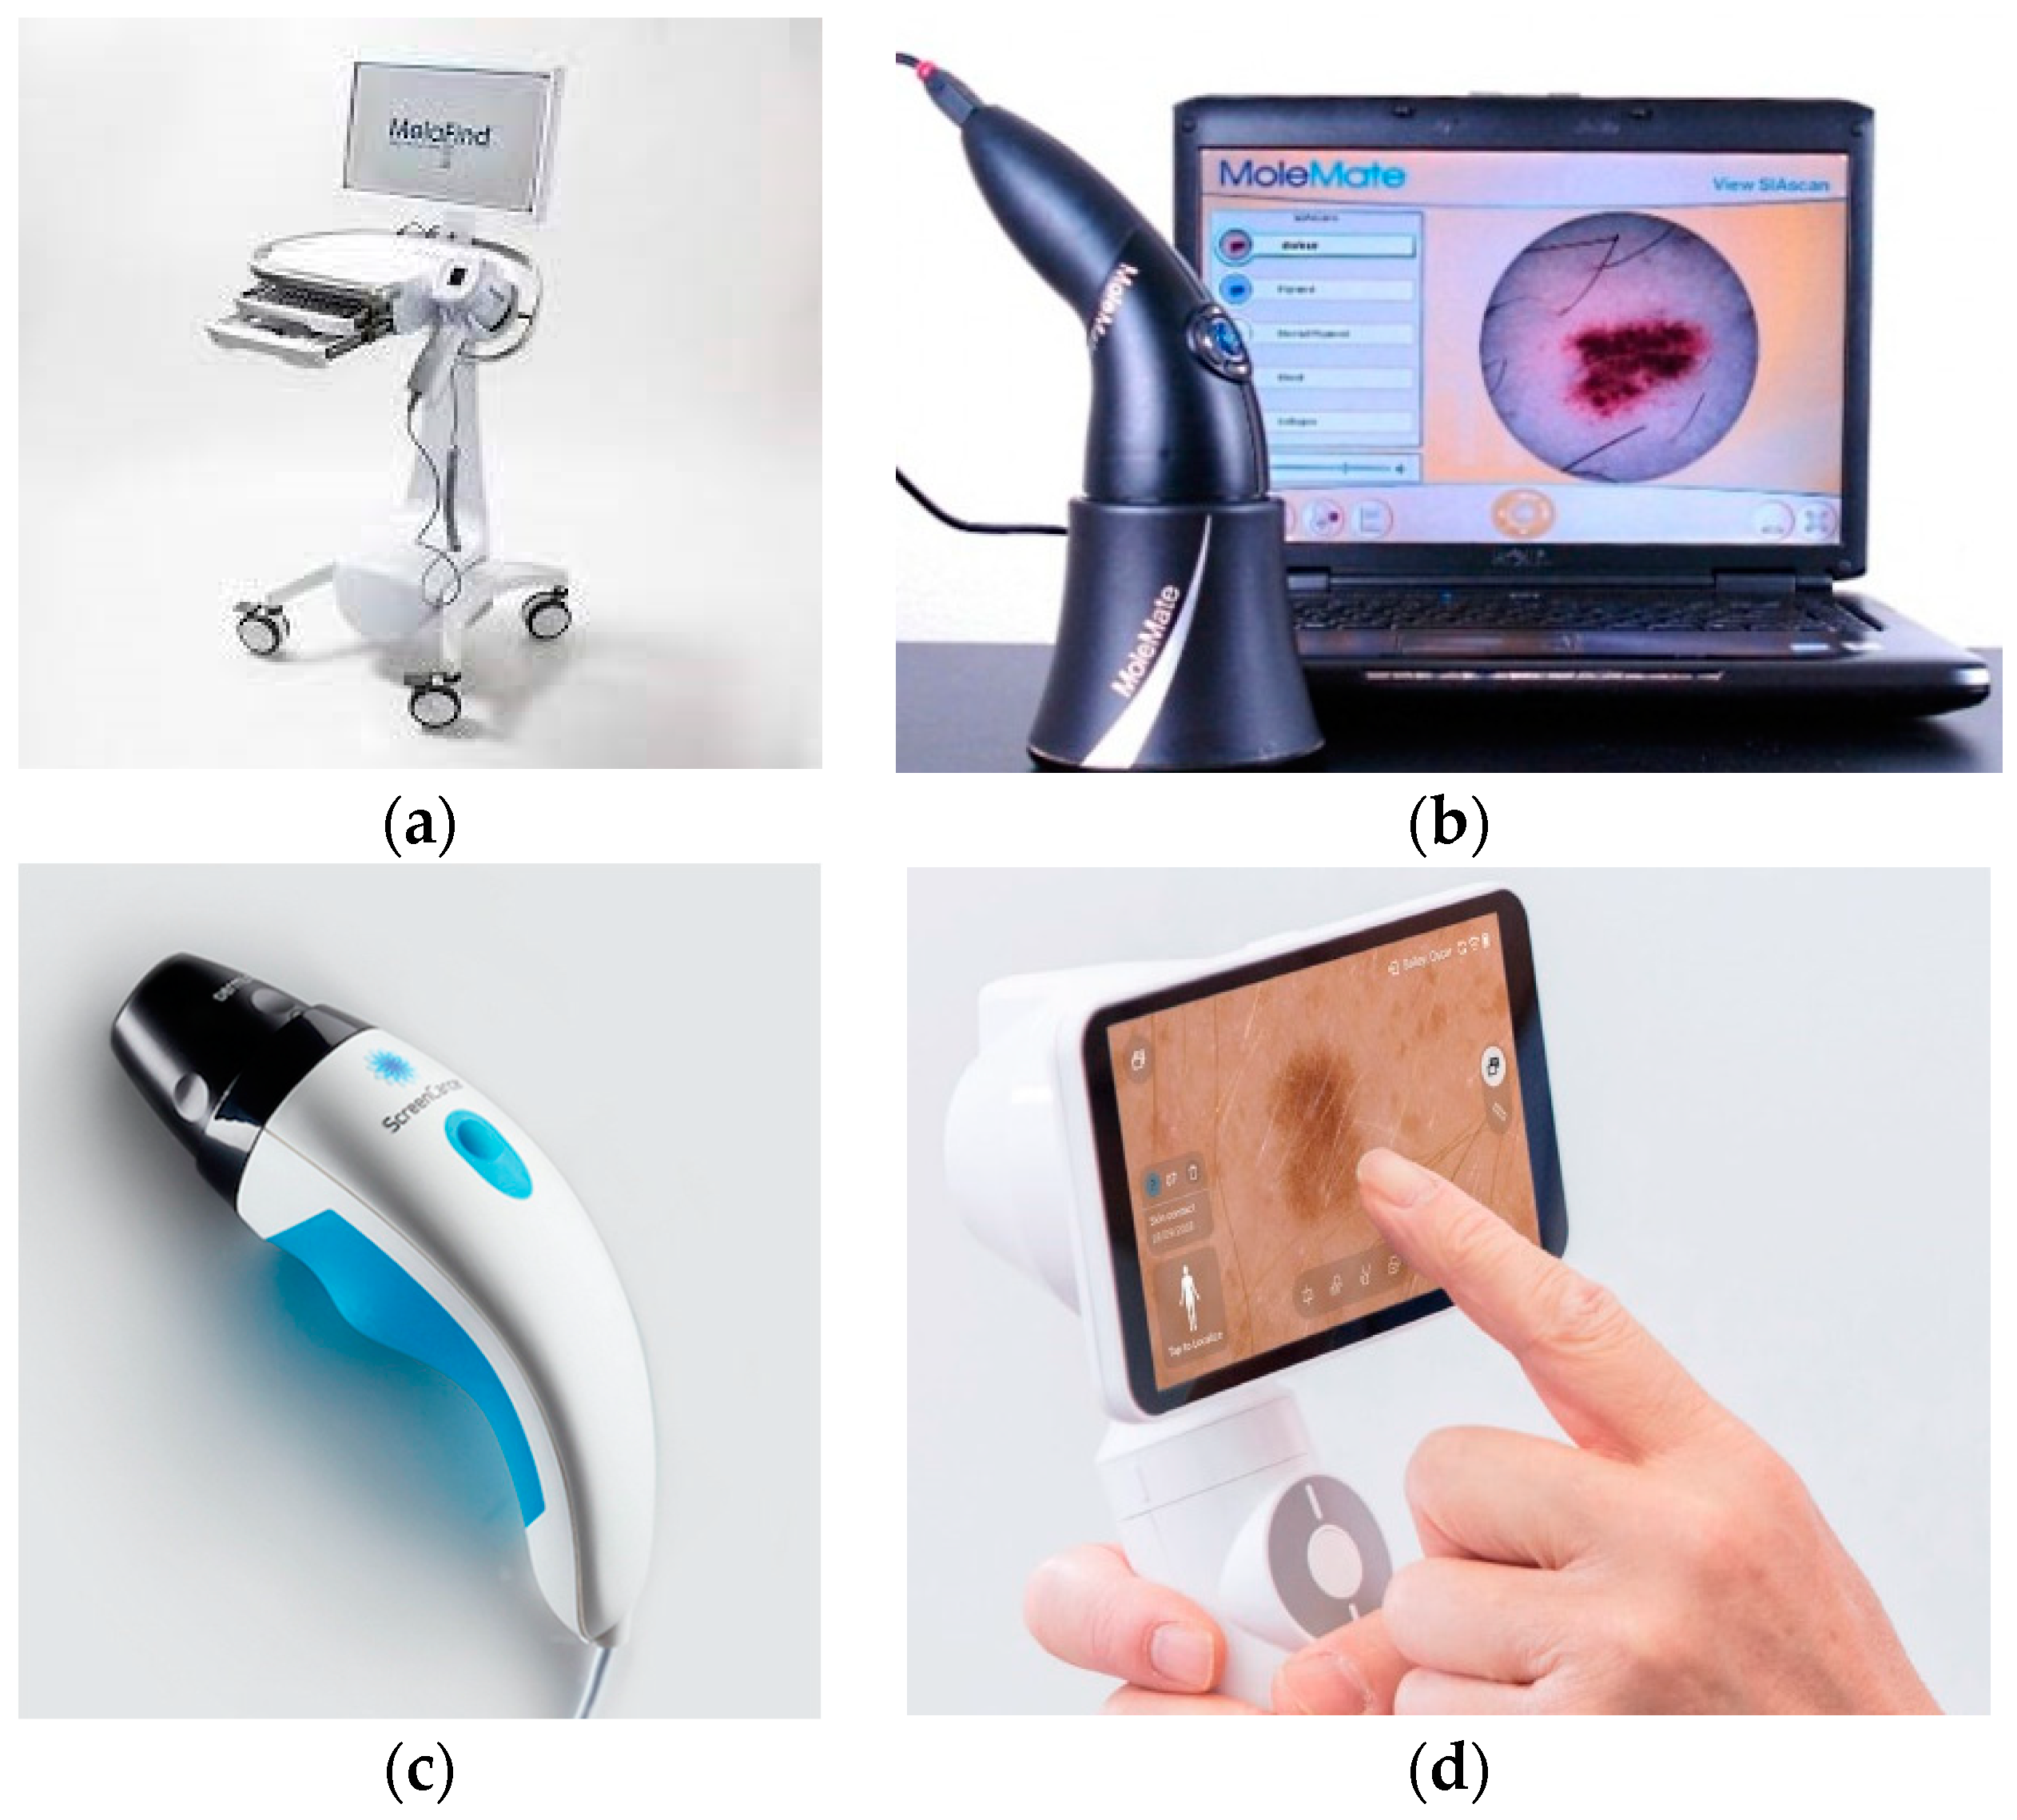
| MelaFind, 2010, MELA Sciences, Inc., Irvington, NY, USA [1,14,34,43,44] | Enable evaluation of level of malignity for a skin lesion. 10 spectral images used as input for a linear classification algorithm. Reduced false-negative results in discrimination between malignant and non-malignant lesions. | “Black-box” setting—The output is binary: low or high level of malignity. High false-positive results. Hight cost. Not a screening device. |
| MoleMate (SIAscope), 2002, Astron Clinica, Cambrige, UK [1,14,43,45] | Melanoma risk is evaluated. Mapping chromophores of skin from 8 spectral images. MoleMate algorithm is used to retrieve statistical parameters that are further use for automated classification. | “Black-box” setting—The output is binary: low or high level of melanoma. Low specificity. High cost. Not superior to dermoscopy. |
| DermoSight, 2017, Balter Medical AS (Balter), Bergen, Norway [36] | Discrimination between melanoma and benign tissue. Classification using a clustering method. Melanin depth estimation. Great potential for cancer detection in dermatology. | Skin cancer evaluation algorithm is not published. Further testing is still required. |
| Demetra, 2019, Barco, Kortrijk, Belgium [31,38] | Multispectral dermoscope. Easy to use. Facilitate mapping of the main chromophores of skin (melanin, hemoglobin). Vascular pattern is retrieved. Cloud-platform for patients’ data. | Automated classification between malignant and non-malignant lesions is under development. |
| Device, Year of Release, Producer | Illumination Source, WaveLengths | Sensor | Other Hardware Components | Output | Field of view, Maximum Depth Penetration | Sensitivity, Specificity | Scan Time | Price | Data Set Range |
|---|---|---|---|---|---|---|---|---|---|
| MelaFind, 2010, MELA Sciences, Inc., Irvington, NY, USA [1,14,34,43,44] | LED, 430–950 nm | CMOS | Filters for 10 spectral bands, Monitor, Computer | 10 multispectral images corresponding to spectral bands selected by filters | 2.5 × 2.0 cm2, 2.5 mm | 70–100%, 9.8–82.5% | <3 s | 7500 $ | MM, BN |
| MoleMate (SIAscope), 2002, Astron Clinica, Cambrige, UK [1,14,43,45] | LED, 400–1000 nm | CCD | Filters, Polarizers | 8 multispectral images | 1.2 × 2.4 cm2, 2 mm | 81–100%, 59–91% | 3 s | 8000 $ | MM, BN, SK, H |
| DermoSight, 2017, Balter Medical AS (Balter), Bergen, Norway [36] | LED, 365–1000 nm | 3 IEEE 1394 FireWire Cameras | 2 corrections Lentils, 5 mirrors, sapphire glass | 30 multispectral images | 2.2 cm diameter, – | 97–99%, 97–93% | <10 s | – | MM, BCC, SCC, SK, BN |
| Demetra, 2019, Barco, Kortrijk, Belgium [31,38] | LED, 400–800 nm | CCD | Touchscreen Wi-Fi | 3 parameter maps: Pigment map, Blood map, Scatter contrast map, a high-quality dermoscopic image | 1 cm2, 2 mm | – | 8 s | 1416 $ + monthly subscription | MM, BCC, SCC, BN, D, VL |
| Prototype Authors, Year | Illumination Source, Wavelengths | Sensor | Other Hardware Components | Output | Field of View | Se, Sp | Scan Time | Price | Dataset Range |
|---|---|---|---|---|---|---|---|---|---|
| Diebele et al., 2012 [47] | Ring of halogen lamps, 450–950 nm | Nuance Ex MSI camera | Diffuser, Polarizer film, Objective lens | Spectral images acquired for 540, 650 and 950 nm | - | 94%, 89% | 1–2 min | - | 81 (22 MM, 59 BN) |
| Kapsokalyvas et al., 2013 [48] | Ring of 12 LEDs, 470, 530, 625 nm | CMOS camera | Achromatic doublet f = 30 mm, Ring shaped polarizing plate, O-ring and a glass window, Analyzer | Five images for each illumination setting and analyzer vs. polarizer positions | 8 × 6.4 mm2 | - | - | - | 2 (1 BCC, 1 BN) |
| Pelagotti et al., 2013 [46] | Halogen lamp | CCD Camera | Interferential filters spaced at 50 nm from 350 to 1100 nm | Multispectral images | 6 cm2 | - | - | - | 40 (10 MM, 2 BCC, 28 BN) |
| Kim et al., 2016 [50] | LED smartphone, 440–690 nm | SP camera | Plano-concave lens, Mirror, Magnifying lens, Two linear polarizers, Nine bandpass filters, motorized filters wheel | 10 multispectral images | 2018.96 × 4 mm2 | - | 6.5 s | <40 $ | - |
| Delpueyo et al., 2017 [49] | Ring of 32 LEDs, 414, 447, 477, 524, 671, 735, 890, 995 nm | CCD Camera | Lens with focus at 4 cm, Two rotating polarizers | 8 reflectance and 8 absorbance spectral images | 15 × 20 mm2 | 91.3%, 54.5% | 40 s | - | 429 (290 BN, 95 MM, 44 BCC) |
| Spigulis et al., 2017 [54] | Flat ring laser diffuser of three pairs of compact laser modules, 448, 532, 659 nm | SP camera, (Google Nexus) | Shielding cylinder, Collector of laser beams, Ring-shaped flat diffuser, Film polarizers for camera | Three spectral images | 126 mm2 | - | - | - | 9 (3 BN, 3 SK, 3 H) |
| Lihacova et al., 2018 [13,55,56,57] | Ring of 16 LEDs, 405, 526, 663, and 964 nm | IDS 5Mix camera | 2 polarizers, 35 mm lens, 515 nm long pass filter | Parameter maps from the spectral images | 20 × 20 mm2 | 75%, 100% | 30 s | - | 22 (12 MM, 10 DN) |
| Setiadi et al., 2018 [61] | Ring of 52 LEDs, 380,405, 470, 505,565, 605,660,690, 760,850, 880, 970 nm | CCD camera | C-Mount objective lens, LED driver, Controller Arduino Uno | 12 multispectral images | 13.3 × 10 mm2 or 7 × 5.25 mm2 | - | <6 s | - | - |
| Van Tien et al., 2018 [62] | LEDs, 430, 530 nm White light | CMOS camera | Stabilized power source, Two polarizers, 10×—Magnification lens | 3 spectral images based on scaly levels are evaluated | - | - | - | - | Psoriasis |
| Rey-Barroso et al., 2018 [20] | Ring of 24 LEDs, 995, 1081, 1214, 1340, 1464, 1613 nm | InGaAs camera | Short-wave infrared lens (high transmission from 800–2000 nm), Diffuser | 6 spectral images in the exNIR spectrum | 15 × 20 mm2 | 78.6%, 84.6% | - | - | 53 (39 BN, 14 MM) |
| Rey-Barroso et al., 2019 [3,59] | Ring of 32 LEDs, 414, 447, 477, 524, 671, 735, 890, 995 nm | CCD camera | Lens with spectral sensitivity from 400 to 1000 nm, Two polarizers 400–700 nm (for LEDs and lens) | 5 spectral images from 414–671 nm for each 0°, 45°, 90° polarization configurations | 15 × 20 mm2 | - | - | - | 40 (20 BN, 20 MM) |
| Spreinat et al., 2020 [60] | Xenon lamp, 900–1500 nm (20 nm steps) | NIR InGaAs camera | Monochromator, Convex lens f = 150 mm, 20× Objective, Liquid light guide, Collimating adapter, Inverted microscope | 2D variance images from the 3D data cube a | - | - | 2.5 s | - | 3 (1 MM, 1 SCC, 1 BCC) |
| Uthoff et al., 2020 [2] | Printed circuit board of 24 LEDs, 450, 470, 500, 530, 580, 660, 810, 940 nm | SP camera (LG G5) IR filter Removed | f = 24 mm achromatic doublet for 0.817 magnification, 3D-printed imaging guide, Orthogonal linear polarizer, Bluetooth-connected microcontroller, Android application | 9 multispectral images | 9.96 × 11.67 mm2 | - | <20 s | * 40 $ | - |
| Prototype Authors, Year | Advantages | Limitations |
|---|---|---|
| Diebele et al., 2012 [47] | Good preliminary results for differentiation between benign versus malignant nevi. Inception for further research. | Only a limited quantity of data collected were used to build the parameter for classification. Small data set for testing. |
| Kapsokalyvas et al., 2013 [48] | Low-cost equipment. Introduced more information about a skin lesion than dermoscopy. Facilitate observation of pathological skin morphologies using three maps for melanin, hemoglobin, and single scattering. | Preliminary study. |
| Pelagotti et al., 2013 [46] | Proved that melanoma lesions are still visible at 950 nm. Great potential to estimate the depth of the lesion. | Preliminary study. |
| Kim et al., 2016 [50] | Modular system that can be attached to a smartphone. Android application for image acquisition and data transfer. Spectral angles classification using spectral signatures of every pixel from the region of interest of lesion. Machine learning models are used and lead to improved specificity and sensitivity. Self-monitoring approach. | No results on malignant versus benign lesions differentiation. Needs extensive clinical trials. |
| Delpueyo et al., 2017 [49] | Greater performances than commercially available products for malignant versus benign lesion classification. Found that textural parameters had improved detection of melanoma and basal cell carcinoma. | Lower sensitivity than MelaFind and confocal microscopy. |
| Spigulis et al., 2017 [54] | Proved that chromophore mapping is possible using a smartphone. Good correlation with initial diagnosis. | Very small data set used for testing. Laser source for illumination that can cause cellular damage. |
| Lihacova et al., 2018 [13,55,56,57] | Cromophore mapping is combined with autofluorescence for each lesion. A new parameter map is computed to discriminate between malignant and non-malignant diseases. Device used to create a collection of multimodal images of multiple skin disseas that can be input for automamted classification models. | Further research is needed for automated classification of multimodal images of skin lesions. |
| Setiadi et al., 2018 [61] | Proved that 2D quality maps of chromophore concentration can be created using a LED based MSI system. Suitable for dermatological examination as adjuvant tool. | Further calibration is still required. |
| Van Tien et al., 2018 [62] | Proved that psoriasis lesions can be monitored with a polarized MSI device. | Preliminary study. Only psoriasis lesions were evaluated. |
| Rey-Barroso et al., 2018 [20] | Radiation from VIS to NIR. The NIR light is used for illumination so deeper layers of skin can be accessed. Machine learning approach for classification between meanoma and benign nevi. Greater specificity than previous studies. | Only lesion smaller than 20 mm could be imaged. |
| Rey-Barroso et al., 2019 [3,59] | Polarized light from VIS to NIR spectrum is used to analys melanoma and benign nevi. Proved that at 671 nm melanoma lesions have more contrast than benign nevi. Statistical differences were pointed out for images captured at short wavelengths of malingnat and non-malignant lessions. | Preliminary study. |
| Spreinat et al., 2020 [60] | NIR light is used for histological examination of MM, BCC, and SCC lesions. | Based on changes in brightness only separation between healthy and pathological tissue can be performed. Ex-vivo procedure. |
| Prototype Authors, Year | Spectral Range | Approach |
|---|---|---|
| Diebele et al., 2012 [47] | 450–950 nm | Passive MSI system used to capture 51 images per skin lesion, but only the 540, 650, and 950 nm images were used to create a parameter to distinguish between melanoma and benign nevi lesions. |
| Kapsokalyvas et al., 2013 [48] | 470, 530, 625 nm | Active MSI system that generates as output the melanin, blood, and contrast maps corresponding to a skin lesion. |
| Pelagotti et al., 2013 [46] | 450–1050 nm | Passive MSI system used to create 7 spectral images per skin lesion where dermoscopic features were analyzed. |
| Kim et al., 2016 [50] | 440–960 nm | Passive MSI modular system to be attached to a smartphone used to collect 10 spectral images of a skin lesion. The spectral signature for each lesion was compute by classification with spectral angles measure. |
| Delpueyo et al., 2017 [49] | 414–995 nm | Active MSI system used to acquire 8 spectral images of from which the reflectance and absorbance maps were extracted for a skin lesion. 15 parameters were computed for a skin lesion analyzed and a classification algorithm was applied to discriminate between melanoma, basal cell carcinoma, and benign nevi lesions. |
| Spigulis et al., 2017 [54] | 448, 532, 659 nm | Active MSI system with laser source of illumination used to capture 3 images for each spectral band for a skin lesion. The concentrations maps of the chromophores melanin, oxyhemoglobin, and deoxyhemoglobin were extracted using Beer’s law approach |
| Lihacova et al., 2018 [13,55,56,57] | 405, 526, 663, 964 nm | Active MSI system used to obtain autofluorescence image (405 nm) and the other three intensity images for each wavelength of illumination for a skin lesion. Classification of lesions was performed using custom parameters for different skin pathology discrimination (melanoma versus dysplastic nevi, melanoma versus seborrheic keratosis). |
| Setiadi et al., 2018 [61] | 380–970 nm | Active MSI system used to collect 12 spectral images per skin lesion. Analysis of quality of the collected images was performed in order to establish the efficiency of computing the chromophore mapping. |
| Van Tien et al., 2018 [62] | 430, 530 nm, white light | Active MSI system used to obtain three images to evaluate the scaly levels of a skin region. |
| Rey-Barroso et al., 2018 [20] | 995–1613 nm | Active MSI system used to collect 6 spectral images per skin lesion. Statistical parameters were computed for each image and their threshold values were selected for the parameters using PCA algorithm to discriminate between melanoma and benign nevi lesions. Final classification was performed using a SVM approach. |
| Rey-Barroso et al., 2019 [3,59] | 414–995 nm | Active MSI polarized system used to acquire 5 spectral images (corresponding to 3 configurations of polarization) per skin lesion. First order statistical descriptors were computed for each polarization parameter extracted from collected images. Using the values computed, it was performed the classification between melanoma and benign nevi lesions. |
| Spreinat et al., 2020 [60] | 900–1500 nm | Active MSI system to collect a set of images per each ex vivo histological samples of melanoma, basal cell carcinoma, and squamous-cell carcinoma lesions. Variance of each set of images was performed to examine the change in brightness between healthy and pathological tissue for each type of lesion. |
Disclaimer/Publisher’s Note: The statements, opinions and data contained in all publications are solely those of the individual author(s) and contributor(s) and not of MDPI and/or the editor(s). MDPI and/or the editor(s) disclaim responsibility for any injury to people or property resulting from any ideas, methods, instructions or products referred to in the content. |
© 2023 by the authors. Licensee MDPI, Basel, Switzerland. This article is an open access article distributed under the terms and conditions of the Creative Commons Attribution (CC BY) license (https://creativecommons.org/licenses/by/4.0/).
Share and Cite
Ilișanu, M.-A.; Moldoveanu, F.; Moldoveanu, A. Multispectral Imaging for Skin Diseases Assessment—State of the Art and Perspectives. Sensors 2023, 23, 3888. https://doi.org/10.3390/s23083888
Ilișanu M-A, Moldoveanu F, Moldoveanu A. Multispectral Imaging for Skin Diseases Assessment—State of the Art and Perspectives. Sensors. 2023; 23(8):3888. https://doi.org/10.3390/s23083888
Chicago/Turabian StyleIlișanu, Mihaela-Andreea, Florica Moldoveanu, and Alin Moldoveanu. 2023. "Multispectral Imaging for Skin Diseases Assessment—State of the Art and Perspectives" Sensors 23, no. 8: 3888. https://doi.org/10.3390/s23083888
APA StyleIlișanu, M.-A., Moldoveanu, F., & Moldoveanu, A. (2023). Multispectral Imaging for Skin Diseases Assessment—State of the Art and Perspectives. Sensors, 23(8), 3888. https://doi.org/10.3390/s23083888