Author Contributions
Conceptualization, Y.N.C.-Á., A.M.Á.-M. and G.C.-D.; methodology, Y.N.C.-Á., D.A.C.-P. and G.C.-D.; software, Y.N.C.-Á. and A.M.Á.-M.; validation, Y.N.C.-Á., A.M.Á.-M. and D.A.C.-P.; formal analysis, A.M.Á.-M., G.A.C.-D. and G.C.-D.; investigation, Y.N.C.-Á., D.A.C.-P., A.M.Á.-M. and G.A.C.-D.; data curation, Y.N.C.-Á.; writing original draft preparation, Y.N.C.-Á., G.C.-D.; writing—review and editing, A.M.Á.-M., G.A.C.-D. and G.C.-D.; visualization, Y.N.C.-Á.; supervision, A.M.Á.-M. and G.C.-D. All authors have read and agreed to the published version of the manuscript.
Figure 1.
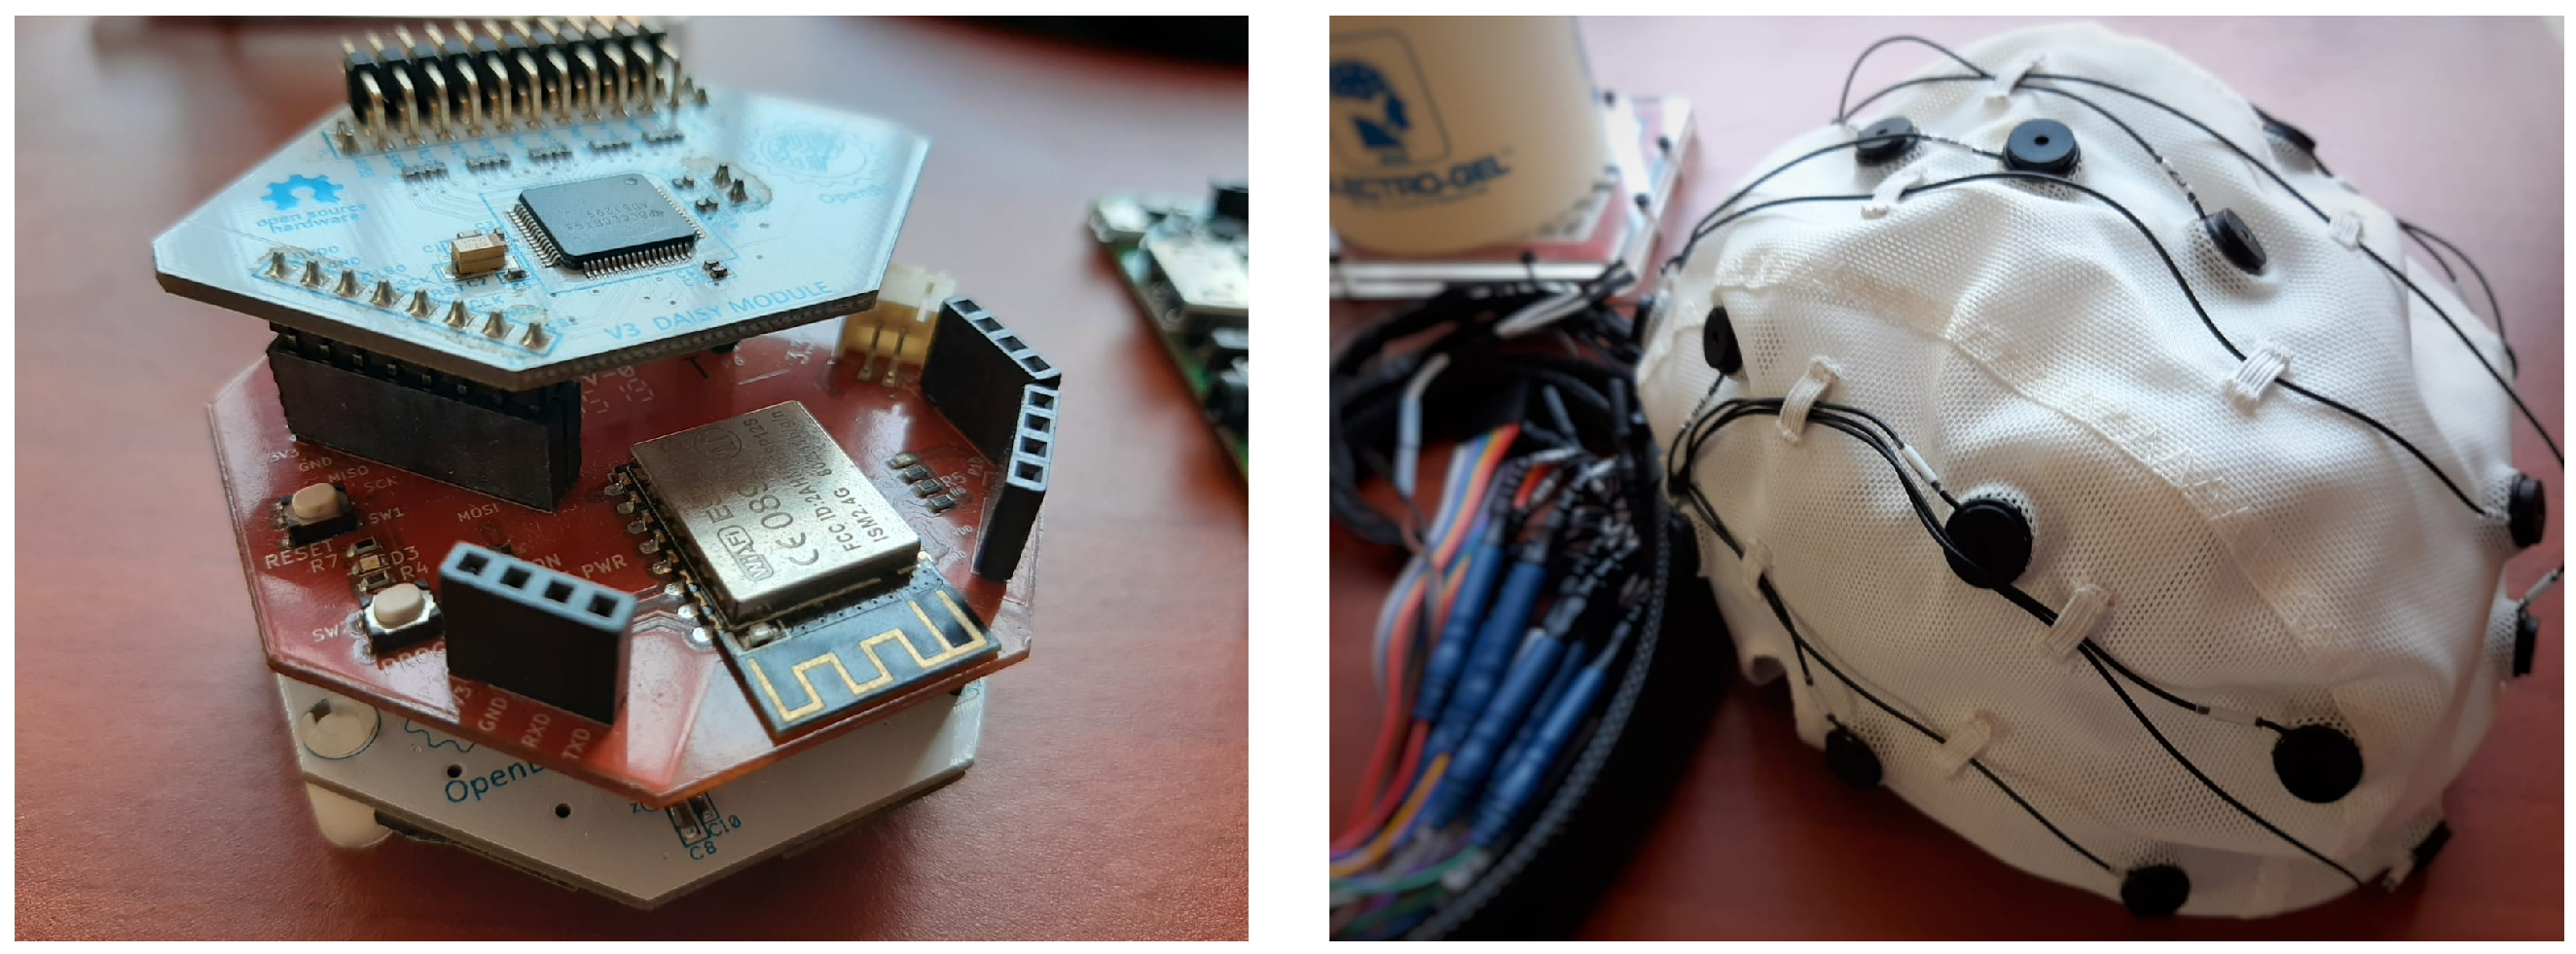
The OpenBCI system is equipped with a Daisy extension board and a WiFi shield for up to 16 channel support and 8 k SPS. It also includes an EEG cap with conductive gel for improved conductivity.
Figure 1.
The OpenBCI system is equipped with a Daisy extension board and a WiFi shield for up to 16 channel support and 8 k SPS. It also includes an EEG cap with conductive gel for improved conductivity.
Figure 2.
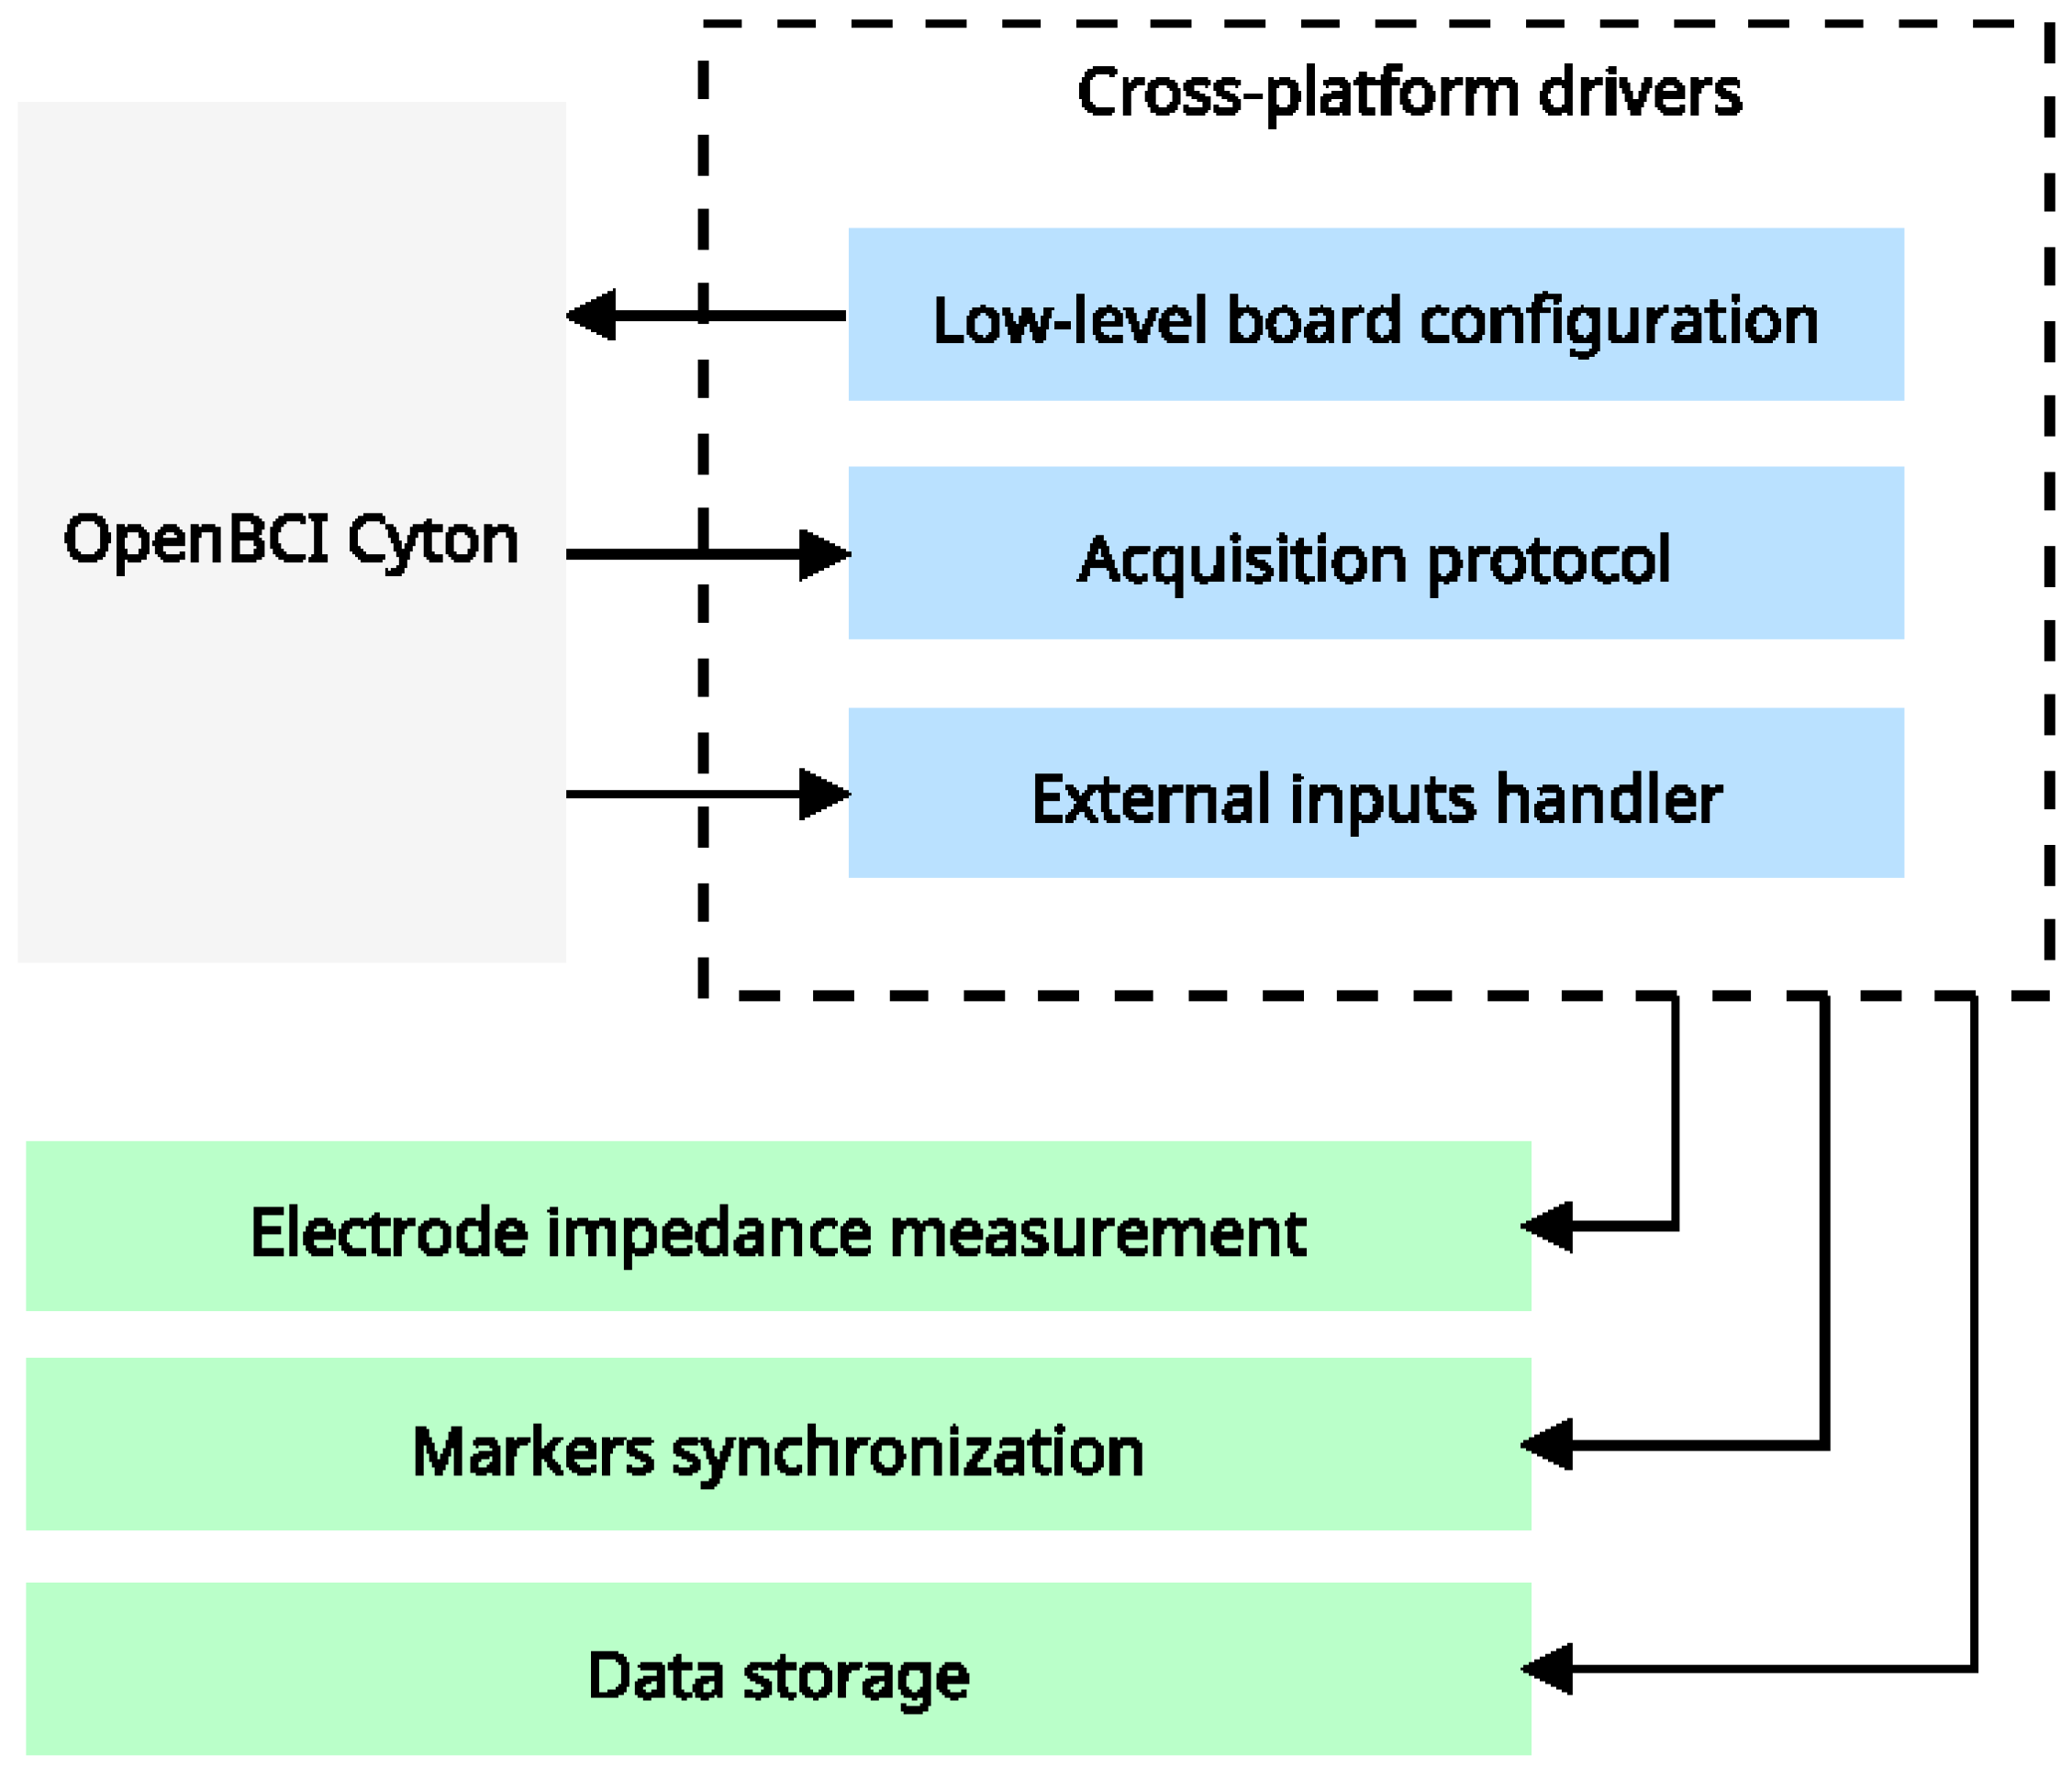
High-level acquisition drivers. Our architecture connects hardware features with the OpenBCI SDK to access all configuration modes, resulting in a cross-platform driver with low-level features (represented by blue boxes). External systems will utilize these features to deploy high-level, context-specific features.
Figure 3.
Proposed OpenBCI Cyton-based data block deserialization. Data deserialization must guarantee a data context to avoid overflow in subsequent conversion. The first block of columns, from 2 to 26, contains the EEG data, and the remaining ones, e.g., 26 to 32, gather the auxiliary data.
Figure 3.
Proposed OpenBCI Cyton-based data block deserialization. Data deserialization must guarantee a data context to avoid overflow in subsequent conversion. The first block of columns, from 2 to 26, contains the EEG data, and the remaining ones, e.g., 26 to 32, gather the auxiliary data.
Figure 4.
Composition of the data block throughout the distributed data acquisition and processing system,. A complete latency measurement must consider all systems where data is propagated. An accurate measure requires feedback and comparisons.
Figure 4.
Composition of the data block throughout the distributed data acquisition and processing system,. A complete latency measurement must consider all systems where data is propagated. An accurate measure requires feedback and comparisons.
Figure 5.
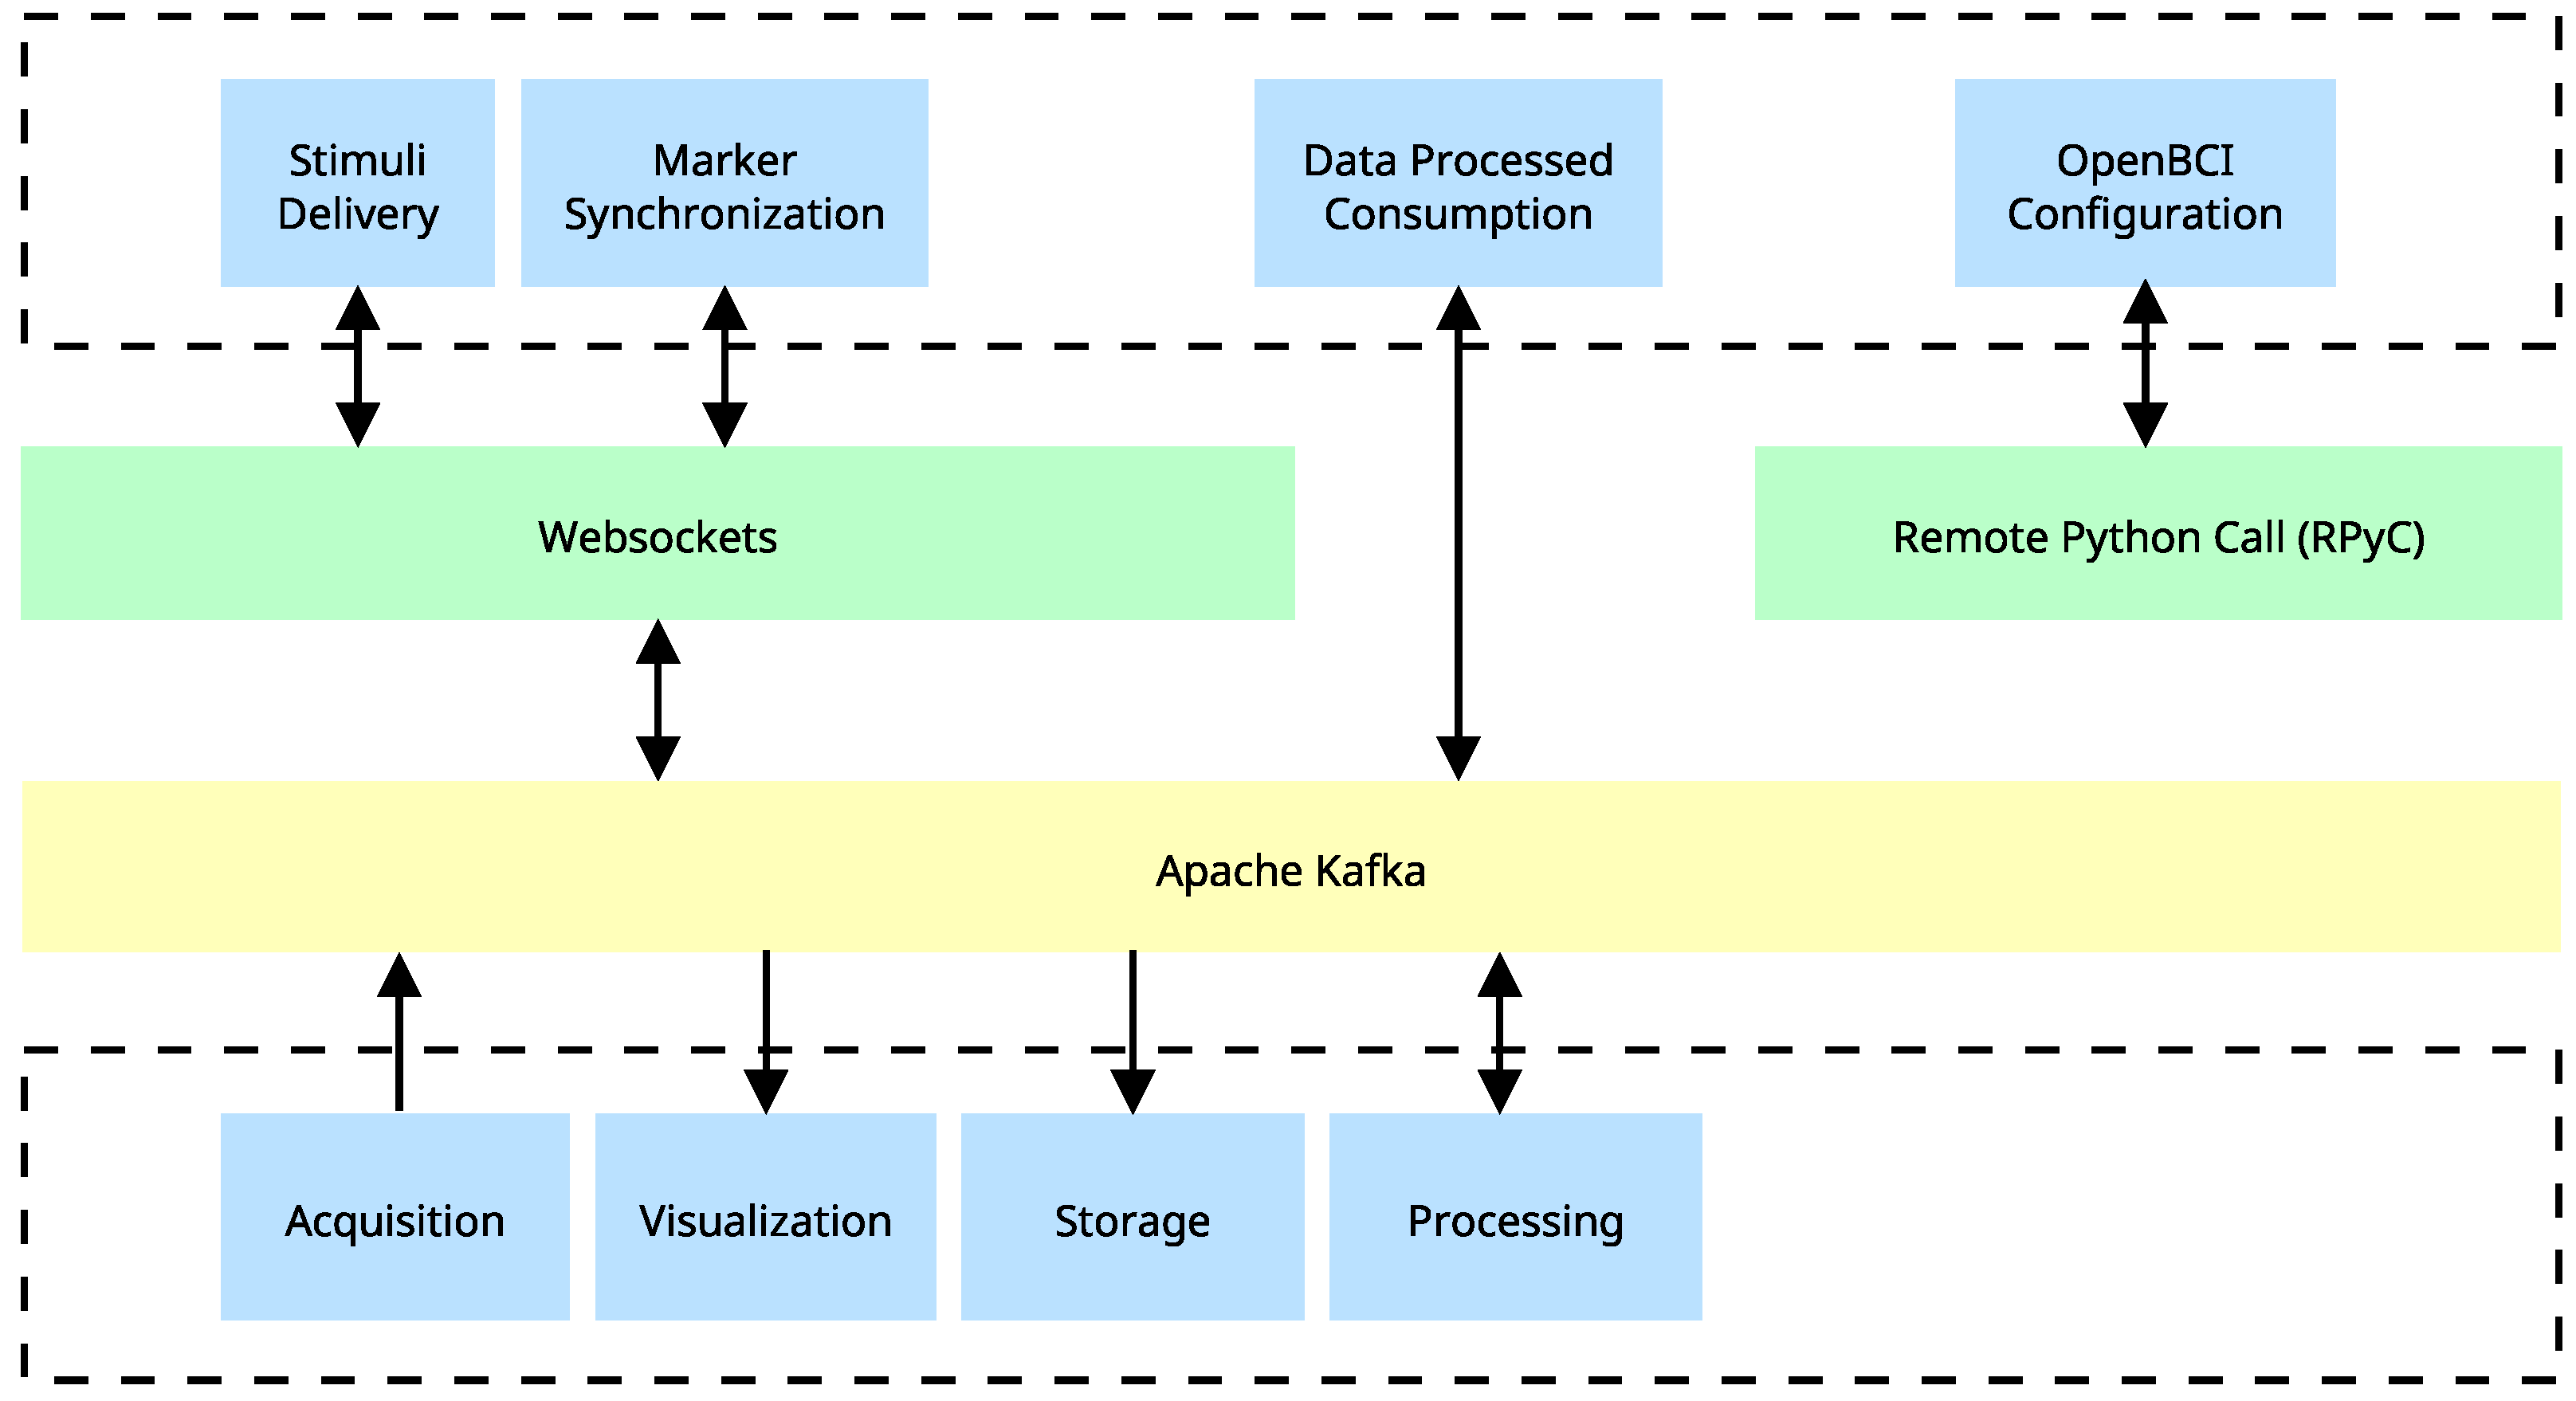
Distributed system implementation using Apache Kafka. Generation and consumption of real-time data are depicted, as well as the intermediation of a system that utilizes Websockets for additional tasks. Blue blocks depict tasks that can be executed independently across different processes or computing devices. The implementation of Apache Kafka serves as a mediator between various components and enables a seamless and efficient flow of information. Green blocks represent client-server communication protocols that are distinct from Apache Kafka.
Figure 6.
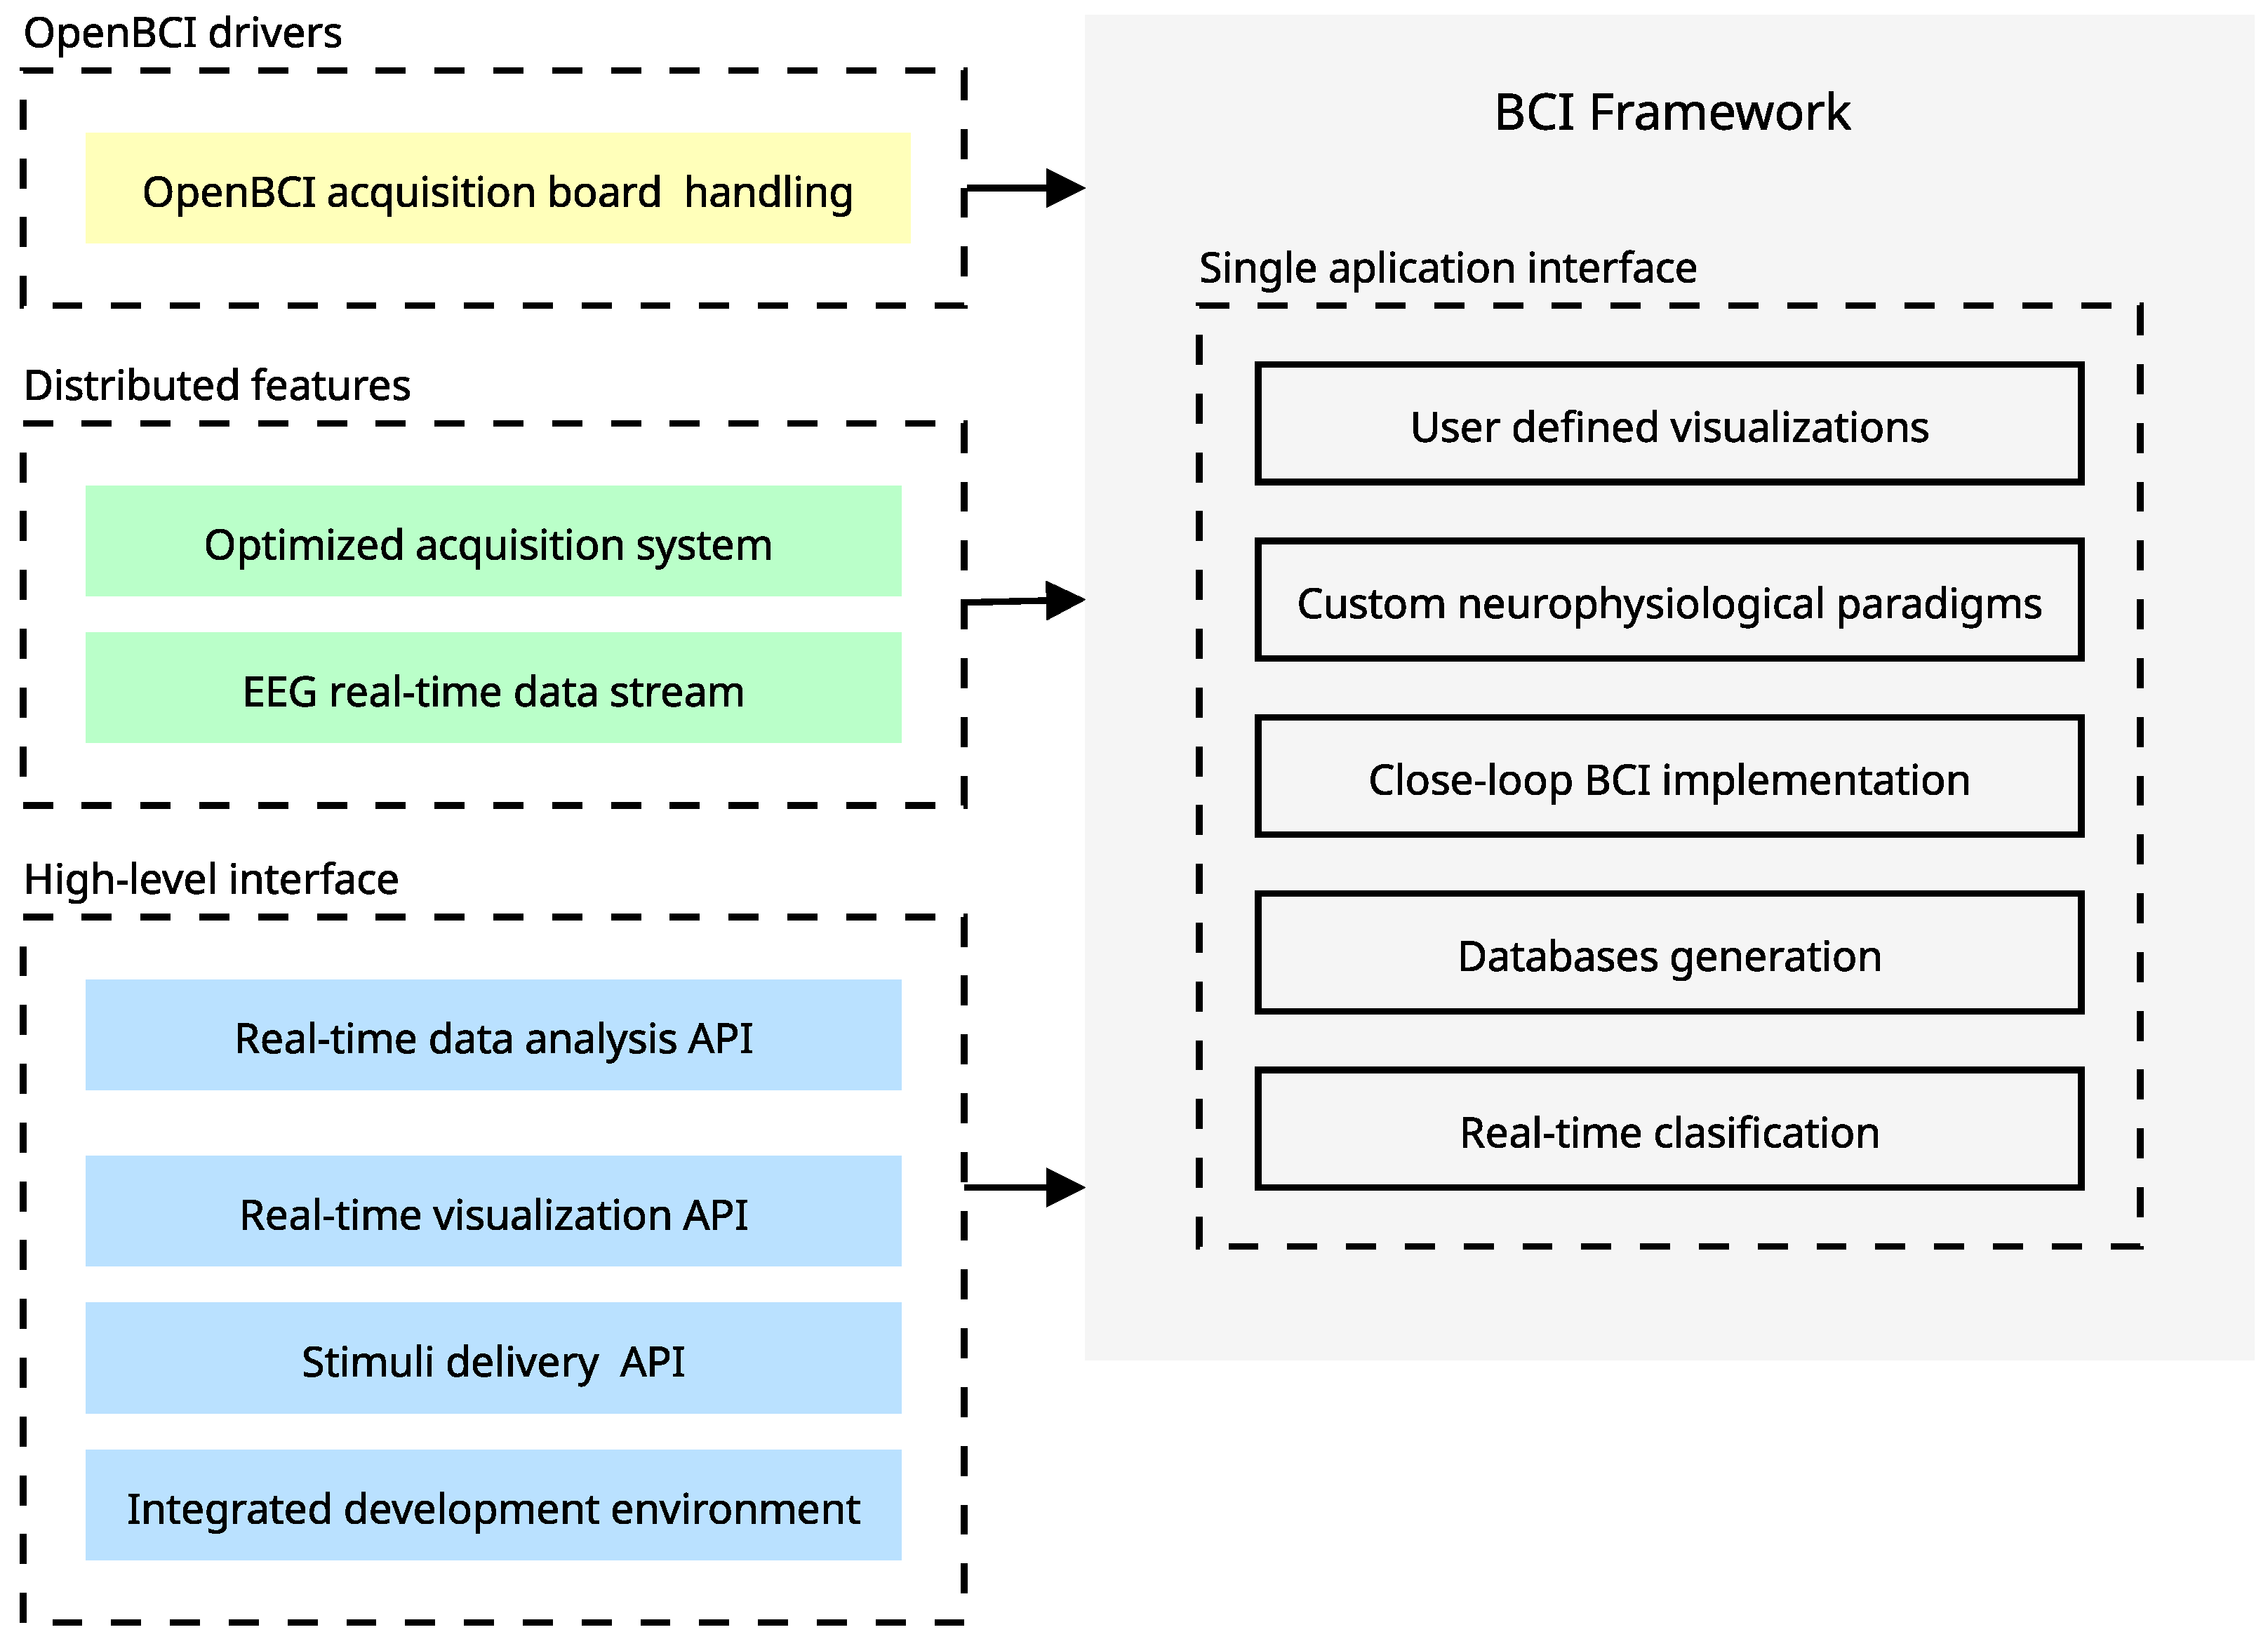
Proposed BCI tool based on OpenBCI (hardware/software) and EEG records. Our approach implements an end-to-end application. Beyond that, the synergy between this characteristic allows the achievement of advanced features that merge the data acquisition with the stimuli delivery in a flexible development environment. The yellow issue is related to the development of custom drivers for OpenBCI, the green ones refer to the integrations over distributed systems, and the blue issue refers to the high-level implementations of utilities served through the main interface.
Figure 7.
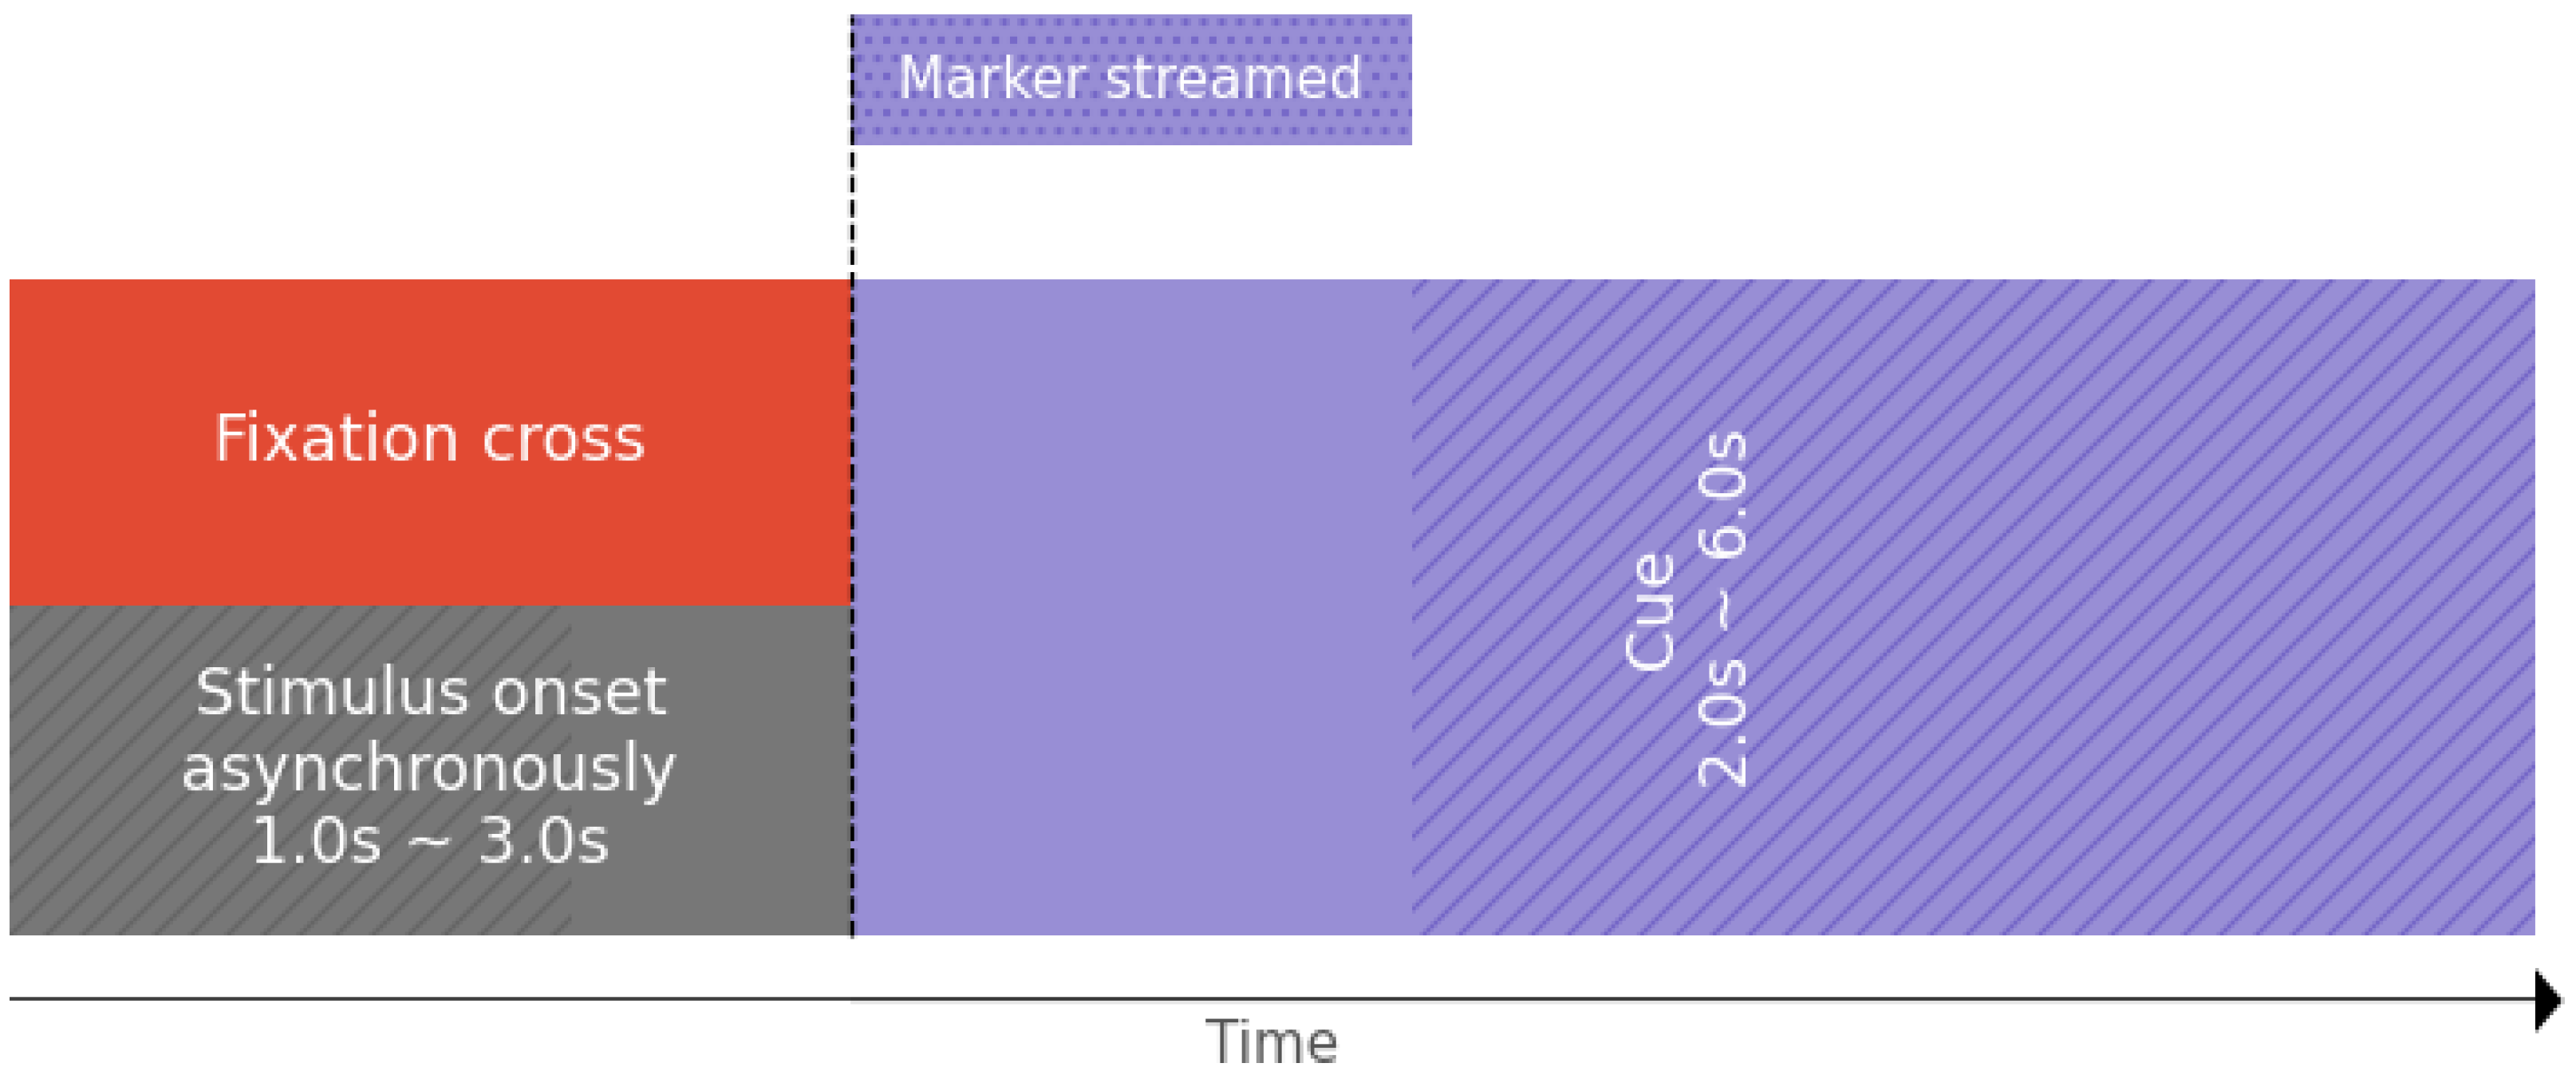
Tested Motor Imagery paradigm holding markers indicators for our OpenBCI-based framework.
Figure 7.
Tested Motor Imagery paradigm holding markers indicators for our OpenBCI-based framework.
Figure 8.
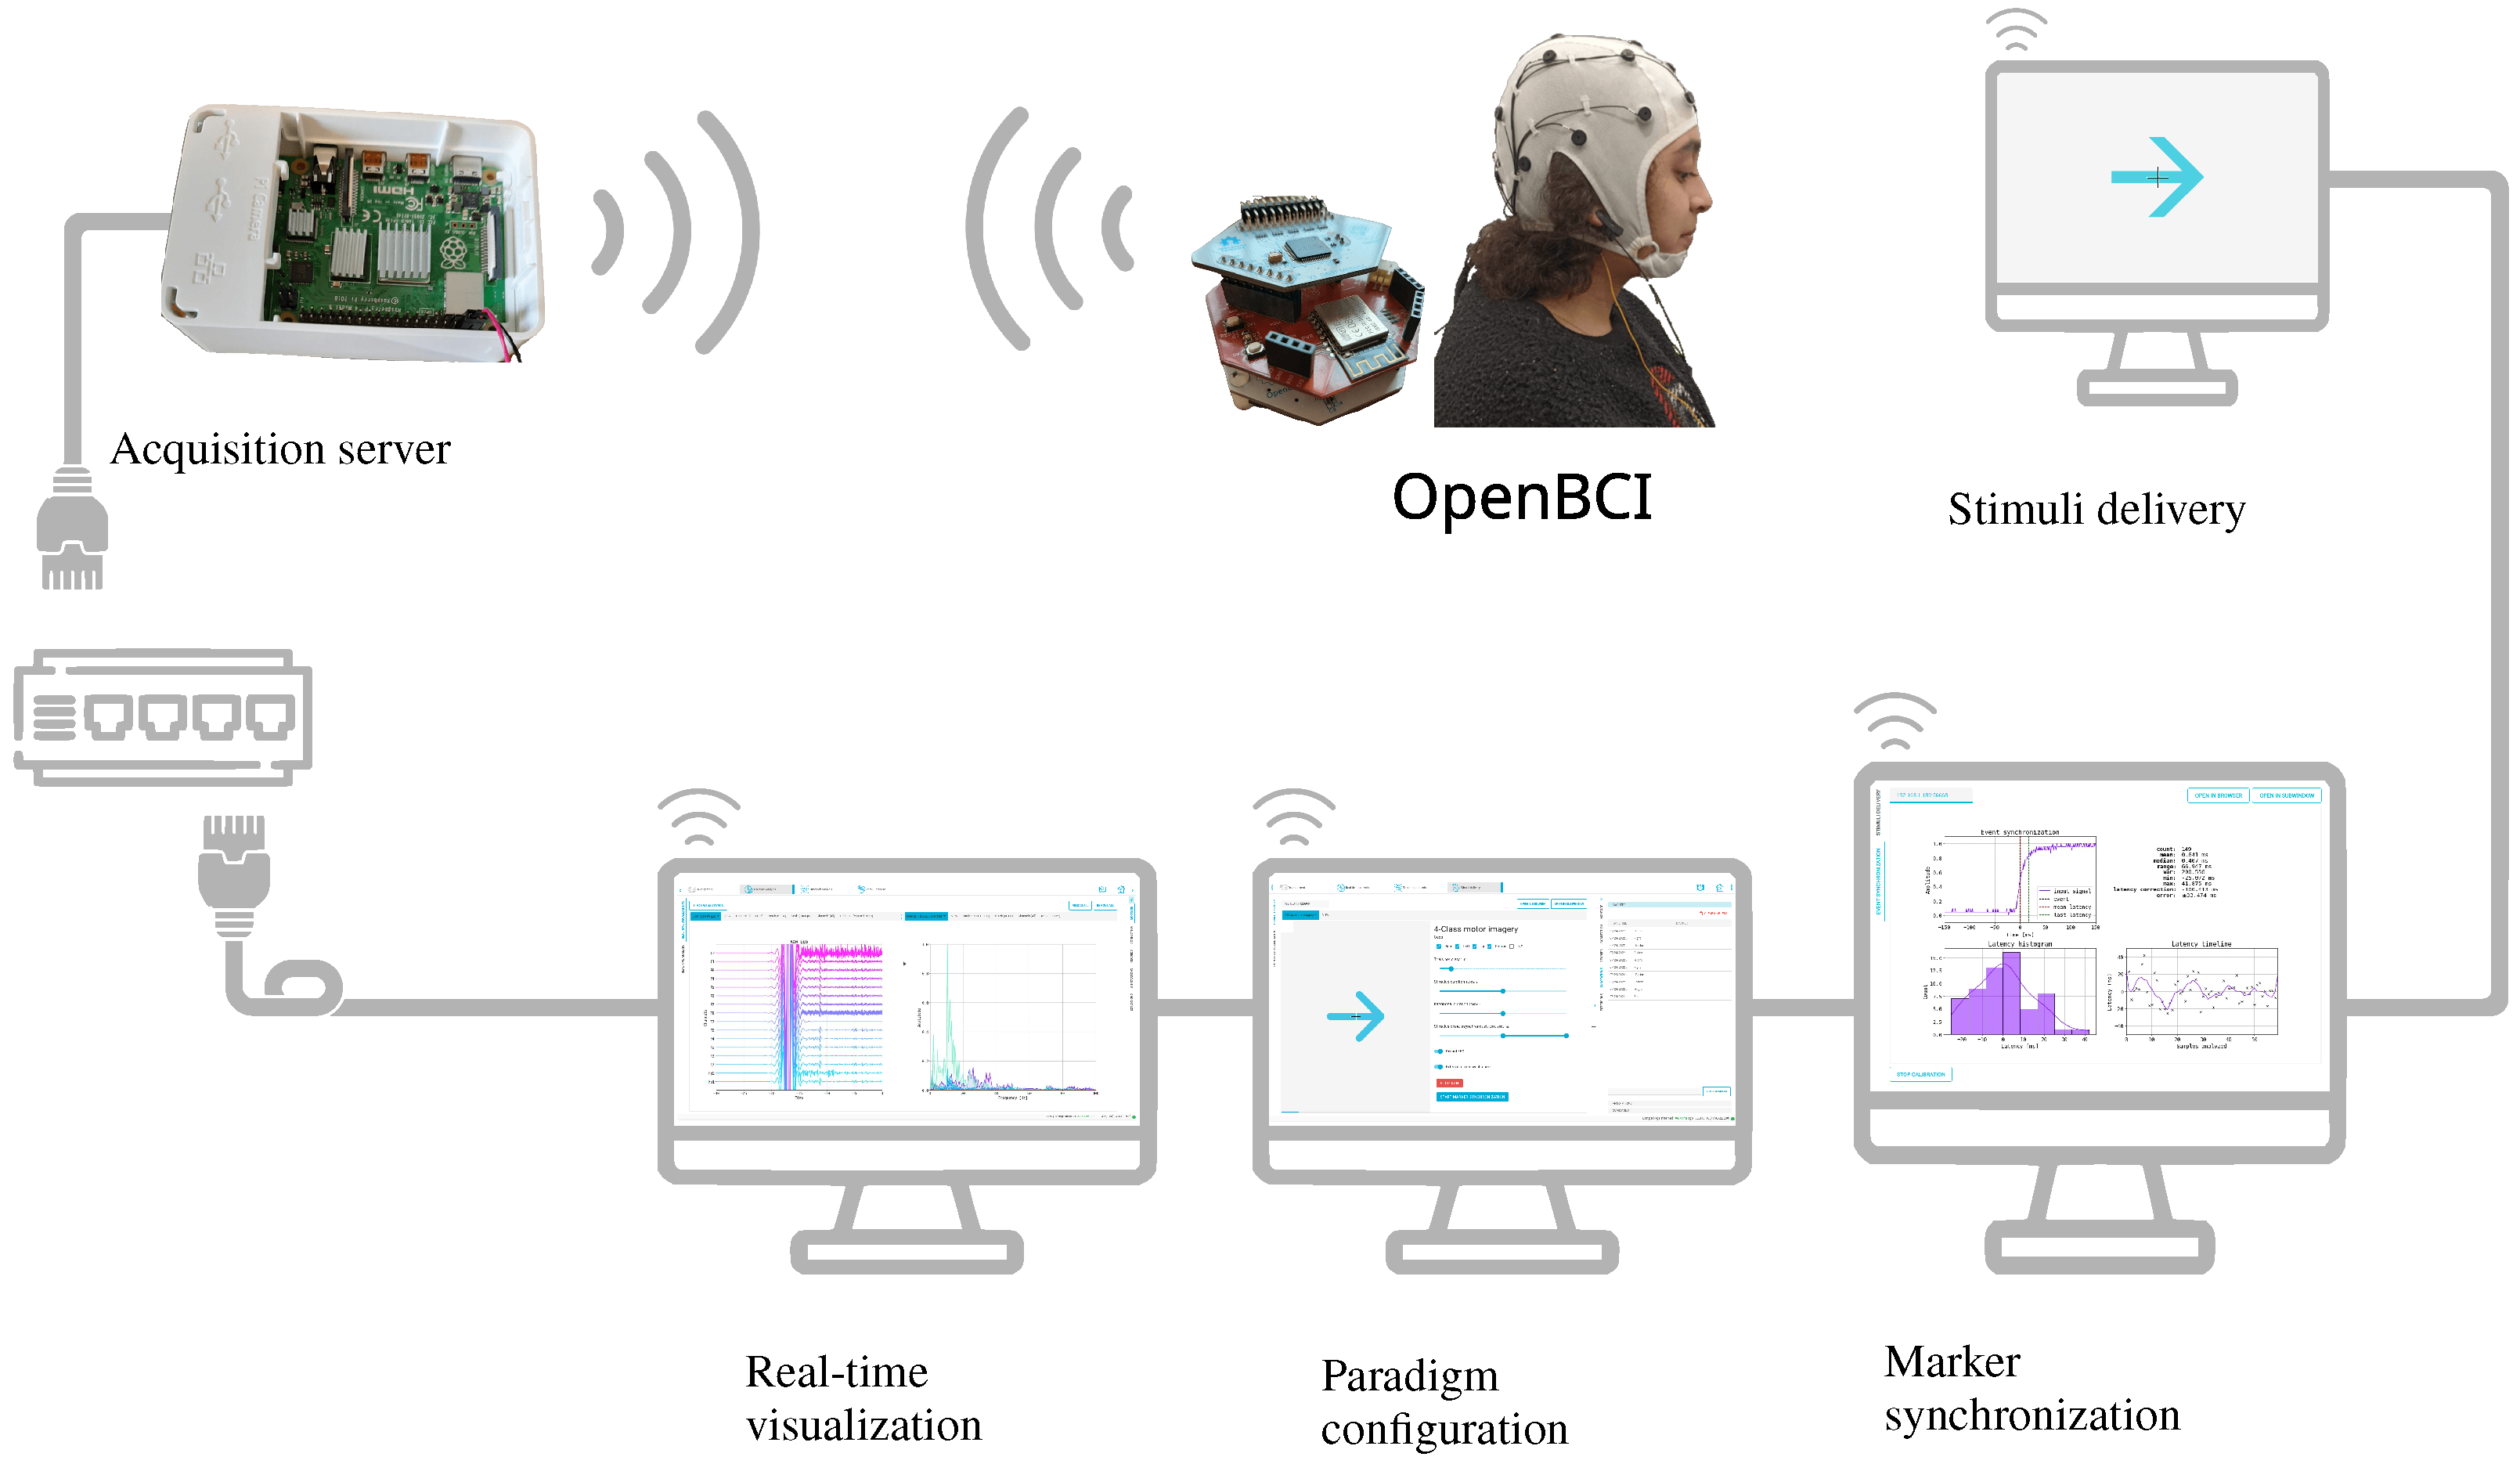
Implemented Motor Imagery experiment. Provided experimental setup utilizes a dedicated wireless channel for data acquisition and a wired connection for the distributed systems, enclosing real-time visualization, marker synchronization, paradigm configuration, and stimuli delivery.
Figure 8.
Implemented Motor Imagery experiment. Provided experimental setup utilizes a dedicated wireless channel for data acquisition and a wired connection for the distributed systems, enclosing real-time visualization, marker synchronization, paradigm configuration, and stimuli delivery.
Figure 9.
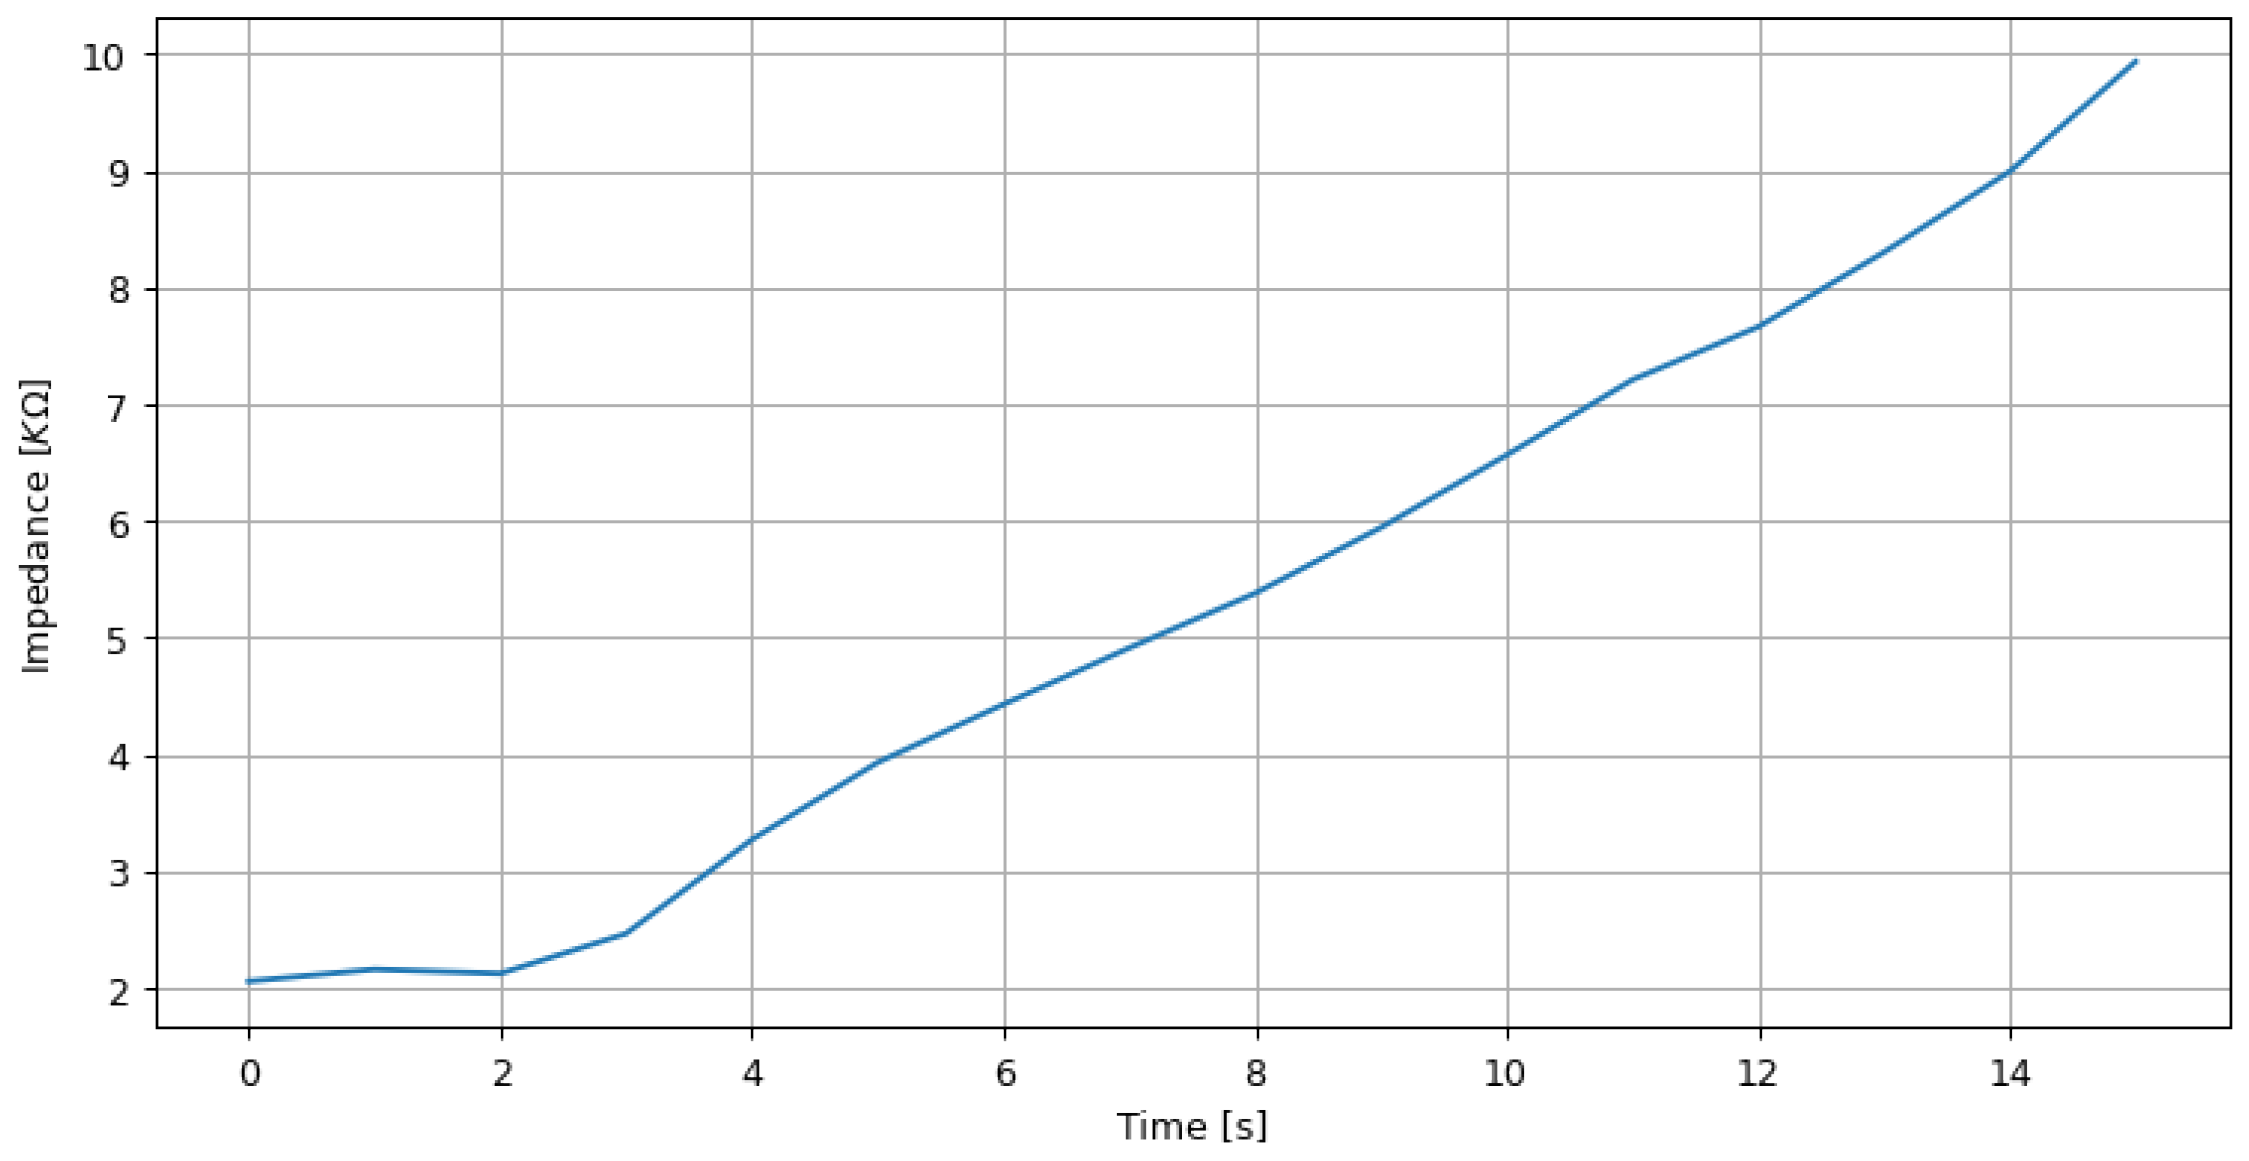
Real-time impedance measurement results by varying a 10 KOhm potentiometer.
Figure 9.
Real-time impedance measurement results by varying a 10 KOhm potentiometer.
Figure 10.
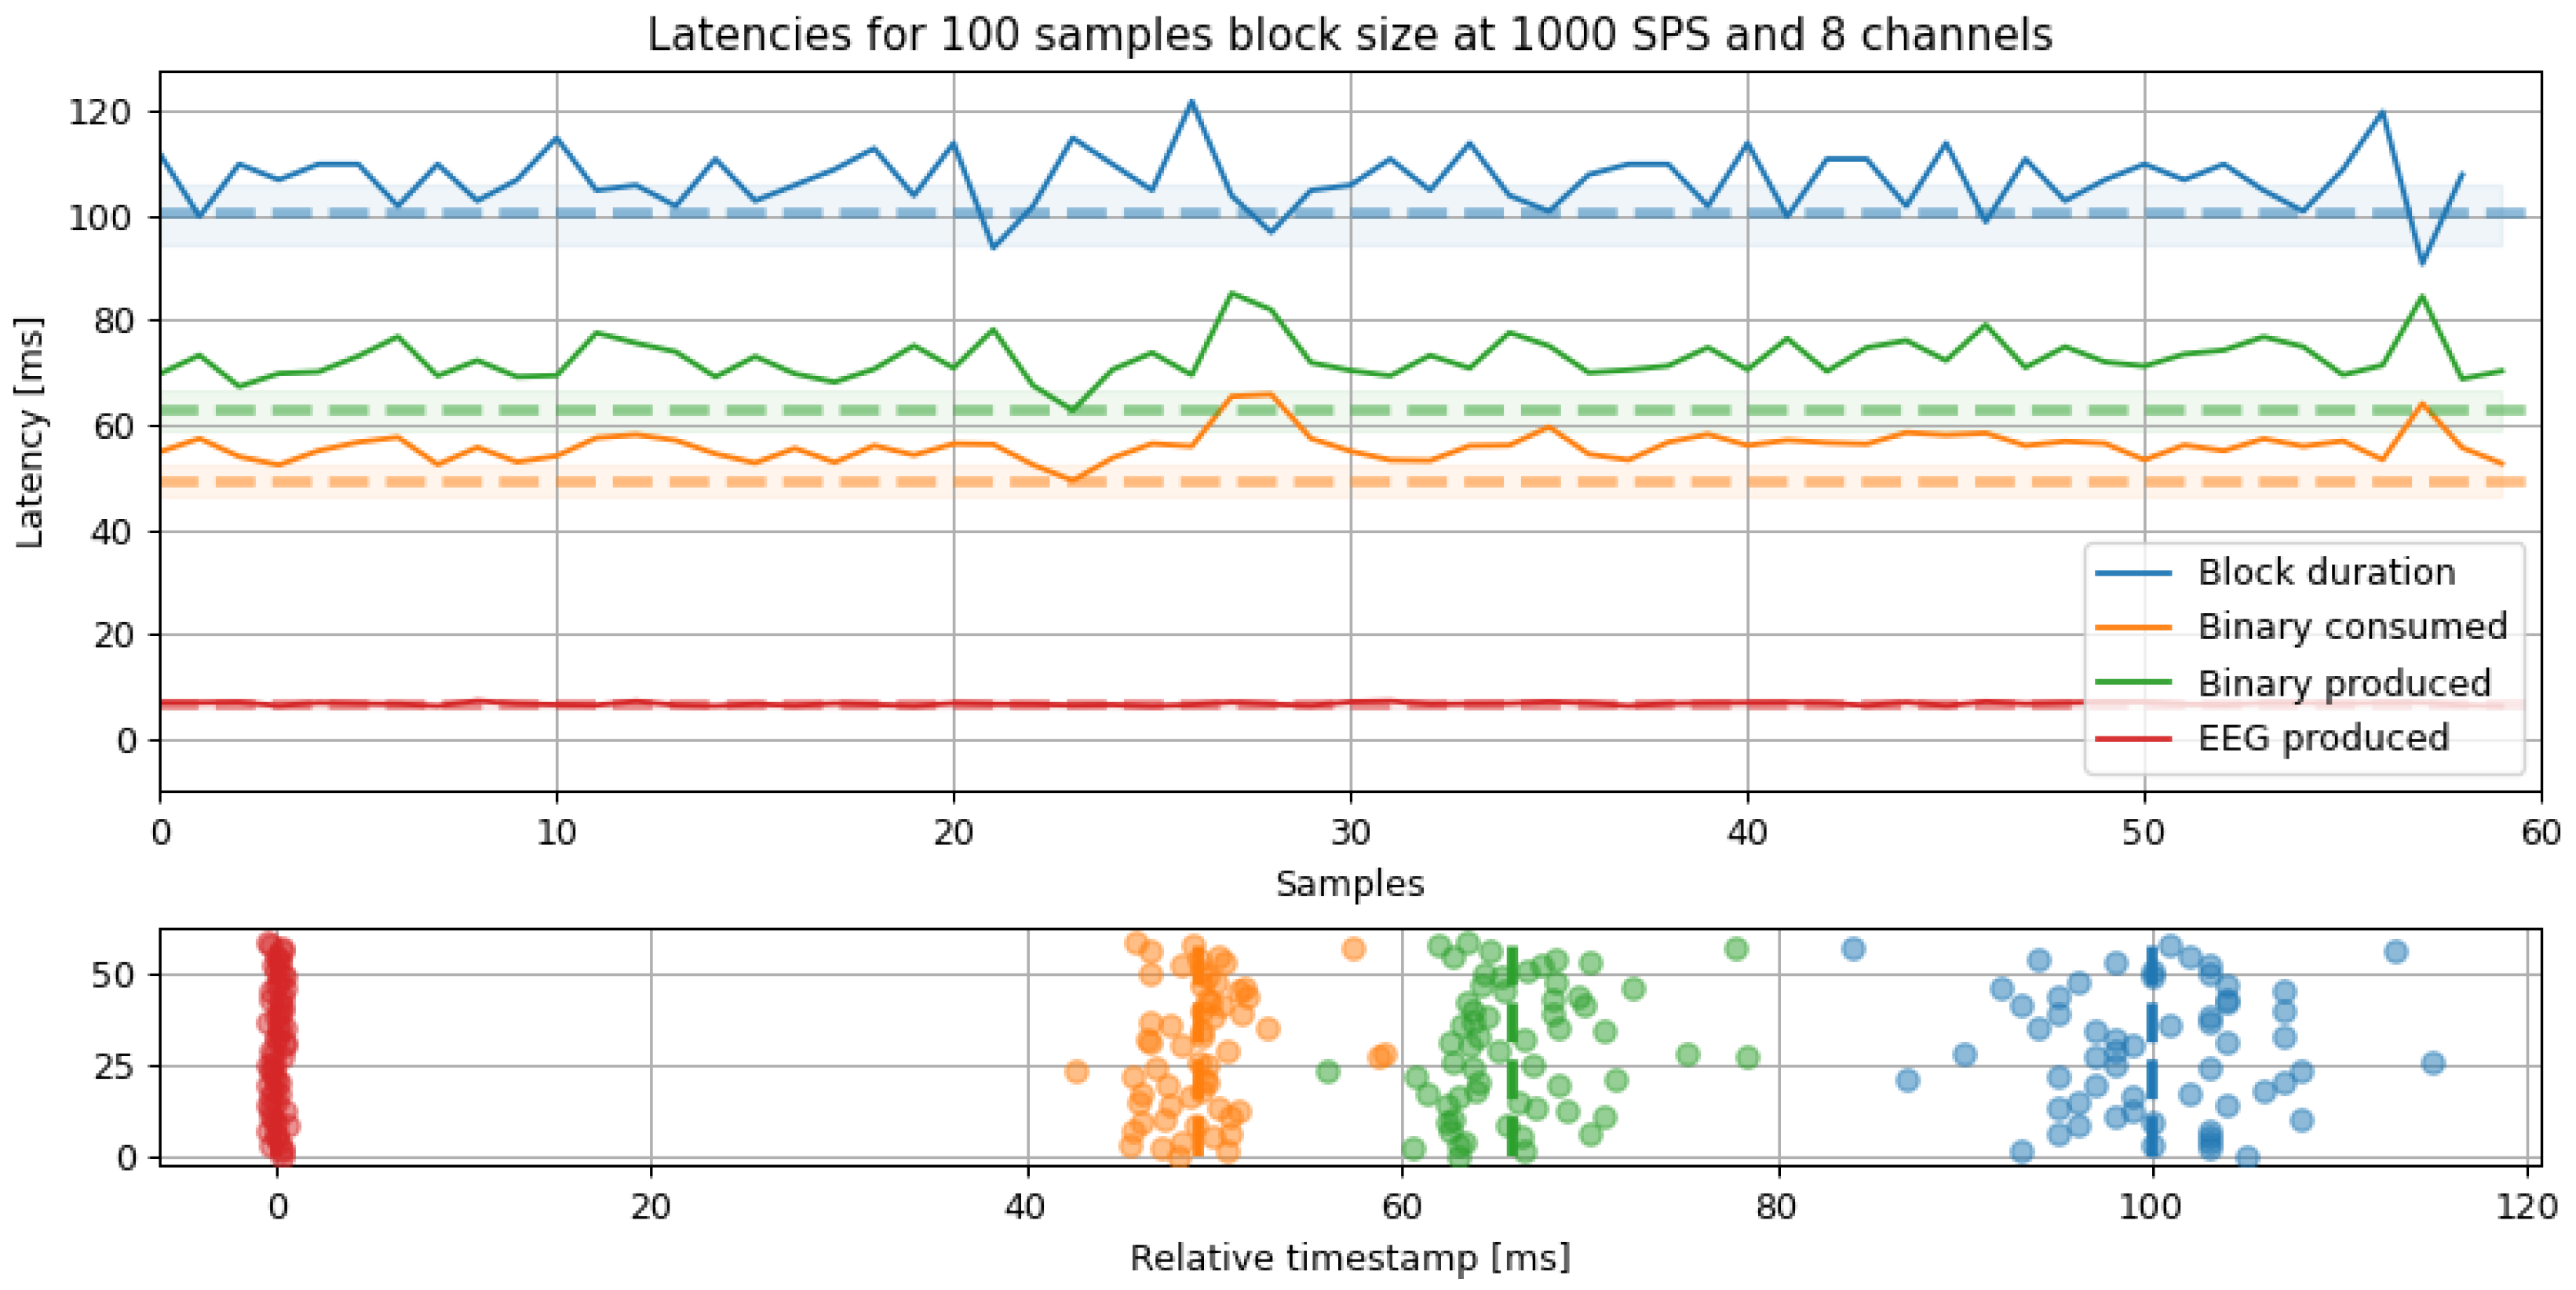
Latency analysis for a fixed 100 samples block size and 1000 SPS. The latencies show the elapsed time from reading the packet to the packaging time. The dashed line marks the minimum latency, and the shade is the standard deviation for all segments.
Figure 10.
Latency analysis for a fixed 100 samples block size and 1000 SPS. The latencies show the elapsed time from reading the packet to the packaging time. The dashed line marks the minimum latency, and the shade is the standard deviation for all segments.
Figure 11.
Latency vs. Block size results. Left: latency is proportional to the block size for small size values. Right: latency decreases for small block sizes but their standard deviation (jitter) increases for larger ones. The preferred configuration was set up in 100 samples block size due to the lower jitter.
Figure 12.
Sampling lost detection results. The sampling loss can be detected by analyzing the timestamp, using a test signal, or analyzing the sample index. Left column shows the complete time series in blue with a highlighted area. Right column presents a zoomed-in image regarding some samples irregularities.
Figure 13.
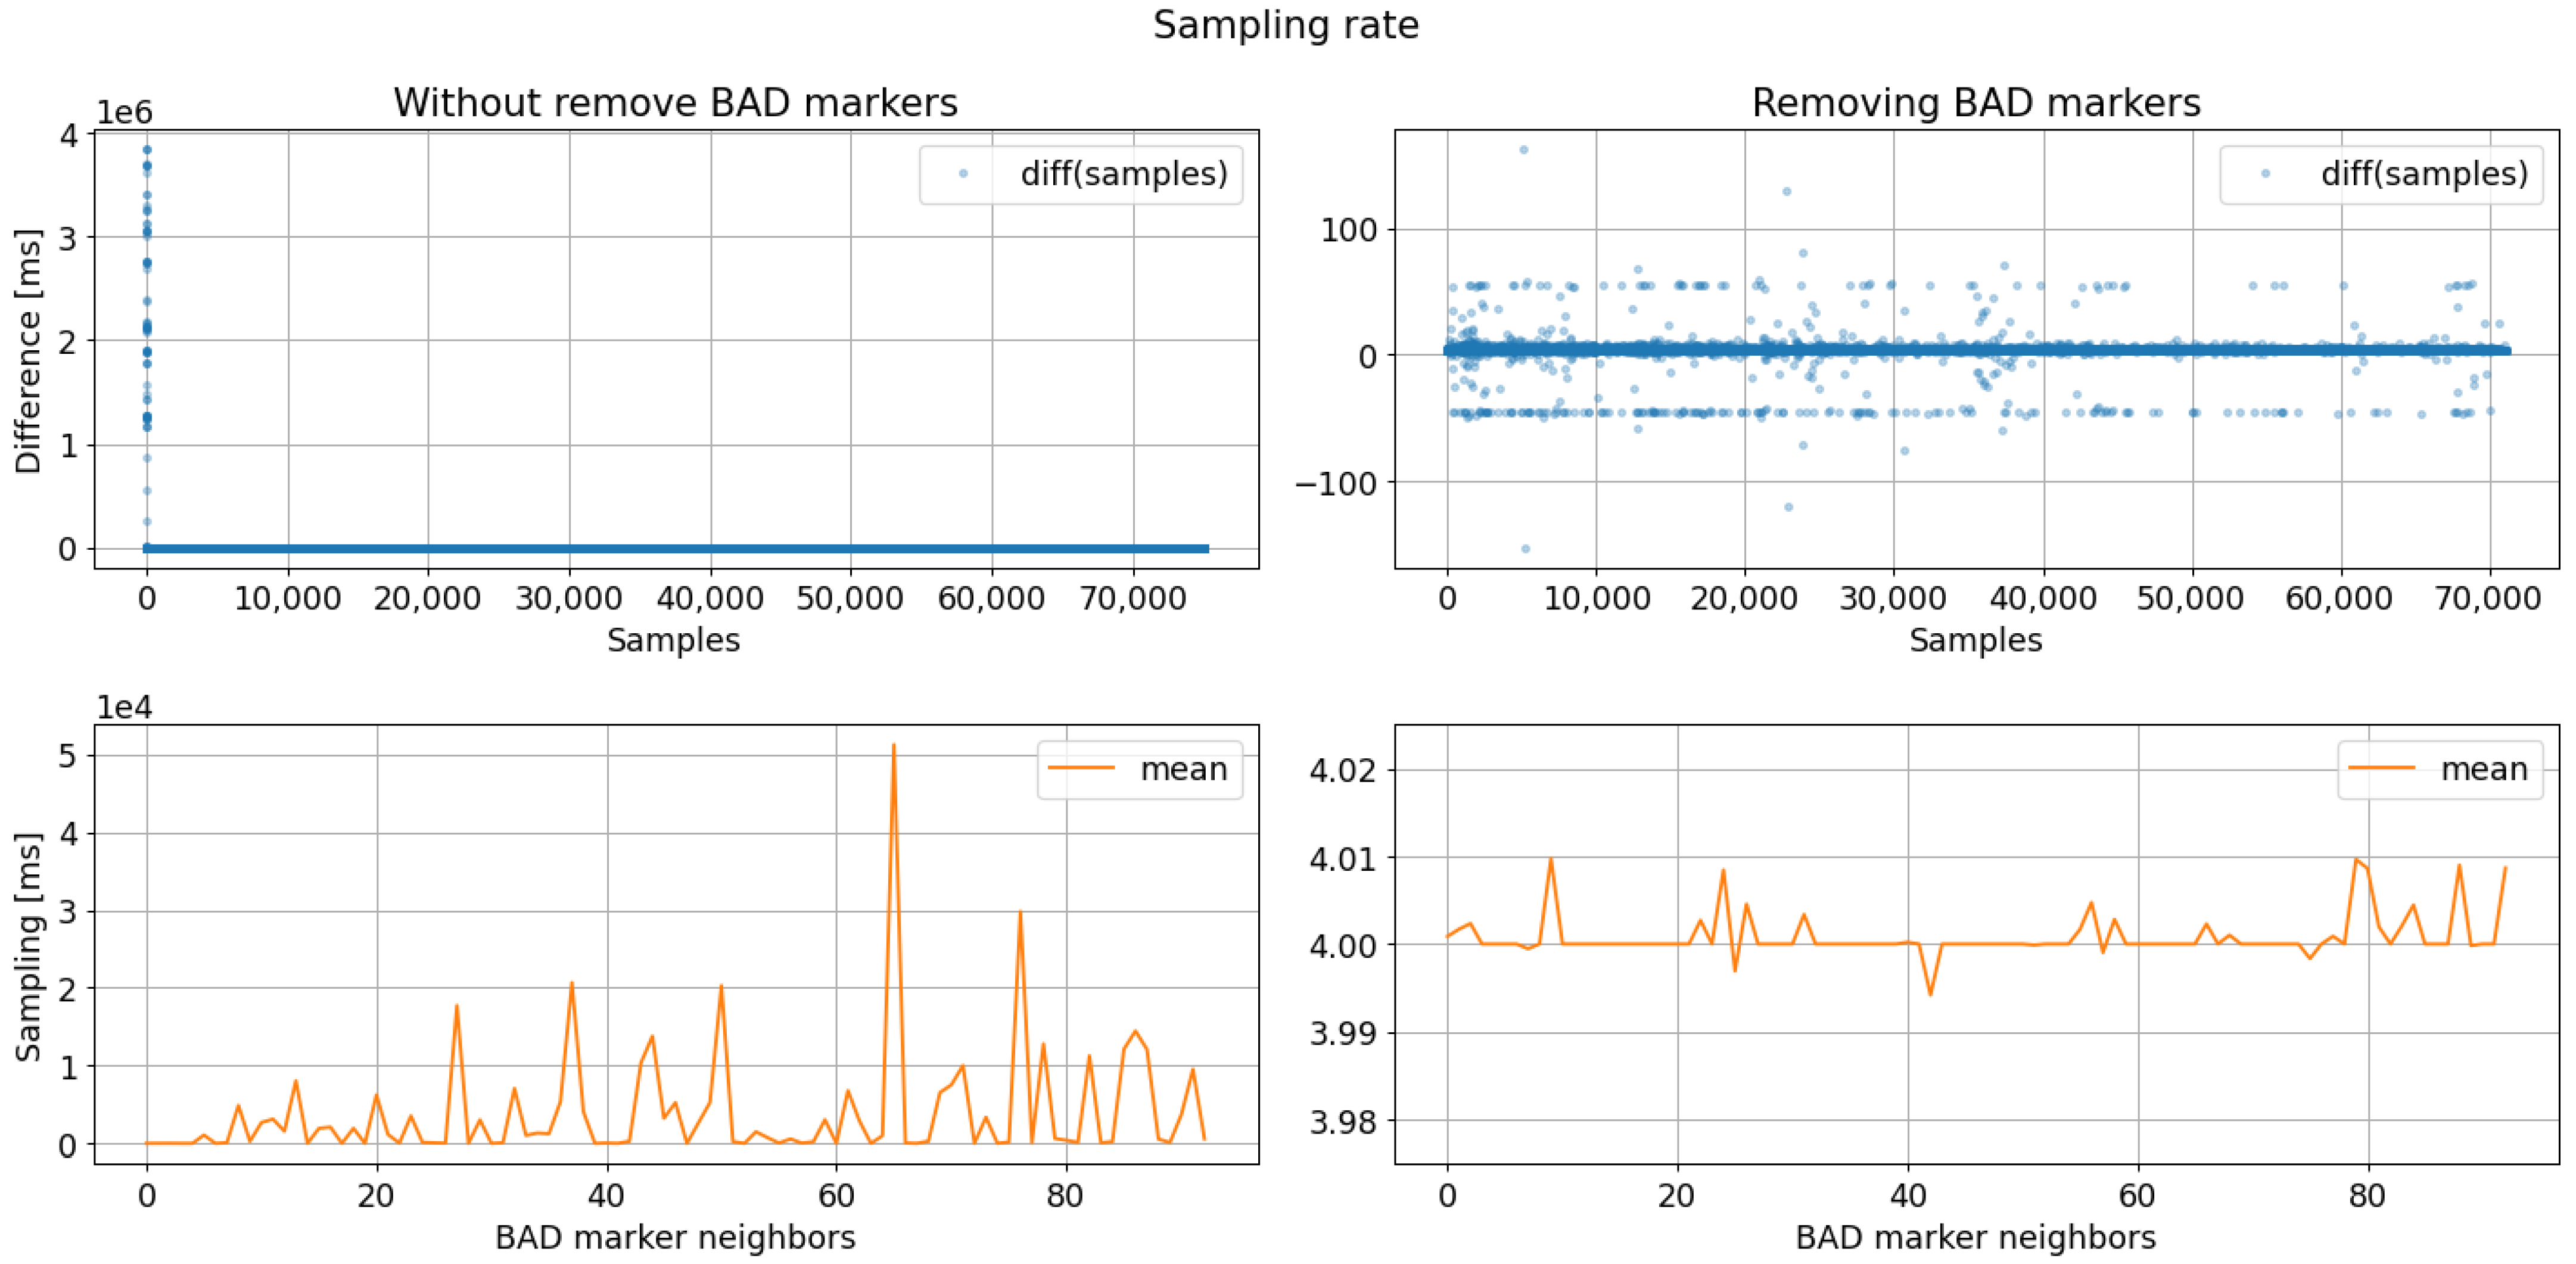
Sampling rate analysis results regarding bad markers removal. The sampling rate analysis after removing bad markers evidence a data period acquisition close to 4 ms (250 SPS).
Figure 13.
Sampling rate analysis results regarding bad markers removal. The sampling rate analysis after removing bad markers evidence a data period acquisition close to 4 ms (250 SPS).
Figure 14.
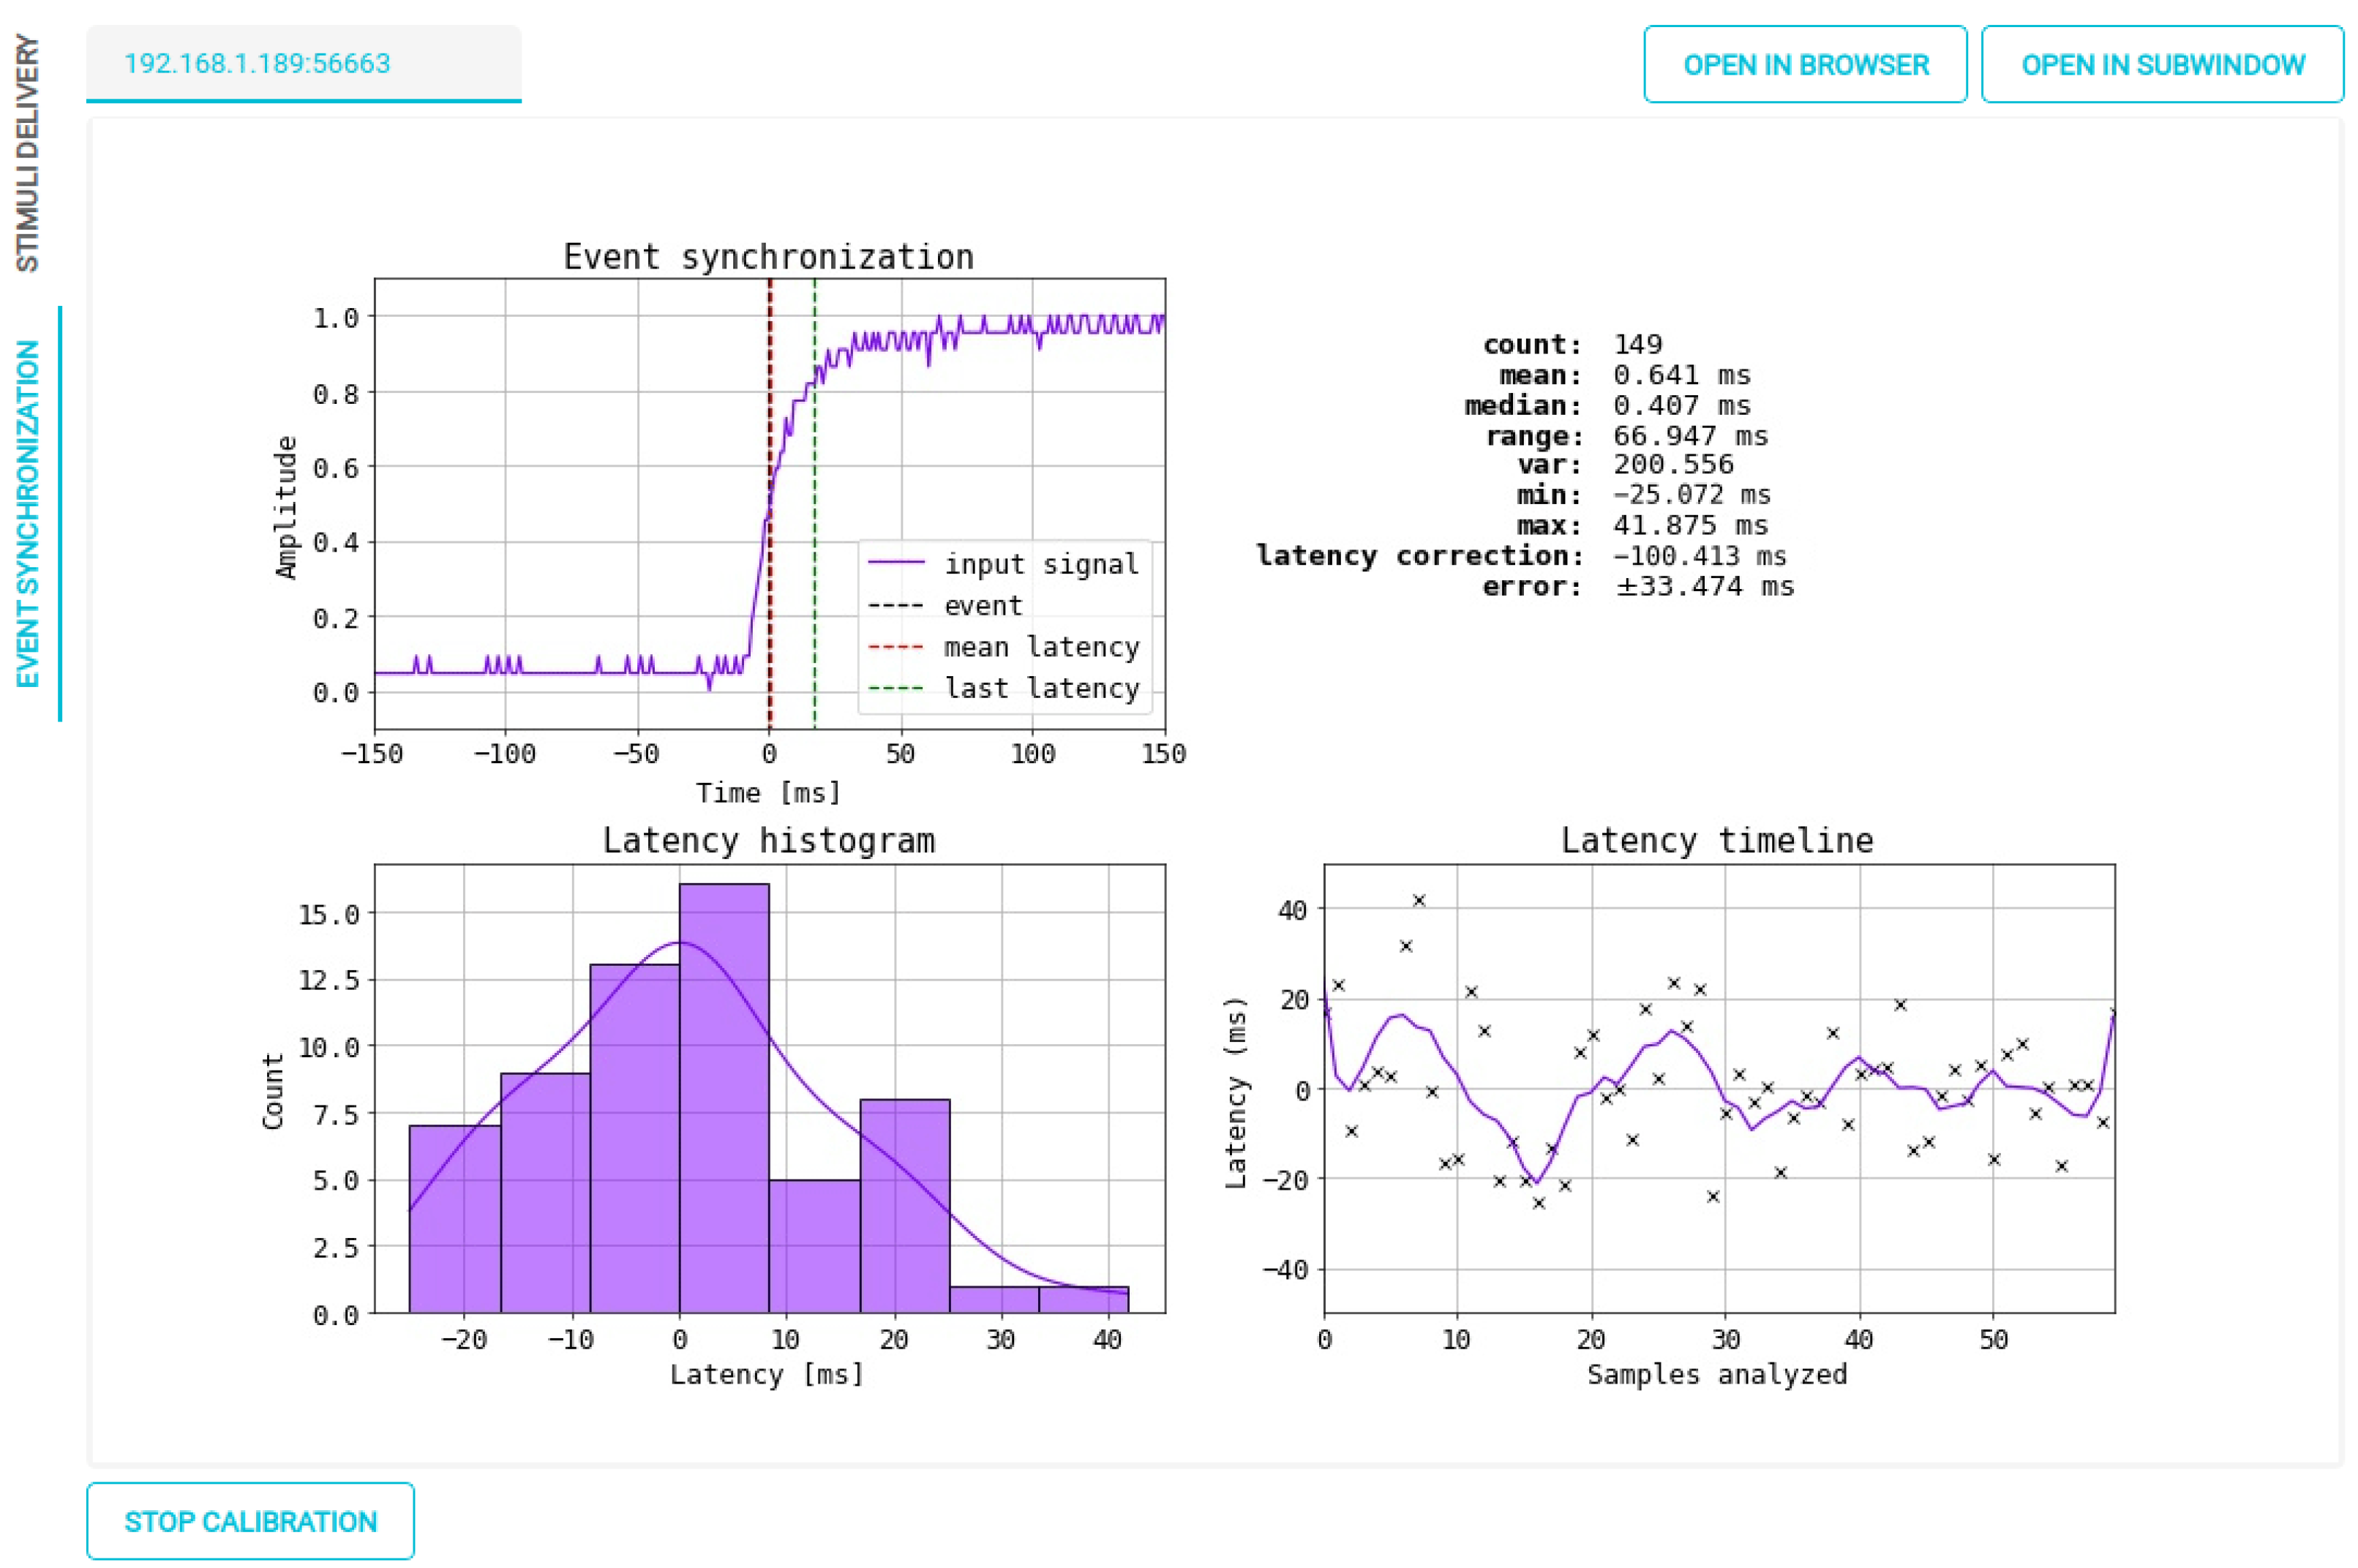
OpenBCI Framework results for marker synchronization within the real-time interface.
Figure 14.
OpenBCI Framework results for marker synchronization within the real-time interface.
Figure 15.
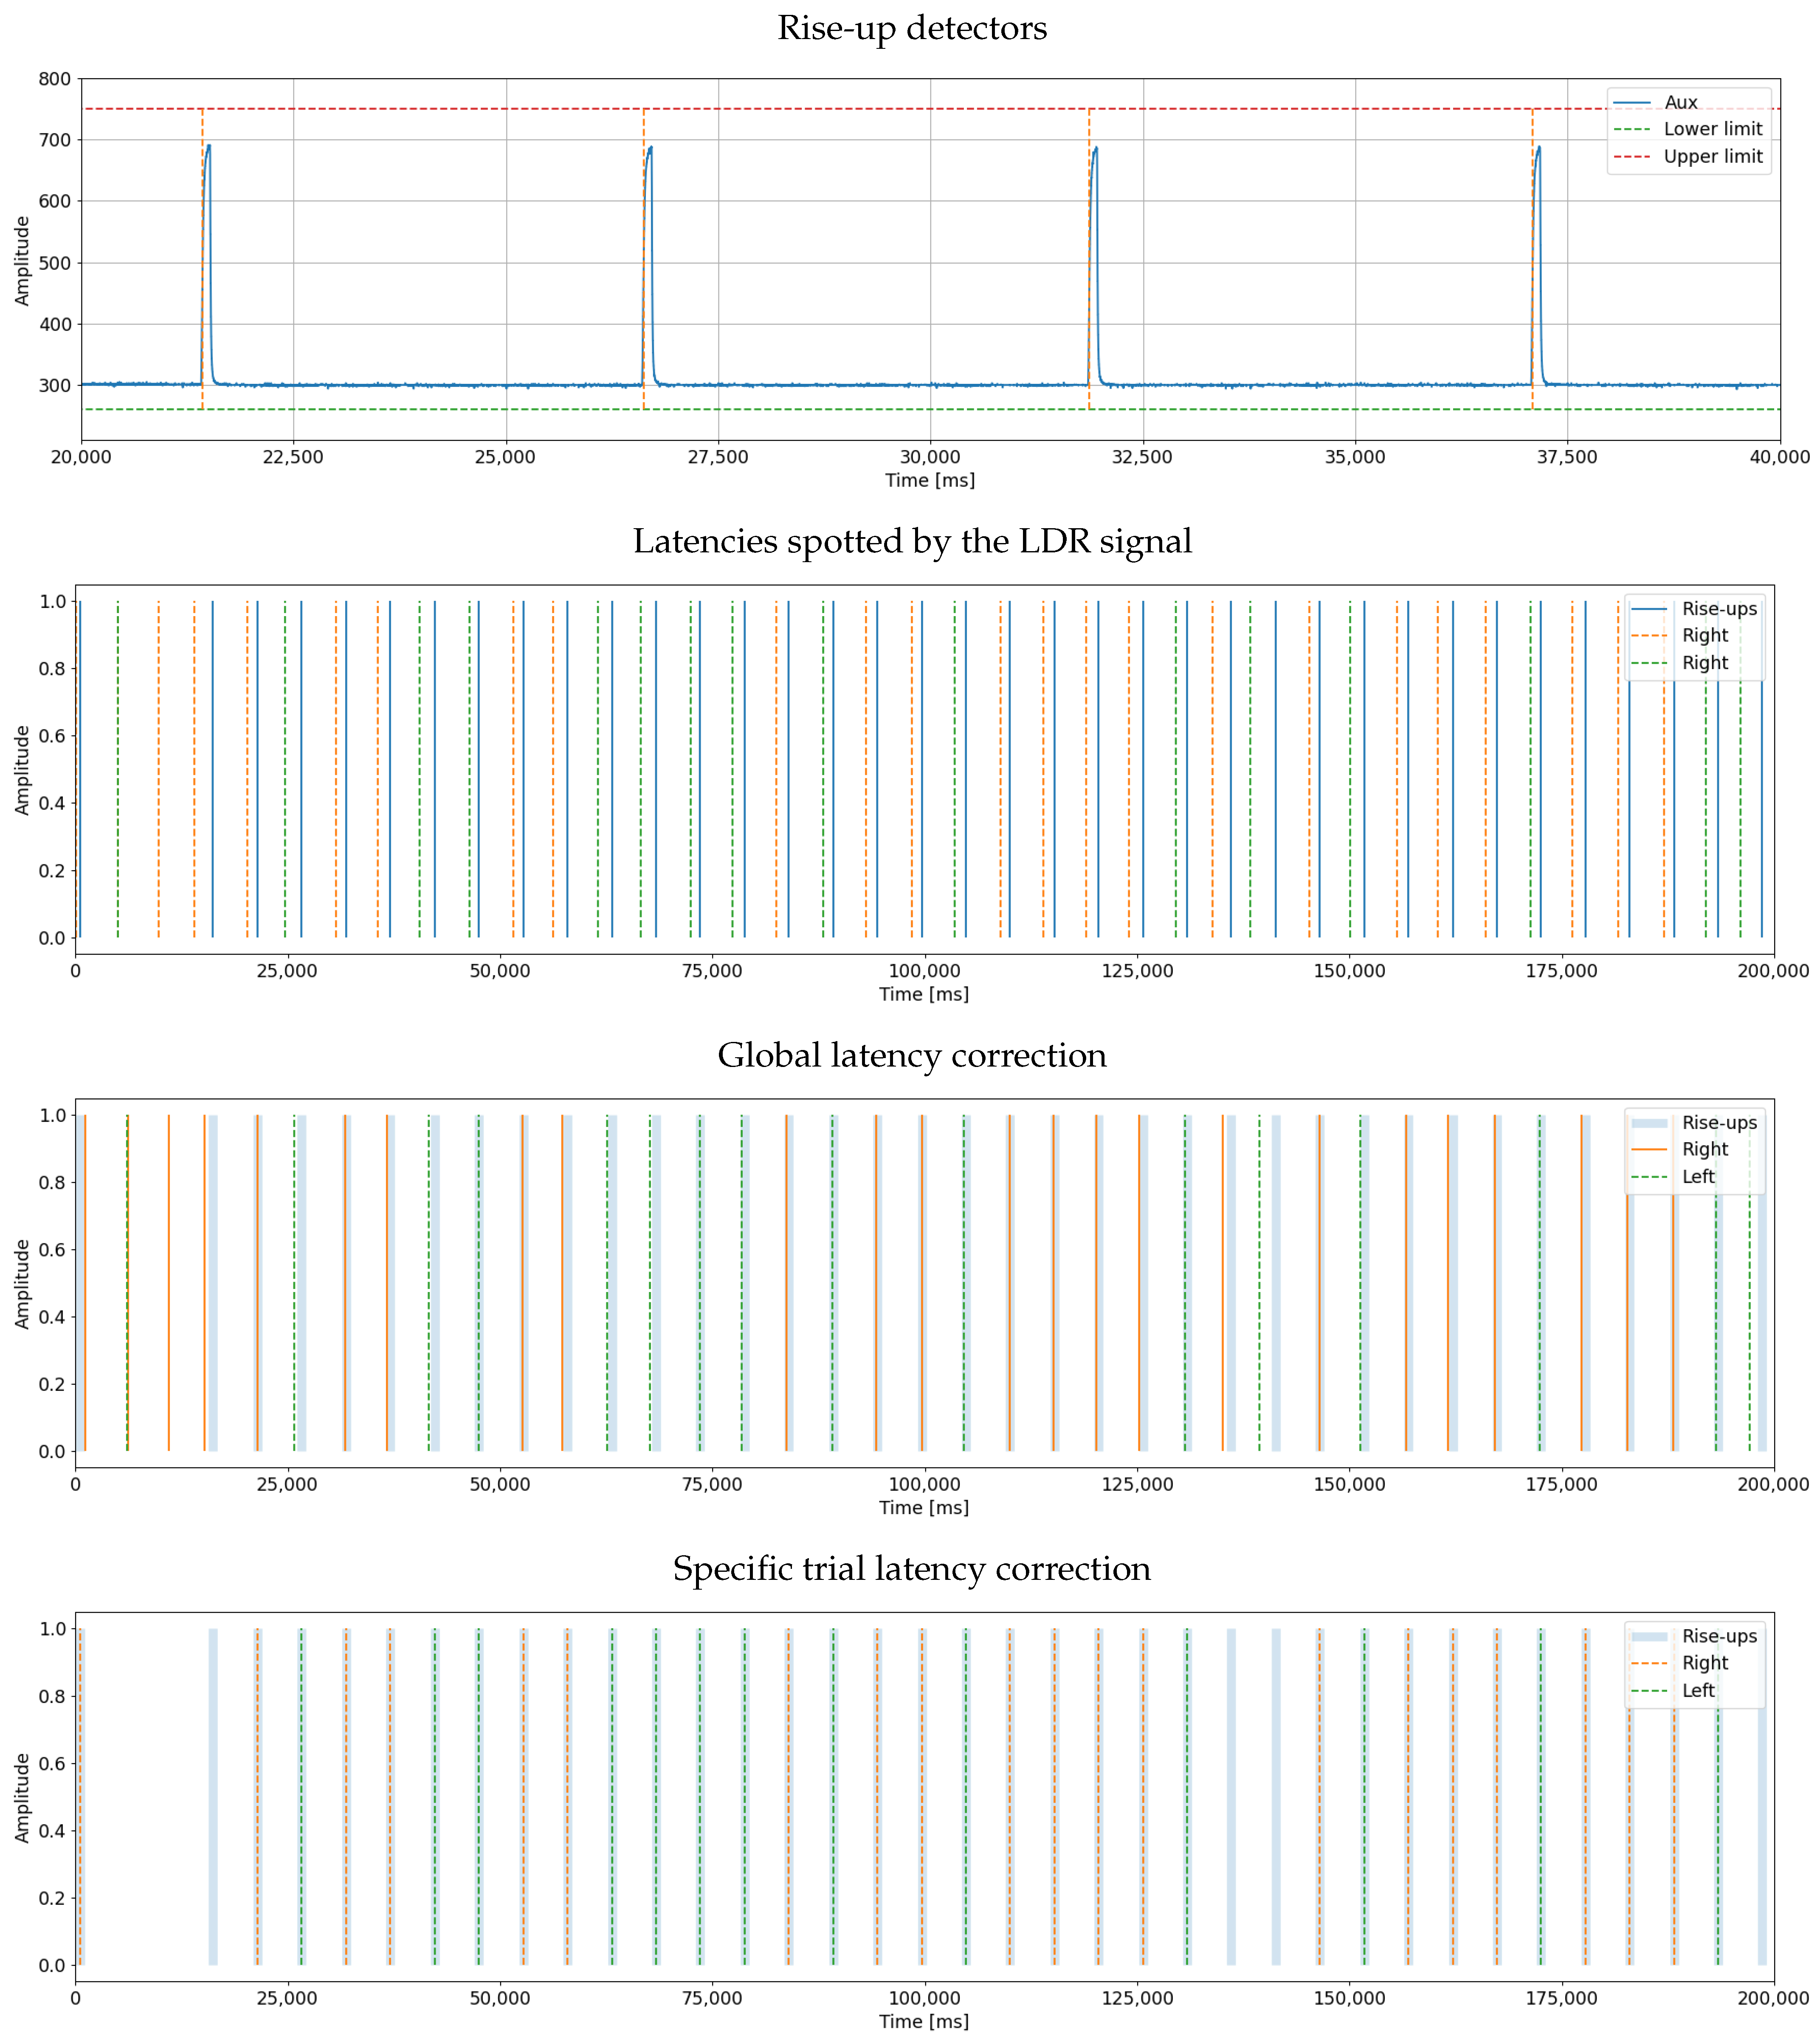
Automatic marker synchronization results. The top figure shows the signal generated by the LDR. The second figure visualizes the latencies in the system. The third figure shows what happens when all latencies are corrected with the same adjustment value, and the final plot has adjusted the latencies individually for each marker.
Figure 16.
Interface widget for real-time impedance visualizer. OpenBCI EEG cap for 16 channels is used within our MI paradigm.
Figure 16.
Interface widget for real-time impedance visualizer. OpenBCI EEG cap for 16 channels is used within our MI paradigm.
Figure 17.
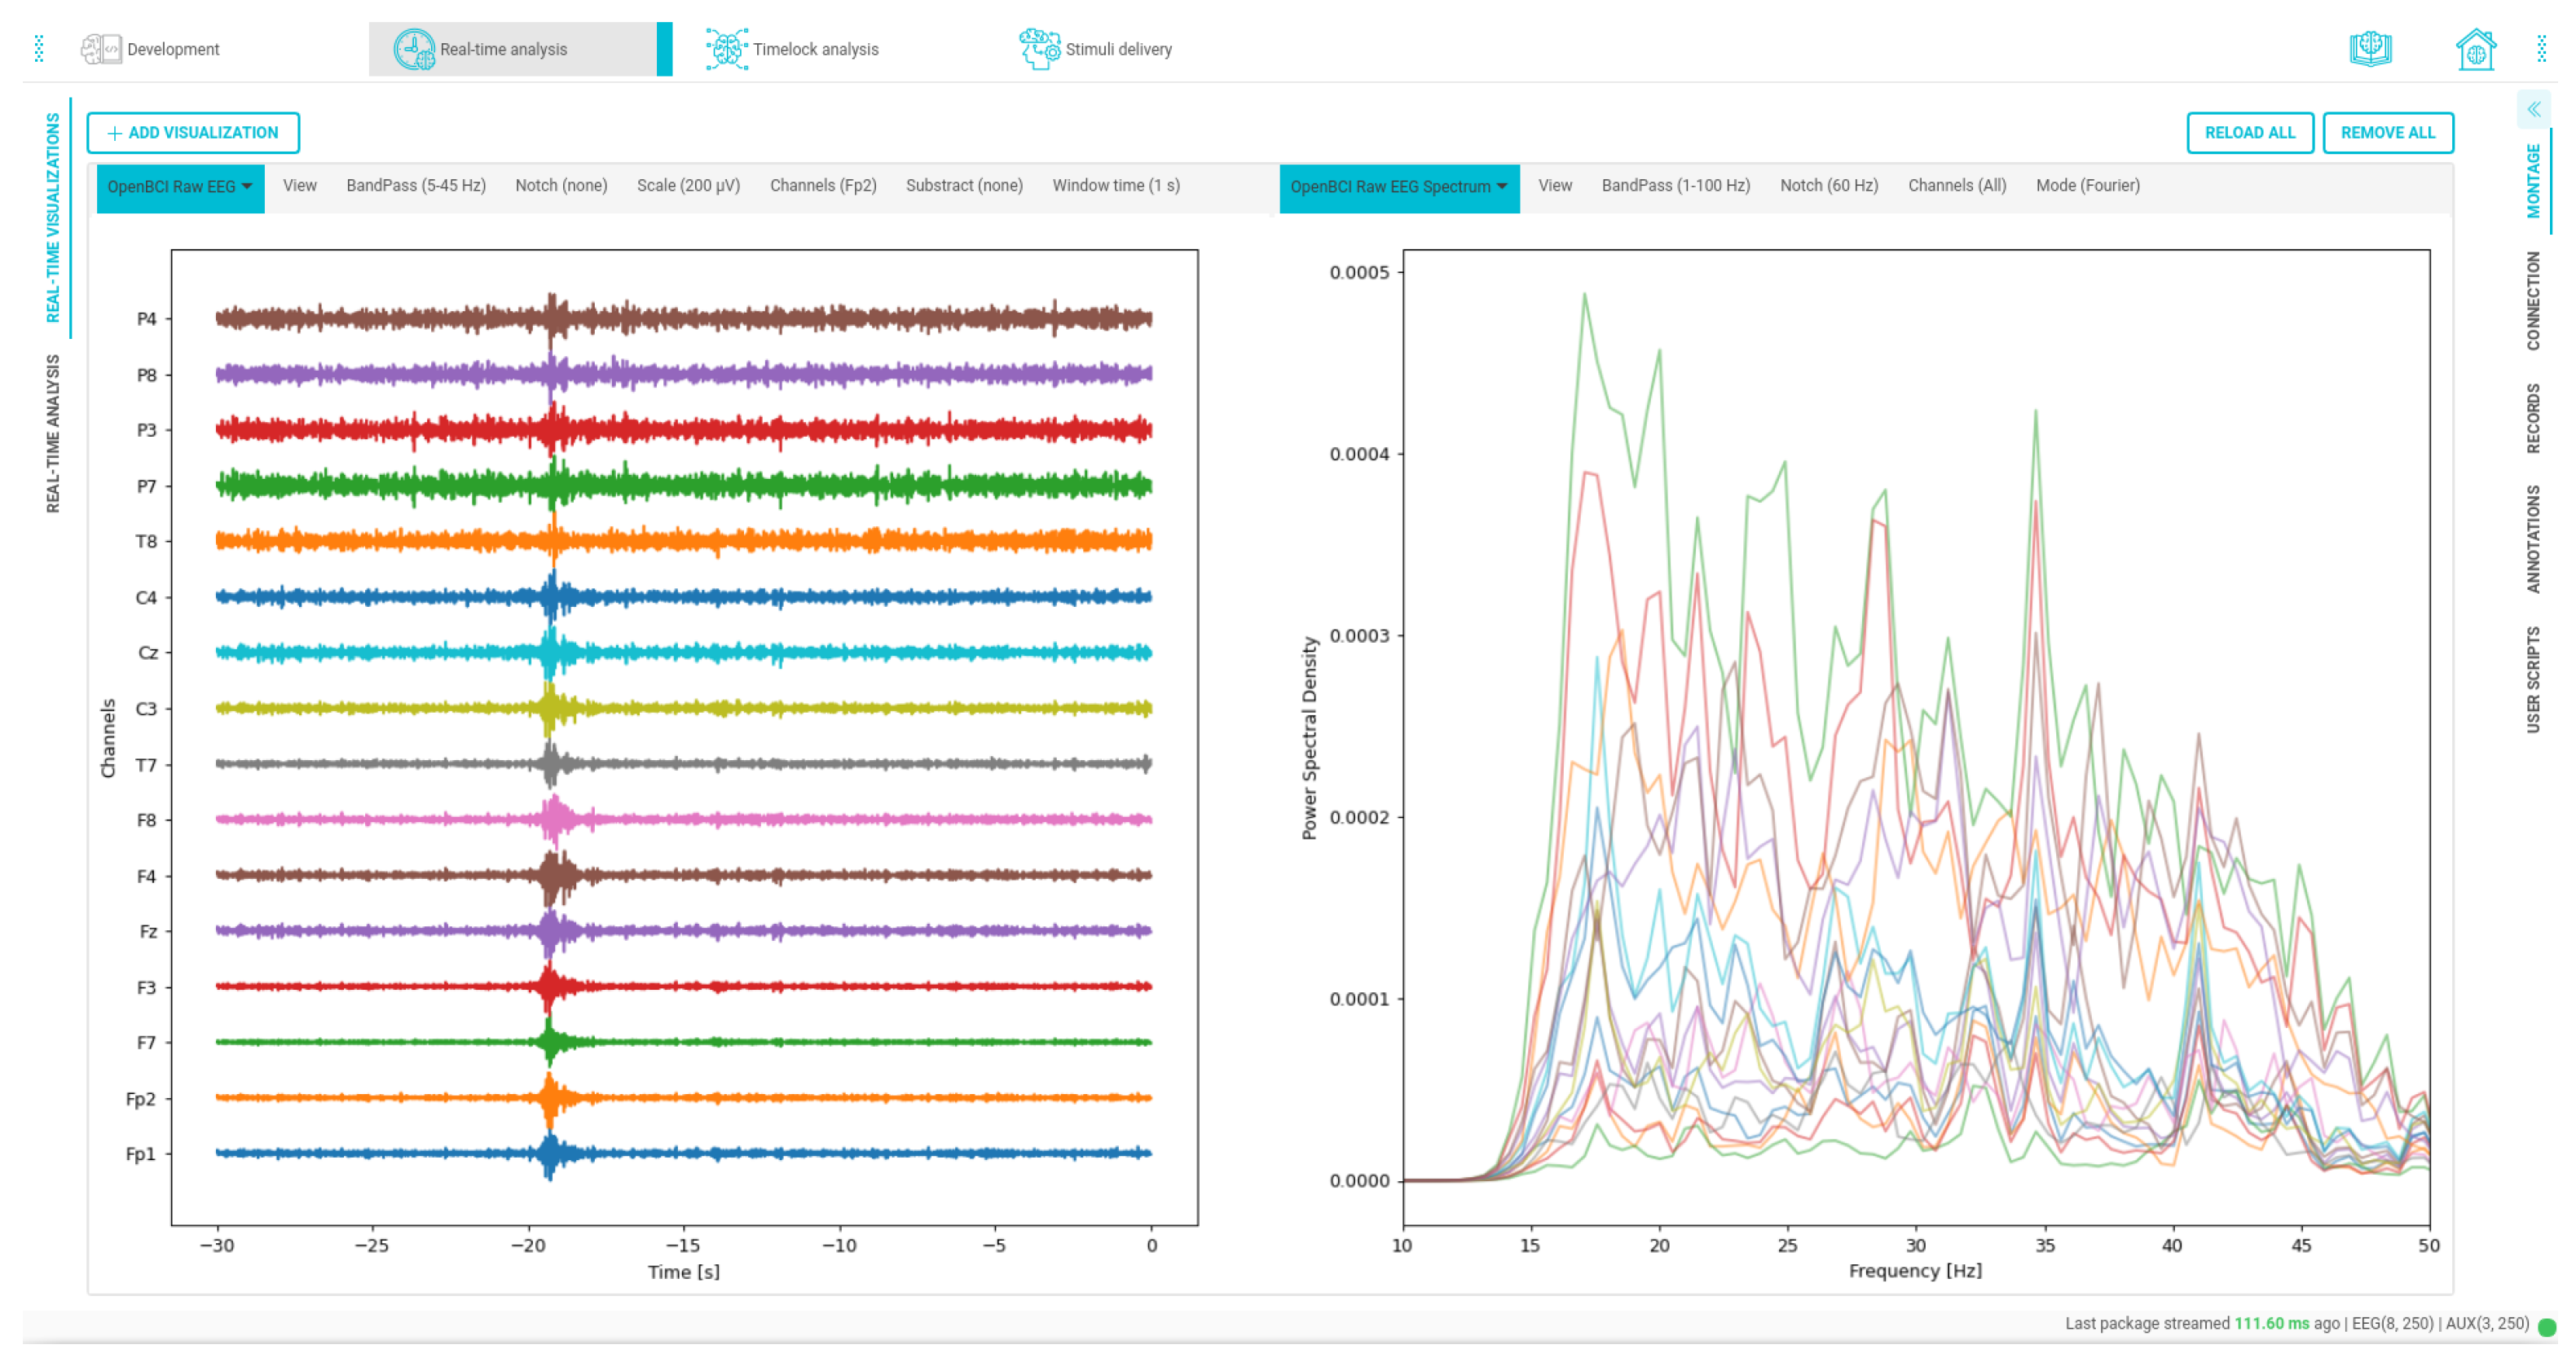
Time and frequency custom data visualizations. On the left side, the signal is filtered from 5 to 45 Hz, and on the right side, the spectrum of the channels is visualized within a bandwidth ranging from 1 to 100 Hz.
Figure 17.
Time and frequency custom data visualizations. On the left side, the signal is filtered from 5 to 45 Hz, and on the right side, the spectrum of the channels is visualized within a bandwidth ranging from 1 to 100 Hz.
Figure 18.
Stimuli delivery pipeline for MI paradigm. Each trial is composed of views; the pipeline features define the asynchronous execution of each view at the precise time.
Figure 18.
Stimuli delivery pipeline for MI paradigm. Each trial is composed of views; the pipeline features define the asynchronous execution of each view at the precise time.
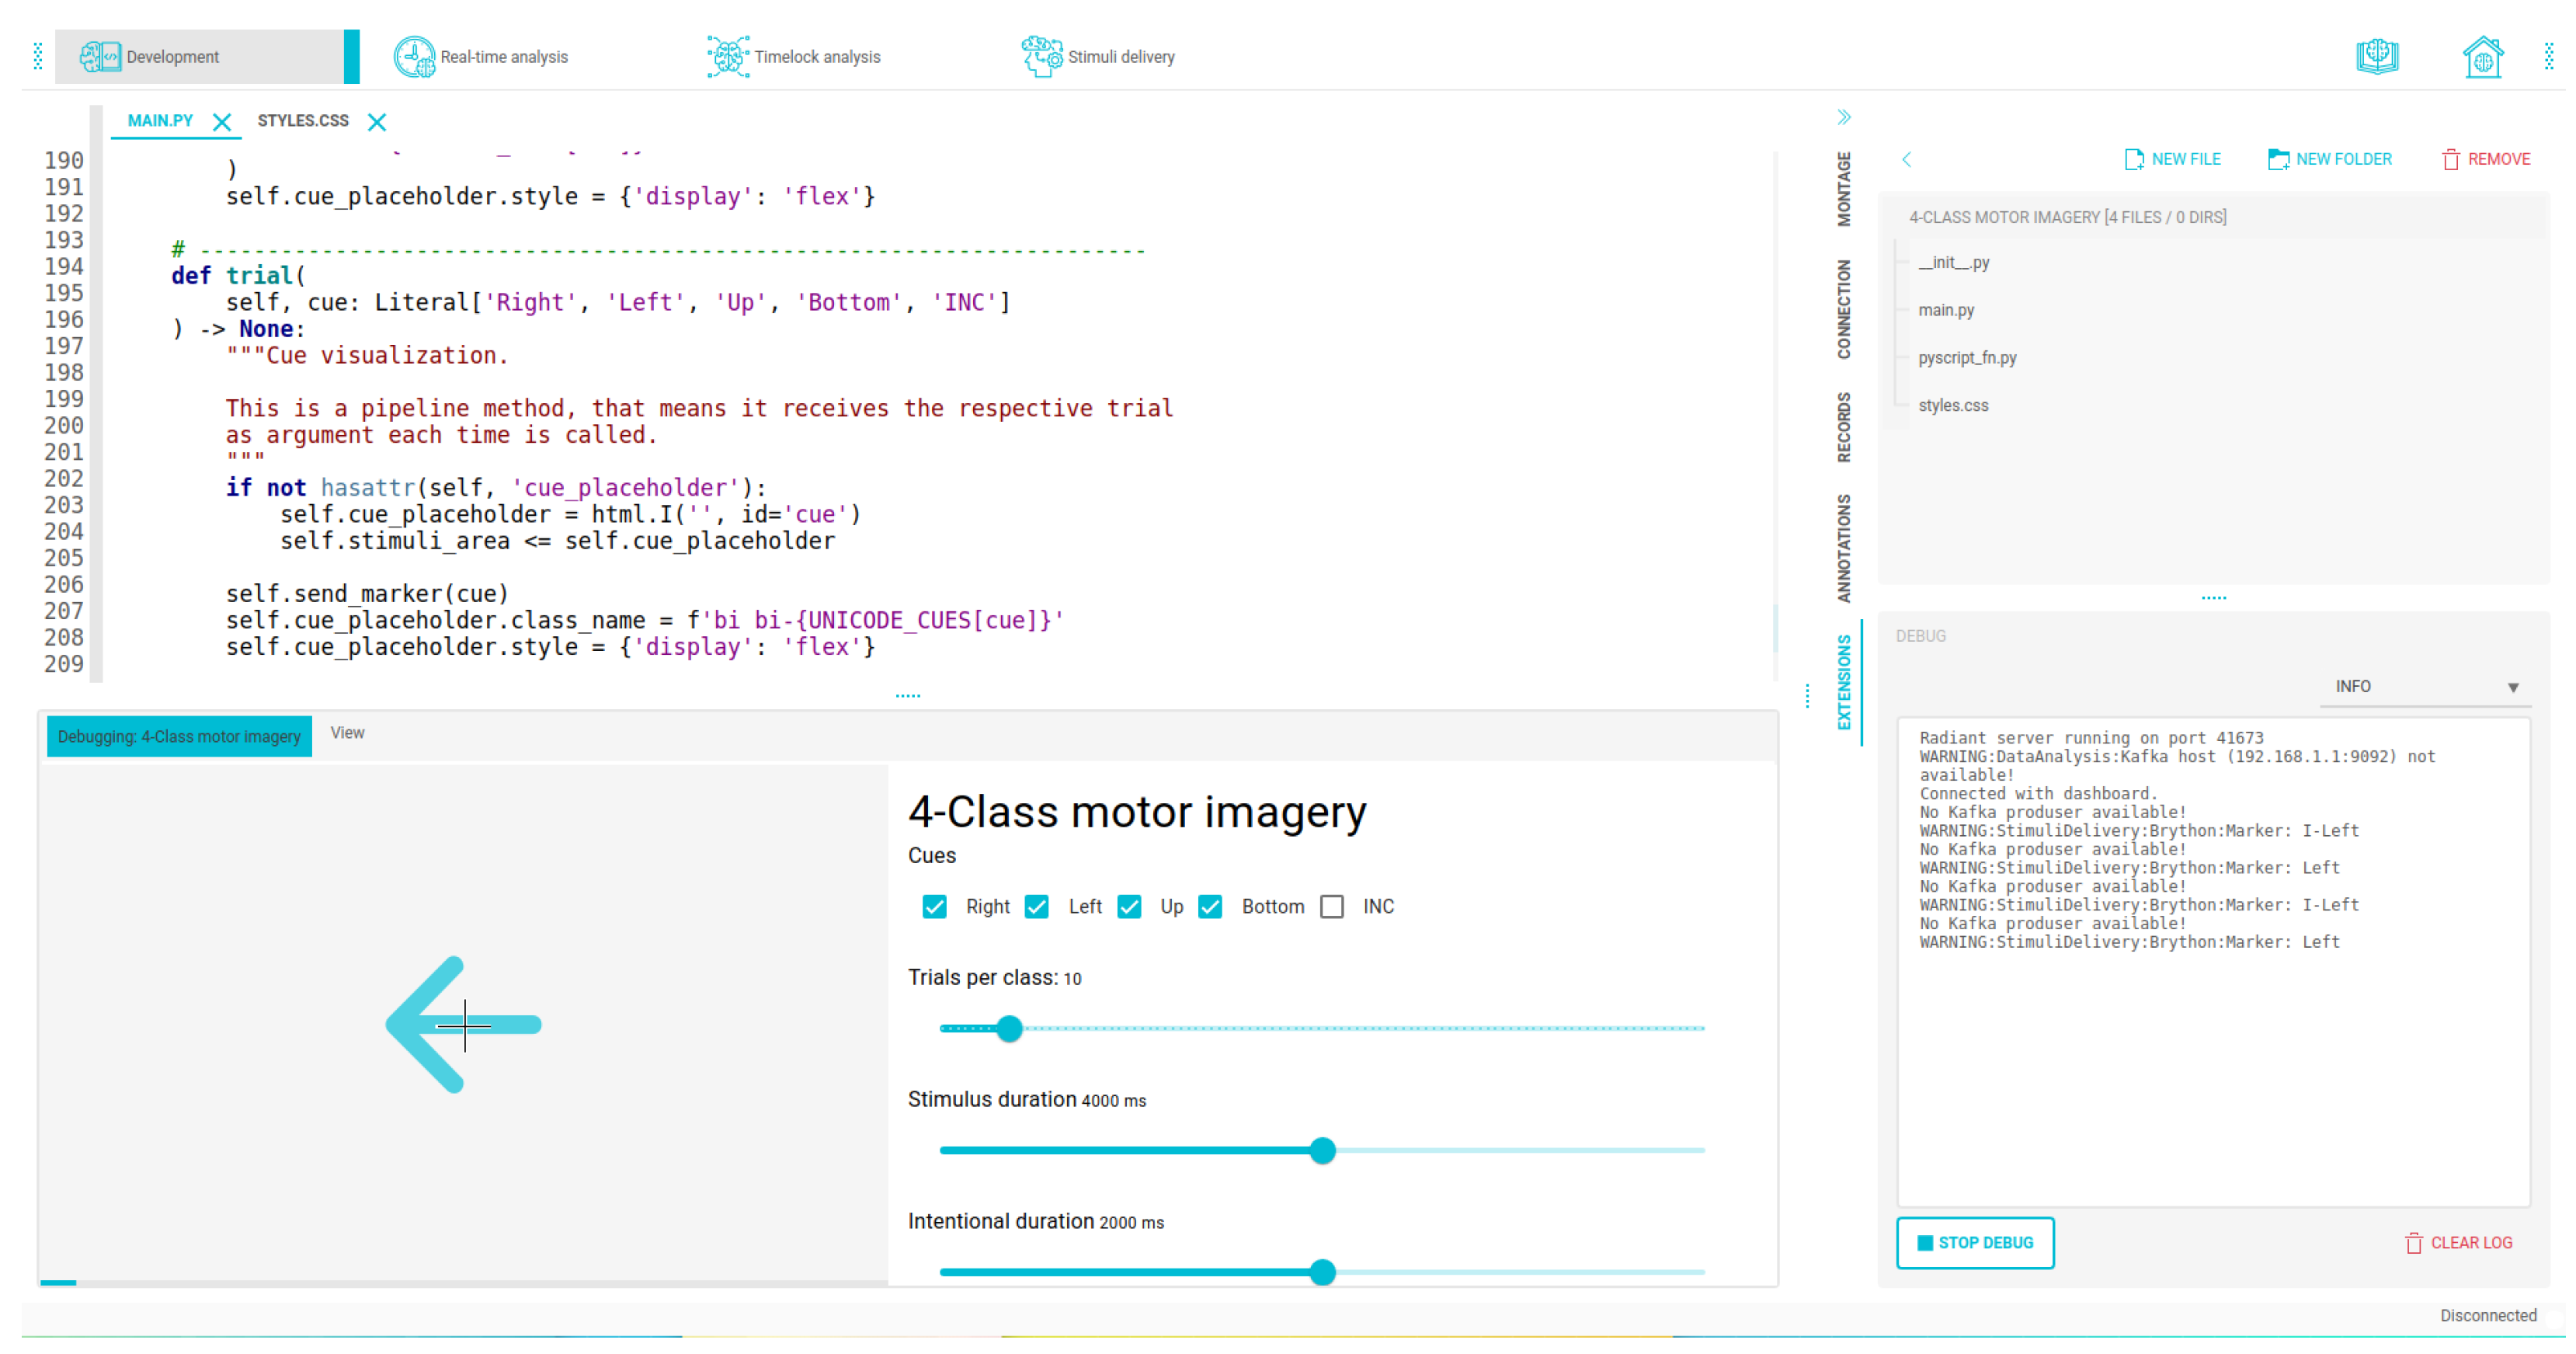
Figure 19.
Integrated development interfaces displaying areas for code editing, file explorer, experiment preview, and debugging area for our OpenBCI Framework.
Figure 19.
Integrated development interfaces displaying areas for code editing, file explorer, experiment preview, and debugging area for our OpenBCI Framework.
Table 1.
Acquisition devices used for BCI. Bluetooth (BLE) devices tend to have slower speeds than Radiofrequency (RF) and Wi-Fi communication protocols. Wired-based data transfers, like USB, have the highest transfer rates.
Table 1.
Acquisition devices used for BCI. Bluetooth (BLE) devices tend to have slower speeds than Radiofrequency (RF) and Wi-Fi communication protocols. Wired-based data transfers, like USB, have the highest transfer rates.
| BCI Hardware | Electrode Types | Channels | Protocol and Data Transfer | Sampling Rate | Open Hardware |
|---|
| Enobio (Neuroelectrics, Barcelona, Spain) | Flexible/Wet | 8, 20, 32 | BLE | 250 Hz | No |
| q.DSI 10/20 (Quasar Devices, La Jolla, CA, USA) | Flexible/Dry | 21 | BLE | 250 Hz–900 Hz | No |
| NeXus-32 (Mind Media B.V., Roermond, The Netherlands) | Flexible/Wet | 21 | BLE | 2.048 kHz | No |
| IMEC EEG Headset (IMEC, Leuven, Belgium) | Rigid/Dry | 8 | BLE | - | No |
| Muse (InteraXon Inc., Toronto, ON, Canada) | Rigid/Dry | 5 | BLE | 220 Hz | No |
| EPOC+ (Emotiv Inc., San Francisco, CA, USA) | Rigid/Wet | 14 | RF | 128 Hz | No |
| CGX MOBILE (Cognionics Inc., San Diego, CA, USA) | Flexible/Dry | 72, 128 | BLE | 500 Hz | No |
| ActiveTwo (Biosemi, Amsterdam, The Netherlands) | Flexible/Wet | 256 | USB | 2 kHz–16 kHz | No |
| actiCAP slim/snap (Brain Products GmbH, Gilching, Germany) | Flexible/Wet/Dry | 16 | USB | 2 kHz–20 kHz | No |
| Mind Wave (NeuroSky, Inc., San Jose, CA, USA) | Rigid/Dry | 1 | RF | 250 Hz | No |
| Quick-20 (Cognionics Inc., San Diego, CA, USA) | Rigid/Dry | 28 | BLE | 262 Hz | No |
| B-Alert x10 (Advanced Brain Monitoring, Inc., Carlsbad, CA, USA) | Rigid/Wet | 9 | BLE | 256 Hz | No |
| Cyton OpenBCI (OpenBCI, Brooklyn, NY, USA) | Flexible/Wet/Dry | 8, 16 | RF/BLE/Wi-Fi | 250 Hz–16 kHz | Yes |
Table 2.
BCI software. The most widely used software comprises free licenses: GNU General Public License (GPL), GNU Affero General Public License-version 3 (AGPL3), or MIT License (MIT). Usually, open-source tools admit extensibility by third-party developers.
Table 2.
BCI software. The most widely used software comprises free licenses: GNU General Public License (GPL), GNU Affero General Public License-version 3 (AGPL3), or MIT License (MIT). Usually, open-source tools admit extensibility by third-party developers.
| BCI Software | Stimuli Delivery | Devices | Data Analysis | Close-Loop | Extensibility | License |
|---|
| BCI2000 (version 3.6, released in August 2020) | Yes | A large set | In software | Yes | yes | GPL |
| OpenViBE (version 3.3.1, released in November 2022) | Yes | A large set | In software | Yes | Yes | AGPL3 |
| Neurobehavioral Systems Presentation (version 23.1, released in September 2022) | Yes | Has official list | In software | Yes | Yes | Proprietary |
| Psychology Software Tools, Inc. ePrime (version 3.0, released in September 2022) | Yes | Proprietary devices only | In software | No | Yes | Proprietary |
| EEGLAB (version 2022.1, released in August 2022) | No | Determined by Matlab | System Matlab | No | - | Proprietary |
| PsychoPy (vesion 2022.2.3, released in August 2022) | Yes | NO | NO | No | Yes | GPL |
| FieldTrip (version 20220827, released in August 2022) | No | NO | System Matlab | No | Yes | GPL |
| Millisecond Inquisit Lab (version 6.6.1, released in July 2022) | Yes | Serial and parallel devices | NO | No | No | Proprietary |
| Psychtoolbox-3 (version 3.0.18.12, released in August 2022) | Yes | Determined by Matlab and Octave | NO | No | - | MIT |
| OpenSesame (version 3.3.12, released in May 2022) | Yes | Determined by Python | System Python | No | Yes | GPL |
| NIMH MonkeyLogic (version 2.2.23, released in January 2022) | Yes | Determined by Matlab | NO | No | No | Proprietary |
| g.BCISYS | Yes | Proprietary devices only | System Matlab | No | No | Proprietary |
| OpenBCI GUI (version 5.1.0, released in May 2022) | No | Proprietary devices only | No | No | Yes | MIT |
Table 3.
OpenBCI Cyton configurations using Daisy expansion board and Wi-Fi shield.
Table 3.
OpenBCI Cyton configurations using Daisy expansion board and Wi-Fi shield.
| OpenBCI Cyton | Channels | Digital Inputs | Analog Inputs | Max. Sample Rate | Featured Protocol |
|---|
| RFduino | 8 | 5 | 3 | 250 Hz | Serial |
| RFduino + Daisy | 16 | 5 | 3 | 250 Hz | Serial |
| RFduino + Wi-Fi shield | 8 | 2 | 1 | 16 KHz | TCP (over Wi-Fi) |
| RFduino + Wi-Fi shield + Daisy | 16 | 2 | 1 | 8 KHz | TCP (over Wi-Fi) |
Table 4.
EEG data package format for 16 channels.
Table 4.
EEG data package format for 16 channels.
| Received | Upsampled Board Data | Upsampled Daisy Data |
|---|
| sample(3) | | avg[sample(1), sample(3)] | sample(2) |
| | sample(4) | sample(3) | avg[sample(2), sample(4)] |
| sample(5) | | avg[sample(3), sample(5)] | sample(4) |
| | sample(6) | sample(5) | avg[sample(4), sample(6)] |
| sample(7) | | avg[sample(5), sample(7)] | sample(6) |
| | sample(8) | sample(7) | avg[sample(6), sample(8)] |
Table 5.
OpenBCI Cyton configurations using Daisy expansion board and a Wi-Fi shield.
Table 5.
OpenBCI Cyton configurations using Daisy expansion board and a Wi-Fi shield.
| OpenBCI Cyton | Channels | Digital Inputs | Analog Inputs | Max. Sample Rate | Featured Protocol |
|---|
| RFduino | 8 | 5 | 3 | 250 Hz | Serial |
| RFduino + Daisy | 16 | 5 | 3 | 250 Hz | Serial |
| RFduino + Wi-Fi shield | 8 | 2 | 1 | 16 KHz | TCP (over Wi-Fi) |
| RFduino + Wi-Fi shield + Daisy | 16 | 2 | 1 | 8 KHz | TCP (over Wi-Fi) |
Table 6.
Latency analysis for method comparison results. Latency has been expressed in terms of the percentage of the block size to make possible the comparison between different configurations.
Table 6.
Latency analysis for method comparison results. Latency has been expressed in terms of the percentage of the block size to make possible the comparison between different configurations.
| BCI System | Sample Rate | Block Size | Jitter | Communication | Distributed | Latency |
|---|
| BCI2000 + DT3003 [45] | 160 Hz | 6.35 ms | 0.67 ms | Wired | No | 51.9% |
| BCI2000 + NI 6024E [45] | 25 kHz | 40 ms | 0.75 ms | Wired | No | 27.5% |
| BCI2000 + g.USBamp [32] | 1200 Hz | 83.3 ms | 5.91 ms | Wired | No | 14, 30, 48% |
| OpenViBE + TMSi Porti32 [46] | 512 Hz | 62.5 ms | 3.07 ms | Optical MUX | No | 100.4% |
| OpenBCI Framework (ours) | 1000 Hz | 100 ms | 5.7 ms | Wireless | Yes | 56 |
