
Visual Parking Occupancy Detection Using Extended Contextual Image Information via a Multi-Branch Output ConvNeXt Network


Abstract
1. Introduction
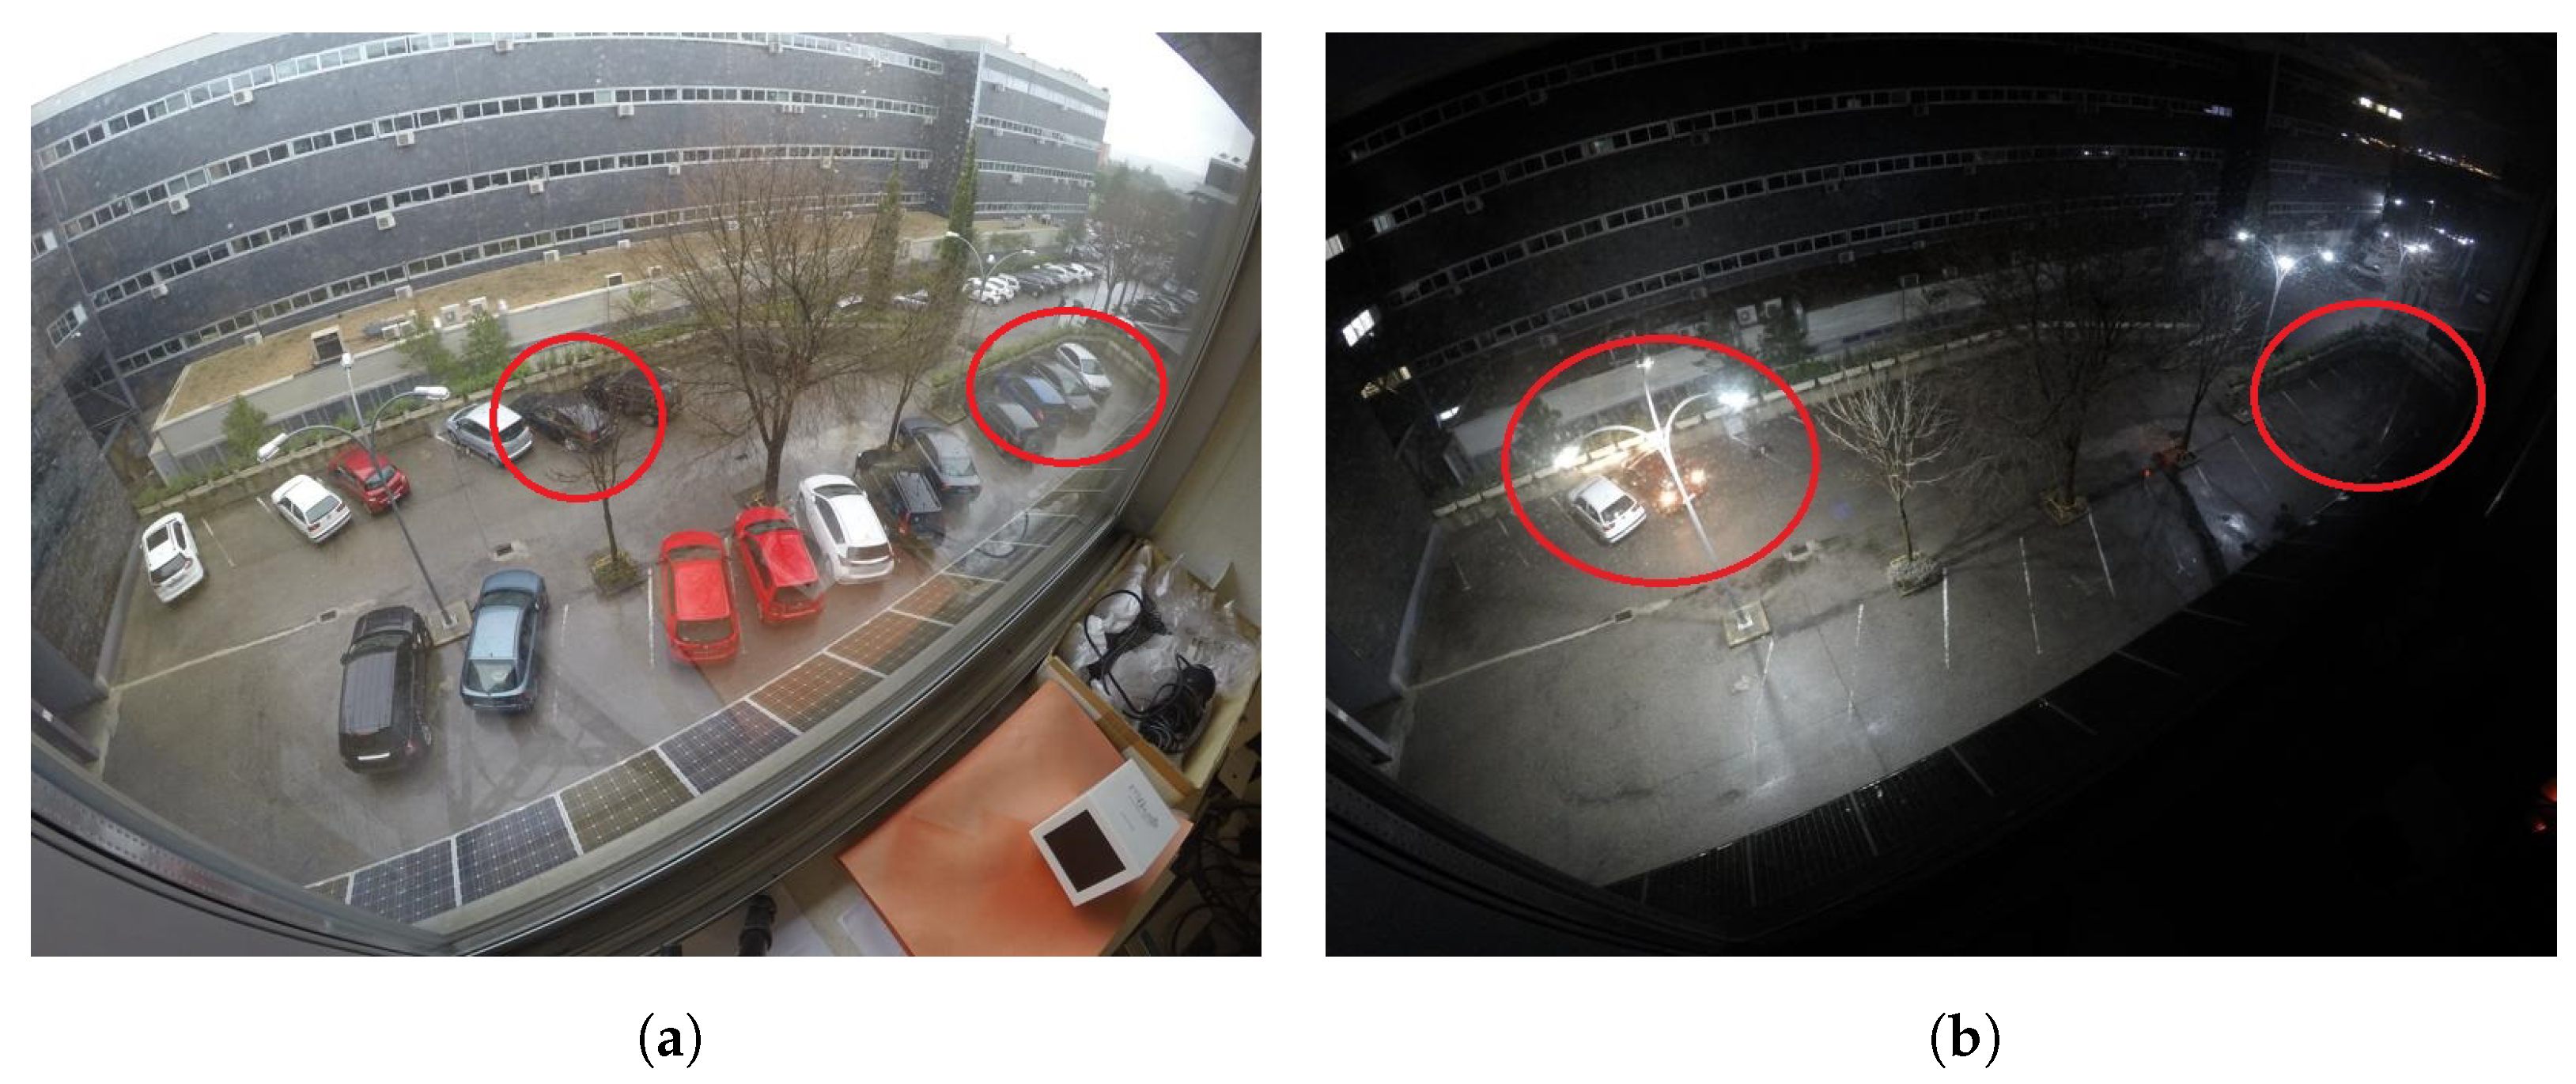
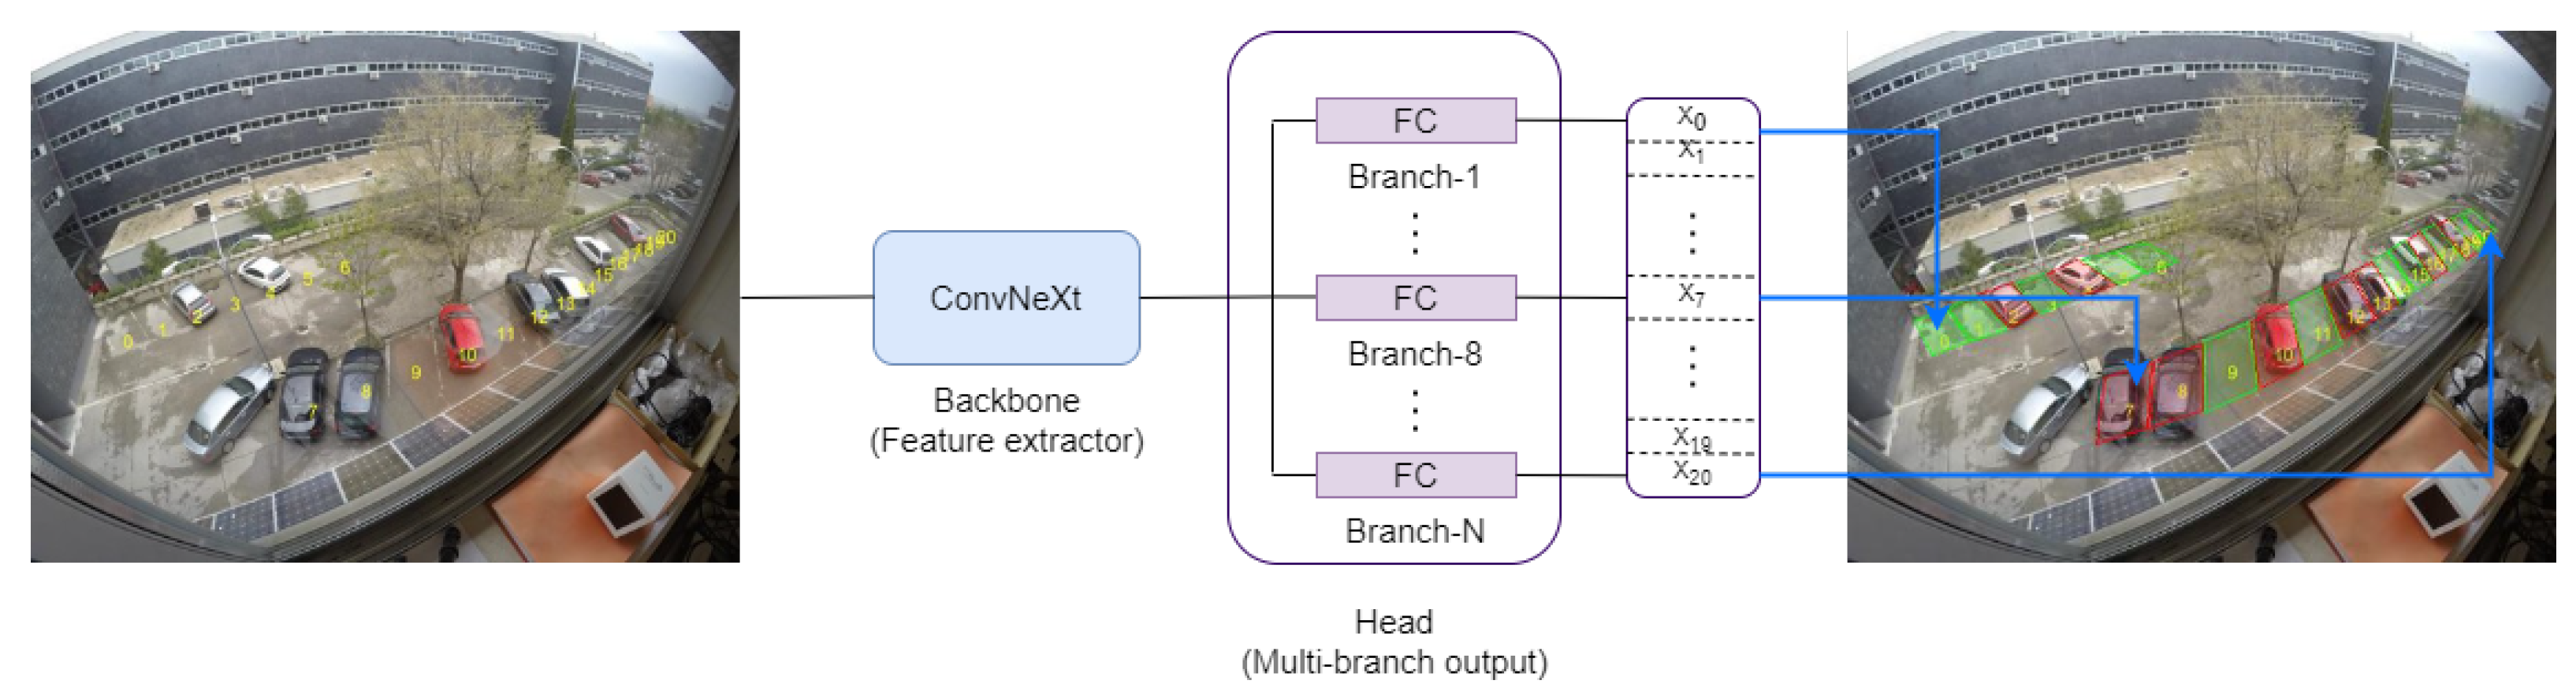
- A new architecture is proposed, composed by multiple neural network output branches where each branch utilizes all available contextual image information to specifically analyze and predict a single parking slot. In this architecture, each branch is responsible for adapting the system to the unique needs and characteristics (perspective, distortions, etc.) of its assigned slot. By analyzing all available information in a personalized manner for each parking slot, each branch is better equipped to handle challenging scenarios.
- Each parking slot is simultaneously predicted in parallel by a dedicated branch in the MBONN. This allows all slots to be predicted at the same time, in contrast to state-of-the-art approaches that predict serially one slot at a time. Consequently, the proposed MBONN significantly reduces computational complexity.
- The annotation process is simplified by the proposed system, which does not require exhaustive boundary information to locate each parking slot, unlike other state-of-the-art approaches. For ground-truth annotations, only the occupancy status is necessary. However, although the system does not receive explicit information about the order of the parking slots during training, it implicitly learns to locate them because the occupancy information is consistently provided in the same order. Specifically, since the annotator always follows a predetermined order when annotating the slots, the system learns to associate each occupancy status with the corresponding parking slot during training, without being explicitly informed about the order.
2. Applied Methodology
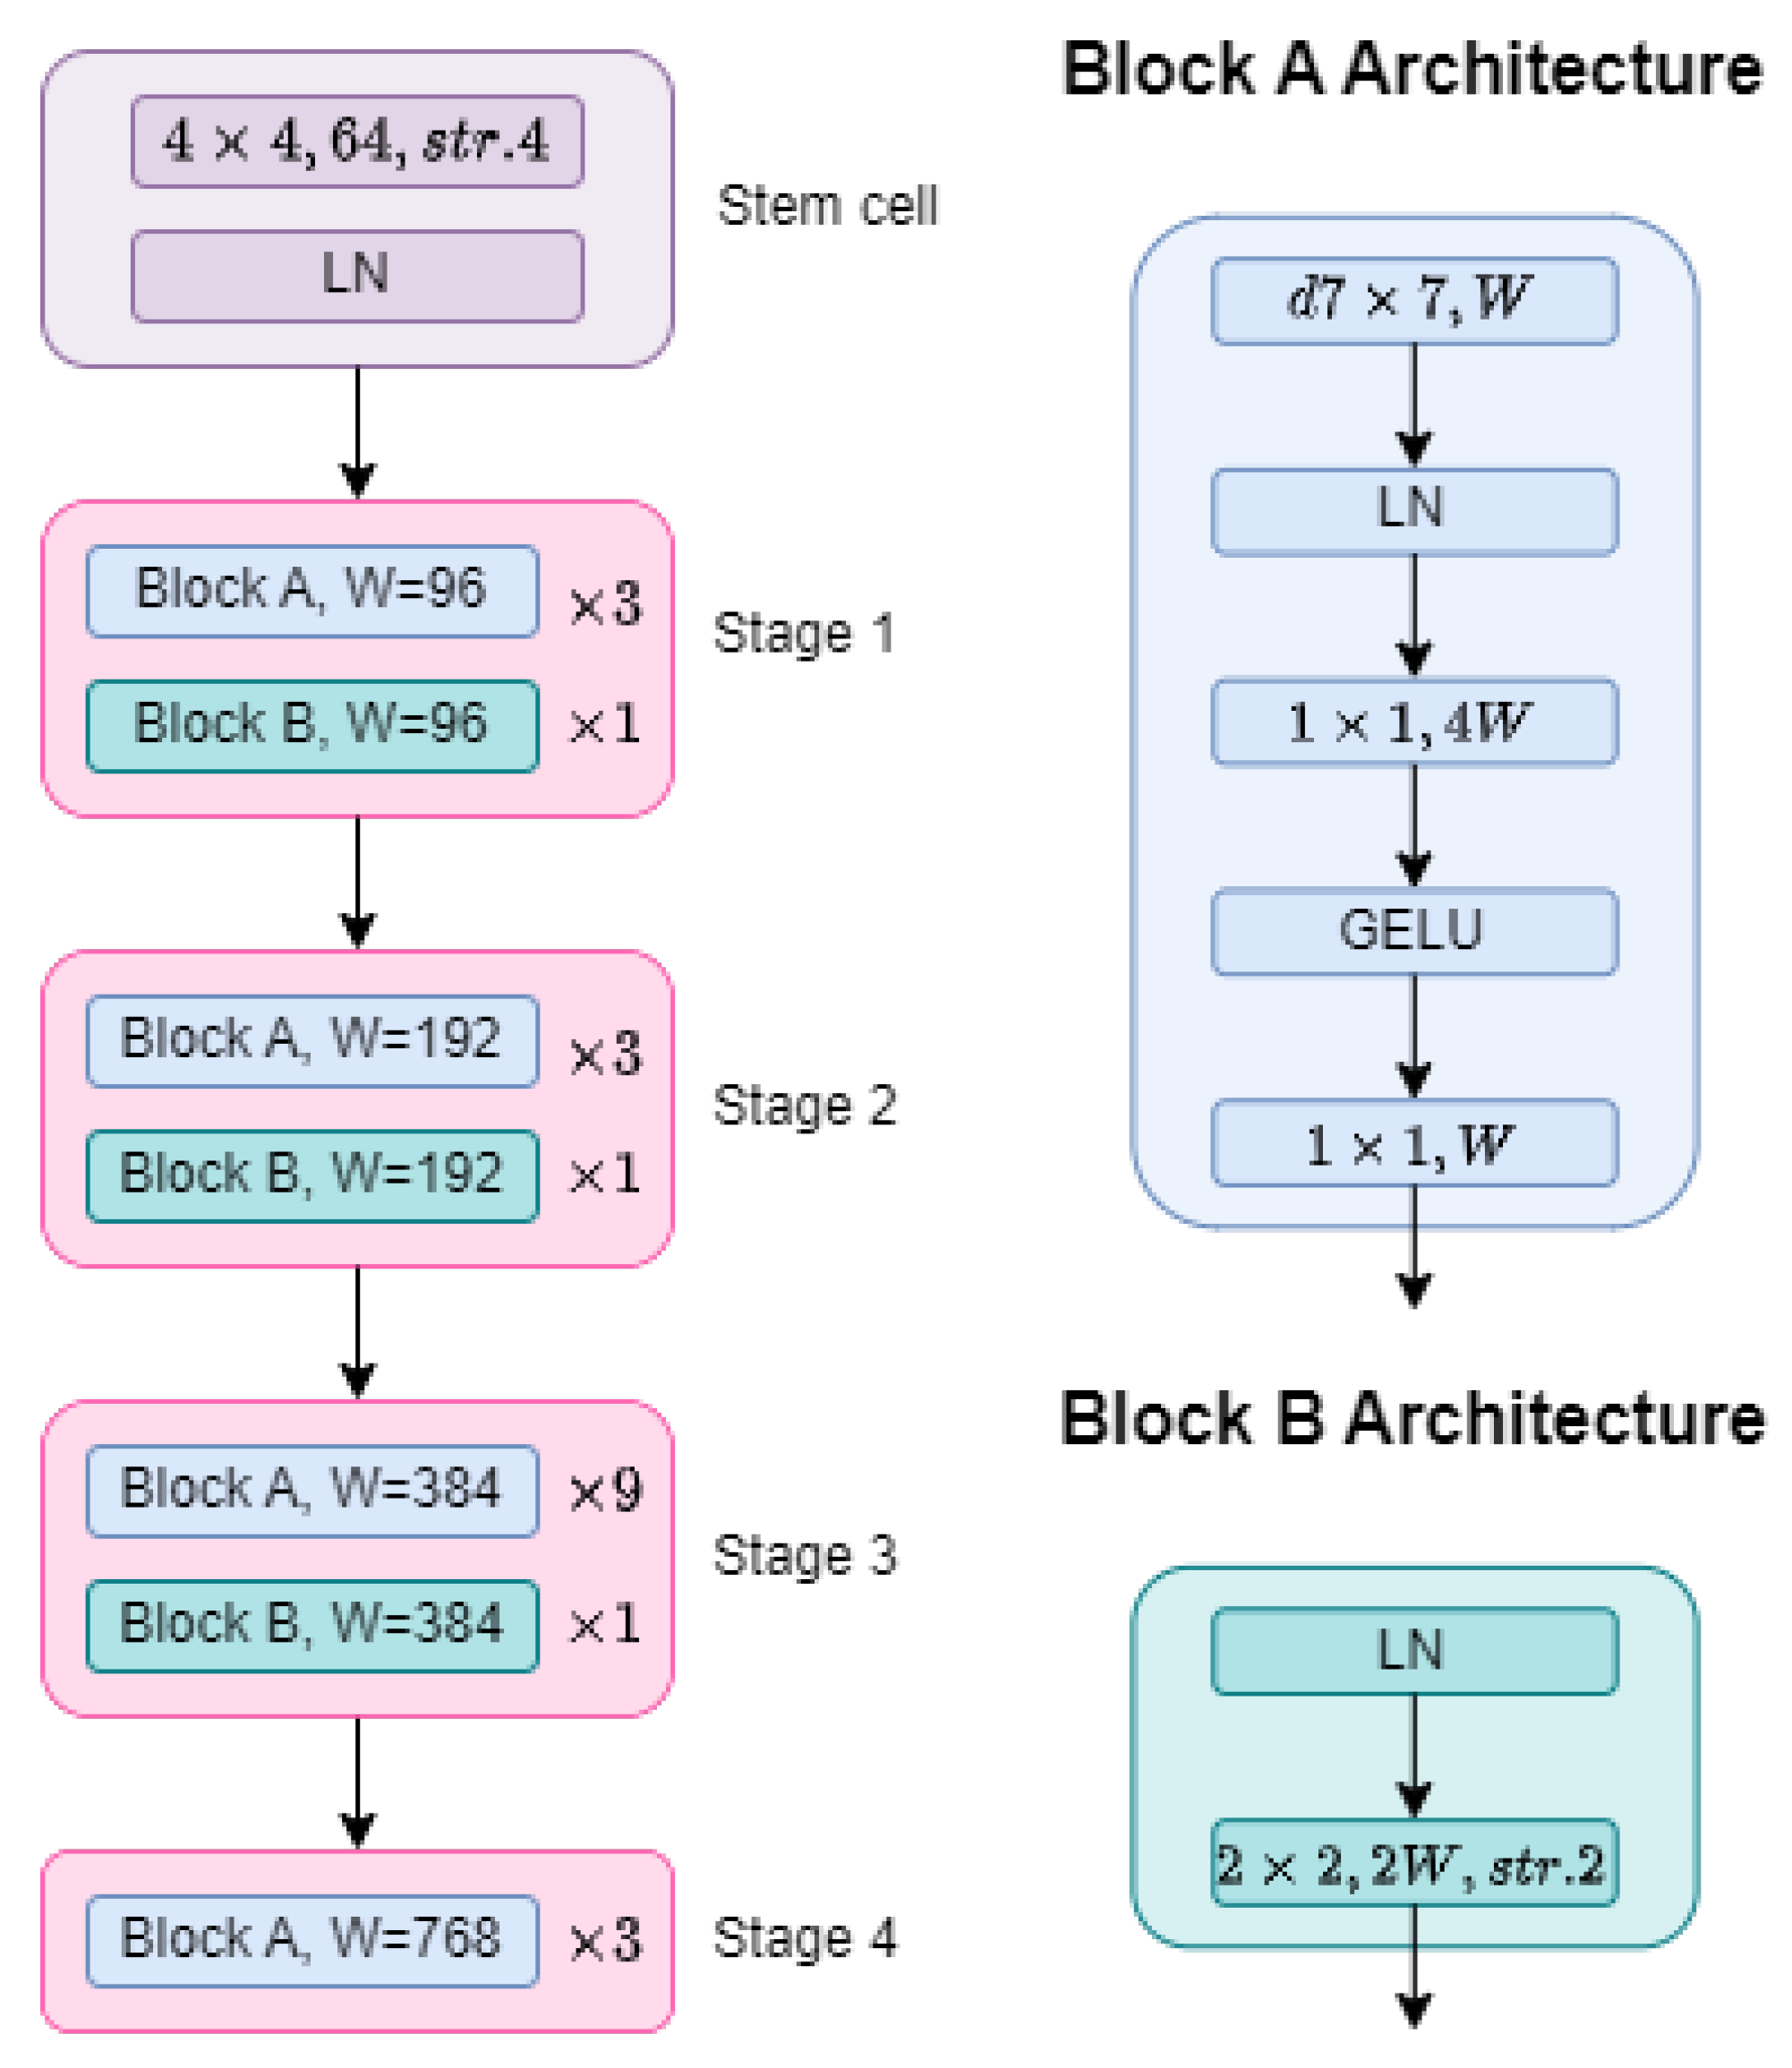
2.1. ConvNeXt-Based Backbone
2.2. Multi-Branch Output
2.3. Network Training
2.4. Metrics
3. Results
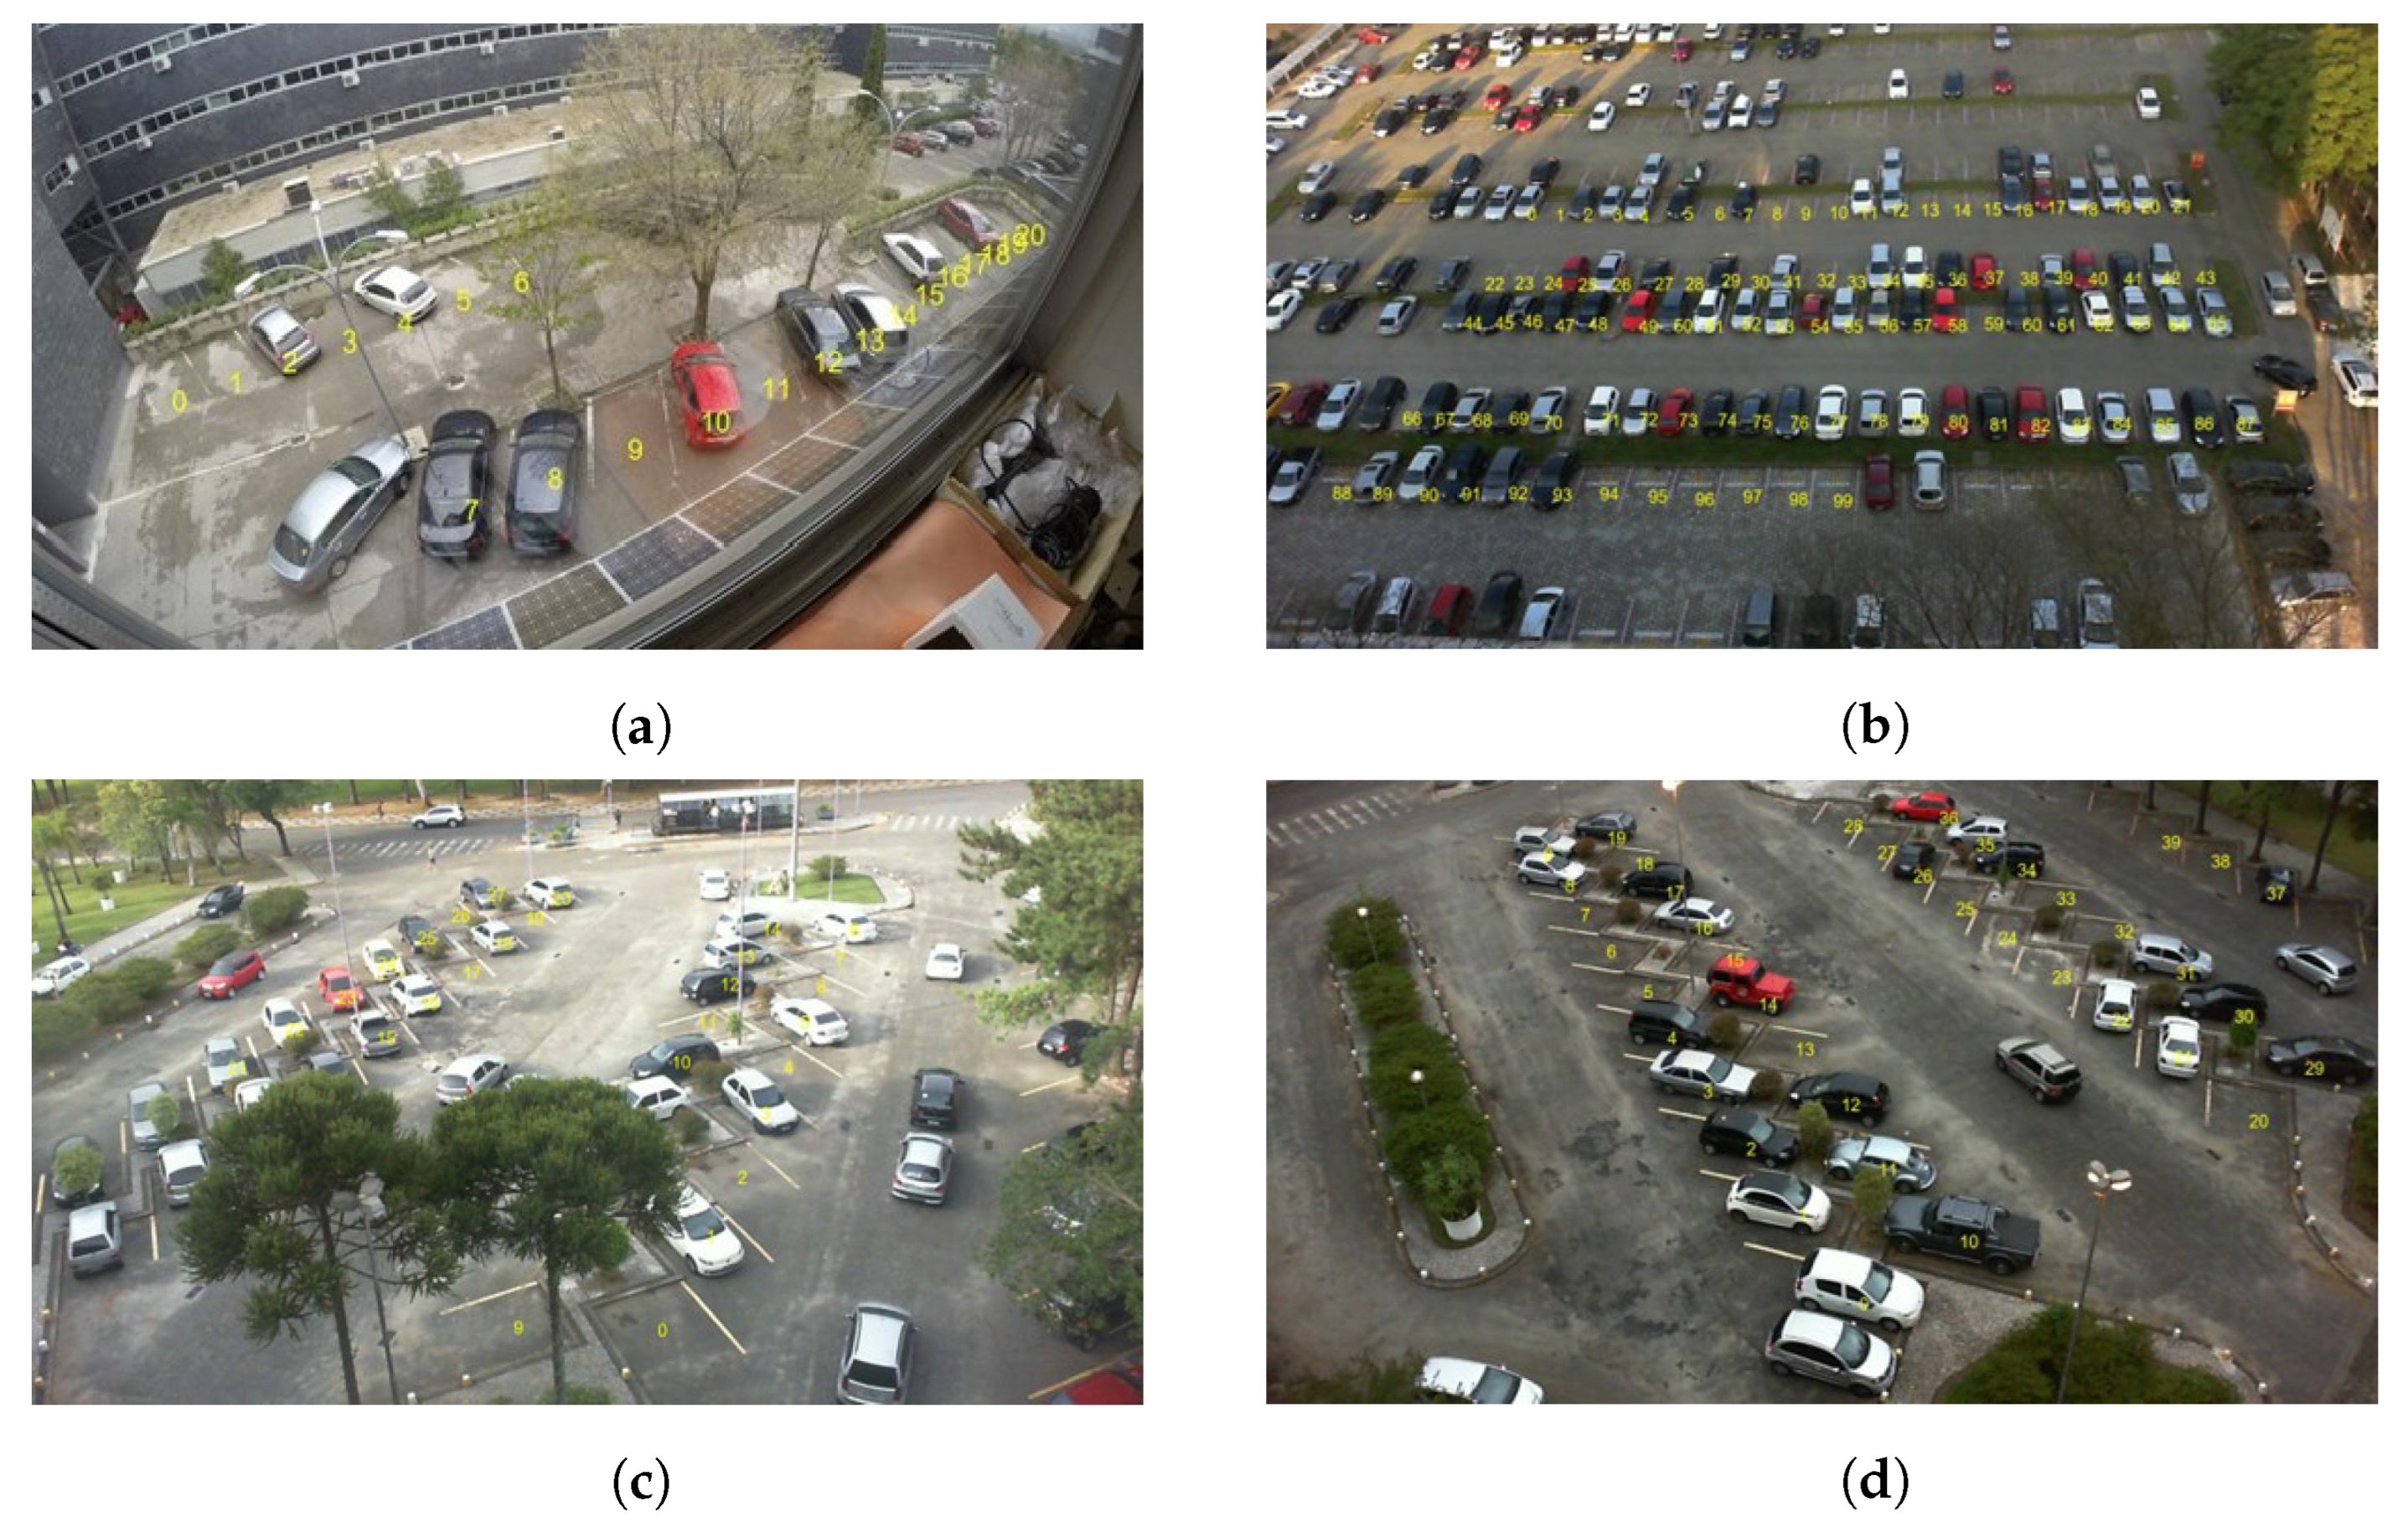
3.1. Datasets
3.2. Quantitative Results
3.2.1. Comparison with Different Backbones
3.2.2. Sensitivity Analysis of the System
3.2.3. Comparison with State-of-the-Art Works
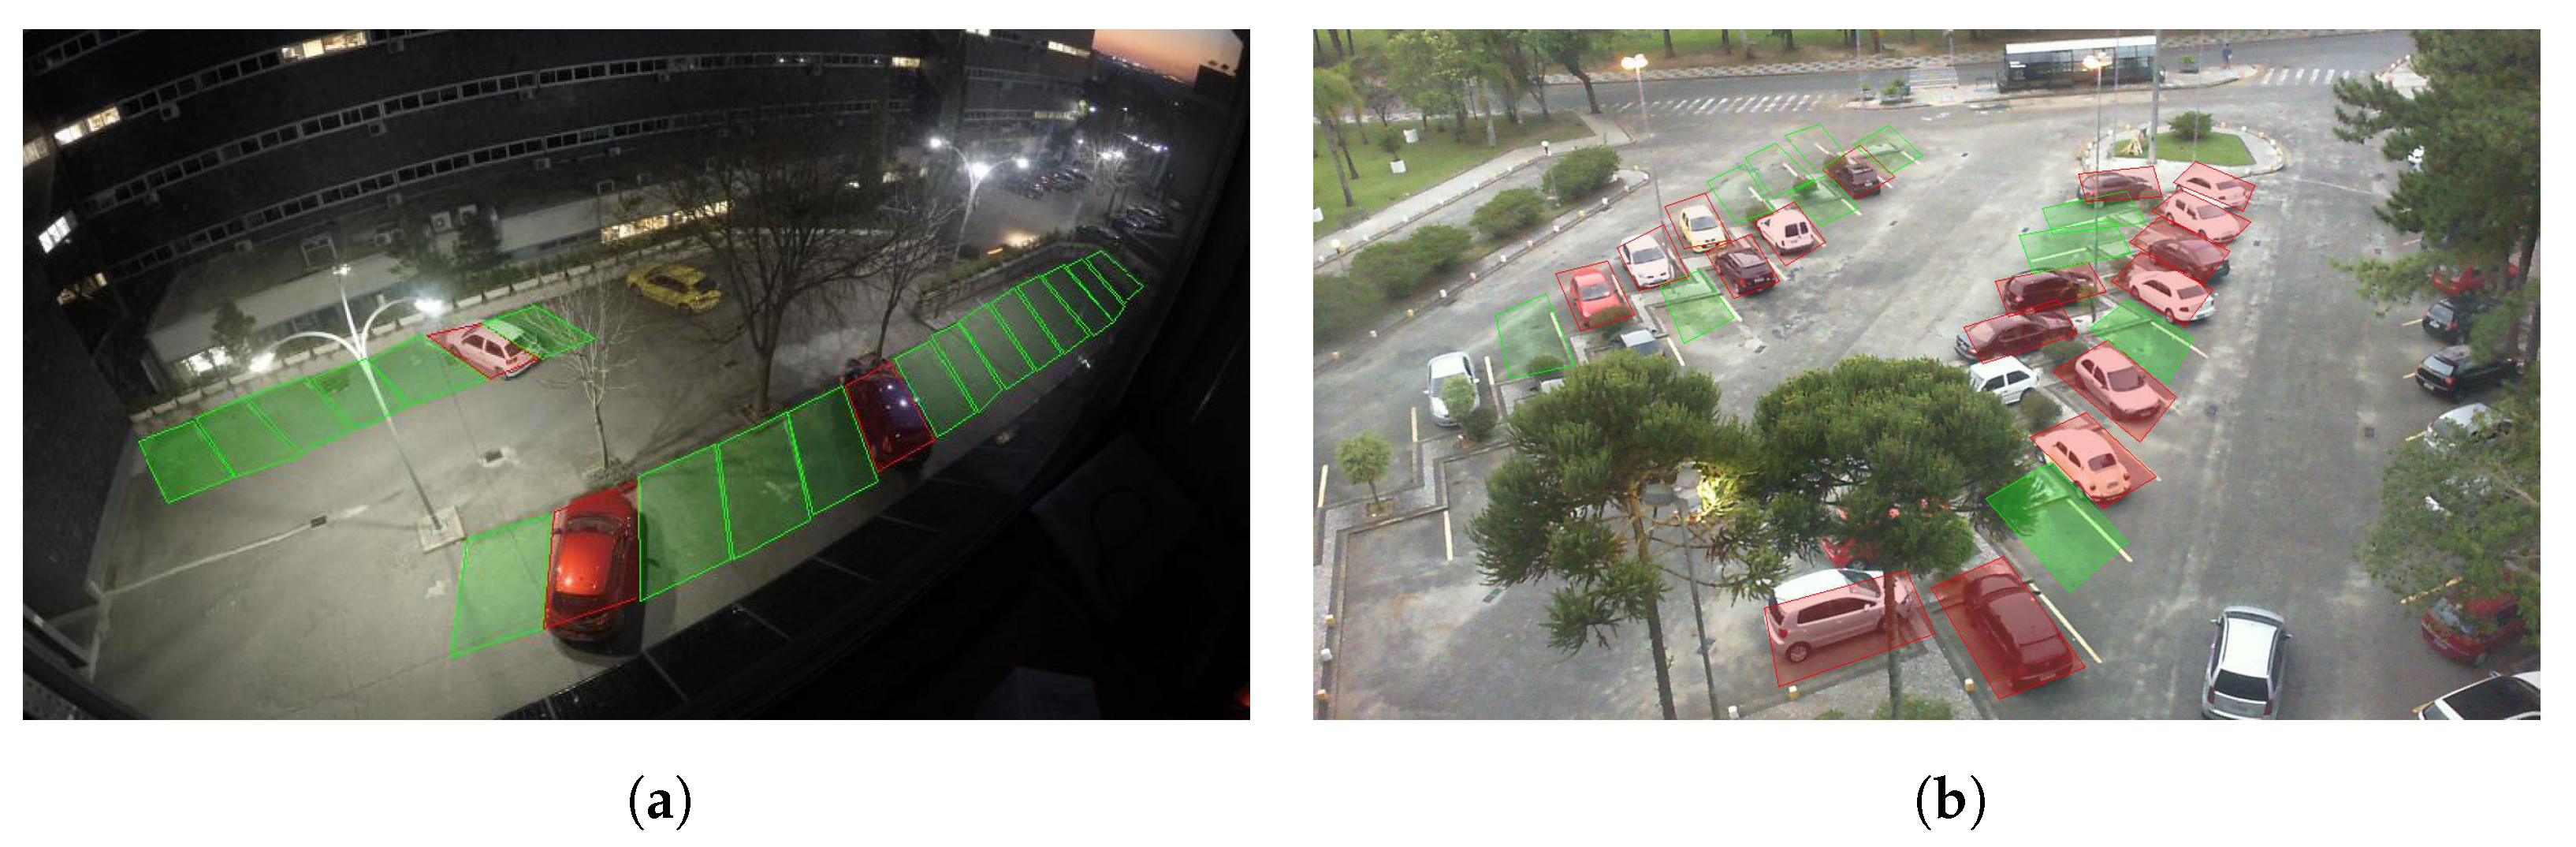
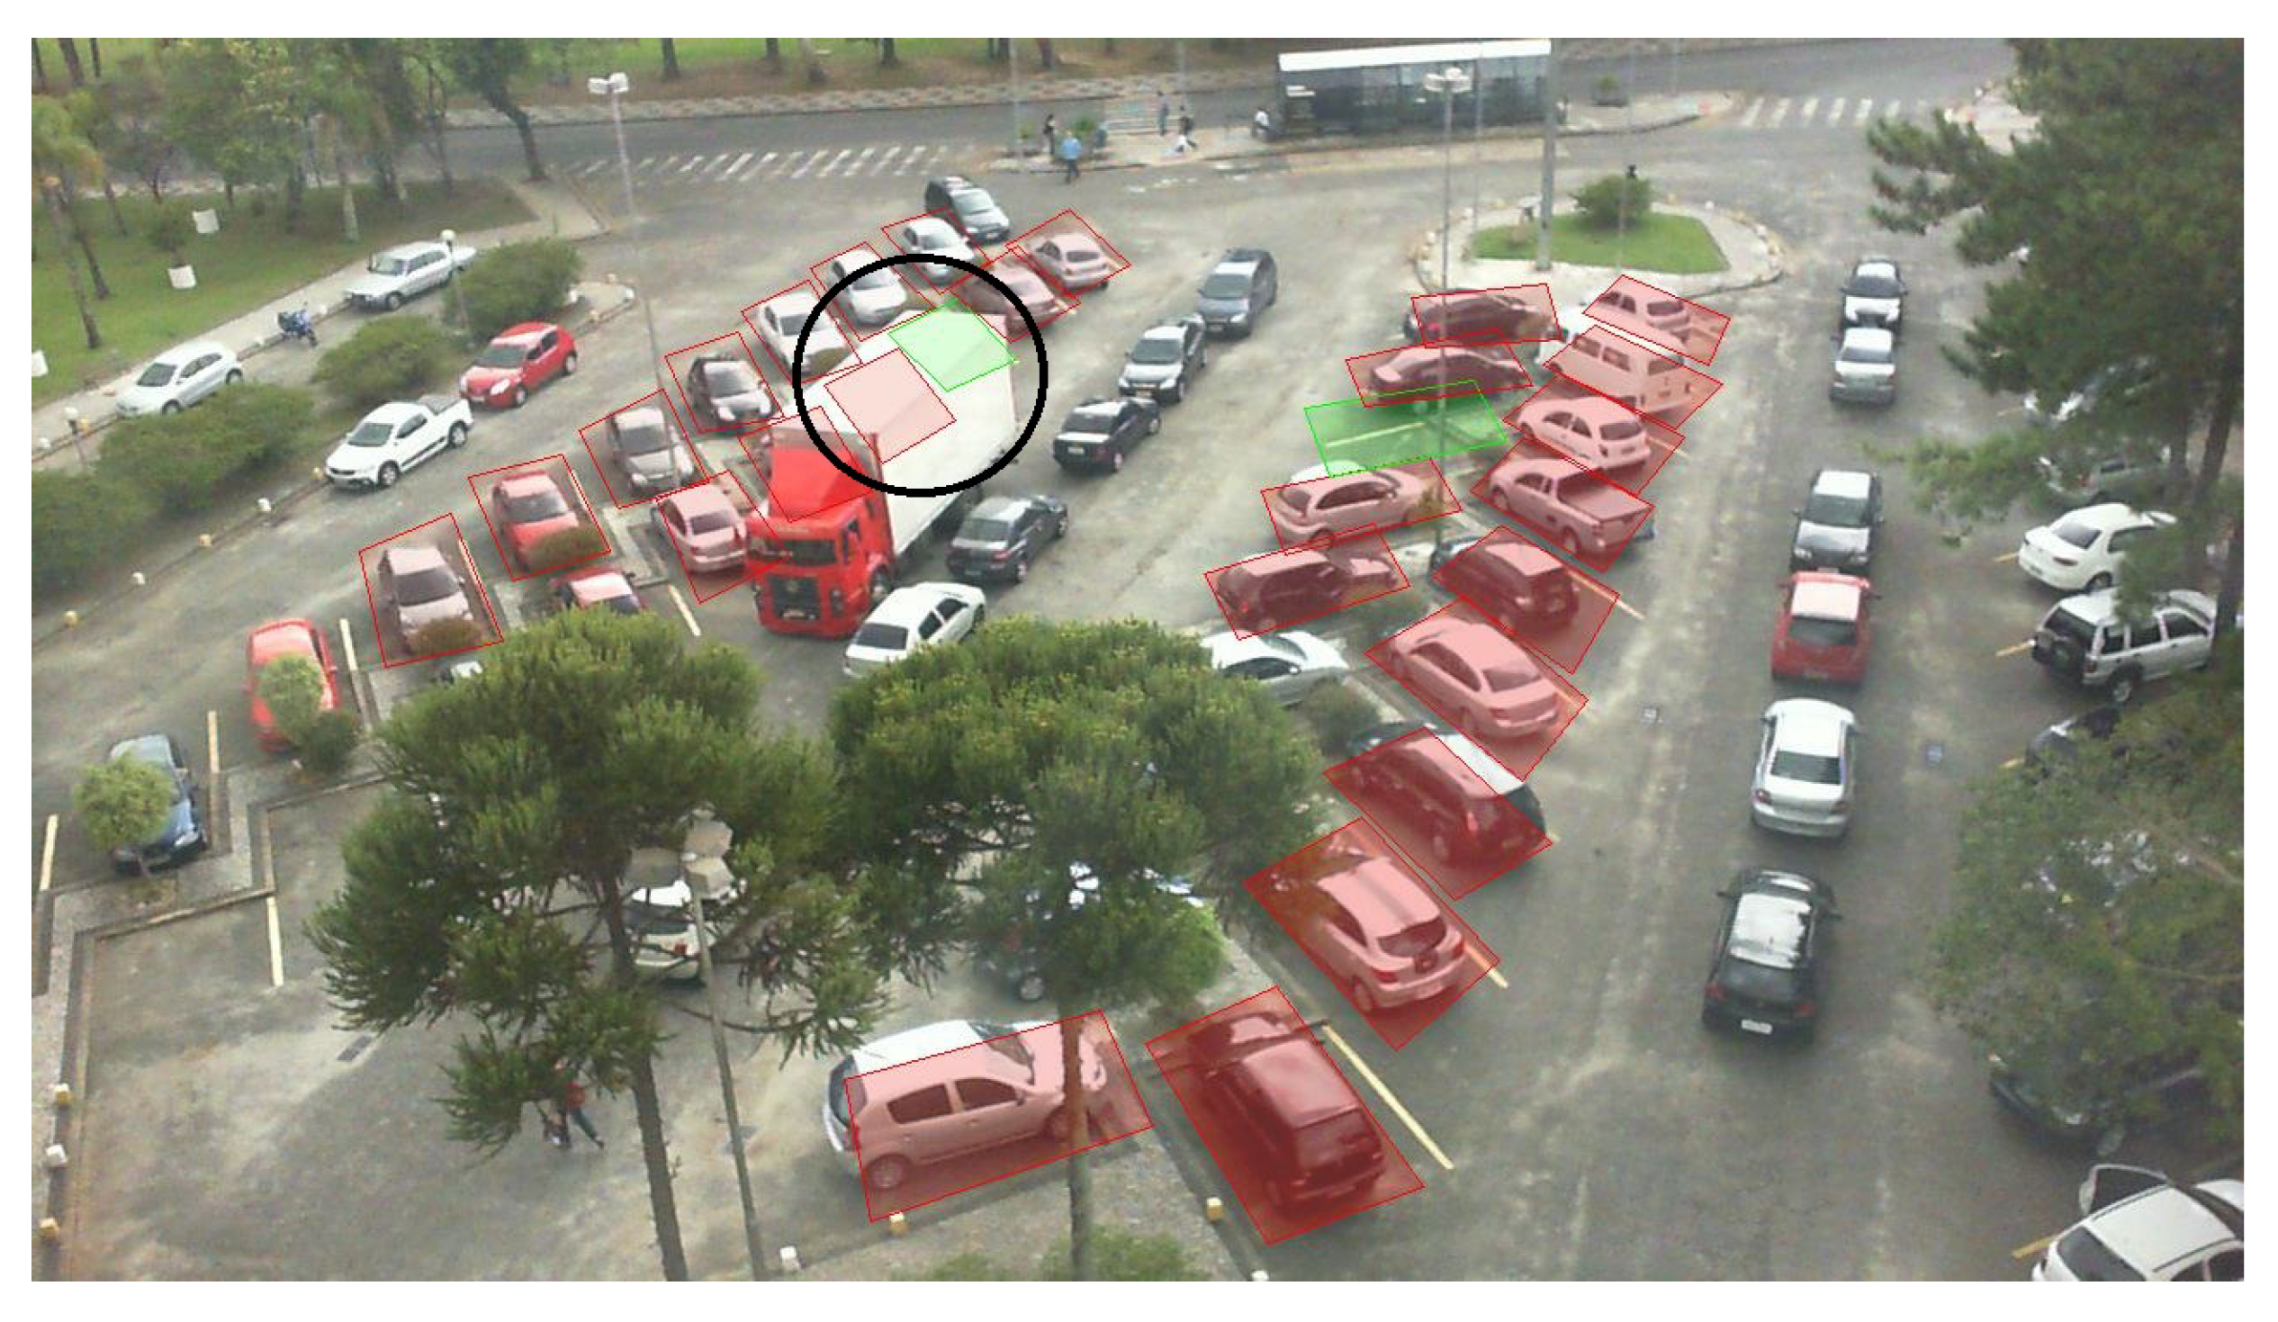
3.3. Qualitative Results
4. Discussion
Author Contributions
Funding
Institutional Review Board Statement
Informed Consent Statement
Data Availability Statement
Conflicts of Interest
Abbreviations
| AADT | Annual Average Daily Traffic |
| BN | Batch Normalization |
| CNN | Convolutional Neural Network |
| FC | Fully Connected |
| FN | False Negative |
| FP | False Positive |
| GELU | Gaussian Error Linear Unit |
| LN | Layer Normalization |
| MBONN | Multi-Branch Output Neural Network |
| ReLU | Rectified Linear Unit |
| TN | True Negative |
| TP | True Positive |
References
- Dirección General de Carreteras. Estudio de la Intensidad Media Diaria de Vehículos (IMD); Technical Report; Ministerio de Transportes, Movilidad y Agenda Urbana: Madrid, Spain, 2021; pp. 19–32. [Google Scholar]
- Ma, Y.; Liu, Y.; Zhang, L.; Cao, Y.; Guo, S.; Li, H. Research Review on Parking Space Detection Method. Symmetry 2021, 13, 128. [Google Scholar] [CrossRef]
- Ponnambalam, C.T.; Donmez, B. Searching for Street Parking: Effects on Driver Vehicle Control, Workload, Physiology, and Glances. Front. Psychol. 2020, 11, 574262. [Google Scholar] [CrossRef] [PubMed]
- People Spend 17 Hours a Year Looking for a Parking Space. Available online: https://www.parking.net/parking-industry-blog/parking-network/eight-surprising-facts-about-parking (accessed on 3 March 2023).
- City Parking Solutions Throughout the Time. Available online: https://www.nwave.io/city-parking-solutions/ (accessed on 3 March 2023).
- Problem of Parking in Urban Areas and their Possible Solutions. Available online: https://countercurrents.org/2021/07/problem-of-parking-in-urban-areas-and-their-possible-solutions/ (accessed on 3 March 2023).
- Paidi, V.; Fleyeh, H.; Håkansson, J.; Nyberg, R.G. Smart parking sensors, technologies and applications for open parking lots: A review. IET Intell. Transp. Syst. 2018, 12, 735–741. [Google Scholar] [CrossRef]
- Almeida, P.; Oliveira, L.S.; Silva, E.; Britto, A.; Koerich, A. Parking Space Detection Using Textural Descriptors. In Proceedings of the 2013 IEEE International Conference on Systems, Man, and Cybernetics, Manchester, UK, 13–16 October 2013; pp. 3603–3608. [Google Scholar] [CrossRef]
- Kadhim, M.H. Arduino Smart Parking Manage System based on Ultrasonic. Int. J. Eng. Technol. 2018, 7, 494–501. [Google Scholar]
- Shi, F.; Wu, D.; Arkhipov, D.I.; Liu, Q.; Regan, A.C.; McCann, J.A. ParkCrowd: Reliable Crowdsensing for Aggregation and Dissemination of Parking Space Information. IEEE Trans. Intell. Transp. Syst. 2019, 20, 4032–4044. [Google Scholar] [CrossRef]
- Chen, J.Y.; Hsu, C.M. A visual method for the detection of available parking slots. In Proceedings of the 2017 IEEE International Conference on Systems, Man, and Cybernetics, Banff, AB, Canada, 5–8 October 2017; pp. 2980–2985. [Google Scholar] [CrossRef]
- Xiang, X.; Lv, N.; Zhai, M.; Saddik, A.E. Real-Time Parking Occupancy Detection for Gas Stations Based on Haar-AdaBoosting and CNN. IEEE Sens. J. 2017, 17, 6360–6367. [Google Scholar] [CrossRef]
- Varghese, A.; Sreelekha, G. An Efficient Algorithm for Detection of Vacant Spaces in Delimited and Non-Delimited Parking Lots. IEEE Trans. Intell. Transp. Syst. 2020, 21, 4052–4062. [Google Scholar] [CrossRef]
- de Almeida, P.R.; Oliveira, L.S.; Britto, A.S.; Silva, E.J.; Koerich, A.L. PKLot—A robust dataset for parking lot classification. Expert Syst. Appl. 2015, 42, 4937–4949. [Google Scholar] [CrossRef]
- Vítek, S.; Melničuk, P. A Distributed Wireless Camera System for the Management of Parking Spaces. Sensors 2018, 18, 69. [Google Scholar] [CrossRef]
- Simonyan, K.; Zisserman, A. Very deep convolutional networks for large-scale image recognition. arXiv 2014, arXiv:1409.1556. [Google Scholar] [CrossRef]
- Amato, G.; Carrara, F.; Falchi, F.; Gennaro, C.; Meghini, C.; Vairo, C. Deep learning for decentralized parking lot occupancy detection. Expert Syst. Appl. 2017, 72, 327–334. [Google Scholar] [CrossRef]
- Farley, A.; Ham, H.; Hendra. Real Time IP Camera Parking Occupancy Detection using Deep Learning. Procedia Comput. Sci. 2021, 179, 606–614. [Google Scholar] [CrossRef]
- Rahman, S.; Ramil, M.; Arnia, F.; Muharar, R.; Ikhwan, M.; Munzir, S. Enhancement of convolutional neural network for urban environment parking space classification. Glob. J. Environ. Sci. Manag.—GJESM 2022, 8, 315–326. [Google Scholar] [CrossRef]
- Ellis, J.D.; Harris, A.; Saquer, N.; Iqbal, R. An Analysis of Lightweight Convolutional Neural Networks for Parking Space Occupancy Detection. In Proceedings of the 2021 IEEE International Symposium on Multimedia (ISM), Naple, Italy, 29 November 2021–1 December 2021; pp. 261–268. [Google Scholar] [CrossRef]
- Nyambal, J.; Klein, R. Automated Parking Space Detection Using Convolutional Neural Networks. arXiv 2021, arXiv:2106.07228. [Google Scholar] [CrossRef]
- Šćekić, Z.; Čakić, S.; Popović, T.; Jakovljević, A. Image-Based Parking Occupancy Detection Using Deep Learning and Faster R-CNN. In Proceedings of the 2022 26th International Conference on Information Technology (IT), Zabljak, Montenegro, 16–19 February 2022; pp. 1–5. [Google Scholar] [CrossRef]
- Muhammad, S.S.; Hayawi, D.M.J. Detection parking Spaces by using the ResNet50 Algorithm. J. Al-Qadisiyah Comput. Sci. Math. 2022, 14, 11. [Google Scholar]
- Rafique, S.; Gul, S.; Jan, K.; Khan, G.M. Optimized real-time parking management framework using deep learning. Expert Syst. Appl. 2023, 220, 119686. [Google Scholar] [CrossRef]
- Vu, H.T.; Huang, C.C. Parking Space Status Inference Upon a Deep CNN and Multi-Task Contrastive Network with Spatial Transform. IEEE Trans. Circuits Syst. Video Technol. 2019, 29, 1194–1208. [Google Scholar] [CrossRef]
- ETSIT Parking Lot Occupancy Database. Available online: https://www.gti.ssr.upm.es/data/parking-lot-database (accessed on 15 February 2023).
- He, K.; Zhang, X.; Ren, S.; Sun, J. Deep residual learning for image recognition. In Proceedings of the IEEE Conference on Computer Vision and Pattern Recognition, Las Vegas, NV, USA, 27–30 June 2016; pp. 770–778. [Google Scholar] [CrossRef]
- Chollet, F. Xception: Deep learning with depthwise separable convolutions. In Proceedings of the IEEE Conference on Computer Vision and Pattern Recognition, Honolulu, HI, USA, 21–26 July 2017; pp. 1251–1258. [Google Scholar] [CrossRef]
- Zoph, B.; Vasudevan, V.; Shlens, J.; Le, Q.V. Learning transferable architectures for scalable image recognition. In Proceedings of the IEEE Conference on Computer Vision and Pattern Recognition, Salt Lake City, UT, USA, 18–23 June 2018; pp. 8697–8710. [Google Scholar] [CrossRef]
- Liu, Z.; Mao, H.; Wu, C.Y.; Feichtenhofer, C.; Darrell, T.; Xie, S. A convnet for the 2020s. In Proceedings of the IEEE/CVF Conference on Computer Vision and Pattern Recognition, New Orleans, LA, USA, 18–24 June 2022; pp. 11976–11986. [Google Scholar] [CrossRef]
- Yu, W.; Luo, M.; Zhou, P.; Si, C.; Zhou, Y.; Wang, X.; Feng, J.; Yan, S. Metaformer is actually what you need for vision. In Proceedings of the IEEE/CVF Conference on Computer Vision and Pattern Recognition, New Orleans, LA, USA, 18–24 June 2022; pp. 10819–10829. [Google Scholar] [CrossRef]
- Li, Y.; Wei, X.; Li, Y.; Dong, Z.; Shahidehpour, M. Detection of False Data Injection Attacks in Smart Grid: A Secure Federated Deep Learning Approach. IEEE Trans. Smart Grid 2022, 13, 4862–4872. [Google Scholar] [CrossRef]
- Ba, J.L.; Kiros, J.R.; Hinton, G.E. Layer Normalization. arXiv 2016, arXiv:1607.06450. [Google Scholar] [CrossRef]
- Philipp, G.; Song, D.; Carbonell, J.G. The exploding gradient problem demystified-definition, prevalence, impact, origin, tradeoffs, and solutions. arXiv 2017, arXiv:1712.05577. [Google Scholar] [CrossRef]
- Hendrycks, D.; Gimpel, K. Gaussian error linear units (gelus). arXiv 2016, arXiv:1606.08415. [Google Scholar] [CrossRef]
- Sandler, M.; Howard, A.; Zhu, M.; Zhmoginov, A.; Chen, L.C. MobileNetv2: Inverted residuals and linear bottlenecks. In Proceedings of the IEEE Conference on Computer Vision and Pattern Recognition, Salt Lake City, UT, USA, 18–23 June 2018; pp. 4510–4520. [Google Scholar] [CrossRef]
- Tan, M.; Le, Q. Efficientnet: Rethinking model scaling for convolutional neural networks. In Proceedings of the International Conference on Machine Learning, Long Beach, CA, USA, 9–15 June 2019; pp. 6105–6114. [Google Scholar] [CrossRef]
- Amadi, L.; Agam, G. Weakly Supervised 2D Pose Adaptation and Body Part Segmentation for Concealed Object Detection. Sensors 2023, 23, 2005. [Google Scholar] [CrossRef] [PubMed]
- Ruder, S. An overview of gradient descent optimization algorithms. arXiv 2016, arXiv:1609.04747. [Google Scholar] [CrossRef]


| Hyper-Parameter | Value |
|---|---|
| Learning rate | |
| Number of epochs | 50 |
| Batch size | 16 |
| Image size | 267 × 200 |
| Weight decay |
| Database | Total Images | Number of Parking Slots |
|---|---|---|
| ETSIT | 31,611 | 21 |
| PUCPR | 4474 | 100 |
| UFPR04 | 5104 | 28 |
| UFPR05 | 4153 | 40 |
| Resnet50 | Xception | NASNet (Large) | ConvNeXt (Base) | ConvNeXt (Tiny) | |
|---|---|---|---|---|---|
| ETSIT | 99.98 | 99.94 | 99.96 | 99.97 | 99.99 |
| PUCPR | 98.87 | 98.20 | 98.41 | 99.73 | 99.12 |
| UFPR04 | 99.95 | 99.87 | 99.92 | 99.94 | 99.95 |
| UFPR05 | 99.77 | 98.73 | 99.14 | 99.84 | 99.83 |
| Resnet50 | Xception | NASNet (Large) | ConvNeXt (Base) | ConvNeXt (Tiny) | |
|---|---|---|---|---|---|
| ETSIT | 0.0180 | 0.0990 | 0.0371 | 0.0225 | 0.0090 |
| PUCPR | 0.6000 | 0.9032 | 0.7612 | 0.2679 | 0.4751 |
| UFPR04 | 0.0771 | 0.1335 | 0.1073 | 0.1103 | 0.0760 |
| UFPR05 | 0.3098 | 0.7007 | 0.6074 | 0.2857 | 0.2177 |
| ETSIT | PUCPR | UFPR04 | UFPR05 | |
|---|---|---|---|---|
| Resnet50 | 155,730,837 | 155,811,812 | 155,738,012 | 155,750,312 |
| Xception | 153,004,605 | 153,085,580 | 153,011,780 | 153,024,080 |
| NASNetLarge | 345,051,751 | 345,132,726 | 345,058,926 | 345,071,226 |
| ConvNeXtBase | 137,920,661 | 138,001,636 | 137,927,836 | 137,940,136 |
| ConvNeXtTiny | 65,591,413 | 65,672,388 | 65,598,588 | 65,610,888 |
| Spot | Accuracy | Distortion Level |
|---|---|---|
| 0 | 100.00 | Low |
| 1 | 100.00 | Low |
| 2 | 100.00 | Low |
| 3 | 100.00 | Low |
| 4 | 100.00 | Low |
| 5 | 99.97 | Medium |
| 6 | 99.97 | Medium |
| 7 | 100.00 | Low |
| 8 | 100.00 | Low |
| 9 | 100.00 | Low |
| 10 | 100.00 | Low |
| 11 | 100.00 | Medium |
| 12 | 100.00 | Medium |
| 13 | 100.00 | Medium |
| 14 | 100.00 | Medium |
| 15 | 100.00 | High |
| 16 | 100.00 | High |
| 17 | 100.00 | High |
| 18 | 100.00 | High |
| 18 | 100.00 | High |
| 20 | 100.00 | High |
| Scenario | Accuracy | Light Level |
|---|---|---|
| Day | 100.00 | High |
| Light | 99.99 | Low |
| PUCPR | UFPR04 | UFPR05 | PKLot | |
|---|---|---|---|---|
| LQP + SVM [14] | 99.58% | 99.55% | 98.90% | 99.34% |
| HOG + SVM [15] | 94.00% | 96.00% | 83.00% | 91.00% |
| Background subtraction + SVM [13] | N/A | 99.72% | N/A | N/A |
| ResNet50 [23] | N/A | N/A | N/A | 99.67% |
| mAlexNet [17] | 99.90% | 99.54% | 99.49% | 99.64% |
| YOLOv5 [24] | N/A | N/A | N/A | 99.50% |
| LeNet [21] | N/A | N/A | N/A | 93.00% |
| ConvNeXt (Tiny) multi-branch system | 98.30% | 99.73% | 99.38% | 99.14% |
| ETSIT | |
|---|---|
| mAlexNet [17] | 99.93% |
| ConvNeXtTiny multi-branch system | 99.99% |
Disclaimer/Publisher’s Note: The statements, opinions and data contained in all publications are solely those of the individual author(s) and contributor(s) and not of MDPI and/or the editor(s). MDPI and/or the editor(s) disclaim responsibility for any injury to people or property resulting from any ideas, methods, instructions or products referred to in the content. |
© 2023 by the authors. Licensee MDPI, Basel, Switzerland. This article is an open access article distributed under the terms and conditions of the Creative Commons Attribution (CC BY) license (https://creativecommons.org/licenses/by/4.0/).
Share and Cite
Encío, L.; Díaz, C.; del-Blanco, C.R.; Jaureguizar, F.; García, N. Visual Parking Occupancy Detection Using Extended Contextual Image Information via a Multi-Branch Output ConvNeXt Network. Sensors 2023, 23, 3329. https://doi.org/10.3390/s23063329
Encío L, Díaz C, del-Blanco CR, Jaureguizar F, García N. Visual Parking Occupancy Detection Using Extended Contextual Image Information via a Multi-Branch Output ConvNeXt Network. Sensors. 2023; 23(6):3329. https://doi.org/10.3390/s23063329
Chicago/Turabian StyleEncío, Leyre, César Díaz, Carlos R. del-Blanco, Fernando Jaureguizar, and Narciso García. 2023. "Visual Parking Occupancy Detection Using Extended Contextual Image Information via a Multi-Branch Output ConvNeXt Network" Sensors 23, no. 6: 3329. https://doi.org/10.3390/s23063329
APA StyleEncío, L., Díaz, C., del-Blanco, C. R., Jaureguizar, F., & García, N. (2023). Visual Parking Occupancy Detection Using Extended Contextual Image Information via a Multi-Branch Output ConvNeXt Network. Sensors, 23(6), 3329. https://doi.org/10.3390/s23063329