


Intraoperative Beat-to-Beat Pulse Transit Time (PTT) Monitoring via Non-Invasive Piezoelectric/Piezocapacitive Peripheral Sensors Can Predict Changes in Invasively Acquired Blood Pressure in High-Risk Surgical Patients

 ,
,  ,
,
Abstract
1. Introduction
2. Methods
2.1. Study Design
2.2. Study Inclusion and Exclusion Criteria
2.3. Study Protocol
2.4. Data Analysis
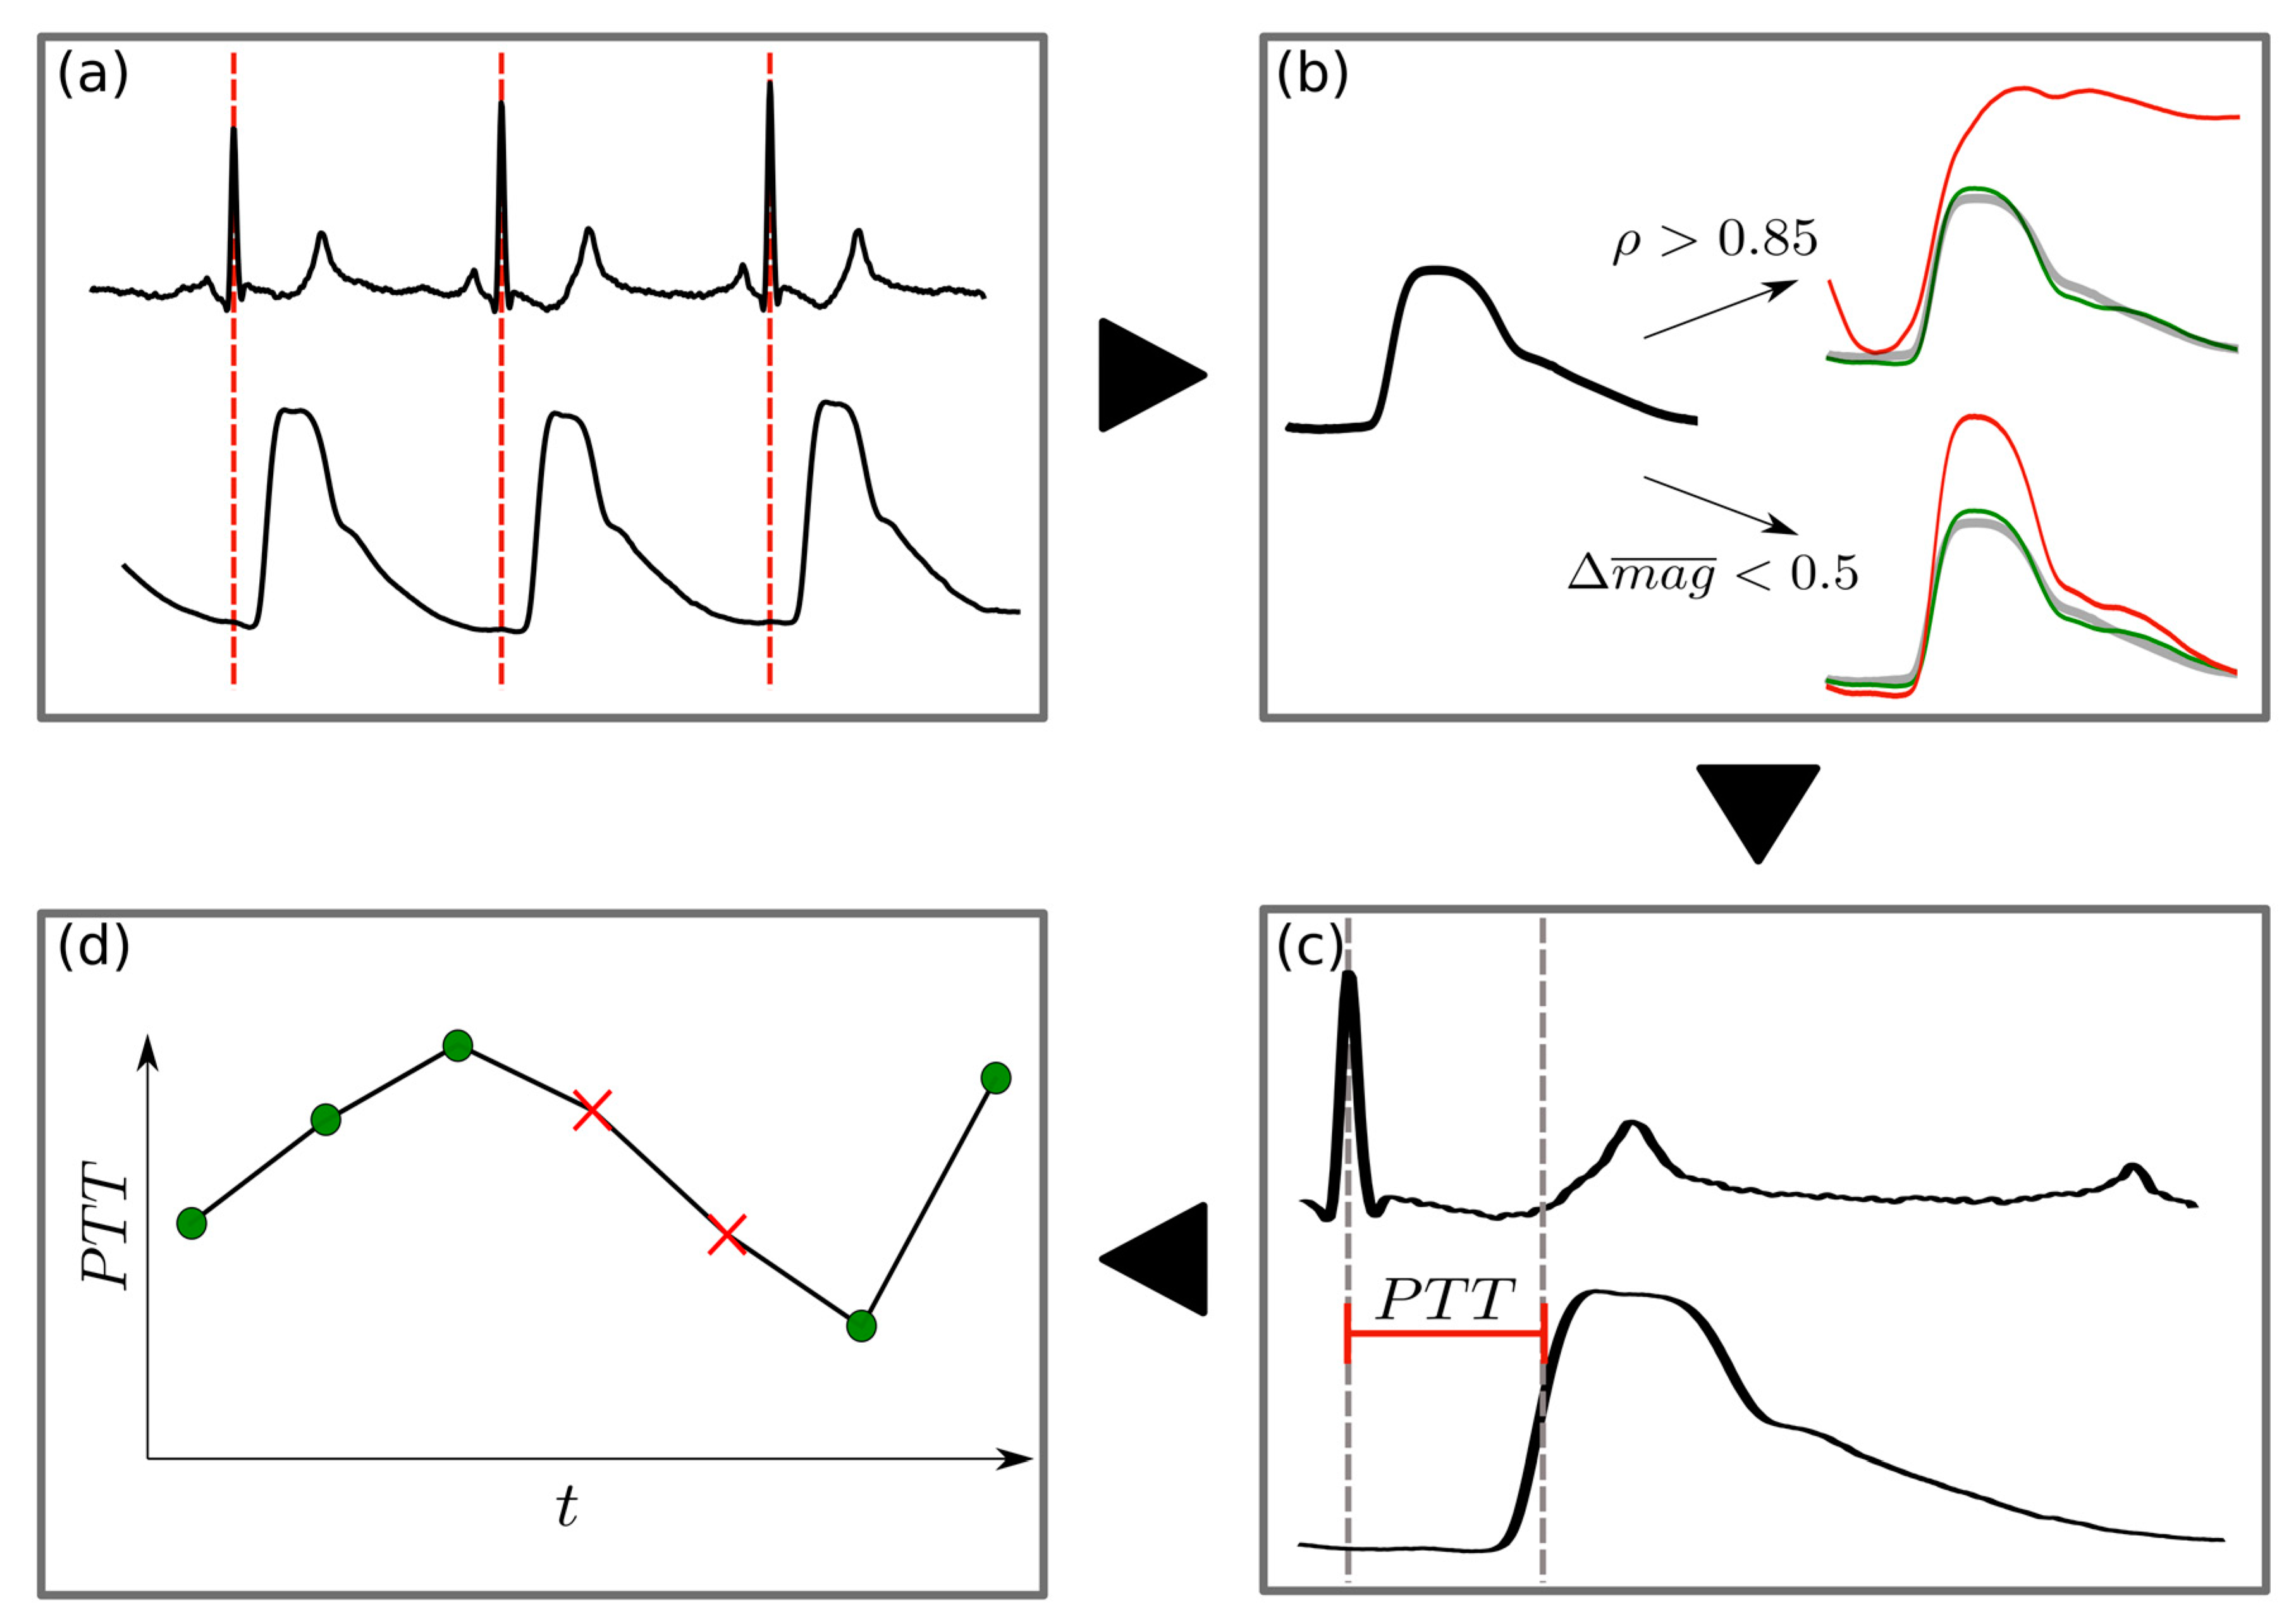
- ρ > 0.85;
- The absolute relative difference in magnitude from the mean PW (Δmag) was less than 0.5;
2.5. Statistical Analysis
3. Results
3.1. PW Reliability Detection
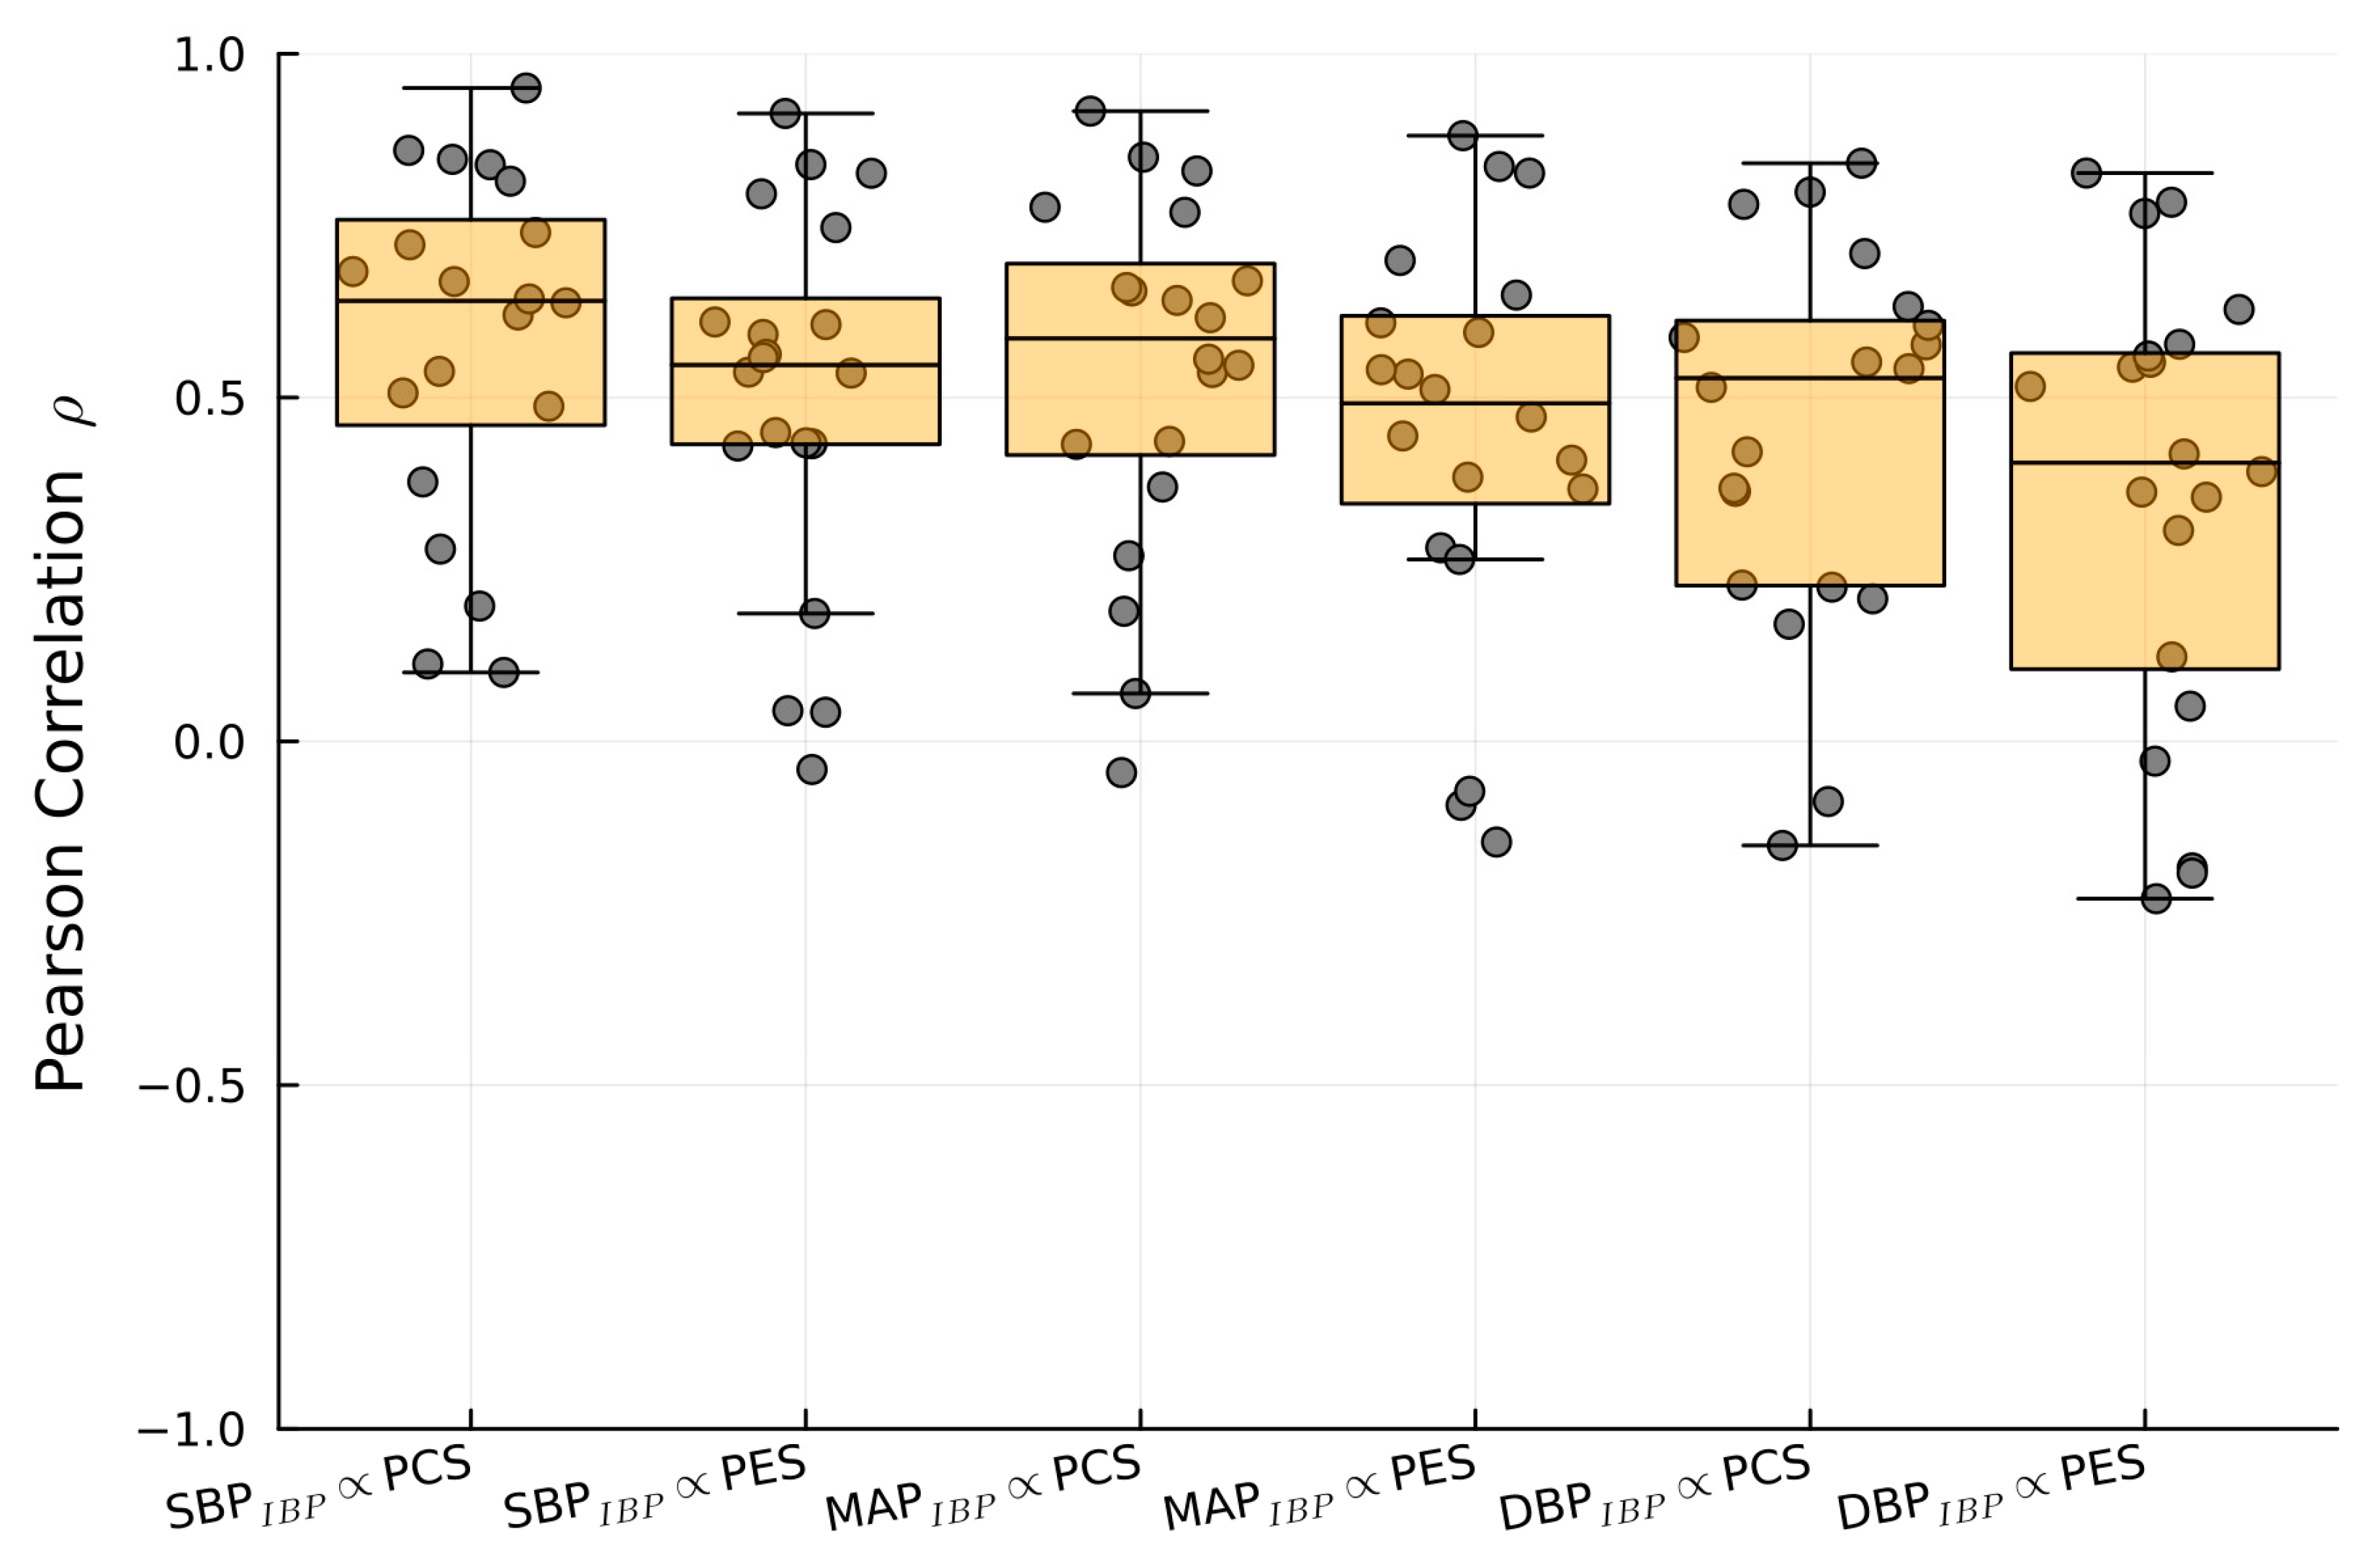
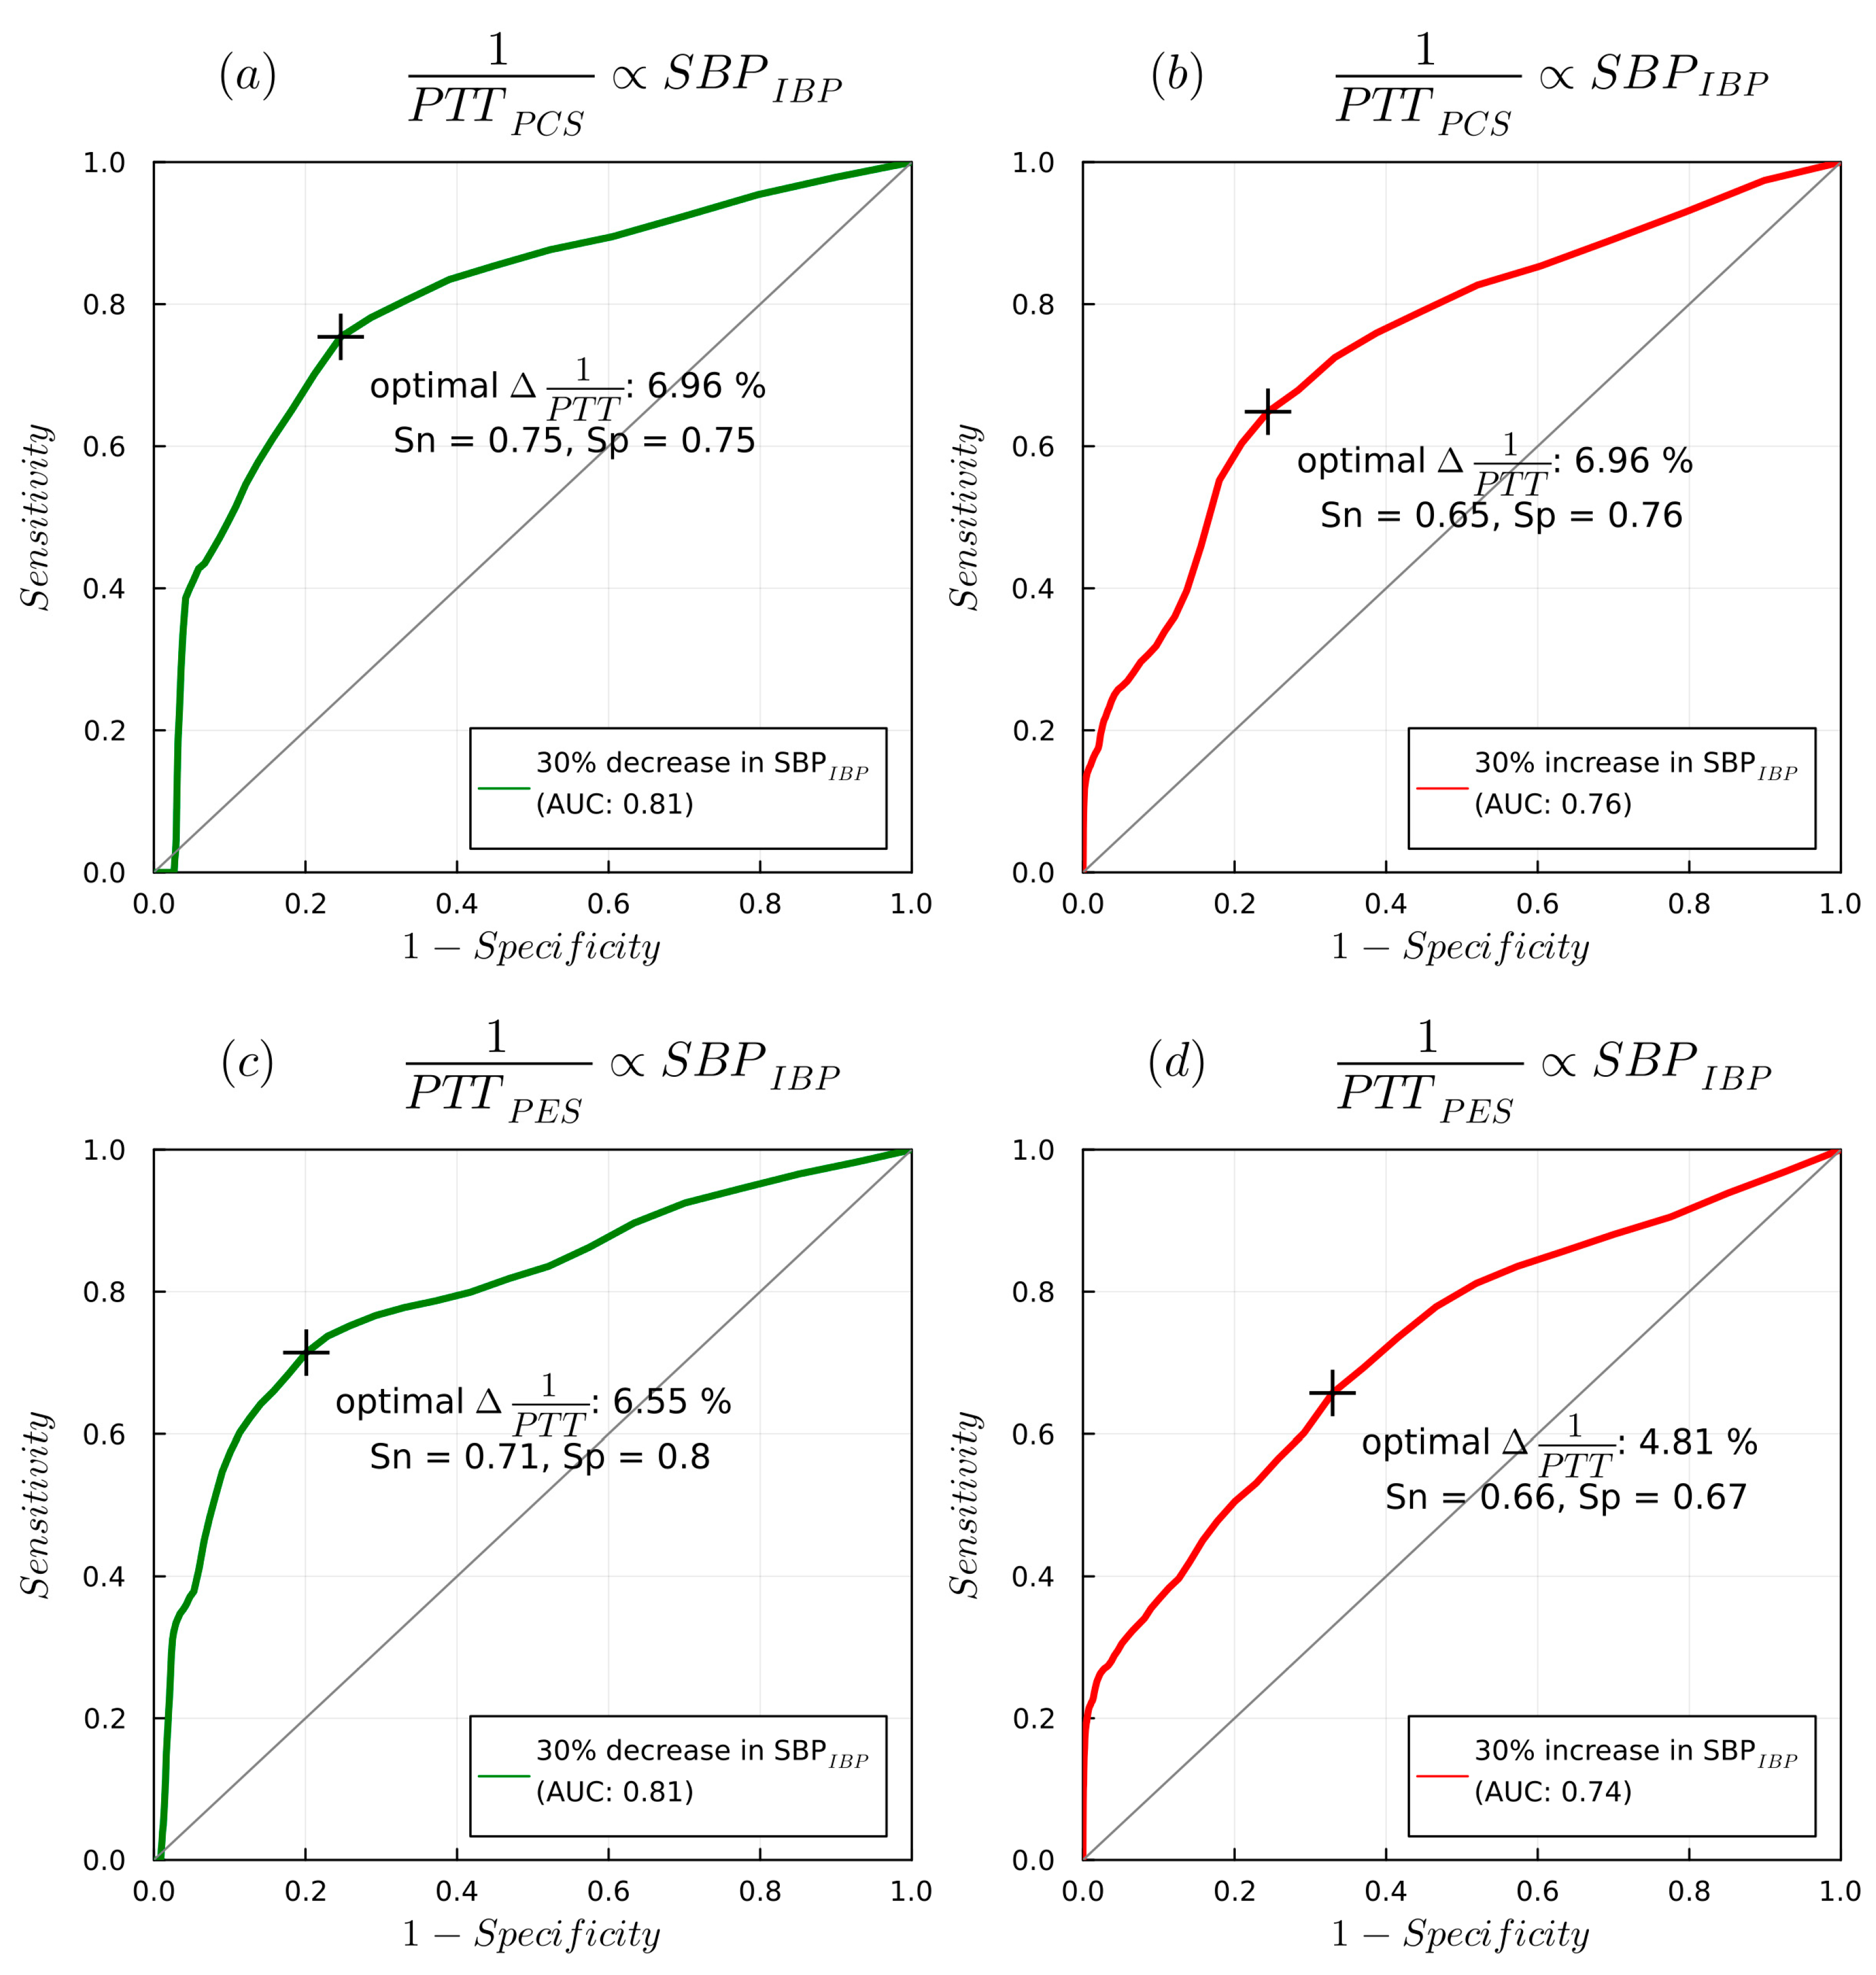
3.2. 1/PTT and IBP: Correlations and Predictive Capabilities
4. Discussion
4.1. PW Analysis and Prior PES/PEC Research
4.2. PTT: Correlation and Predictive Capabilities
4.3. Limitations
4.4. Summary and Future Applications
Author Contributions
Funding
Institutional Review Board Statement
Informed Consent Statement
Data Availability Statement
Conflicts of Interest
References
- ReferencesLonjaret, L.; Lairez, O.; Geeraerts, T.; Minville, V. Optimal Perioperative Management of Arterial Blood Pressure. IBPC 2014, 7, 49. [Google Scholar] [CrossRef]
- Meng, L.; Yu, W.; Wang, T.; Zhang, L.; Heerdt, P.M.; Gelb, A.W. Blood Pressure Targets in Perioperative Care: Provisional Considerations Based on a Comprehensive Literature Review. Hypertension 2018, 72, 806–817. [Google Scholar] [CrossRef] [PubMed]
- Packiasabapathy, K.S.; Subramaniam, B. Optimal Perioperative Blood Pressure Management. Adv. Anesth. 2018, 36, 67–79. [Google Scholar] [CrossRef] [PubMed]
- Saugel, B.; Sessler, D.I. Perioperative Blood Pressure Management. Anesthesiology 2021, 134, 250–261. [Google Scholar] [CrossRef] [PubMed]
- Yamada, T.; Vacas, S.; Gricourt, Y.; Cannesson, M. Improving Perioperative Outcomes Through Minimally Invasive and Non-Invasive Hemodynamic Monitoring Techniques. Front. Med. 2018, 5, 144. [Google Scholar] [CrossRef]
- Mukherjee, R.; Ghosh, S.; Gupta, B.; Chakravarty, T. A Literature Review on Current and Proposed Technologies of Noninvasive Blood Pressure Measurement. Telemed. E-Health 2018, 24, 185–193. [Google Scholar] [CrossRef]
- Athaya, T.; Choi, S. A Review of Noninvasive Methodologies to Estimate the Blood Pressure Waveform. Sensors 2022, 22, 3953. [Google Scholar] [CrossRef]
- Zhu, Q.; Wu, T.; Wang, N. From Piezoelectric Nanogenerator to Non-Invasive Medical Sensor: A Review. Biosensors 2023, 13, 113. [Google Scholar] [CrossRef]
- Katsuura, T.; Izumi, S.; Yoshimoto, M.; Kawaguchi, H.; Yoshimoto, S.; Sekitani, T. Wearable Pulse Wave Velocity Sensor Using Flexible Piezoelectric Film Array. In Proceedings of the 2017 IEEE Biomedical Circuits and Systems Conference (BioCAS), Turin, Italy, 19–21 October 2017; IEEE: Torino, Italy, 2017; pp. 1–4. [Google Scholar]
- Bijender; Kumar, A. One-Rupee Ultrasensitive Wearable Flexible Low-Pressure Sensor. ACS Omega 2020, 5, 16944–16950. [Google Scholar] [CrossRef]
- You, B.; Han, C.J.; Kim, Y.; Ju, B.-K.; Kim, J.-W. A Wearable Piezocapacitive Pressure Sensor with a Single Layer of Silver Nanowire-Based Elastomeric Composite Electrodes. J. Mater. Chem. A 2016, 4, 10435–10443. [Google Scholar] [CrossRef]
- Wang, T.-W.; Lin, S.-F. Wearable Piezoelectric-Based System for Continuous Beat-to-Beat Blood Pressure Measurement. Sensors 2020, 20, 851. [Google Scholar] [CrossRef] [PubMed]
- Ju, M.; Dou, Z.; Li, J.-W.; Qiu, X.; Shen, B.; Zhang, D.; Yao, F.-Z.; Gong, W.; Wang, K. Piezoelectric Materials and Sensors for Structural Health Monitoring: Fundamental Aspects, Current Status, and Future Perspectives. Sensors 2023, 23, 543. [Google Scholar] [CrossRef] [PubMed]
- Benitez, D.; Gaydecki, P.A.; Zaidi, A.; Fitzpatrick, A.P. The Use of the Hilbert Transform in ECG Signal Analysis. Comput. Biol. Med. 2001, 31, 399–406. [Google Scholar] [CrossRef]
- Janett, G.; Steiner, O.; Alsina Ballester, E.; Belluzzi, L.; Mishra, S. A Novel Fourth-Order WENO Interpolation Technique: A Possible New Tool Designed for Radiative Transfer. Astron. Astrophys. 2019, 624, A104. [Google Scholar] [CrossRef]
- Bezanson, J.; Edelman, A.; Karpinski, S.; Shah, V.B. Julia: A Fresh Approach to Numerical Computing. SIAM Rev. 2017, 59, 65–98. [Google Scholar] [CrossRef]
- Kim, S.-H.; Song, J.-G.; Park, J.-H.; Kim, J.-W.; Park, Y.-S.; Hwang, G.-S. Beat-to-Beat Tracking of Systolic Blood Pressure Using Noninvasive Pulse Transit Time During Anesthesia Induction in Hypertensive Patients. Anesth. Analg. 2013, 116, 94–100. [Google Scholar] [CrossRef]
- Finnegan, E.; Davidson, S.; Harford, M.; Jorge, J.; Watkinson, P.; Young, D.; Tarassenko, L.; Villarroel, M. Pulse Arrival Time as a Surrogate of Blood Pressure. Sci. Rep. 2021, 11, 22767. [Google Scholar] [CrossRef]
- Ma, Y.; Choi, J.; Hourlier-Fargette, A.; Xue, Y.; Chung, H.U.; Lee, J.Y.; Wang, X.; Xie, Z.; Kang, D.; Wang, H.; et al. Relation between Blood Pressure and Pulse Wave Velocity for Human Arteries. Proc. Natl. Acad. Sci. USA 2018, 115, 11144–11149. [Google Scholar] [CrossRef]
- Xiaochuan, H.; Goubran, R.A.; Liu, X.P. Evaluation of the Correlation between Blood Pressure and Pulse Transit Time. In Proceedings of the 2013 IEEE International Symposium on Medical Measurements and Applications (MeMeA), Gatineau, QC, Canada, 4–5 May 2013; IEEE: Gatineau, QC, Canada, 2013; pp. 17–20. [Google Scholar]
- Naschitz, J.E.; Bezobchuk, S.; Mussafia-Priselac, R.; Sundick, S.; Dreyfuss, D.; Khorshidi, I.; Karidis, A.; Manor, H.; Nagar, M.; Peck, E.R.; et al. Pulse Transit Time by R-Wave-Gated Infrared Photoplethysmography: Review of the Literature and Personal Experience. J. Clin. Monit. Comput. 2004, 18, 333–342. [Google Scholar] [CrossRef]
- Chan, G.S.H.; Middleton, P.M.; Celler, B.G.; Wang, L.; Lovell, N.H. Change in Pulse Transit Time and Pre-Ejection Period during Head-up Tilt-Induced Progressive Central Hypovolaemia. J. Clin. Monit. Comput. 2007, 21, 283–293. [Google Scholar] [CrossRef]
- Gao, M.; Olivier, N.B.; Mukkamala, R. Comparison of Noninvasive Pulse Transit Time Estimates as Markers of Blood Pressure Using Invasive Pulse Transit Time Measurements as a Reference. Physiol Rep 2016, 4, e12768. [Google Scholar] [CrossRef]
- Pilz, N.; Patzak, A.; Bothe, T.L. The Pre-Ejection Period Is a Highly Stress Dependent Parameter of Paramount Importance for Pulse-Wave-Velocity Based Applications. Front. Cardiovasc. Med. 2023, 10, 1138356. [Google Scholar] [CrossRef] [PubMed]
- Xu, S.-K.; Hong, X.-F.; Cheng, Y.-B.; Liu, C.-Y.; Li, Y.; Yin, B.; Wang, J.-G. Validation of a Piezoelectric Sensor Array-Based Device for Measurement of Carotid-Femoral Pulse Wave Velocity: The Philips Prototype. Pulse 2017, 5, 161–168. [Google Scholar] [CrossRef] [PubMed]
- Liu, Y.-Y.; Lv, Y.-X.; Xue, H.-B. Intelligent Wearable Wrist Pulse Detection System Based on Piezoelectric Sensor Array. Sensors 2023, 23, 835. [Google Scholar] [CrossRef]
- McLaughlin, J.; McNeill, M.; Braun, B.; McCormack, P.D. Piezoelectric Sensor Determination of Arterial Pulse Wave Velocity. Physiol. Meas. 2003, 24, 693–702. [Google Scholar] [CrossRef]
- Clemente, F.; Arpaia, P.; Cimmino, P. A Piezo-Film-Based Measurement System for Global Haemodynamic Assessment. Physiol. Meas. 2010, 31, 697–714. [Google Scholar] [CrossRef] [PubMed]
- Murphy, J.C.; Morrison, K.; McLaughlin, J.; Manoharan, G.; Adgey, A.J. An Innovative Piezoelectric-Based Method for Measuring Pulse Wave Velocity in Patients With Hypertension: Measuring Pulse Wave Velocity Based on Piezoelectric Method. J. Clin. Hypertens. 2011, 13, 497–505. [Google Scholar] [CrossRef]
- Wang, H.; Wang, L.; Sun, N.; Yao, Y.; Hao, L.; Xu, L.; Greenwald, S.E. Quantitative Comparison of the Performance of Piezoresistive, Piezoelectric, Acceleration, and Optical Pulse Wave Sensors. Front. Physiol. 2020, 10, 1563. [Google Scholar] [CrossRef]
- Gesche, H.; Grosskurth, D.; Küchler, G.; Patzak, A. Continuous Blood Pressure Measurement by Using the Pulse Transit Time: Comparison to a Cuff-Based Method. Eur. J. Appl. Physiol. 2012, 112, 309–315. [Google Scholar] [CrossRef]
- Obrist, P.A.; Light, K.C.; McCubbin, J.A.; Hutcheson, J.S.; Hoffer, J.L. Pulse Transit Time: Relationship to Blood Pressure. Behav. Res. Methods Instrum. 1978, 10, 623–626. [Google Scholar] [CrossRef]
- Payne, R.A.; Symeonides, C.N.; Webb, D.J.; Maxwell, S.R.J. Pulse Transit Time Measured from the ECG: An Unreliable Marker of Beat-to-Beat Blood Pressure. J. Appl. Physiol. 2006, 100, 136–141. [Google Scholar] [CrossRef] [PubMed]
- Mol, A.; Meskers, C.G.M.; Niehof, S.P.; Maier, A.B.; van Wezel, R.J.A. Pulse Transit Time as a Proxy for Vasoconstriction in Younger and Older Adults. Exp. Gerontol. 2020, 135, 110938. [Google Scholar] [CrossRef] [PubMed]
- Patzak, A.; Mendoza, Y.; Gesche, H.; Konermann, M. Continuous Blood Pressure Measurement Using the Pulse Transit Time: Comparison to Intra-Arterial Measurement. Blood Press. 2015, 24, 217–221. [Google Scholar] [CrossRef] [PubMed]
- Lee, J.; Yang, S.; Lee, S.; Kim, H.C. Analysis of Pulse Arrival Time as an Indicator of Blood Pressure in a Large Surgical Biosignal Database: Recommendations for Developing Ubiquitous Blood Pressure Monitoring Methods. JCM 2019, 8, 1773. [Google Scholar] [CrossRef]
- Sharwood-Smith, G.; Bruce, J.; Drummond, G. Assessment of Pulse Transit Time to Indicate Cardiovascular Changes during Obstetric Spinal Anaesthesia. Br. J. Anaesth. 2006, 96, 100–105. [Google Scholar] [CrossRef]
- Schaanning, S.G.; Skjaervold, N.K. Rapid Declines in Systolic Blood Pressure Are Associated with an Increase in Pulse Transit Time. PLoS ONE 2020, 15, e0240126. [Google Scholar] [CrossRef]
- Kips, J.G.; Rietzschel, E.R.; De Buyzere, M.L.; Westerhof, B.E.; Gillebert, T.C.; Van Bortel, L.M.; Segers, P. Evaluation of Noninvasive Methods to Assess Wave Reflection and Pulse Transit Time From the Pressure Waveform Alone. Hypertension 2009, 53, 142–149. [Google Scholar] [CrossRef]
- Wagner, D.R.; Roesch, N.; Harpes, P.; Körtke, H.; Plumer, P.; Saberin, A.; Chakoutio, V.; Oundjede, D.; Delagardelle, C.; Beissel, J.; et al. Relationship between Pulse Transit Time and Blood Pressure Is Impaired in Patients with Chronic Heart Failure. Clin. Res. Cardiol. 2010, 99, 657–664. [Google Scholar] [CrossRef]
- Ahlstrom, C.; Johansson, A.; Uhlin, F.; Länne, T.; Ask, P. Noninvasive Investigation of Blood Pressure Changes Using the Pulse Wave Transit Time: A Novel Approach in the Monitoring of Hemodialysis Patients. J. Artif. Organs 2005, 8, 192–197. [Google Scholar] [CrossRef]
- Bolea, J.; Lázaro, J.; Gil, E.; Rovira, E.; Remartínez, J.M.; Laguna, P.; Pueyo, E.; Navarro, A.; Bailón, R. Pulse Rate and Transit Time Analysis to Predict Hypotension Events After Spinal Anesthesia During Programmed Cesarean Labor. Ann. Biomed. Eng. 2017, 45, 2253–2263. [Google Scholar] [CrossRef]
- Kouz, K.; Hoppe, P.; Briesenick, L.; Saugel, B. Intraoperative Hypotension: Pathophysiology, Clinical Relevance, and Therapeutic Approaches. Indian J. Anaesth 2020, 64, 90. [Google Scholar] [CrossRef] [PubMed]
- Sessler, D.I.; Bloomstone, J.A.; Aronson, S.; Berry, C.; Gan, T.J.; Kellum, J.A.; Plumb, J.; Mythen, M.G.; Grocott, M.P.W.; Edwards, M.R.; et al. Perioperative Quality Initiative Consensus Statement on Intraoperative Blood Pressure, Risk and Outcomes for Elective Surgery. Br. J. Anaesth. 2019, 122, 563–574. [Google Scholar] [CrossRef] [PubMed]
- Wiórek, A.; Krzych, Ł.J. Intraoperative Blood Pressure Variability Predicts Postoperative Mortality in Non-Cardiac Surgery—A Prospective Observational Cohort Study. Int. J. Environ. Res. Public Health 2019, 16, 4380. [Google Scholar] [CrossRef]
- Brunaud, L.; Nguyen-Thi, P.-L.; Mirallie, E.; Raffaelli, M.; Vriens, M.; Theveniaud, P.-E.; Boutami, M.; Finnerty, B.M.; Vorselaars, W.M.C.M.; Rinkes, I.B.; et al. Predictive Factors for Postoperative Morbidity after Laparoscopic Adrenalectomy for Pheochromocytoma: A Multicenter Retrospective Analysis in 225 Patients. Surg. Endosc. 2016, 30, 1051–1059. [Google Scholar] [CrossRef] [PubMed]
- Singham, S.; Voss, L.; Barnard, J.; Sleigh, J. Nociceptive and Anaesthetic-Induced Changes in Pulse Transit Time during General Anaesthesia. Br. J. Anaesth. 2003, 91, 662–666. [Google Scholar] [CrossRef]
- Kortekaas, M.C.; Niehof, S.P.; Van Velzen, M.H.N.; Galvin, E.M.; Huygen, F.J.P.M.; Stolker, R.J. Pulse Transit Time as a Quick Predictor of a Successful Axillary Brachial Plexus Block: PTT as a Predictor of an Axillary Block. Acta Anaesthesiol. Scand. 2012, 56, 1228–1233. [Google Scholar] [CrossRef]
- Zhang, G.; Gao, M.; Xu, D.; Olivier, N.B.; Mukkamala, R. Pulse Arrival Time Is Not an Adequate Surrogate for Pulse Transit Time as a Marker of Blood Pressure. J. Appl. Physiol. 2011, 111, 1681–1686. [Google Scholar] [CrossRef]
- Zhang, Z.; Ansari, S.; Wang, L.; Aaronson, K.D.; Golbus, J.R.; Oldham, K.R. Noninvasive Systemic Vascular Resistance Estimation Using a Photoplethysmogram and a Piezoelectric Sensor. IFAC-PapersOnLine 2021, 54, 298–303. [Google Scholar] [CrossRef]
- Fukui, K.; Wirkus, J.M.; Hartmann, E.K.; Schmidtmann, I.; Pestel, G.J.; Griemert, E.-V. Non-Invasive Assessment of Pulse Wave Transit Time (PWTT) Is a Poor Predictor for Intraoperative Fluid Responsiveness: A Prospective Observational Trial (Best-PWTT Study). BMC Anesth. 2023, 23, 60. [Google Scholar] [CrossRef]
- Youn, A.M.; Shin, Y.S.; Park, S.I. Changes in Pulse Transit Time According to Target Controlled Infusion of Propofol versus Sevoflurane Inhalation Induction. Anesth. Pain Med. 2014, 9, 48–53. [Google Scholar]
- Samartkit, P.; Pullteap, S.; Bernal, O. A Non-Invasive Heart Rate and Blood Pressure Monitoring System Using Piezoelectric and Photoplethysmographic Sensors. Measurement 2022, 196, 111211. [Google Scholar] [CrossRef]
- Dash, S.; Shelley, K.H.; Silverman, D.G.; Chon, K.H. Estimation of Respiratory Rate From ECG, Photoplethysmogram, and Piezoelectric Pulse Transducer Signals: A Comparative Study of Time–Frequency Methods. IEEE Trans. Biomed. Eng. 2010, 57, 1099–1107. [Google Scholar] [CrossRef] [PubMed]
- Deng, Z.; Guo, L.; Chen, X.; Wu, W. Smart Wearable Systems for Health Monitoring. Sensors 2023, 23, 2479. [Google Scholar] [CrossRef] [PubMed]
- Sharma, M.; Barbosa, K.; Ho, V.; Griggs, D.; Ghirmai, T.; Krishnan, S.; Hsiai, T.; Chiao, J.-C.; Cao, H. Cuff-Less and Continuous Blood Pressure Monitoring: A Methodological Review. Technologies 2017, 5, 21. [Google Scholar] [CrossRef]
- Rao, M.S.; Narendra, K.C.; Kellarai, A.; Bangera, S.C. An Experimental Investigation on Pulse Transit Time and Pulse Arrival Time Using Ecg, Pressure and Ppg Sensors. Med. Nov. Technol. Devices 2023, 17, 100214. [Google Scholar] [CrossRef]
- Tian, J.; Jiang, F.; Zeng, Q.; PourhosseiniAsl, M.; Han, C.; Ren, K. Biocompatible Piezoelectric Polymer Poly(Lactic Acid)-Based Stethoscope for Wearable Health Monitoring Devices. IEEE Sens. J. 2023, 23, 6264–6271. [Google Scholar] [CrossRef]
- Choi, J.; Kang, Y.; Park, J.; Joung, Y.; Koo, C. Development of Real-Time Cuffless Blood Pressure Measurement Systems with ECG Electrodes and a Microphone Using Pulse Transit Time (PTT). Sensors 2023, 23, 1684. [Google Scholar] [CrossRef]


| Patients’ Characteristics | |
|---|---|
| 12/8 | Gender (F/M) (n) |
| 62 ± 11.5 | Age (years) |
| 170 ± 0.15 | Height (cm) |
| 78 ± 18 | Weight (kg) |
| 25 ± 8.2 | BMI (kg/m2) |
| 1.93 ± 0.3 | Body surface area (BSA) (m2) |
| ASA classification (n) | |
| 10 | II |
| 10 | III |
| Comorbidities (n) | |
| 10 | Arterial hypertension |
| 5 | Coronary artery disease |
| 4 | Diabetes mellitus |
| 2 | Heart failure |
| 2 | Chronic kidney disease |
| 2 | Hypothyroidism |
| 2 | Asthma bronchiale |
| 1 | Chronic obstructive pulmonary disease |
| Type of surgery (n) | |
| 7 | Cardiac (including CPB) |
| 7 | Abdominal (e.g., Whipple, pancreatic/intestinal/hepatic resection) |
| 6 | Urological (e.g., cystectomy) |
| Average duration of surgery (min) | |
| 213 ± 30 | Cardiac |
| 214 ± 110 | Abdominal |
| 323 ± 23 | Urological |
| Intraoperative vasoactive medications | |
| 17 | Norepinephrine (infusion) |
| 2 | Dobutamine (infusion) |
| 2 | Enoximone (infusion) |
| 14 | Caffeine/Theodrenaline (bolus) |
| 6 | Atropine (bolus) |
| Sources Compared | Pearson’s Correlation (Median and IQR) |
|---|---|
| BPIBP vs. 1/PTTPES | 0.64 (0.32) |
| SBPIBP vs. 1//PTTPCS | 0.55 (0.28) |
| DBPIBP vs. 1/PTTPES | 0.55 (0.36) |
| DBPIBP vs. 1/PTTPCS | 0.45 (0.40) |
| MAPIBP vs. 1/PTTPES | 0.6 (0.31) |
| MAPIBP vs. 1/PTTPCS | 0.5 (0.27) |
Disclaimer/Publisher’s Note: The statements, opinions and data contained in all publications are solely those of the individual author(s) and contributor(s) and not of MDPI and/or the editor(s). MDPI and/or the editor(s) disclaim responsibility for any injury to people or property resulting from any ideas, methods, instructions or products referred to in the content. |
© 2023 by the authors. Licensee MDPI, Basel, Switzerland. This article is an open access article distributed under the terms and conditions of the Creative Commons Attribution (CC BY) license (https://creativecommons.org/licenses/by/4.0/).
Share and Cite
Nordine, M.; Pille, M.; Kraemer, J.; Berger, C.; Brandhorst, P.; Kaeferstein, P.; Kopetsch, R.; Wessel, N.; Trauzeddel, R.F.; Treskatsch, S. Intraoperative Beat-to-Beat Pulse Transit Time (PTT) Monitoring via Non-Invasive Piezoelectric/Piezocapacitive Peripheral Sensors Can Predict Changes in Invasively Acquired Blood Pressure in High-Risk Surgical Patients. Sensors 2023, 23, 3304. https://doi.org/10.3390/s23063304
Nordine M, Pille M, Kraemer J, Berger C, Brandhorst P, Kaeferstein P, Kopetsch R, Wessel N, Trauzeddel RF, Treskatsch S. Intraoperative Beat-to-Beat Pulse Transit Time (PTT) Monitoring via Non-Invasive Piezoelectric/Piezocapacitive Peripheral Sensors Can Predict Changes in Invasively Acquired Blood Pressure in High-Risk Surgical Patients. Sensors. 2023; 23(6):3304. https://doi.org/10.3390/s23063304
Chicago/Turabian StyleNordine, Michael, Marius Pille, Jan Kraemer, Christian Berger, Philipp Brandhorst, Philipp Kaeferstein, Roland Kopetsch, Niels Wessel, Ralf Felix Trauzeddel, and Sascha Treskatsch. 2023. "Intraoperative Beat-to-Beat Pulse Transit Time (PTT) Monitoring via Non-Invasive Piezoelectric/Piezocapacitive Peripheral Sensors Can Predict Changes in Invasively Acquired Blood Pressure in High-Risk Surgical Patients" Sensors 23, no. 6: 3304. https://doi.org/10.3390/s23063304
APA StyleNordine, M., Pille, M., Kraemer, J., Berger, C., Brandhorst, P., Kaeferstein, P., Kopetsch, R., Wessel, N., Trauzeddel, R. F., & Treskatsch, S. (2023). Intraoperative Beat-to-Beat Pulse Transit Time (PTT) Monitoring via Non-Invasive Piezoelectric/Piezocapacitive Peripheral Sensors Can Predict Changes in Invasively Acquired Blood Pressure in High-Risk Surgical Patients. Sensors, 23(6), 3304. https://doi.org/10.3390/s23063304