


Unsupervised Learning Methods for Data-Driven Vibration-Based Structural Health Monitoring: A Review


Abstract
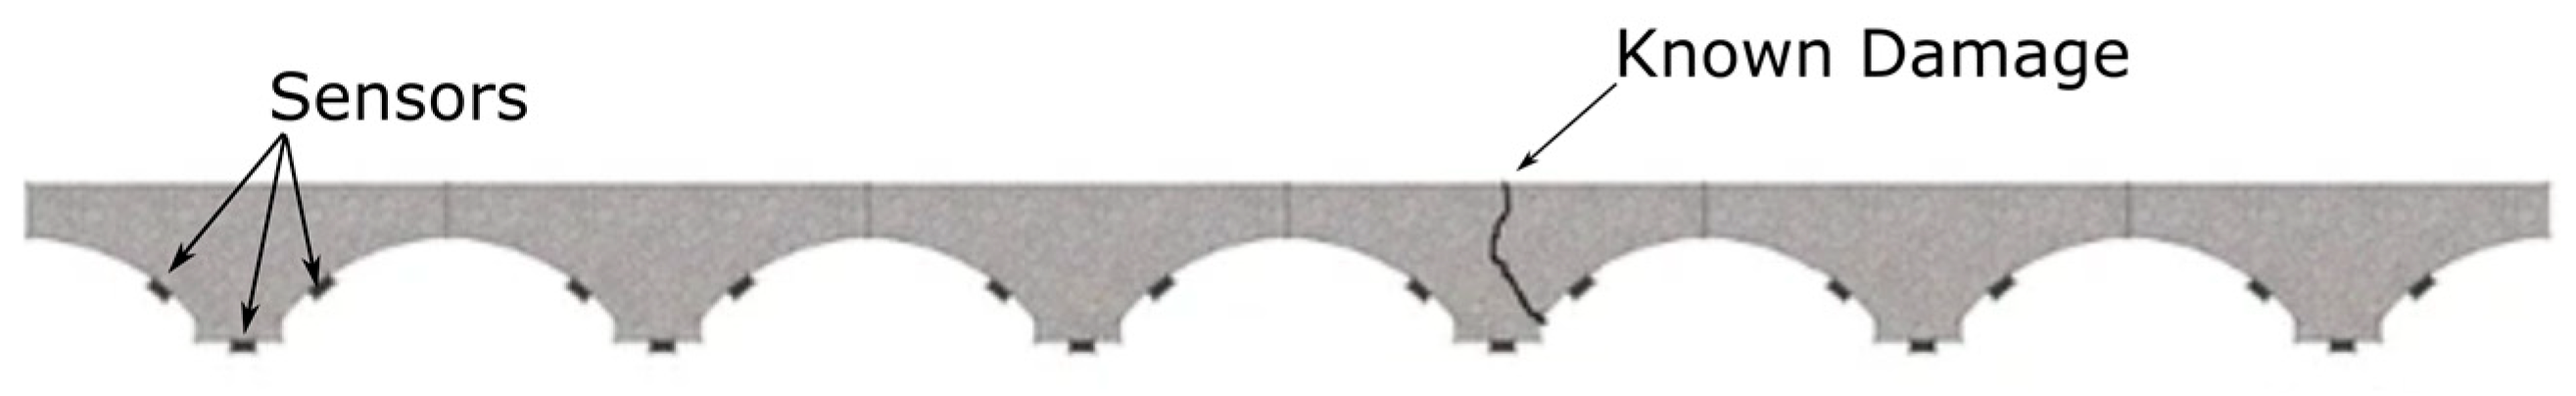
1. Introduction
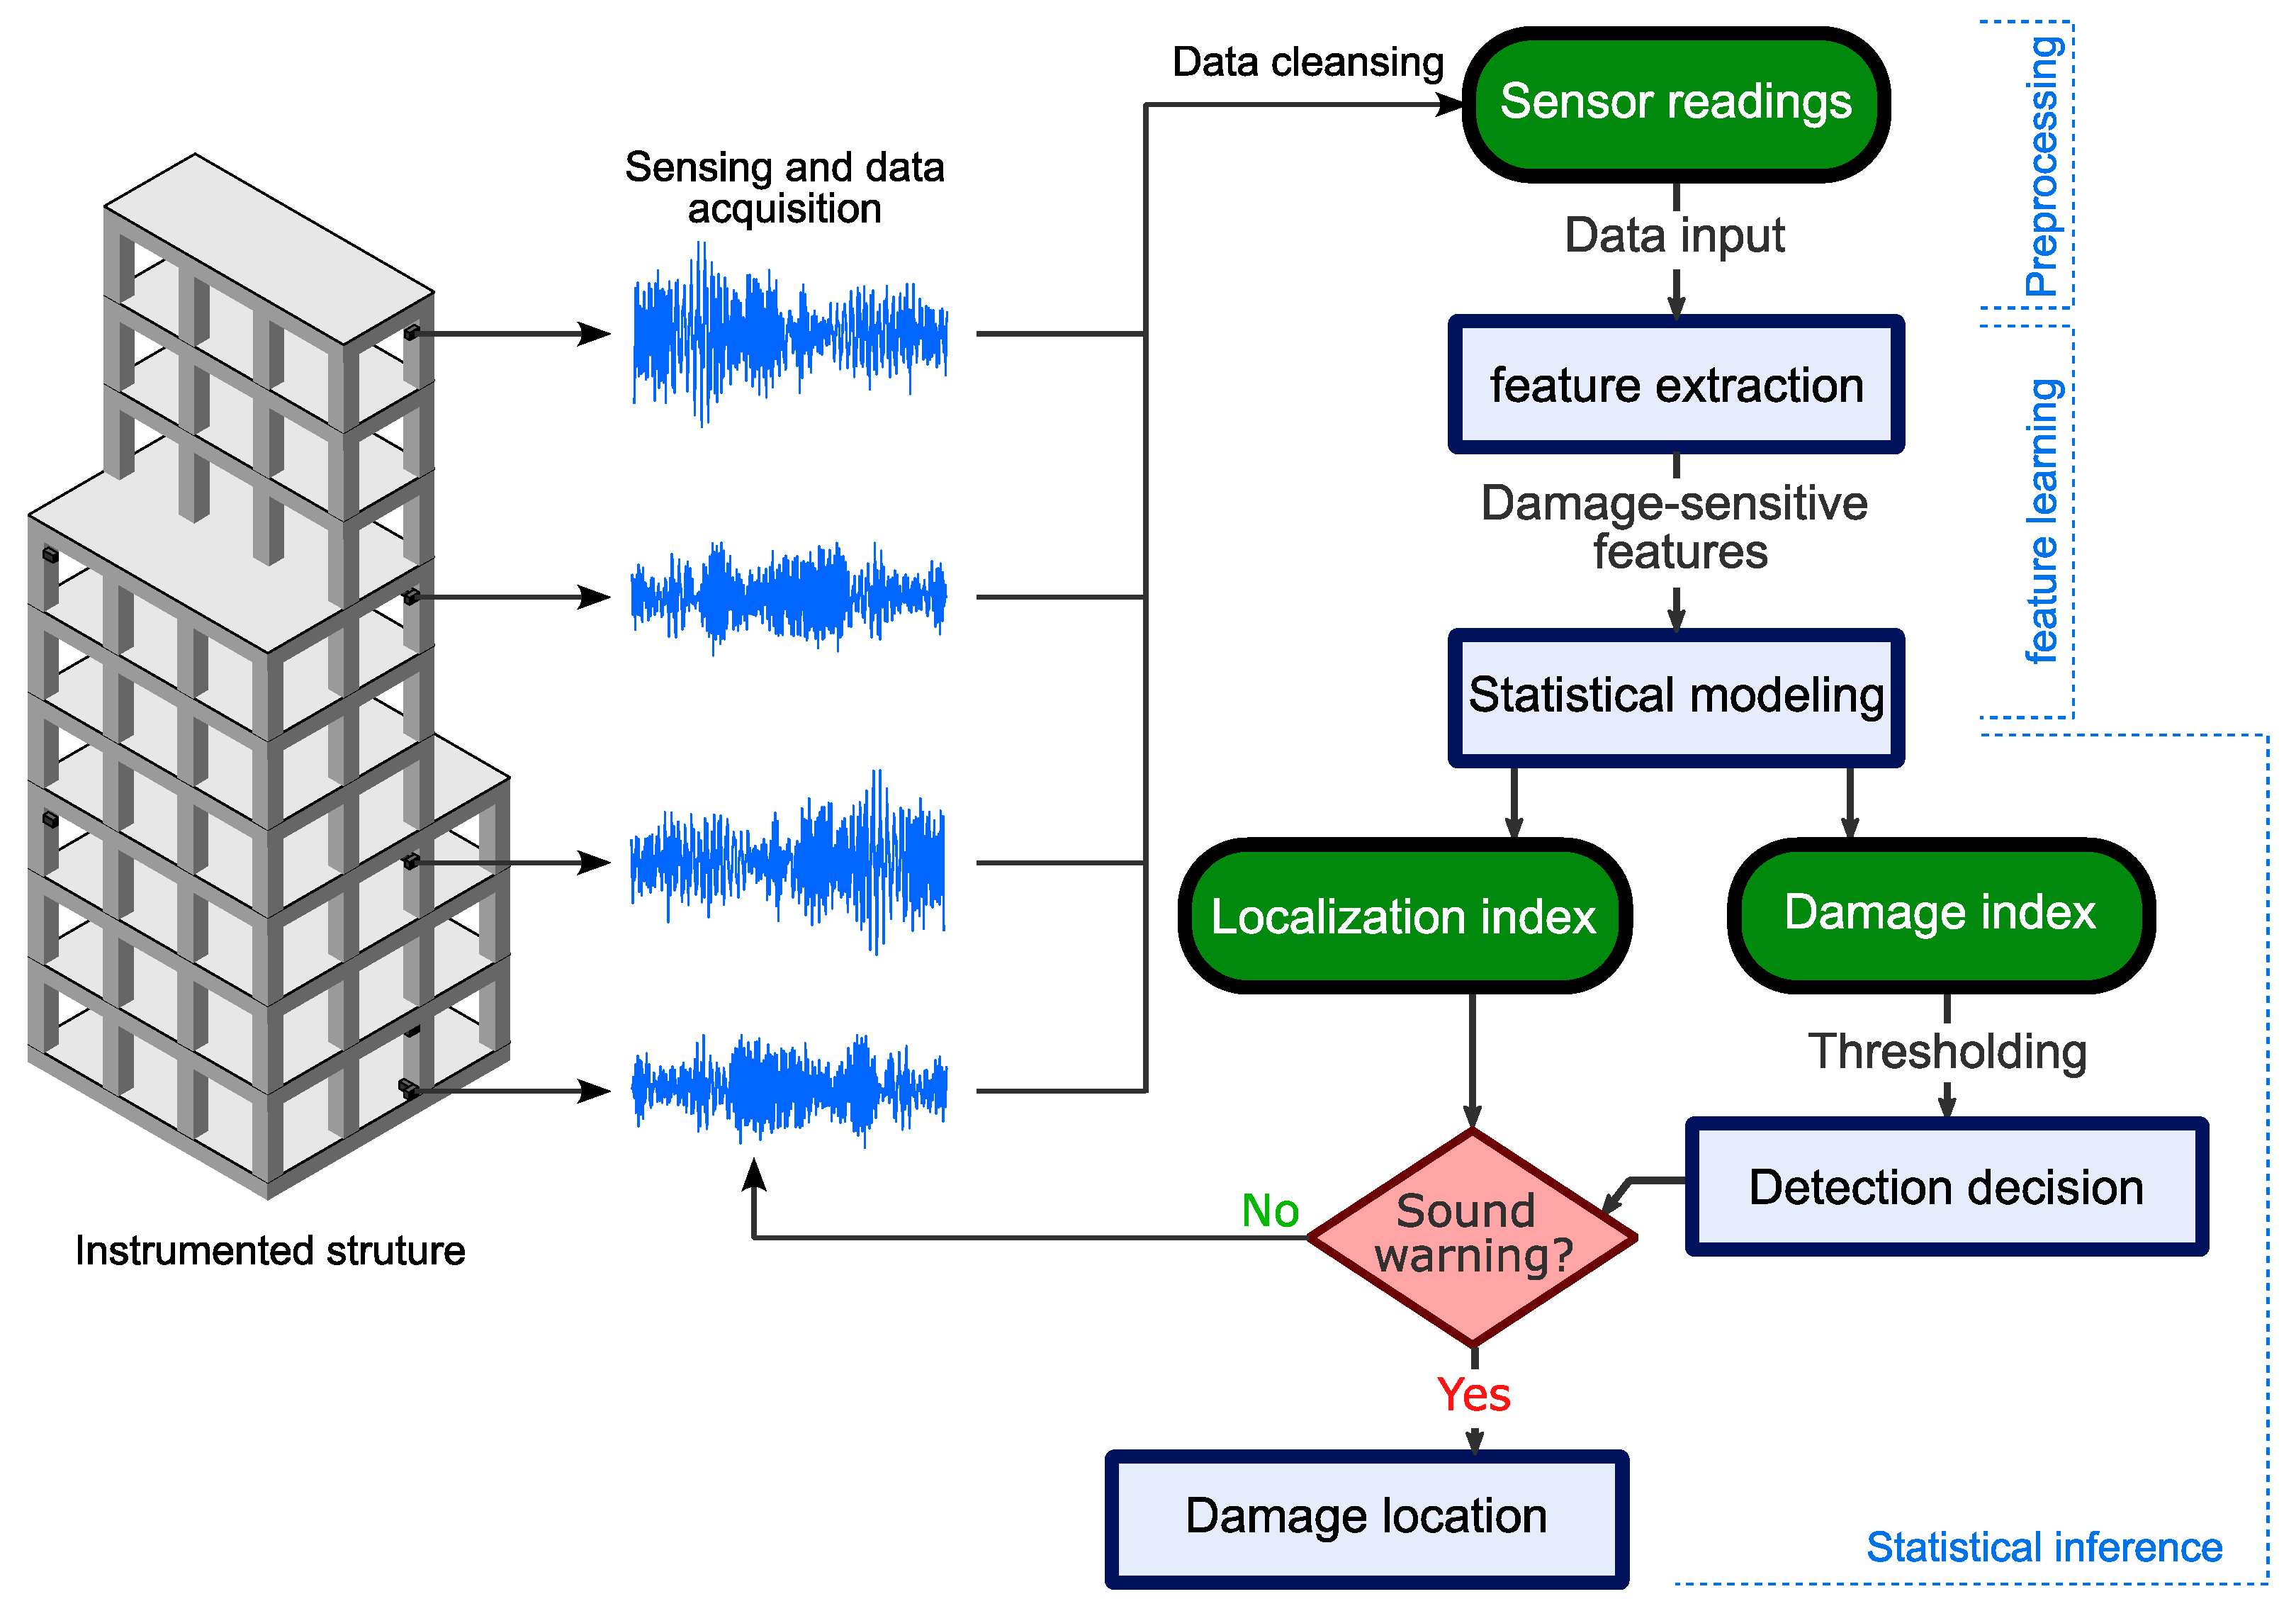
1.1. Background
1.2. Related Work
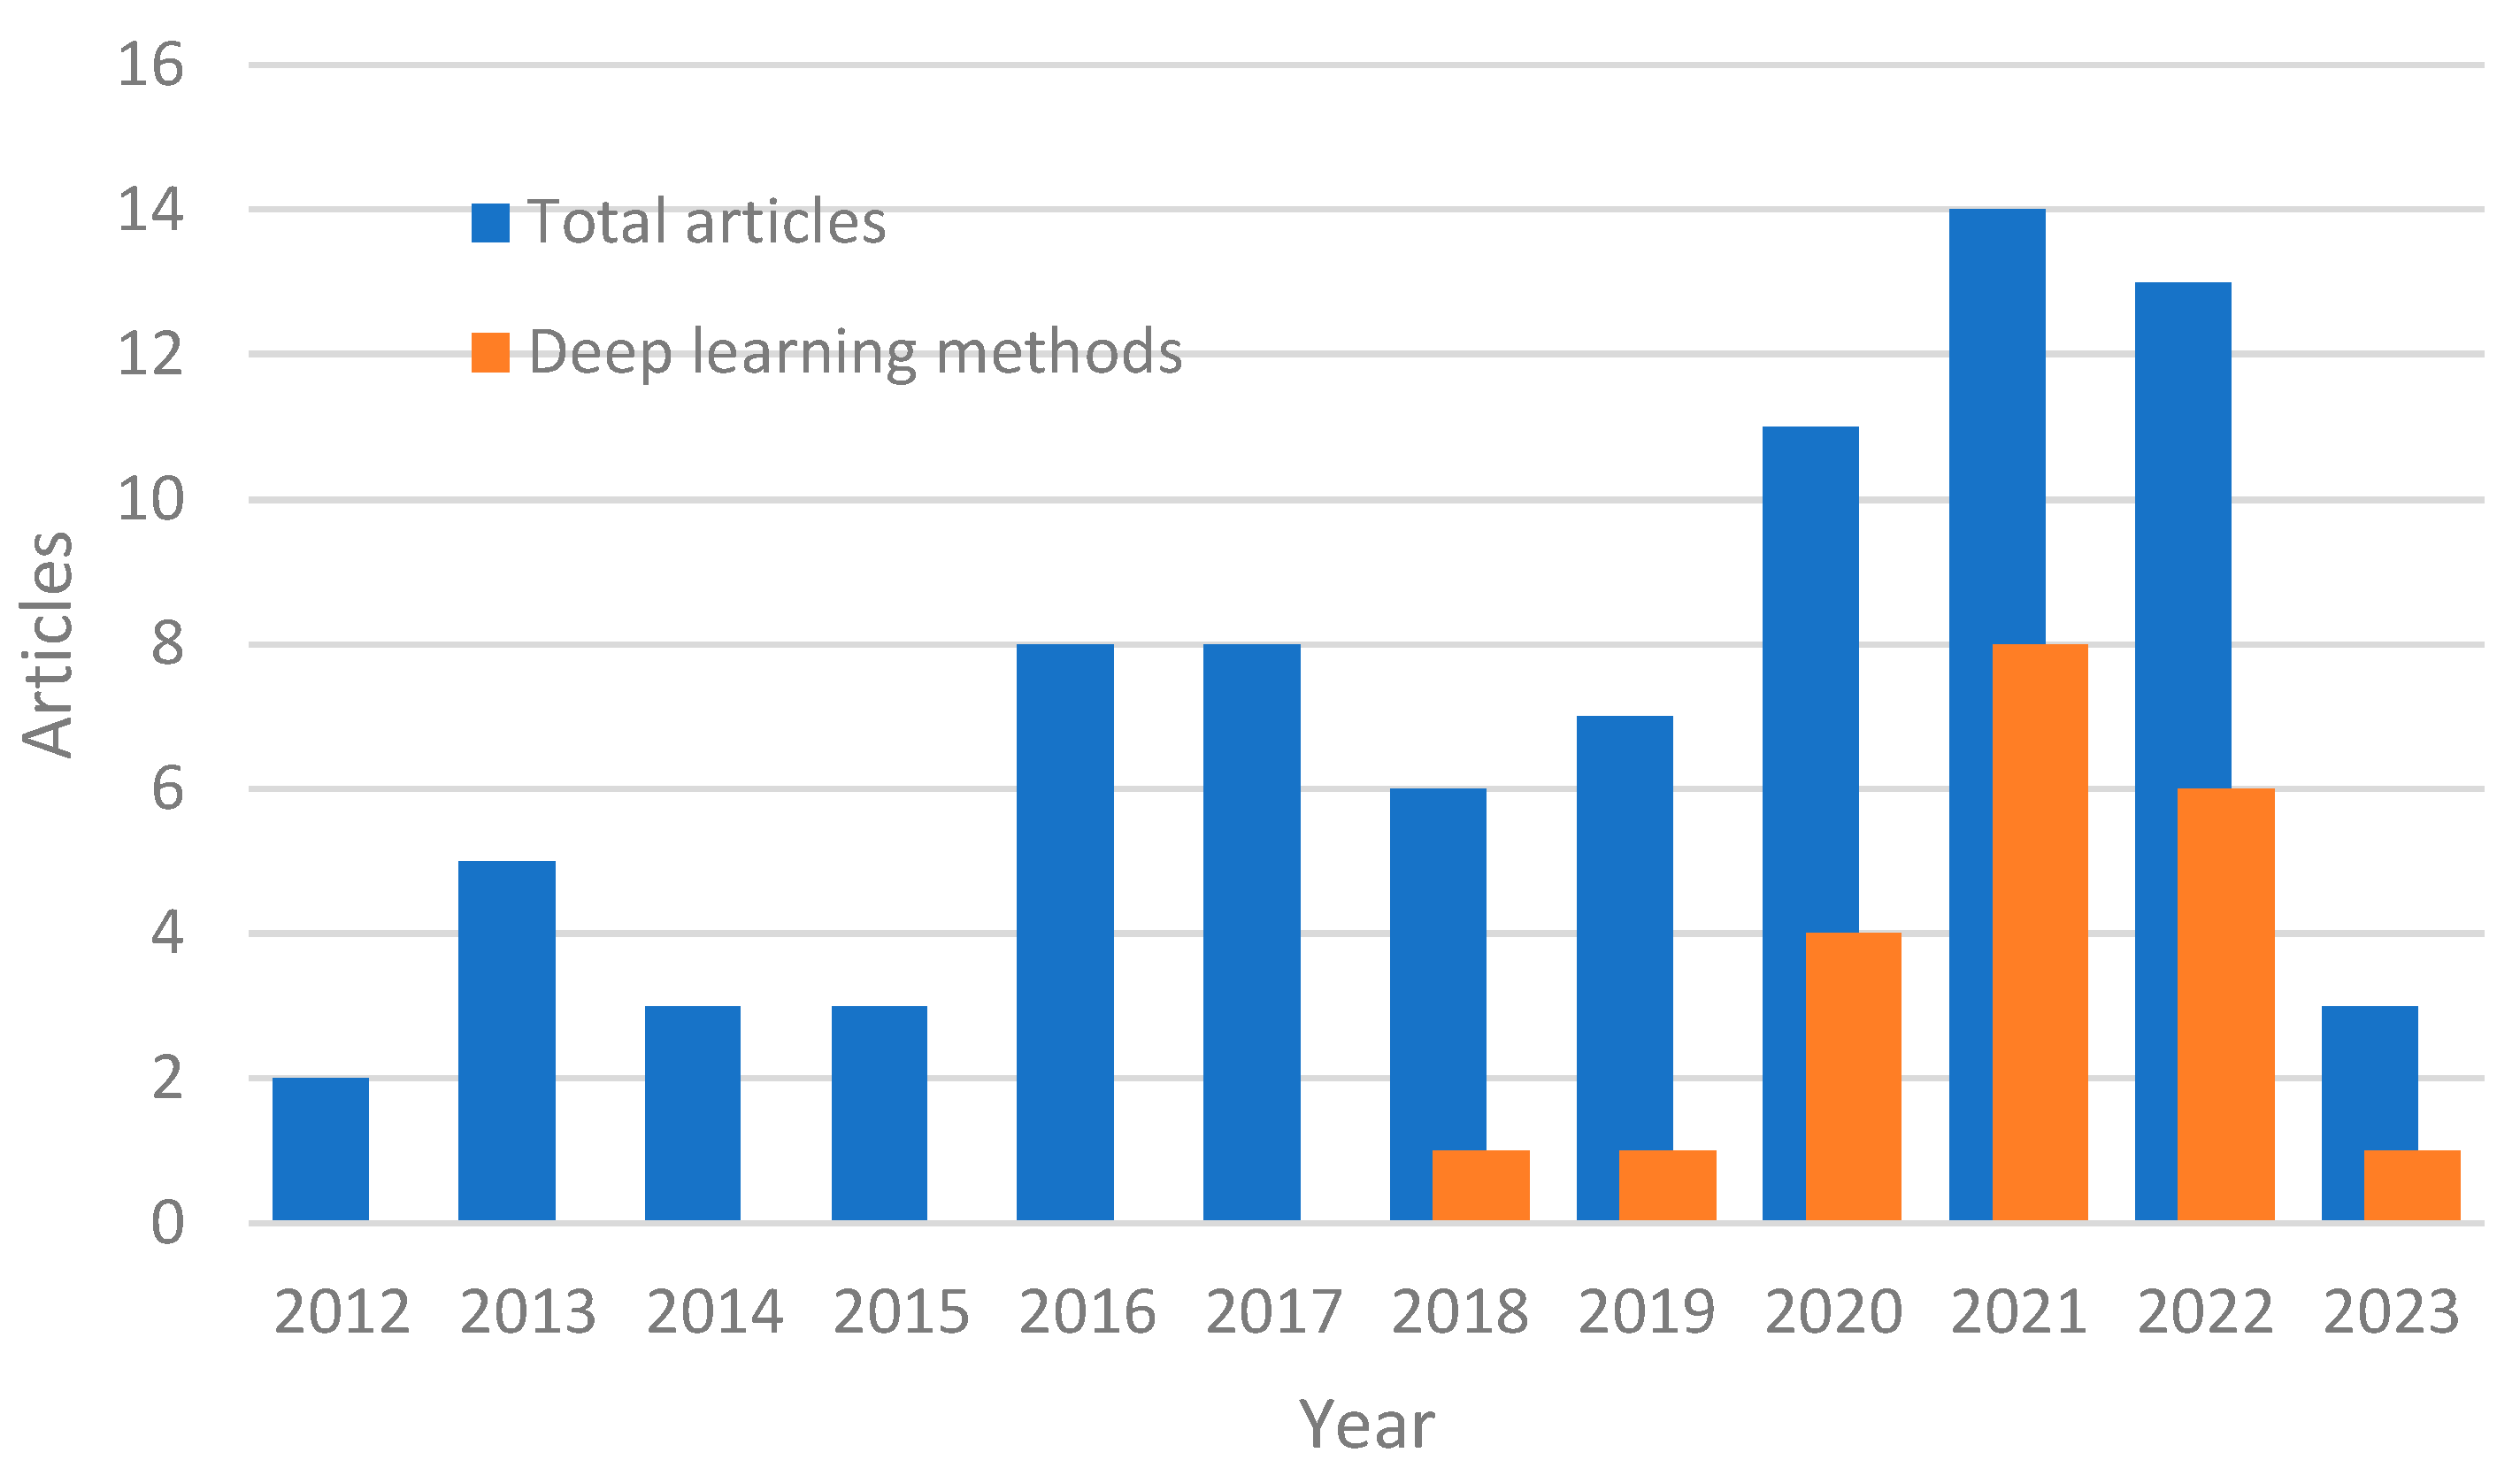
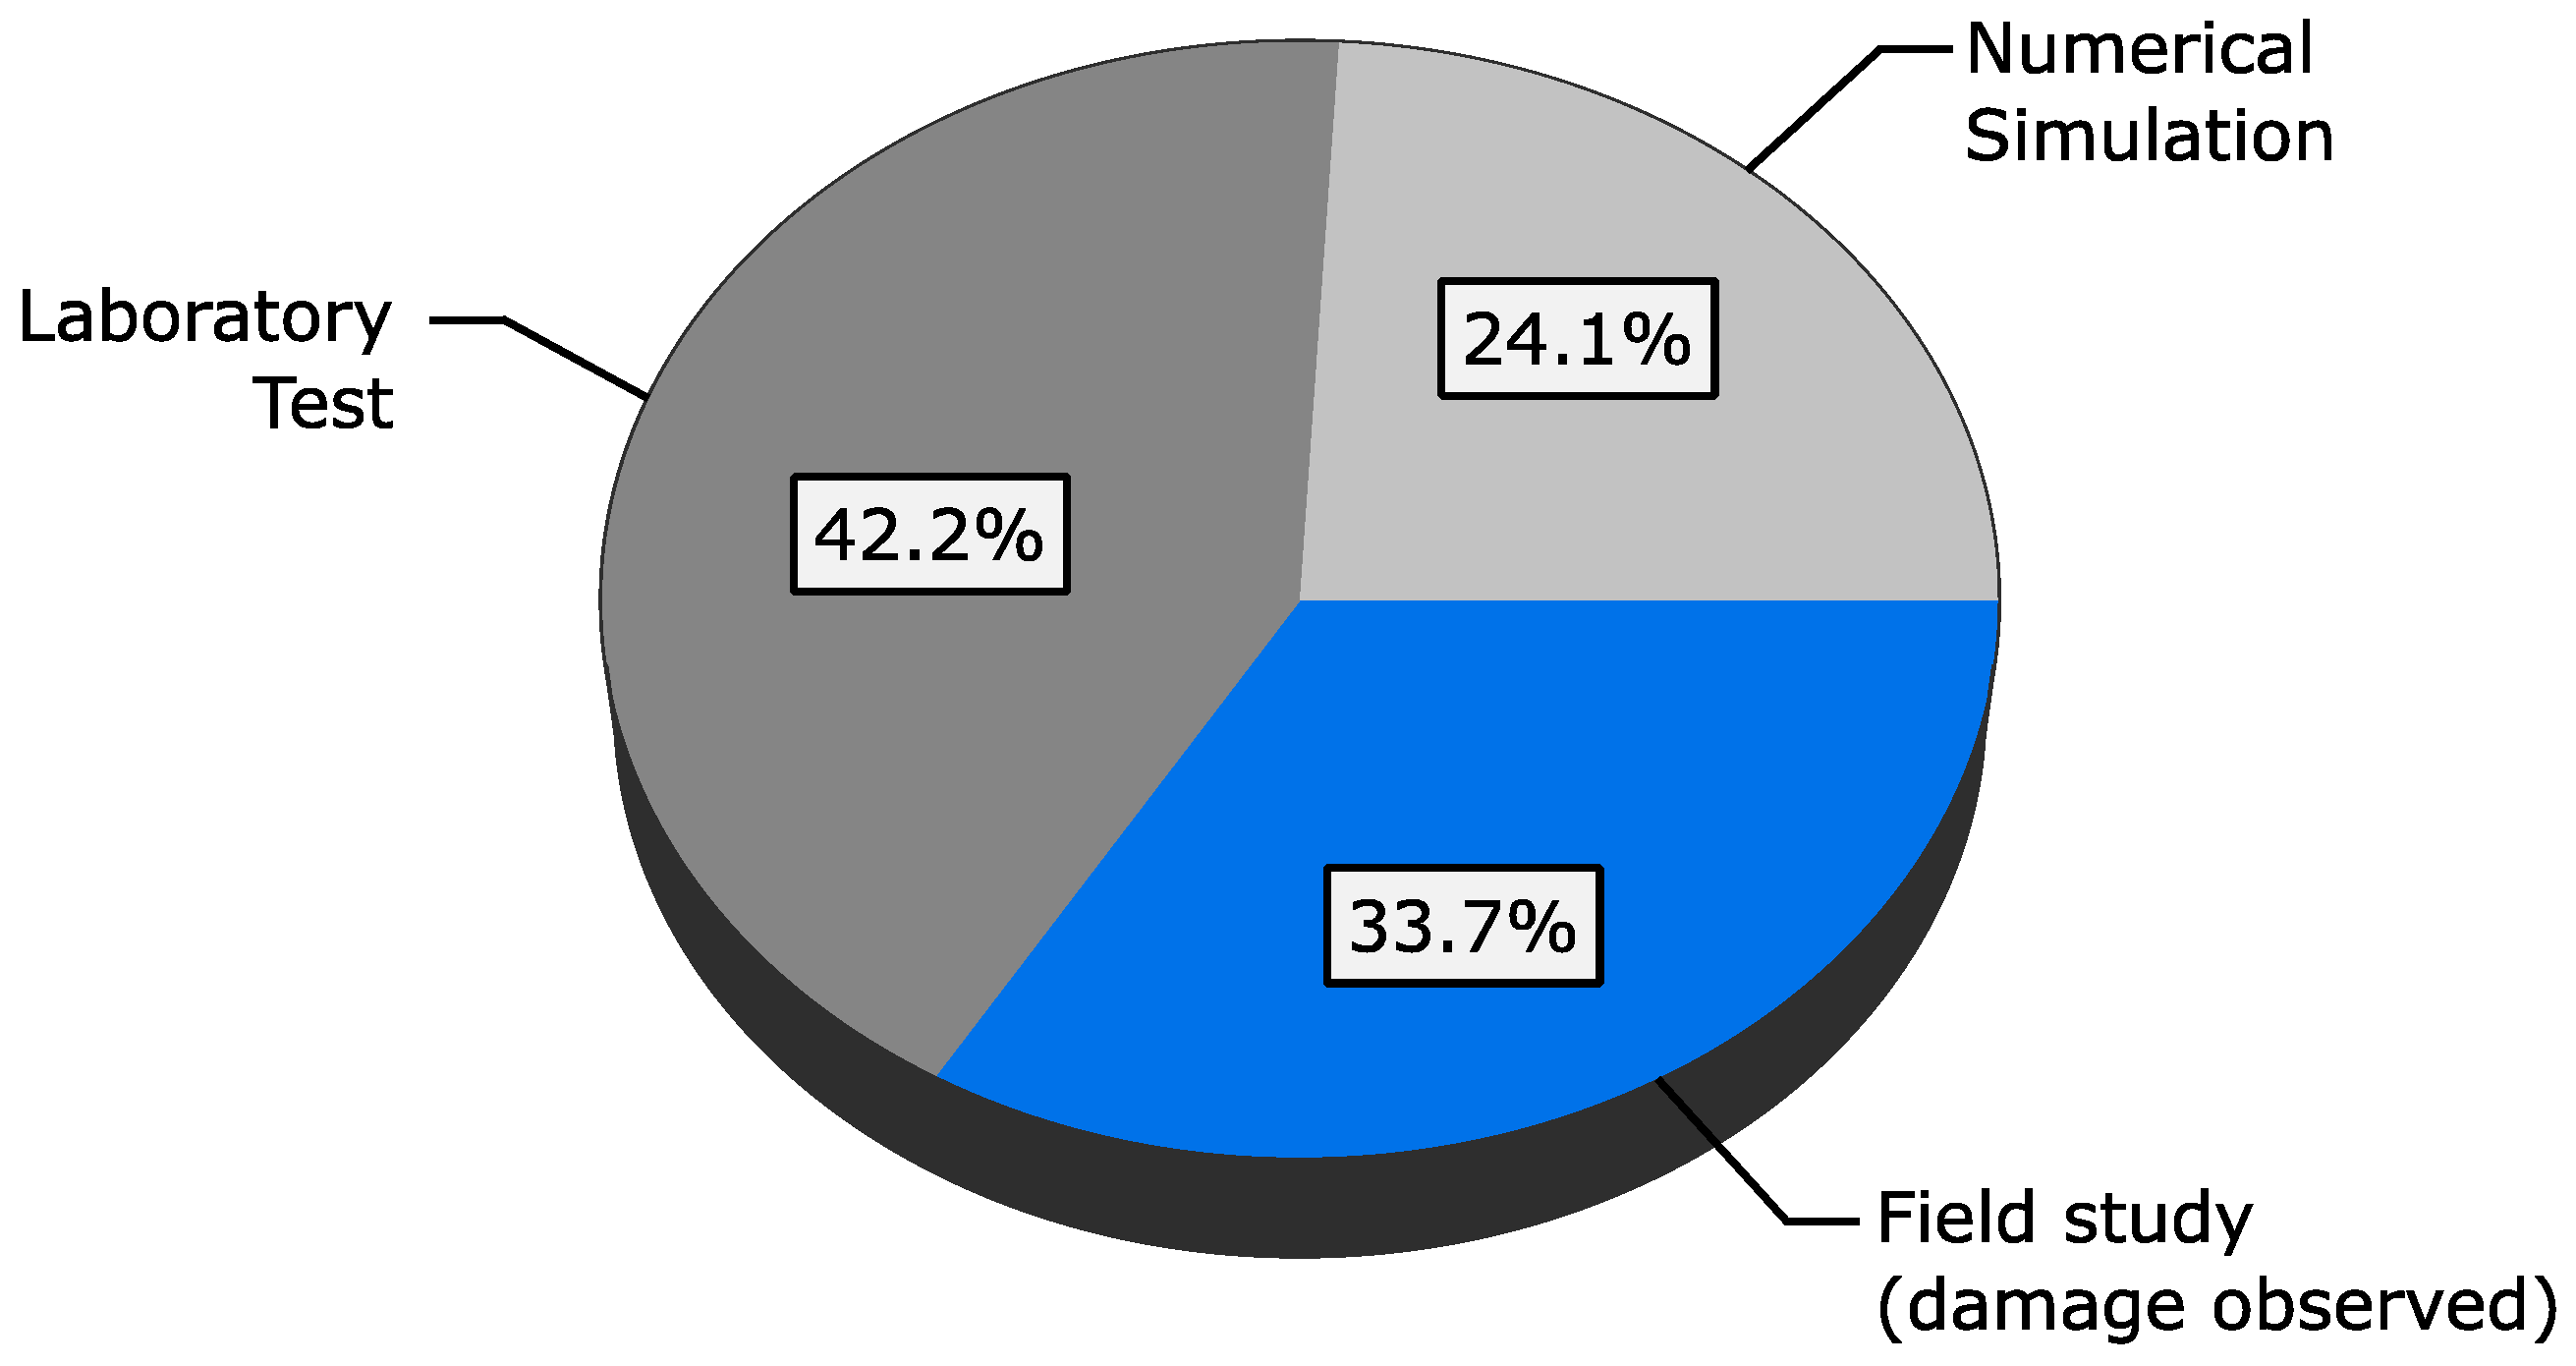
1.3. Aim and Methodology
- Peer-reviewed articles from 2012 to 2023 were selected from well-established academic databases including Web of Science, Science Direct, ASCE Library, Wiley Online Library, IEEE Xplore Digital Library, and Sage.
- The search was conducted using relevant keywords, including “structural damage detection”, “unsupervised damage detection”, “unsupervised structural health monitoring”, “structural novelty detection”, “anomaly damage detection”, etc.
- Two rounds of screening were performed.
- ∘
- In the first round, the titles, abstracts, and keywords of the articles were checked for relevancy to the search topic.
- ∘
- A large number of papers were selected for the second round. in which careful reading and analyzing of the complete article was performed.
- Papers were given relevancy scores based on aspects such as the learning mode, method, objectives, feature types, application (structural or non-structural), the decision-making process, thresholding, and results.
2. Popular Datasets for Unsupervised Learning-Based SHM
2.1. Z-24 Bridge
2.2. Tamar Bridge
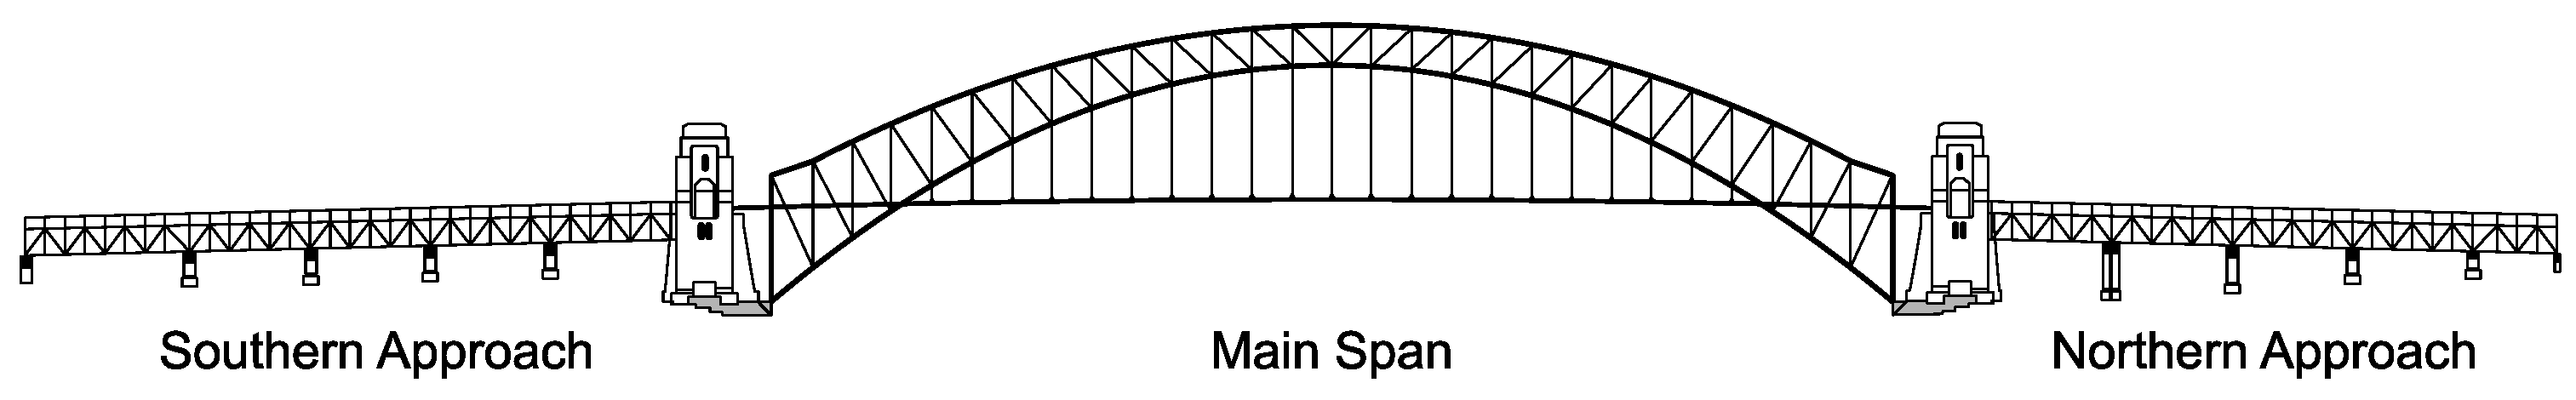
2.3. Sydney Harbour Bridge
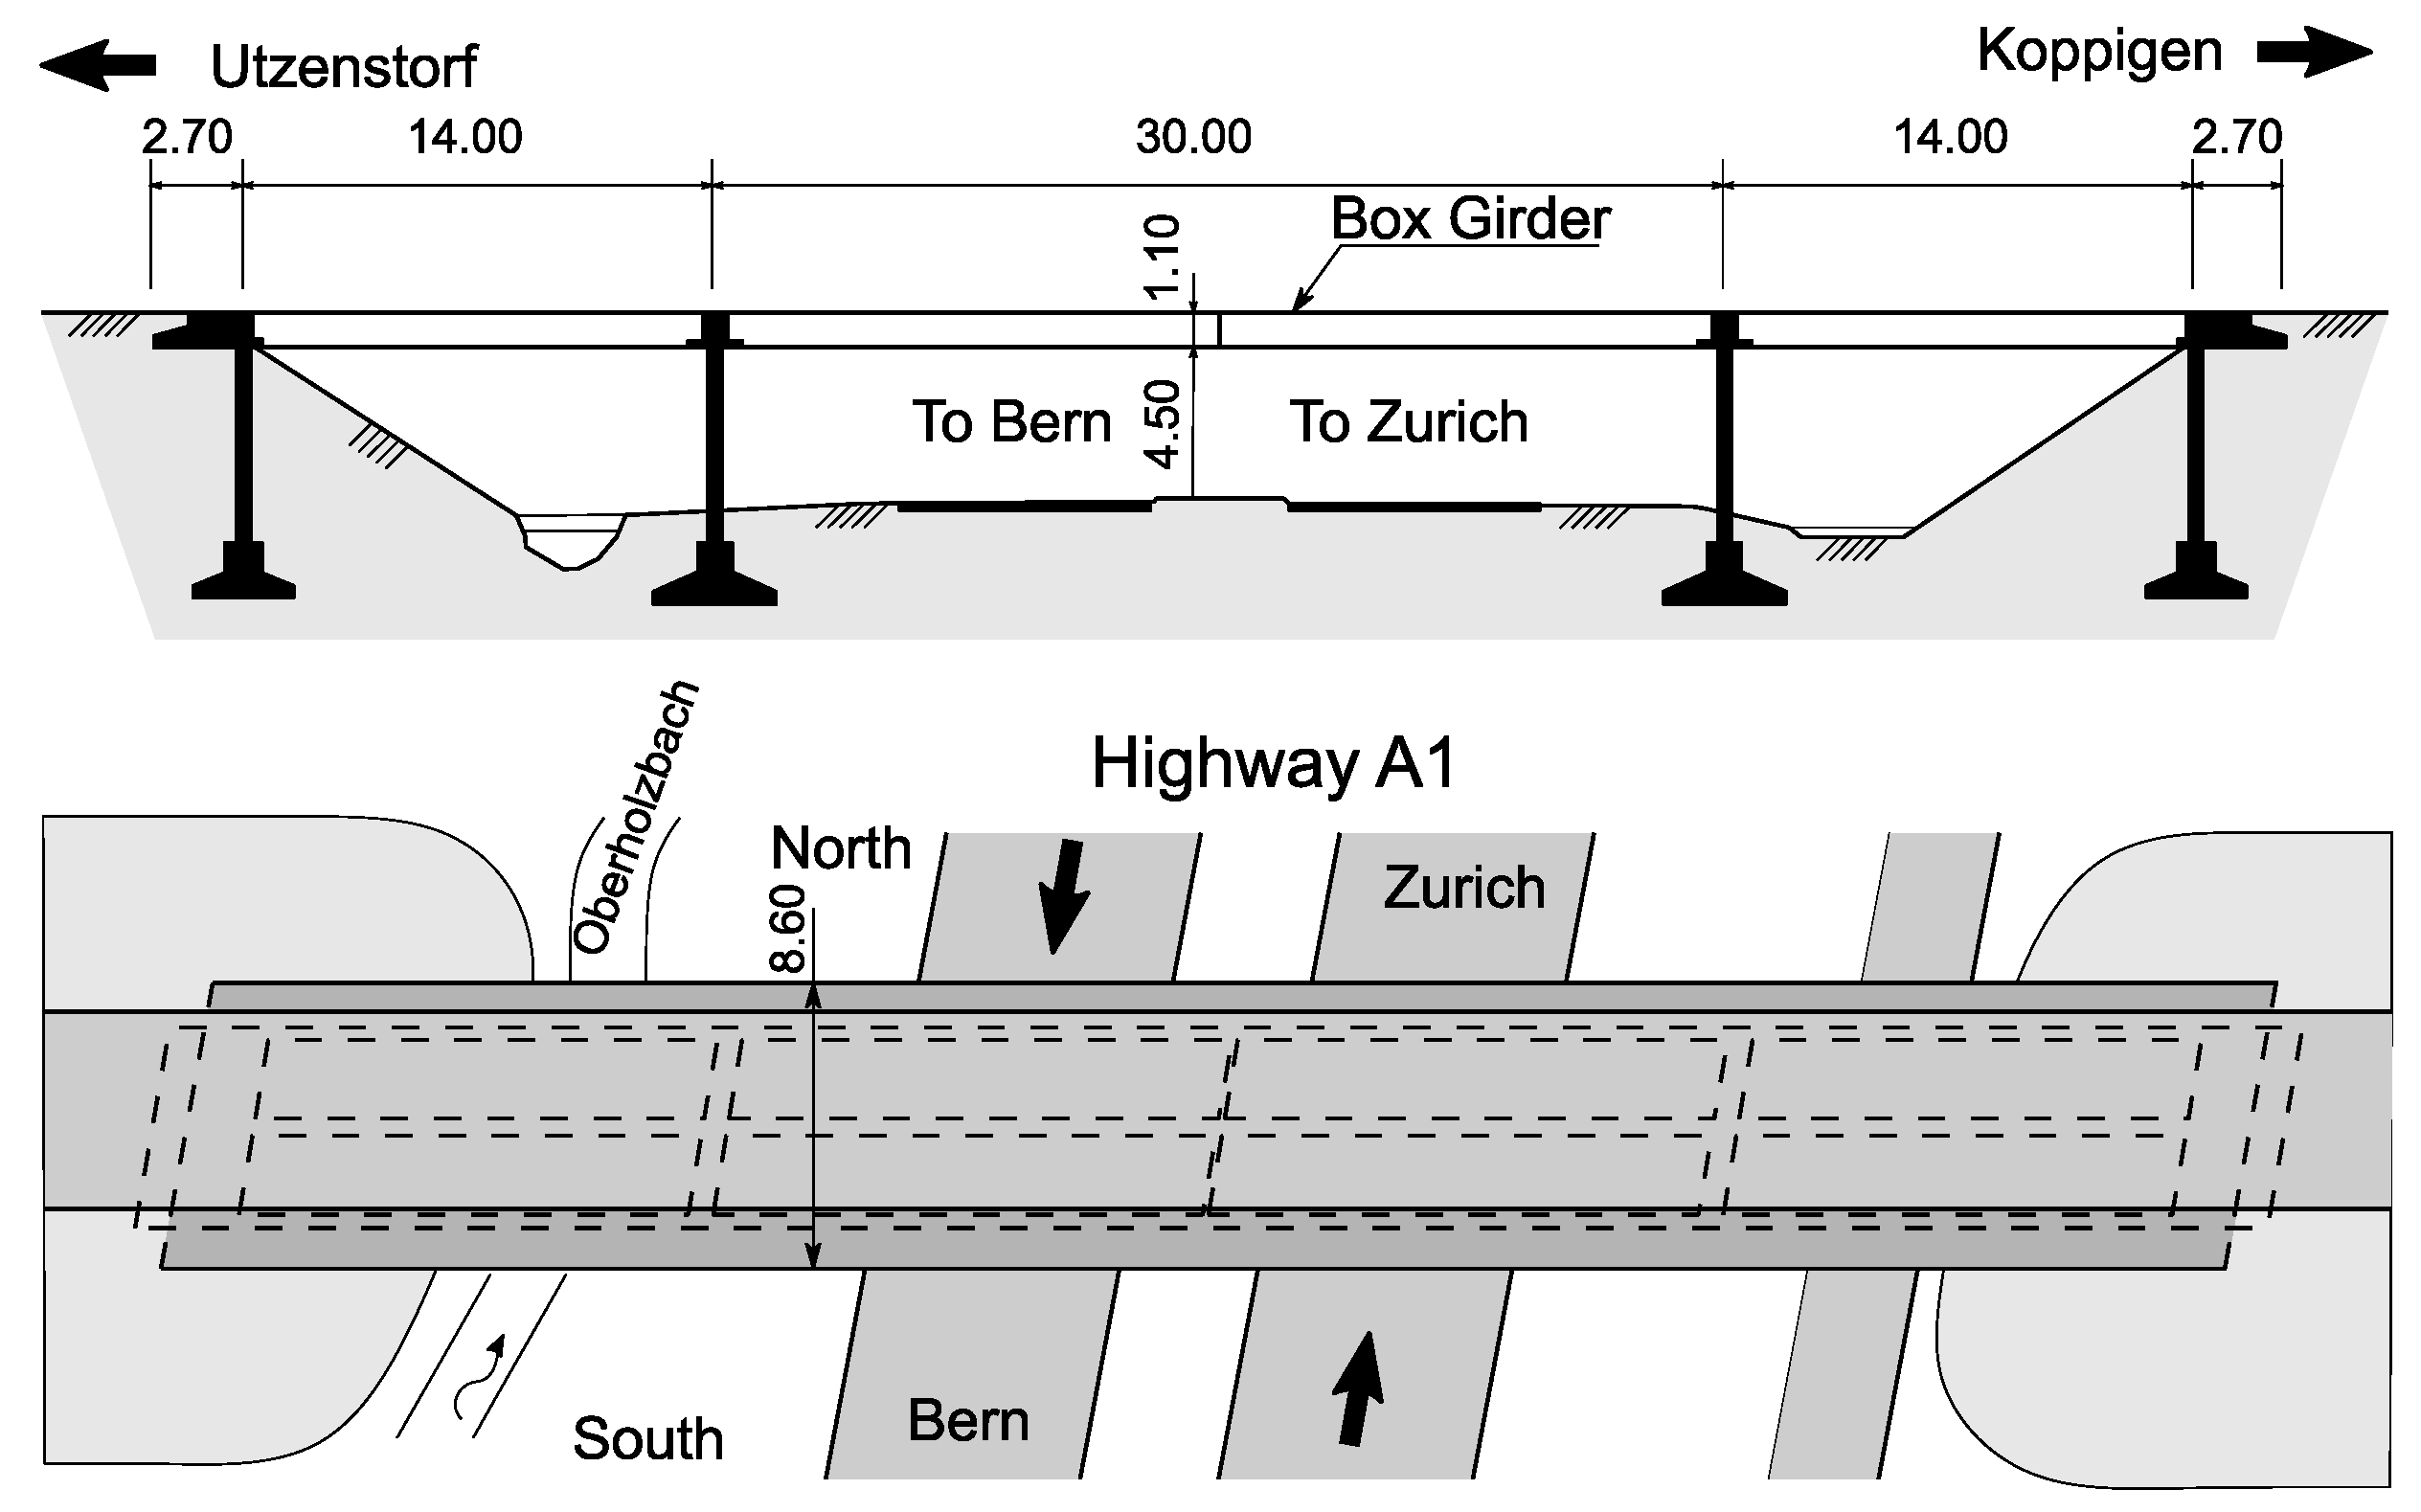
2.4. S101 Bridge
2.5. Qatar University Grandstand Simulator
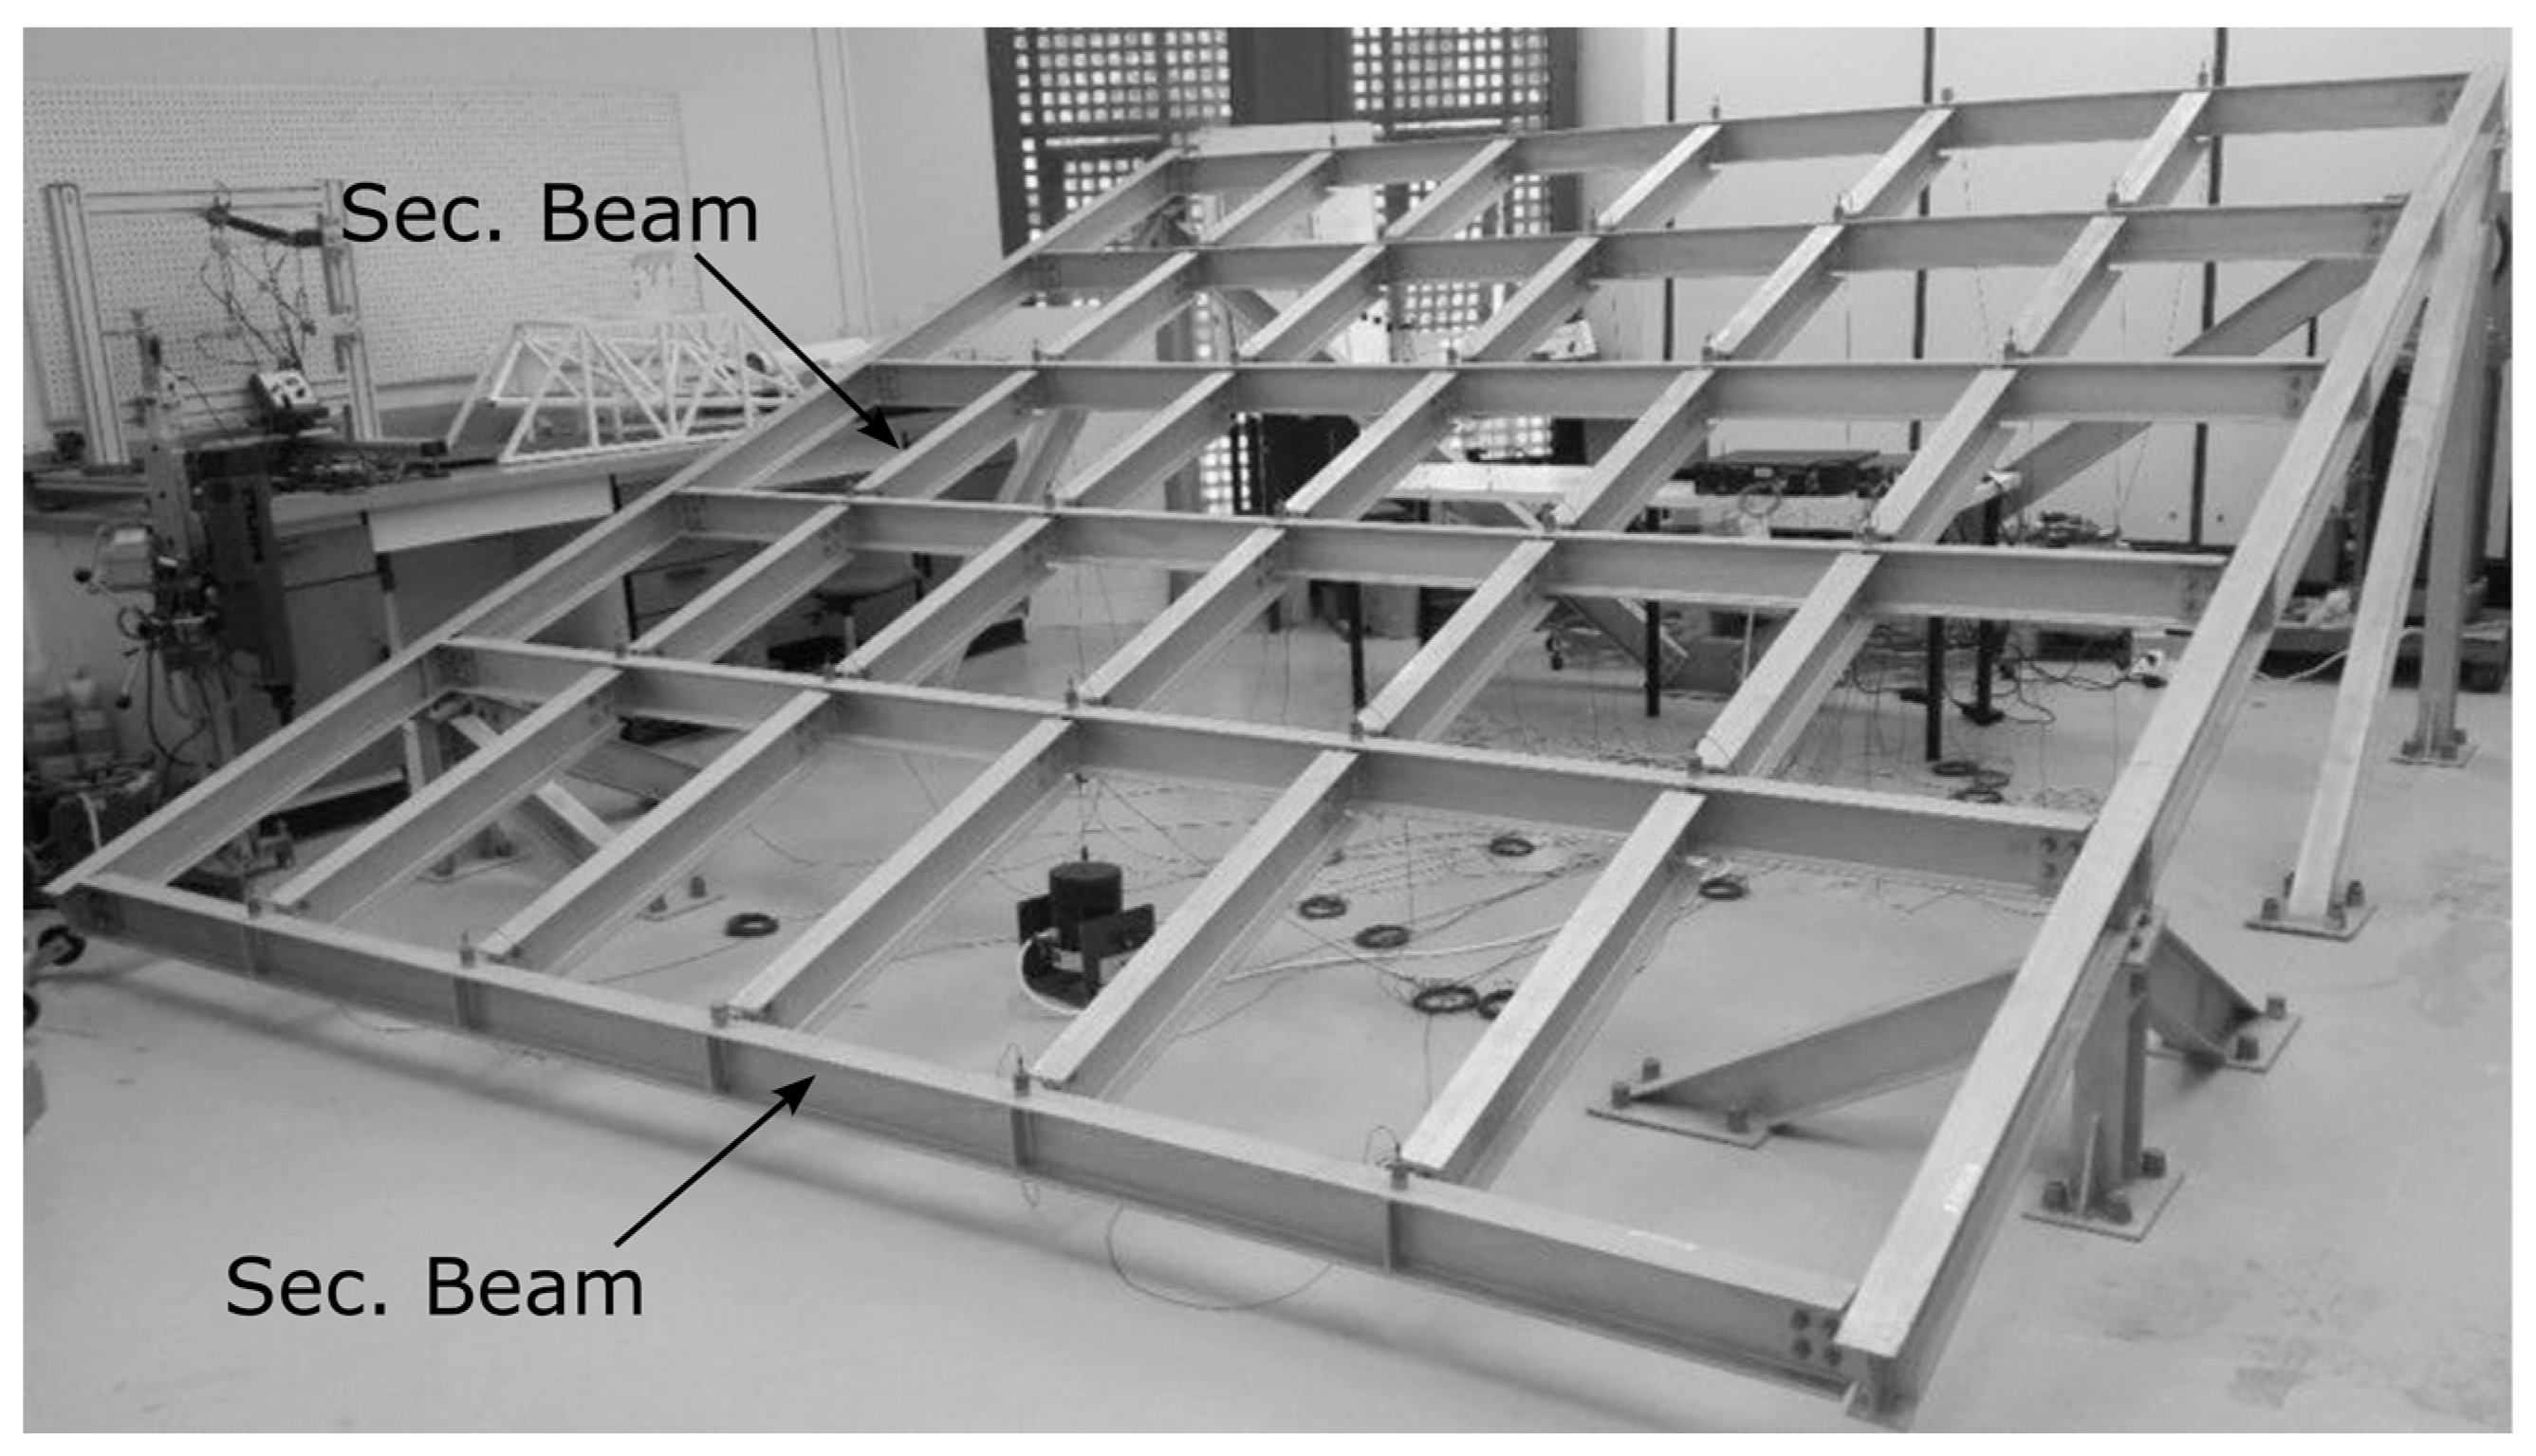
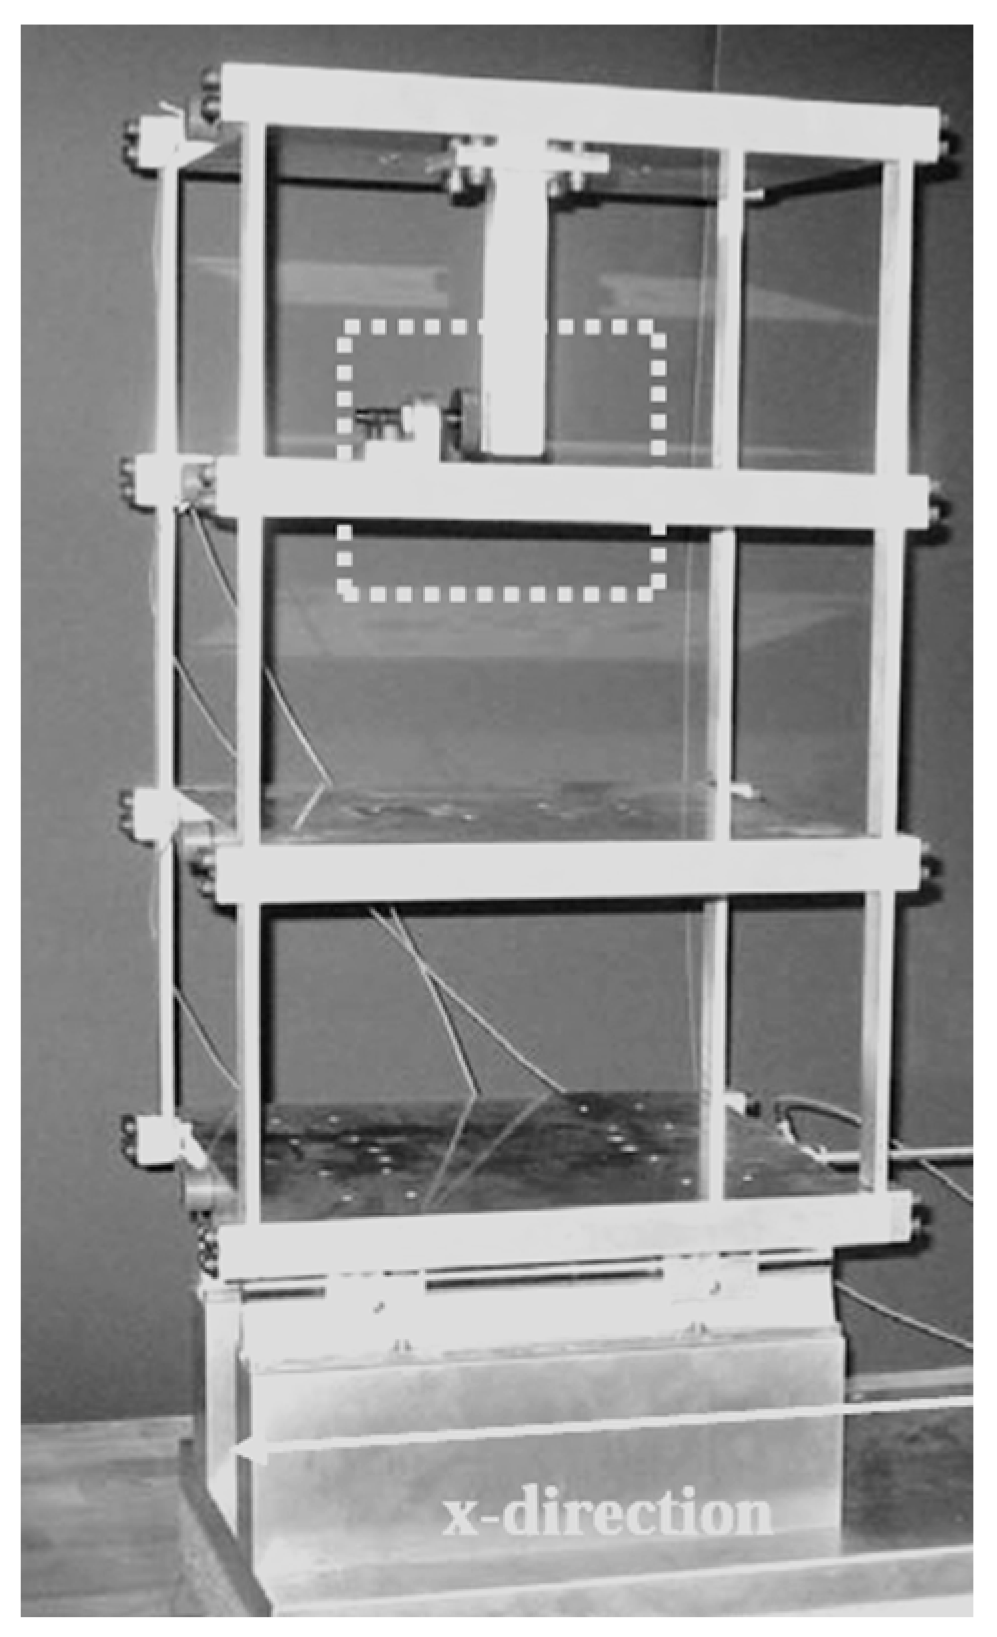
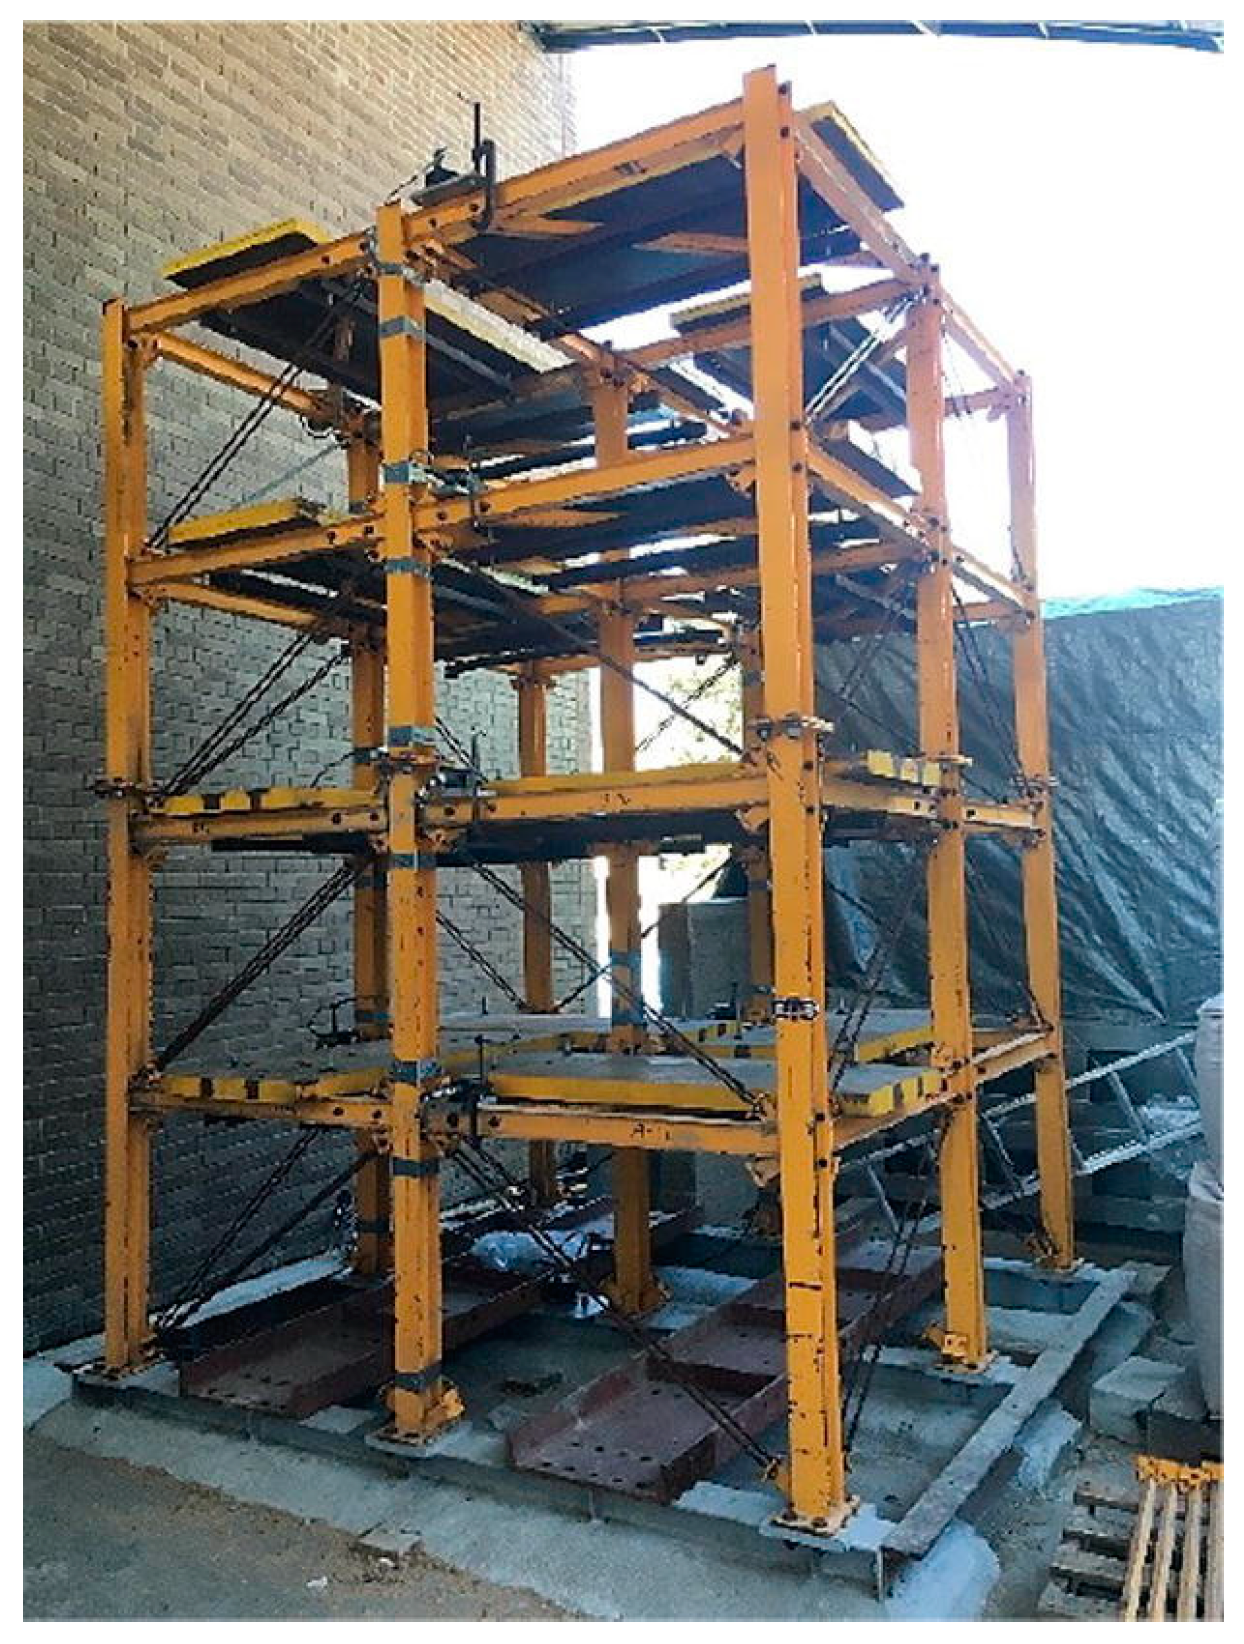
2.6. Los Alamos National Laboratory Three-Story Frame Structure
2.7. IASC-ASCE Benchmark Structure
2.8. Tianjin Yonghe Bridge
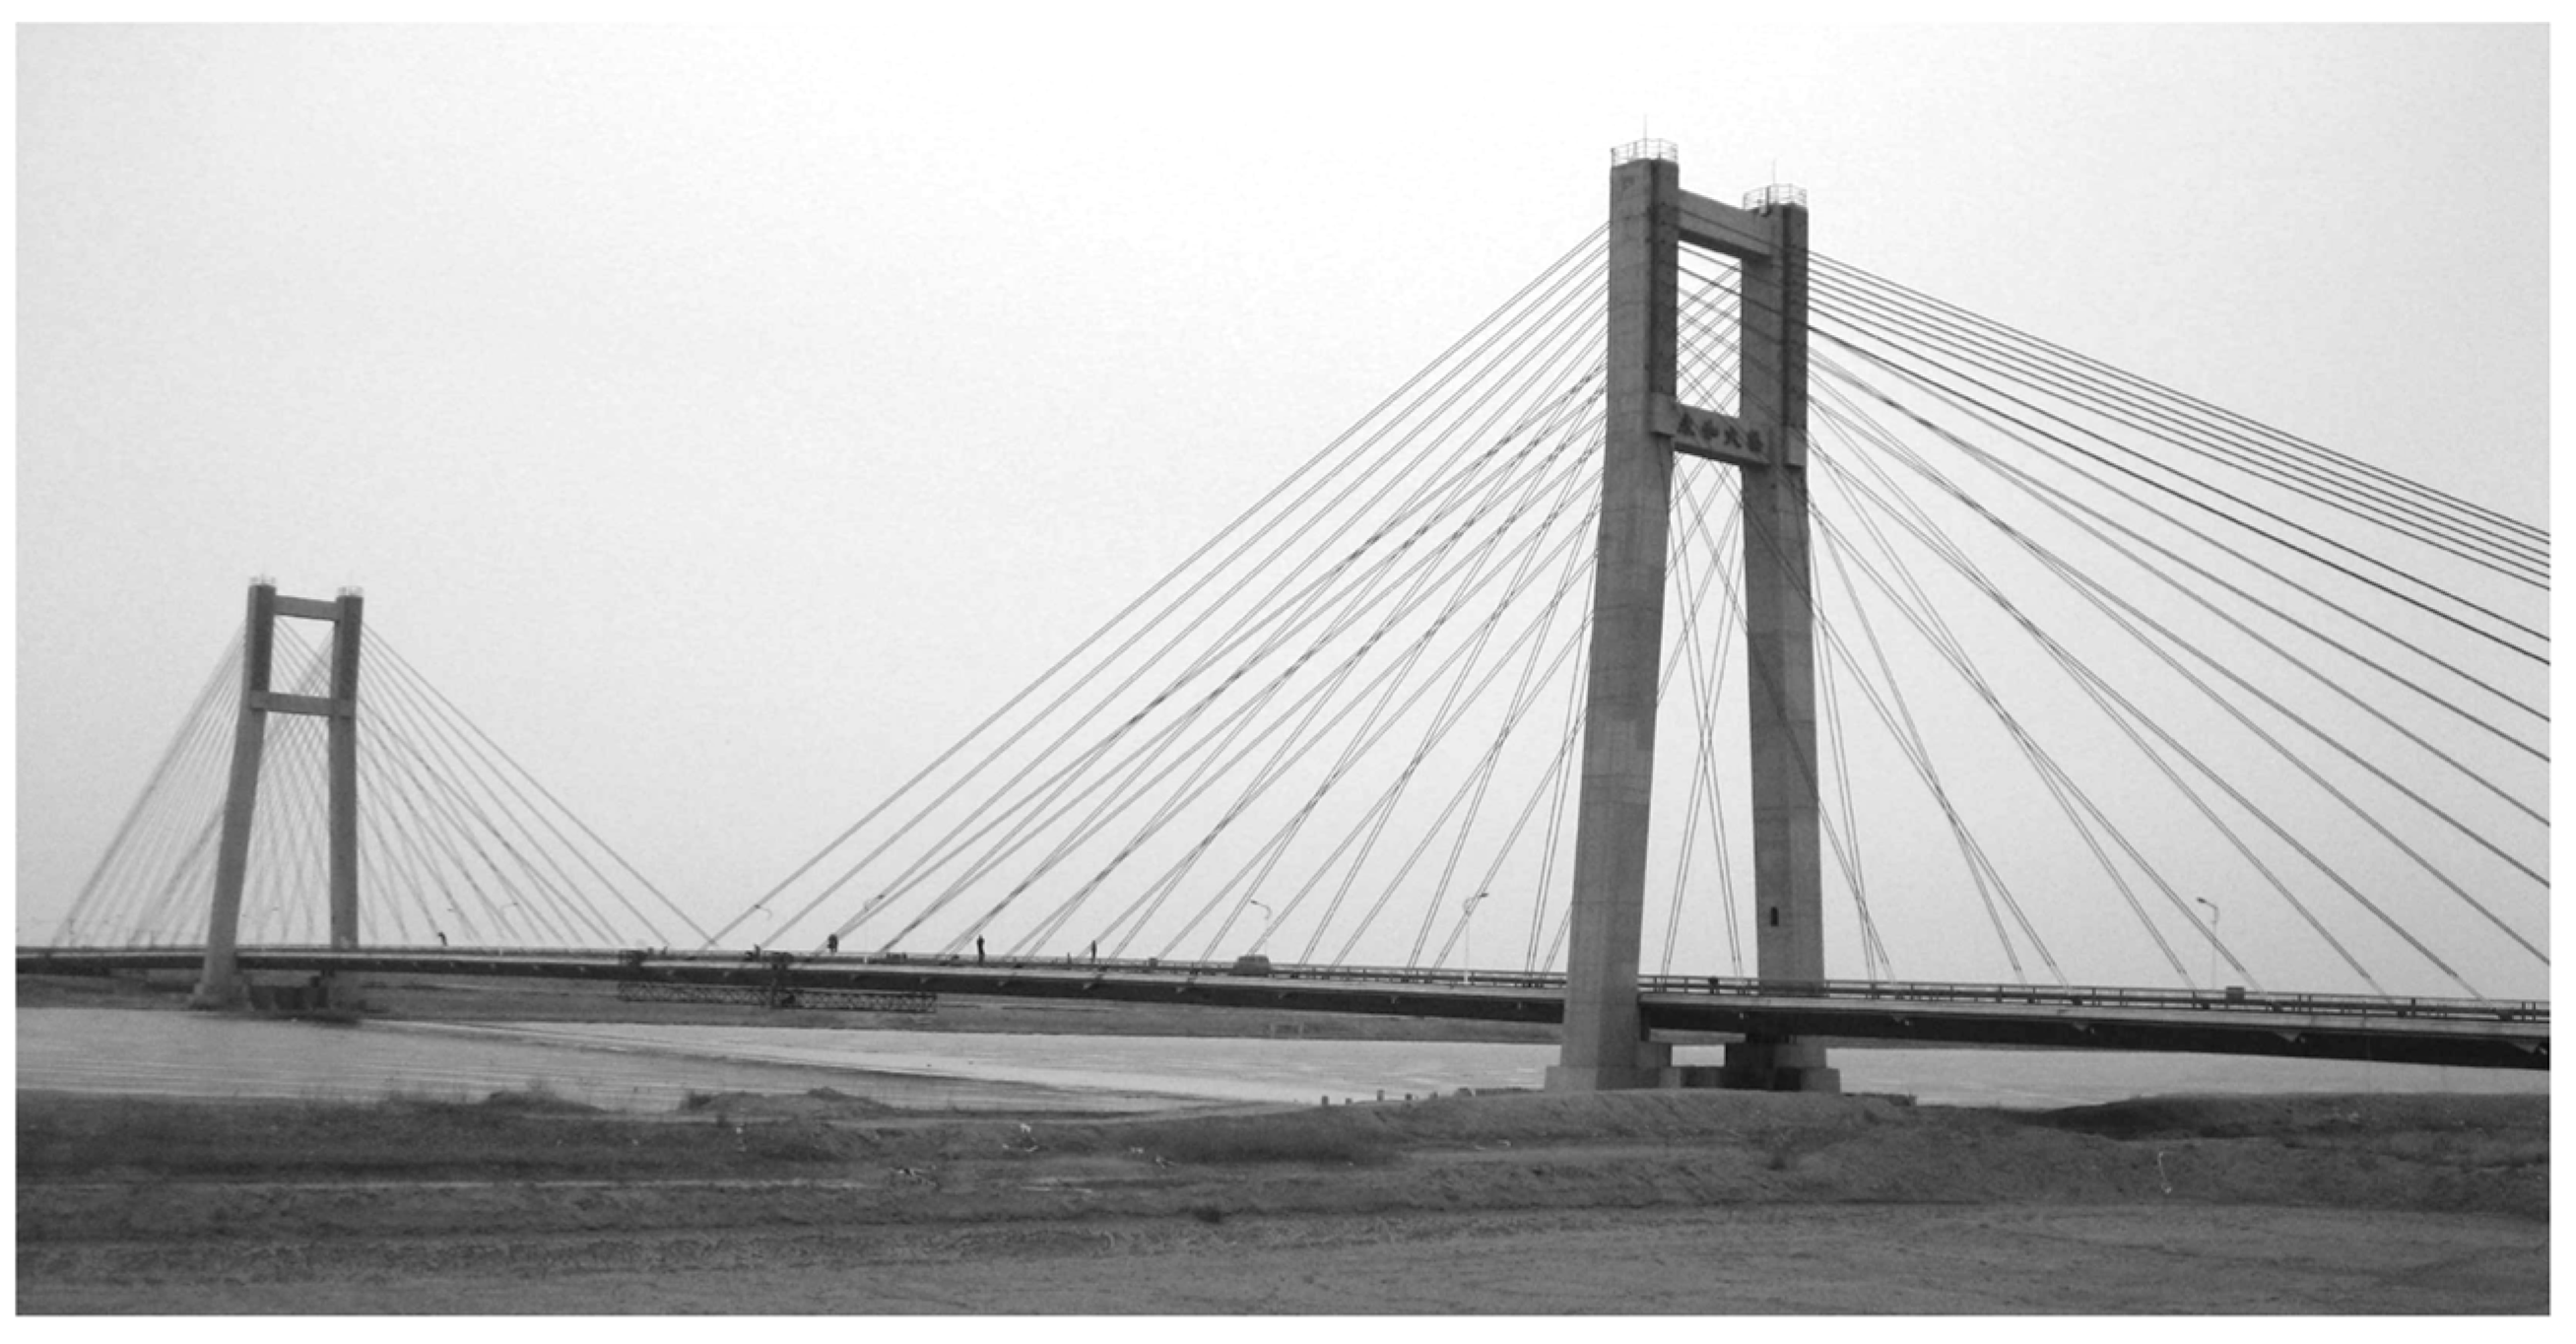
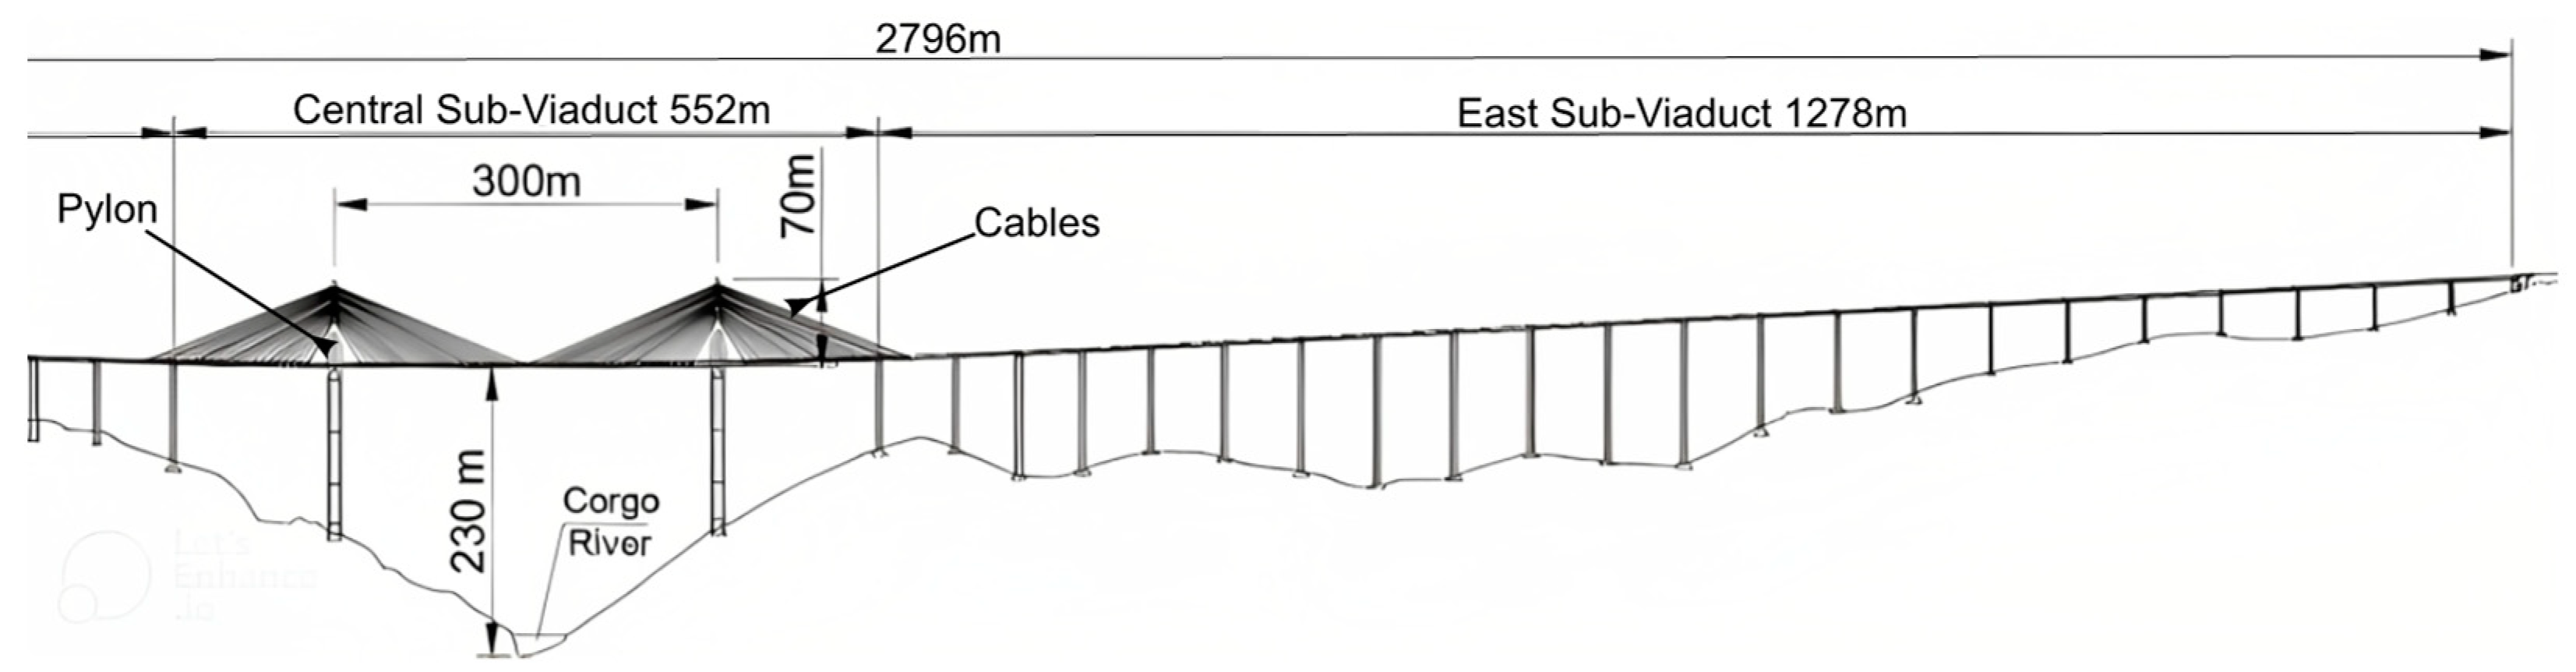
2.9. The Corgo Bridge
2.10. PI-57 Bridge
3. Conventional Feature Extraction Techniques
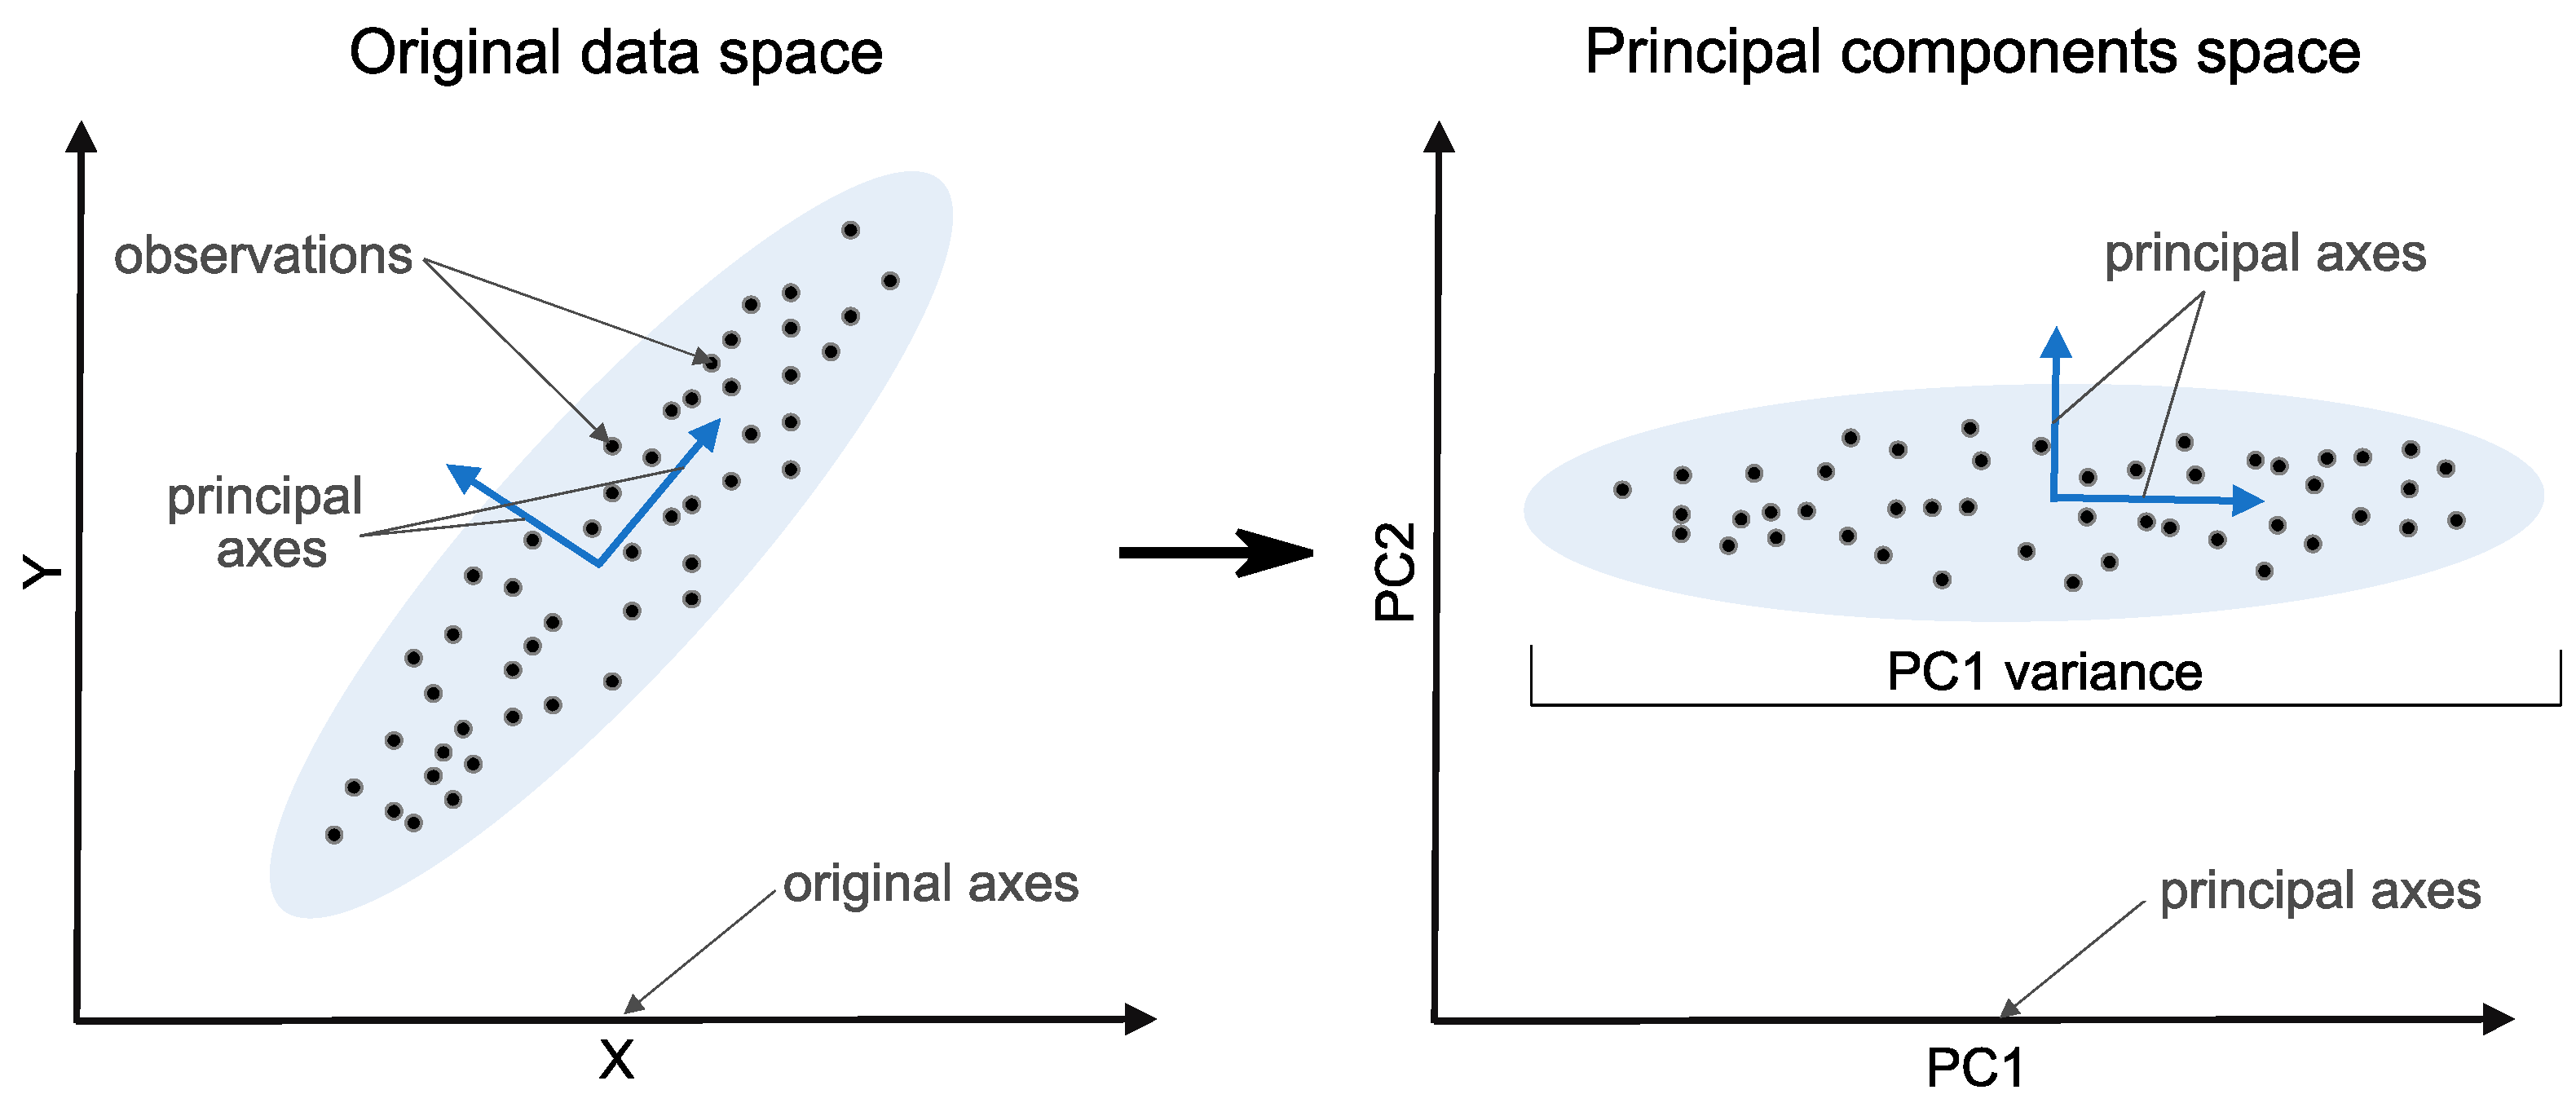
3.1. Subspace Analysis-Based Dimensionality Reduction
3.2. Signal Processing Techniques
3.3. Signal Decomposition Techniques
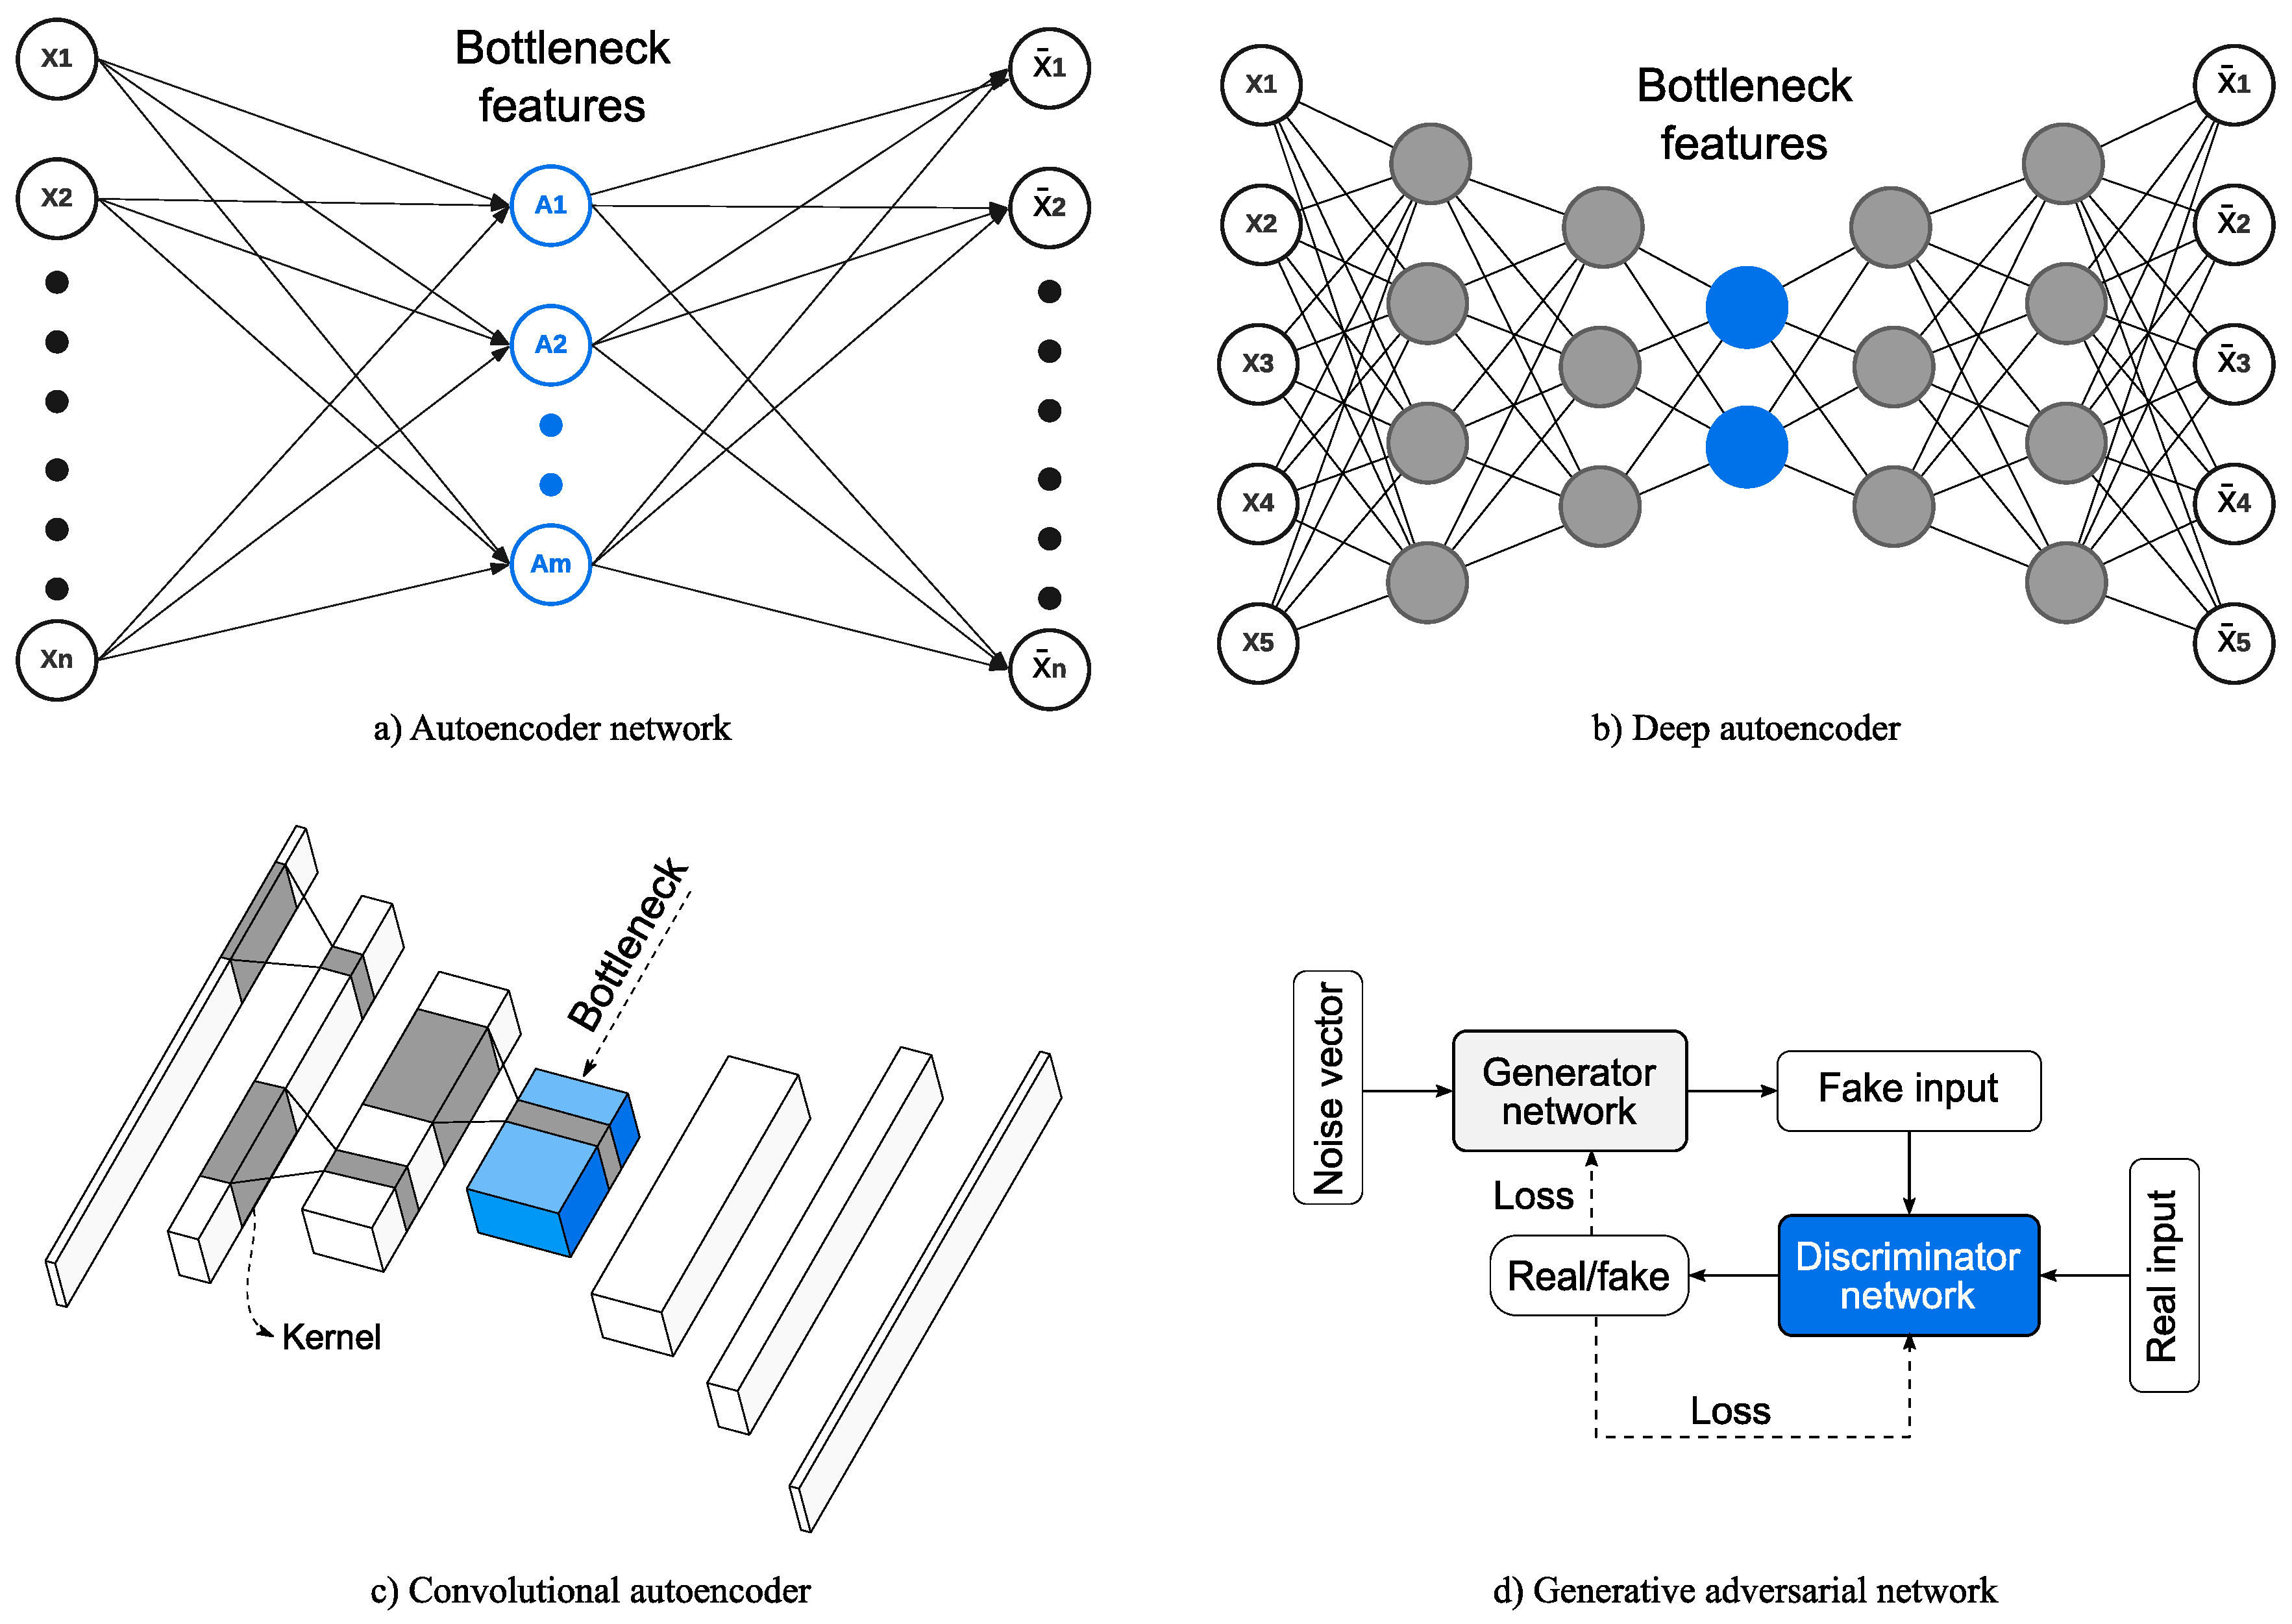
4. Unsupervised Learning SHM Based on Artificial Neural Networks
4.1. Classical Neural Networks
4.2. Deep Dense Neural Networks
4.3. Convolutional Neural Networks
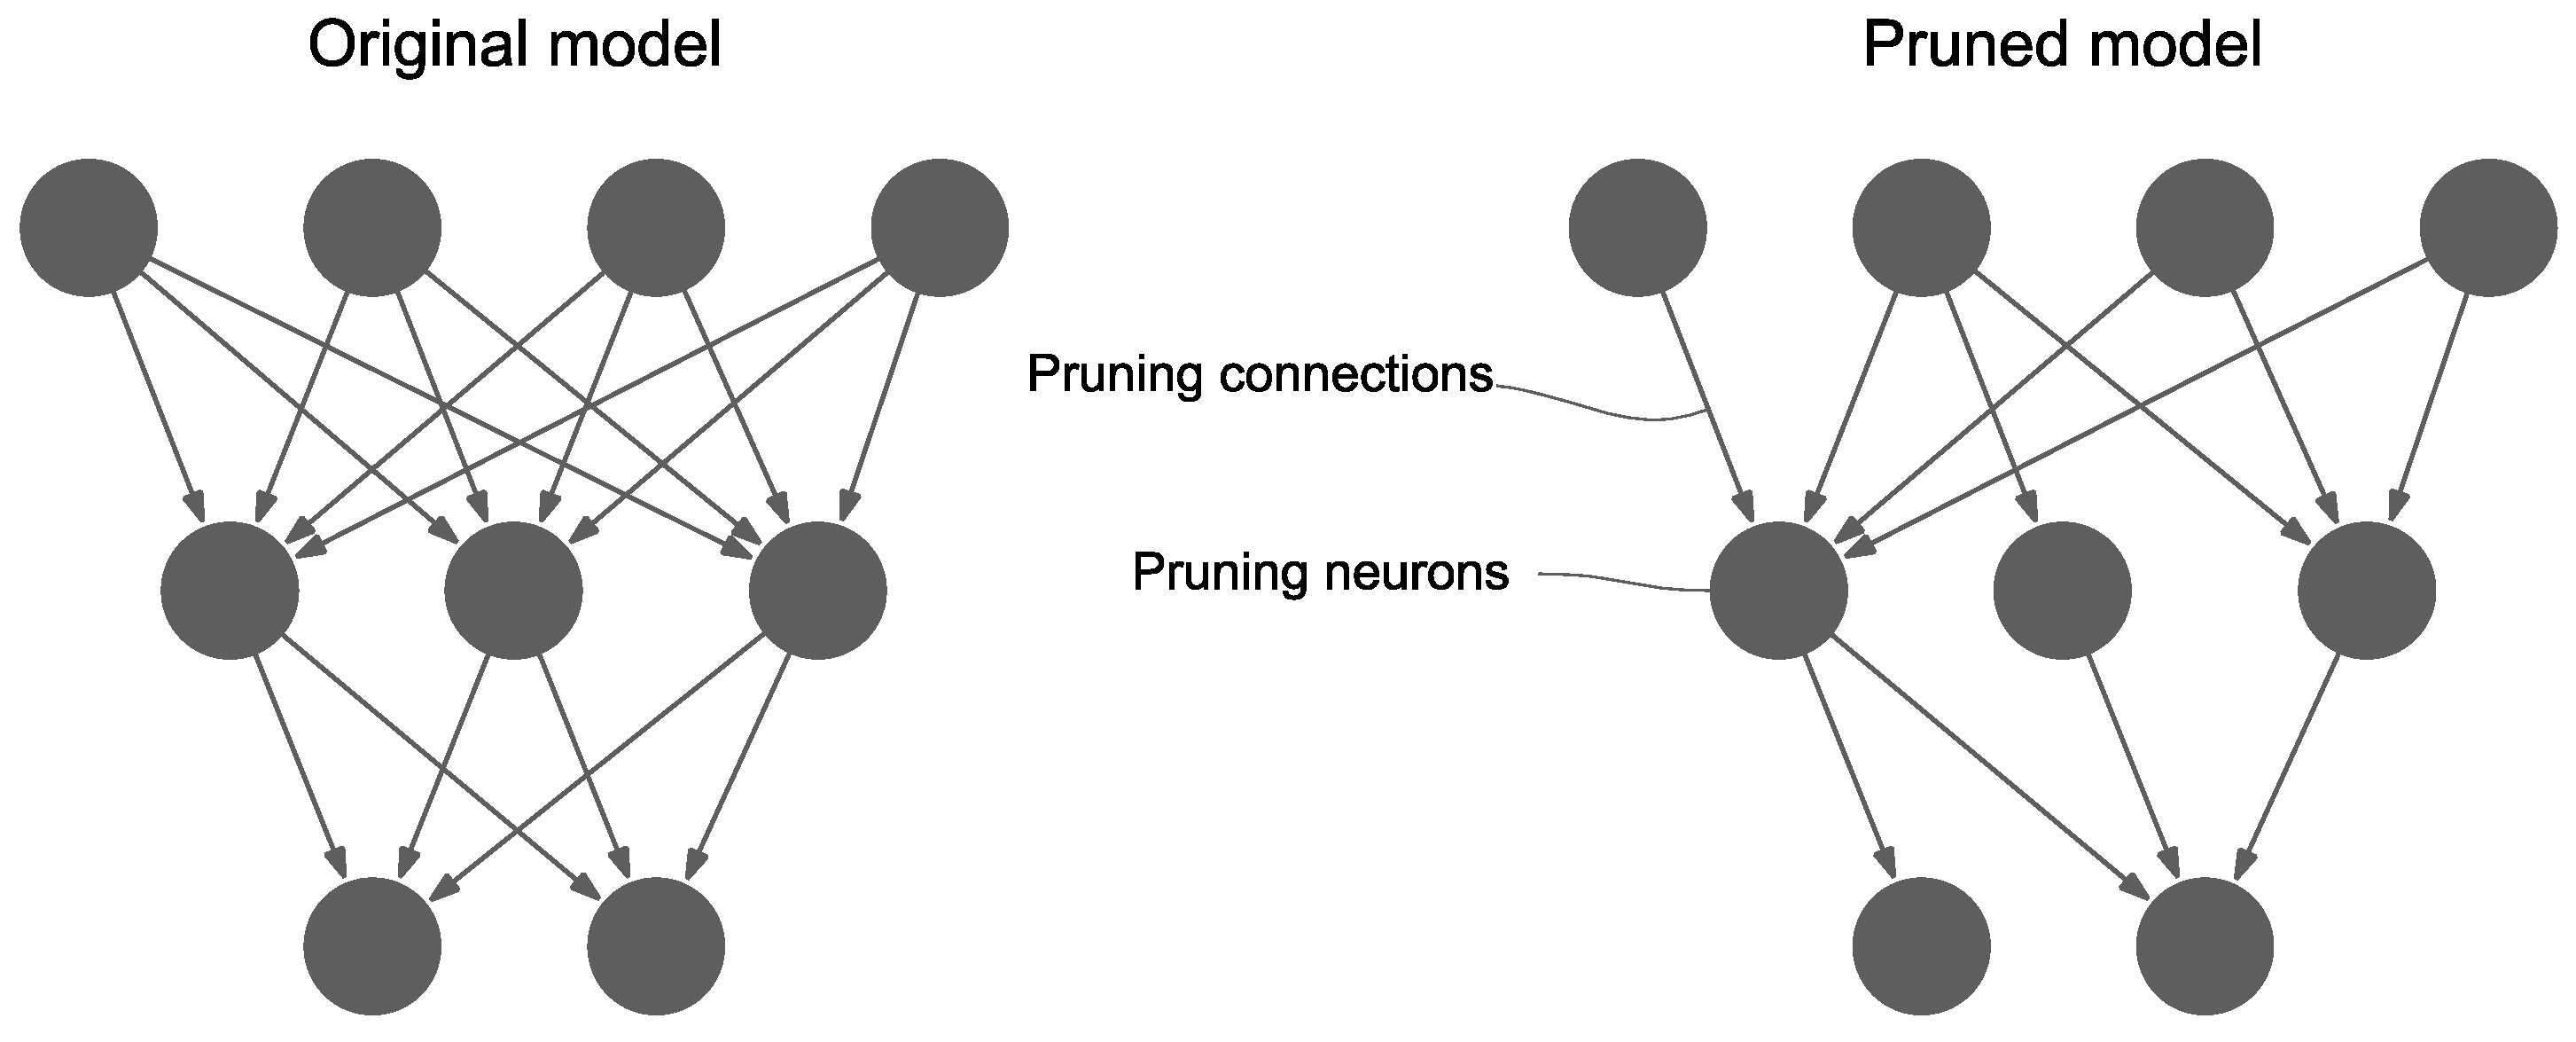
4.4. Other Deep Learning Architectures
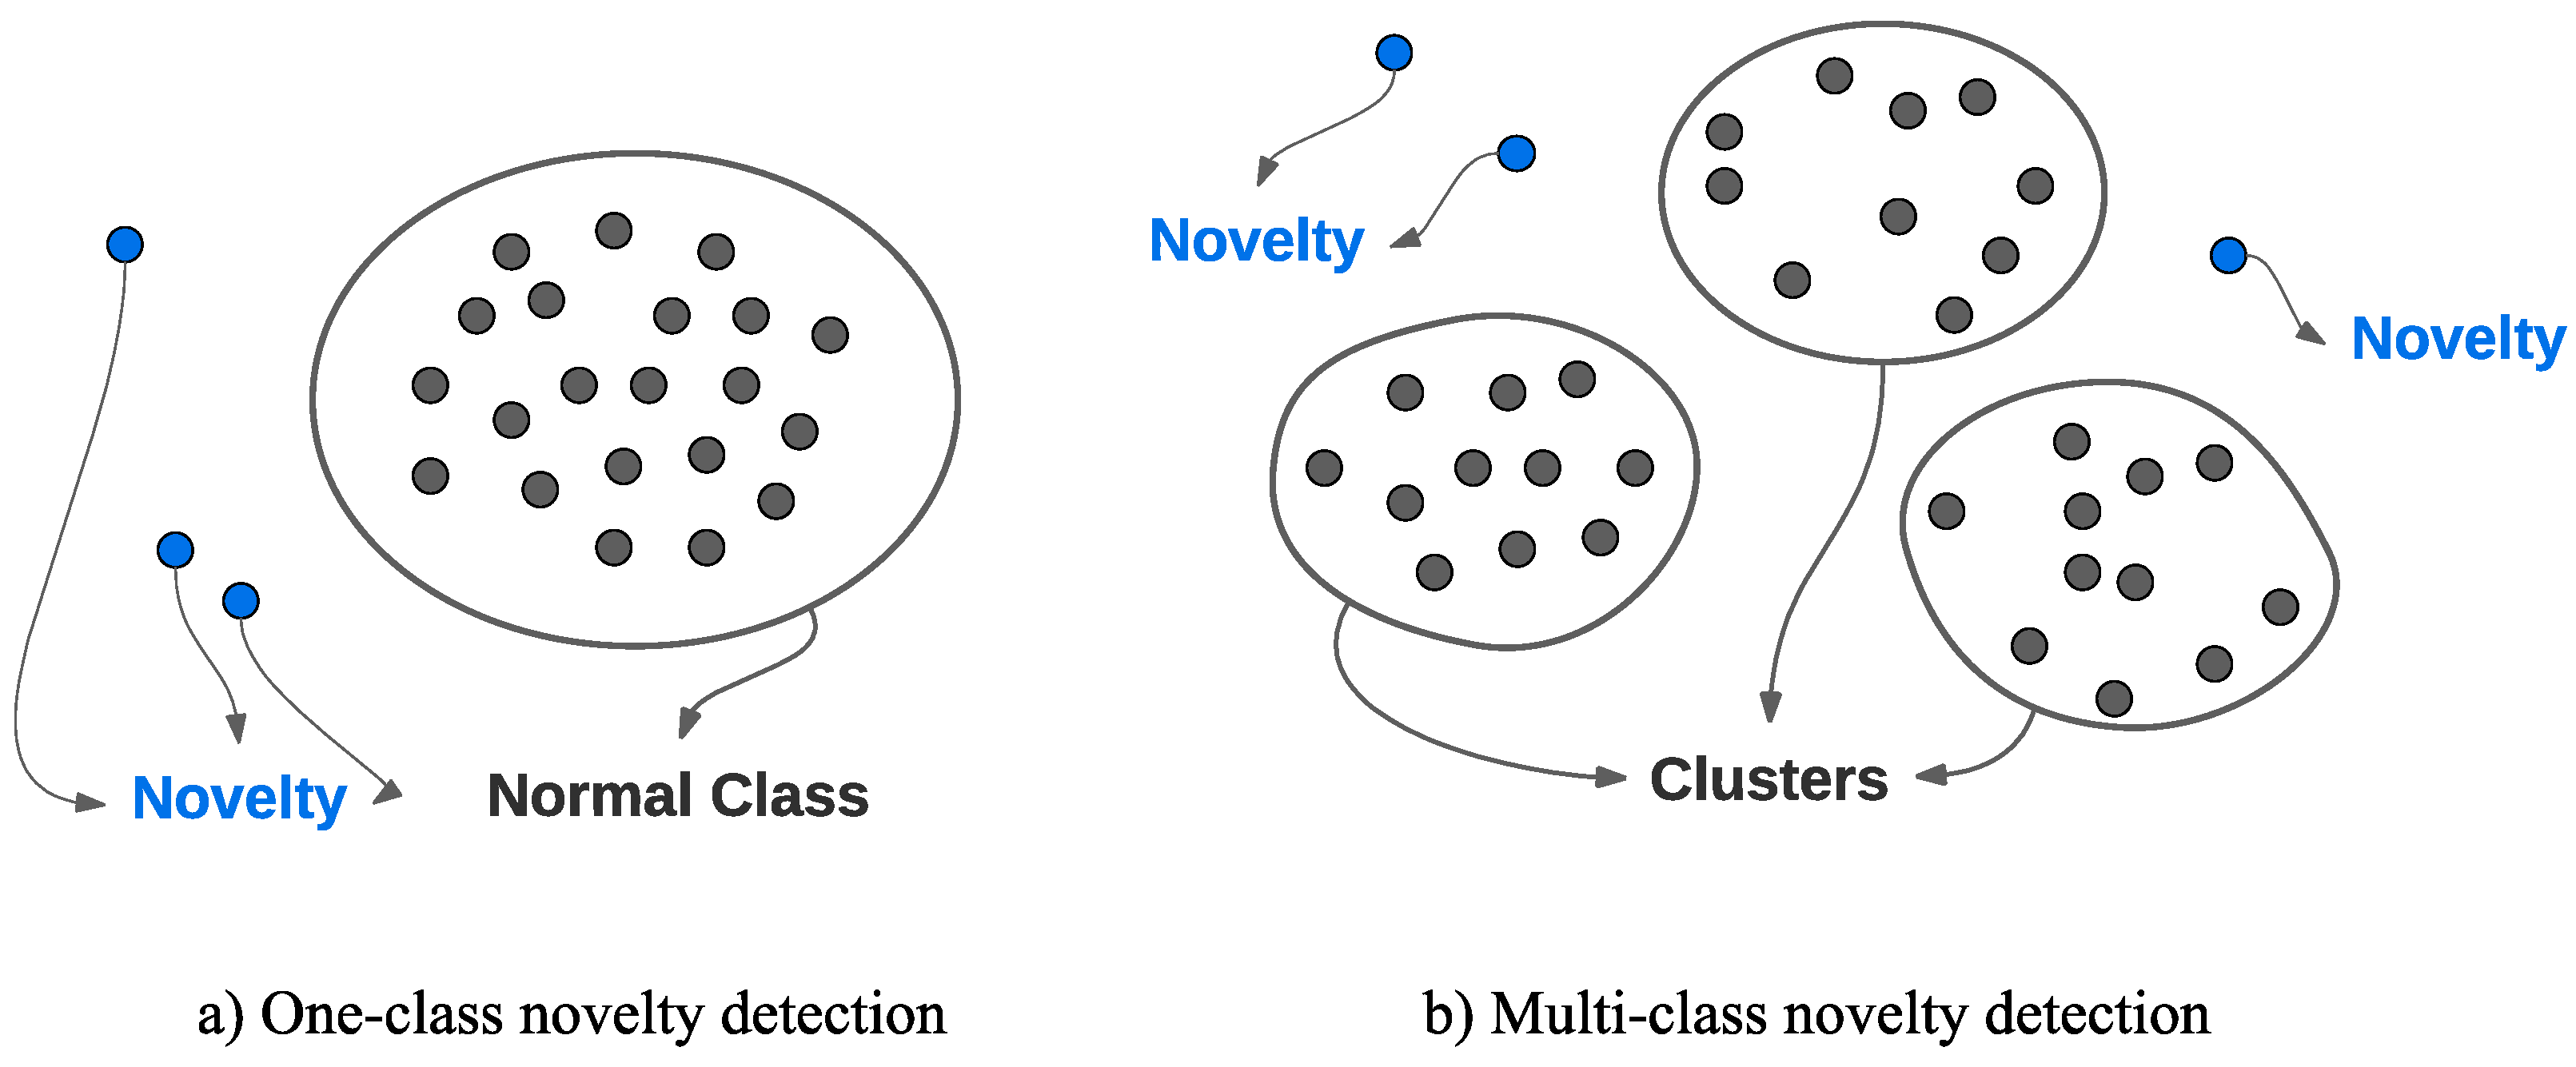
5. Novelty Detection Techniques
5.1. One-Class Novelty Detection
5.2. Cluster Analysis
5.3. Bayesian Methods
5.4. Other Methods
6. Challenges and Future Trends
6.1. Parameters Selection
6.2. Environmental and Operational Variability
6.3. Benchmarking Standards
6.4. Datasets Availability
6.5. Deep Learning
6.6. Model Generalization
7. Conclusions
Author Contributions
Funding
Institutional Review Board Statement
Informed Consent Statement
Data Availability Statement
Conflicts of Interest
References
- Chen, H.-P.; Ni, Y.-Q. Structural Health Monitoring of Large Civil Engineering Structures; John Wiley & Sons: Hoboken, NJ, USA, 2018. [Google Scholar]
- Farrar, C.R.; Worden, K. Structural Health Monitoring: A Machine Learning Perspective; John Wiley & Sons: Hoboken, NJ, USA, 2012. [Google Scholar]
- Farrar, C.R.; Worden, K. An introduction to structural health monitoring. Philos. Trans. R. Soc. A Math. Phys. Eng. Sci. 2007, 365, 303–315. [Google Scholar] [CrossRef] [PubMed]
- Farrar, C.R.; Doebling, S.W.; Nix, D.A. Vibration–based structural damage identification. Philos. Trans. R. Soc. Lond. Ser. A Math. Phys. Eng. Sci. 2001, 359, 131–149. [Google Scholar] [CrossRef]
- Rytter, A. Vibrational Based Inspection of Civil Engineering Structures. Ph.D. Thesis, Department of Building Technology and Structural Engineering, Aalborg University, Aalborg, Denmark, 1993. [Google Scholar]
- Spencer, B.F., Jr.; Hoskere, V.; Narazaki, Y. Advances in computer vision-based civil infrastructure inspection and monitoring. Engineering 2019, 5, 199–222. [Google Scholar] [CrossRef]
- Dong, C.-Z.; Catbas, F.N. A review of computer vision–based structural health monitoring at local and global levels. Struct. Health Monit. 2021, 20, 692–743. [Google Scholar] [CrossRef]
- Lingxin, Z.; Junkai, S.; Baijie, Z. A review of the research and application of deep learning-based computer vision in structural damage detection. Earthq. Eng. Eng. Vib. 2022, 21, 1–21. [Google Scholar] [CrossRef]
- Friswell, M.I.; Mottershead, J.E. Finite Element Model Updating in Structural Dynamics; Springer: Dordrecht, The Netherlands, 1995. [Google Scholar]
- Teughels, A.; De Roeck, G. Structural damage identification of the highway bridge Z24 by FE model updating. J. Sound Vib. 2004, 278, 589–610. [Google Scholar] [CrossRef]
- Bakir, P.G.; Reynders, E.; De Roeck, G. Sensitivity-based finite element model updating using constrained optimization with a trust region algorithm. J. Sound Vib. 2007, 305, 211–225. [Google Scholar] [CrossRef]
- Cheung, S.H.; Beck, J.L. Bayesian model updating using hybrid Monte Carlo simulation with application to structural dynamic models with many uncertain parameters. J. Eng. Mech. 2009, 135, 243–255. [Google Scholar] [CrossRef]
- Huang, Y.; Beck, J.L. Full Gibbs Sampling Procedure for Bayesian System Identification Incorporating Sparse Bayesian Learning with Automatic Relevance Determination. Comput.-Aided Civ. Infrastruct. Eng. 2018, 33, 712–730. [Google Scholar] [CrossRef]
- Sanayei, M.; Arya, B.; Santini, E.M.; Wadia-Fascetti, S. Significance of modeling error in structural parameter estimation. Comput.-Aided Civ. Infrastruct. Eng. 2001, 16, 12–27. [Google Scholar] [CrossRef]
- Marwala, T. Finite Element Model Updating Using Computational Intelligence Techniques: Applications to Structural Dynamics; Springer: London, UK, 2010. [Google Scholar]
- Kim, Y.; Chong, J.W.; Chon, K.H.; Kim, J. Wavelet-based AR–SVM for health monitoring of smart structures. Smart Mater. Struct. 2012, 22, 015003. [Google Scholar] [CrossRef]
- Sajedi, S.O.; Liang, X. A data-driven framework for near real-time and robust damage diagnosis of building structures. Struct. Control Health Monit. 2020, 27, e2488. [Google Scholar] [CrossRef]
- Alves, V.; Cury, A.; Roitman, N.; Magluta, C.; Cremona, C. Structural modification assessment using supervised learning methods applied to vibration data. Eng. Struct. 2015, 99, 439–448. [Google Scholar] [CrossRef]
- De Lautour, O.R.; Omenzetter, P. Prediction of seismic-induced structural damage using artificial neural networks. Eng. Struct. 2009, 31, 600–606. [Google Scholar] [CrossRef]
- Oh, B.K.; Kim, K.J.; Kim, Y.; Park, H.S.; Adeli, H. Evolutionary learning based sustainable strain sensing model for structural health monitoring of high-rise buildings. Appl. Soft Comput. 2017, 58, 576–585. [Google Scholar] [CrossRef]
- Abdeljaber, O.; Avci, O.; Kiranyaz, M.S.; Boashash, B.; Sodano, H.; Inman, D.J. 1-D CNNs for structural damage detection: Verification on a structural health monitoring benchmark data. Neurocomputing 2018, 275, 1308–1317. [Google Scholar] [CrossRef]
- Sajedi, S.O.; Liang, X. Vibration-based semantic damage segmentation for large-scale structural health monitoring. Comput.-Aided Civ. Infrastruct. Eng. 2020, 35, 579–596. [Google Scholar] [CrossRef]
- Sajedi, S.; Liang, X. Dual Bayesian inference for risk-informed vibration-based damage diagnosis. Comput.-Aided Civ. Infrastruct. Eng. 2021, 36, 1168–1184. [Google Scholar] [CrossRef]
- Sajedi, S.; Liang, X. Filter Banks and Hybrid Deep Learning Architectures for Performance-Based Seismic Assessments of Bridges. J. Struct. Eng. 2022, 148, 04022196. [Google Scholar] [CrossRef]
- Liang, X. Image-based post-disaster inspection of reinforced concrete bridge systems using deep learning with Bayesian optimization. Comput.-Aided Civ. Infrastruct. Eng. 2019, 34, 415–430. [Google Scholar] [CrossRef]
- Sajedi, S.O.; Liang, X. Uncertainty-assisted deep vision structural health monitoring. Comput.-Aided Civ. Infrastruct. Eng. 2021, 36, 126–142. [Google Scholar] [CrossRef]
- Eltouny, K.; Sajedi, S.; Liang, X. High-Fidelity Visual Structural Inspections through Transformers and Learnable Resizers. In Proceedings of the 8th World Conference on Structural Control and Monitoring, Orlando, FL, USA, 5–8 June 2022. [Google Scholar]
- Worden, K. Structural fault detection using a novelty measure. J. Sound Vib. 1997, 201, 85–101. [Google Scholar] [CrossRef]
- Worden, K.; Manson, G.; Fieller, N.R. Damage detection using outlier analysis. J. Sound Vib. 2000, 229, 647–667. [Google Scholar] [CrossRef]
- Worden, K.; Manson, G.; Allman, D. Experimental validation of a structural health monitoring methodology: Part I. Novelty detection on a laboratory structure. J. Sound Vib. 2003, 259, 323–343. [Google Scholar] [CrossRef]
- Gul, M.; Catbas, F.N. Statistical pattern recognition for Structural Health Monitoring using time series modeling: Theory and experimental verifications. Mech. Syst. Signal Process. 2009, 23, 2192–2204. [Google Scholar] [CrossRef]
- Sohn, H.; Worden, K.; Farrar, C.R. Statistical damage classification under changing environmental and operational conditions. J. Intell. Mater. Syst. Struct. 2002, 13, 561–574. [Google Scholar] [CrossRef]
- Yeung, W.; Smith, J. Damage detection in bridges using neural networks for pattern recognition of vibration signatures. Eng. Struct. 2005, 27, 685–698. [Google Scholar] [CrossRef]
- Jiang, X.; Adeli, H. Pseudospectra, MUSIC, and dynamic wavelet neural network for damage detection of highrise buildings. Int. J. Numer. Methods Eng. 2007, 71, 606–629. [Google Scholar] [CrossRef]
- Sohn, H.; Kim, S.D.; Harries, K. Reference-free damage classification based on cluster analysis. Comput.-Aided Civ. Infrastruct. Eng. 2008, 23, 324–338. [Google Scholar] [CrossRef]
- da Silva, S.; Júnior, M.D.; Junior, V.L.; Brennan, M.J. Structural damage detection by fuzzy clustering. Mech. Syst. Signal Process. 2008, 22, 1636–1649. [Google Scholar] [CrossRef]
- Doebling, S.W.; Farrar, C.R.; Prime, M.B.; Shevitz, D.W. Damage Identification and Health Monitoring of Structural and Mechanical Systems from Changes in Their Vibration Characteristics: A Literature Review; Los Alamos National Lab: Los Alamos, NM, USA, 1996.
- Sohn, H.; Farrar, C.R.; Hemez, F.M.; Shunk, D.D.; Stinemates, D.W.; Nadler, B.R.; Czarnecki, J.J. A Review of Structural Health Monitoring Literature: 1996–2001; Los Alamos National Laboratory: Los Alamos, NM, USA, 2003; Volume 1, p. 16.
- Carden, E.P.; Fanning, P. Vibration based condition monitoring: A review. Struct. Health Monit. 2004, 3, 355–377. [Google Scholar] [CrossRef]
- Fan, W.; Qiao, P. Vibration-based damage identification methods: A review and comparative study. Struct. Health Monit. 2011, 10, 83–111. [Google Scholar] [CrossRef]
- Salawu, O. Detection of structural damage through changes in frequency: A review. Eng. Struct. 1997, 19, 718–723. [Google Scholar] [CrossRef]
- He, K.; Zhu, W. Structural damage detection using changes in natural frequencies: Theory and applications. J. Phys. Conf. Ser. 2011, 305, 012054. [Google Scholar] [CrossRef]
- Chesné, S.; Deraemaeker, A. Damage localization using transmissibility functions: A critical review. Mech. Syst. Signal Process. 2013, 38, 569–584. [Google Scholar] [CrossRef]
- Chen, B.; Zhao, S.-L.; Li, P.-Y. Application of Hilbert-Huang transform in structural health monitoring: A state-of-the-art review. Math. Probl. Eng. 2014, 2014, 317954. [Google Scholar] [CrossRef]
- Amezquita-Sanchez, J.P.; Adeli, H. Signal processing techniques for vibration-based health monitoring of smart structures. Arch. Comput. Methods Eng. 2016, 23, 1–15. [Google Scholar] [CrossRef]
- Hou, R.; Xia, Y. Review on the new development of vibration-based damage identification for civil engineering structures: 2010–2019. J. Sound Vib. 2021, 491, 115741. [Google Scholar] [CrossRef]
- Sun, L.; Shang, Z.; Xia, Y.; Bhowmick, S.; Nagarajaiah, S. Review of bridge structural health monitoring aided by big data and artificial intelligence: From condition assessment to damage detection. J. Struct. Eng. 2020, 146, 04020073. [Google Scholar] [CrossRef]
- Zinno, R.; Haghshenas, S.S.; Guido, G.; VItale, A. Artificial intelligence and structural health monitoring of bridges: A review of the state-of-the-art. IEEE Access 2022, 10, 88058–88078. [Google Scholar] [CrossRef]
- Gharehbaghi, V.R.; Noroozinejad Farsangi, E.; Noori, M.; Yang, T.; Li, S.; Nguyen, A.; Málaga-Chuquitaype, C.; Gardoni, P.; Mirjalili, S. A critical review on structural health monitoring: Definitions, methods, and perspectives. Arch. Comput. Methods Eng. 2021, 29, 2209–2235. [Google Scholar] [CrossRef]
- Gordan, M.; Sabbagh-Yazdi, S.-R.; Ismail, Z.; Ghaedi, K.; Carroll, P.; McCrum, D.; Samali, B. State-of-the-art review on advancements of data mining in structural health monitoring. Measurement 2022, 193, 110939. [Google Scholar] [CrossRef]
- Cawley, P. Structural health monitoring: Closing the gap between research and industrial deployment. Struct. Health Monit. 2018, 17, 1225–1244. [Google Scholar] [CrossRef]
- Salehi, H.; Burgueño, R. Emerging artificial intelligence methods in structural engineering. Eng. Struct. 2018, 171, 170–189. [Google Scholar] [CrossRef]
- Azimi, M.; Eslamlou, A.D.; Pekcan, G. Data-driven structural health monitoring and damage detection through deep learning: State-of-the-art review. Sensors 2020, 20, 2778. [Google Scholar] [CrossRef]
- Ye, X.; Jin, T.; Yun, C. A review on deep learning-based structural health monitoring of civil infrastructures. Smart Struct. Syst. 2019, 24, 567–585. [Google Scholar]
- Flah, M.; Nunez, I.; Chaabene, W.B.; Nehdi, M.L. Machine learning algorithms in civil structural health monitoring: A systematic review. Arch. Comput. Methods Eng. 2021, 28, 2621–2643. [Google Scholar] [CrossRef]
- Avci, O.; Abdeljaber, O.; Kiranyaz, S.; Hussein, M.; Gabbouj, M.; Inman, D.J. A review of vibration-based damage detection in civil structures: From traditional methods to Machine Learning and Deep Learning applications. Mech. Syst. Signal Process. 2021, 147, 107077. [Google Scholar] [CrossRef]
- Sony, S.; Dunphy, K.; Sadhu, A.; Capretz, M. A systematic review of convolutional neural network-based structural condition assessment techniques. Eng. Struct. 2021, 226, 111347. [Google Scholar] [CrossRef]
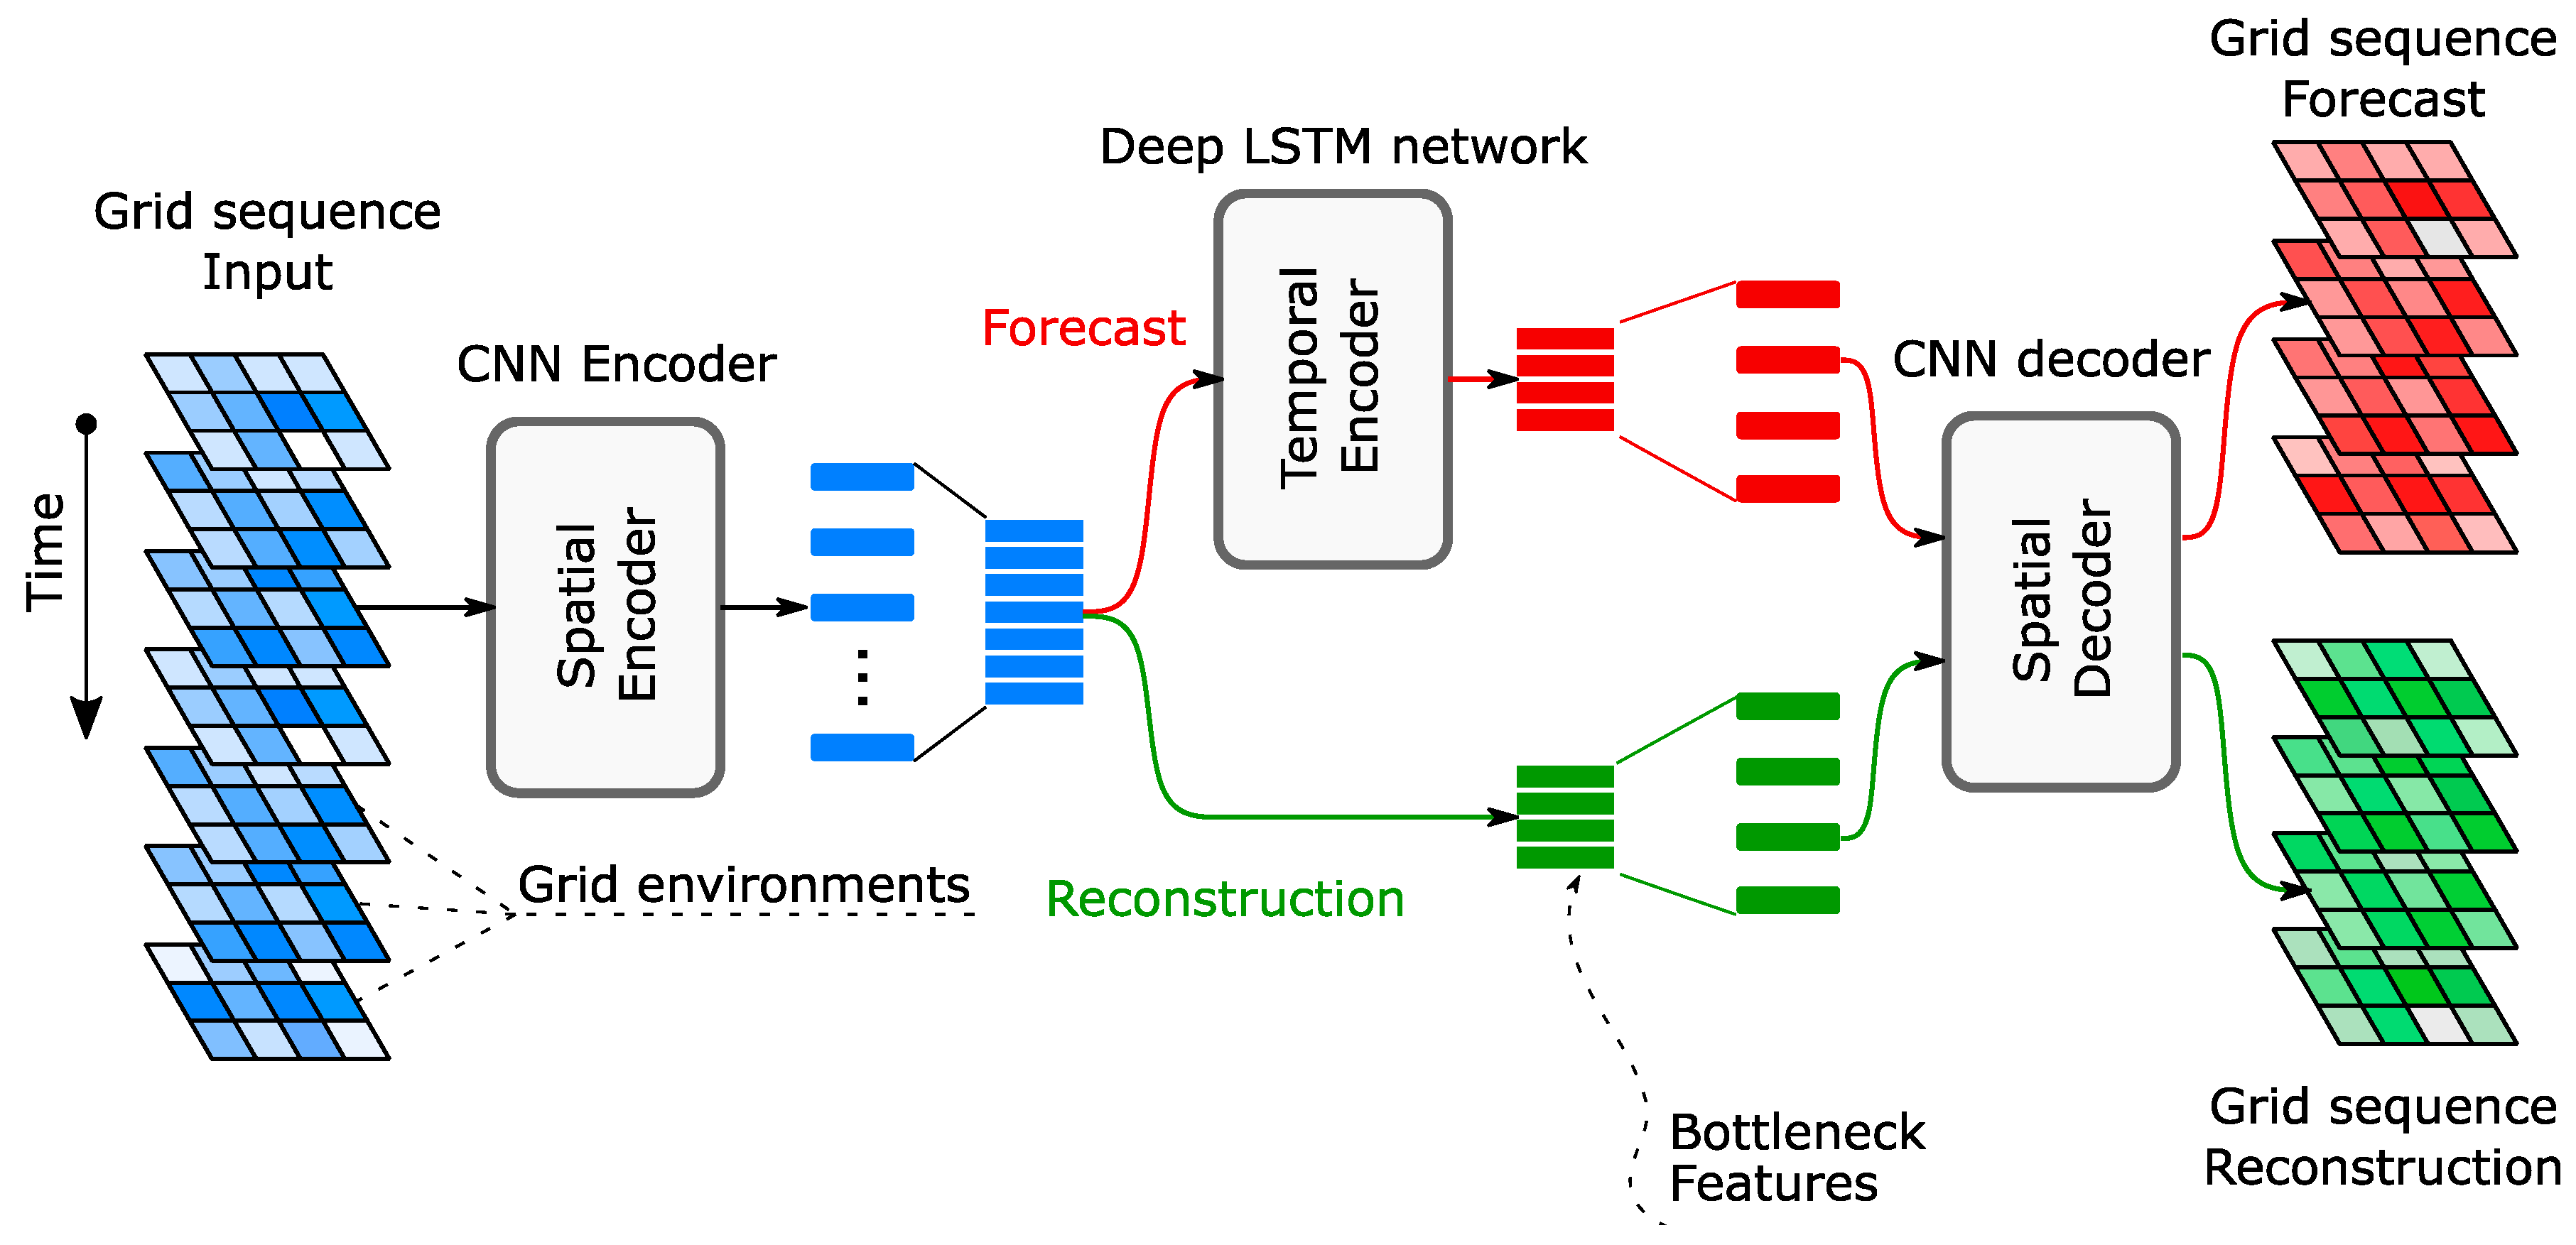
- Eltouny, K.A.; Liang, X. Large-scale structural health monitoring using composite recurrent neural networks and grid environments. Comput.-Aided Civ. Infrastruct. Eng. 2023, 38, 271–287. [Google Scholar] [CrossRef]
- Li, L.; Morgantini, M.; Betti, R. Structural damage assessment through a new generalized autoencoder with features in the quefrency domain. Mech. Syst. Signal Process. 2023, 184, 109713. [Google Scholar] [CrossRef]
- Sadeghi, F.; Mousavi, M.; Zhu, X.; Rashidi, M.; Samali, B.; Gandomi, A.H. Damage Detection of Composite Beams via Variational Mode Decomposition of Shear-Slip Data. J. Struct. Eng. 2023, 149, 04022226. [Google Scholar] [CrossRef]
- Soleimani-Babakamali, M.H.; Soleimani-Babakamali, R.; Sarlo, R.; Farghally, M.F.; Lourentzou, I. On the effectiveness of dimensionality reduction for unsupervised structural health monitoring anomaly detection. Mech. Syst. Signal Process. 2023, 187, 109910. [Google Scholar] [CrossRef]
- Entezami, A.; Shariatmadar, H.; De Michele, C. Non-parametric empirical machine learning for short-term and long-term structural health monitoring. Struct. Health Monit. 2022, 21, 2700–2718. [Google Scholar] [CrossRef]
- Fernandez-Navamuel, A.; Magalhães, F.; Zamora-Sánchez, D.; Omella, A.J.; Garcia-Sanchez, D.; Pardo, D. Deep learning enhanced principal component analysis for structural health monitoring. Struct. Health Monit. 2022, 21, 1710–1722. [Google Scholar] [CrossRef]
- Giglioni, V.; Venanzi, I.; Poggioni, V.; Milani, A.; Ubertini, F. Autoencoders for unsupervised real-time bridge health assessment. Comput.-Aided Civ. Infrastruct. Eng. 2022. [Google Scholar] [CrossRef]
- Kim, M.; Song, J. Near-real-time identification of seismic damage using unsupervised deep neural network. J. Eng. Mech. 2022, 148, 04022006. [Google Scholar] [CrossRef]
- Lucà, F.; Manzoni, S.; Cerutti, F.; Cigada, A. A Damage Detection Approach for Axially Loaded Beam-like Structures Based on Gaussian Mixture Model. Sensors 2022, 22, 8336. [Google Scholar] [CrossRef]
- Meixedo, A.; Santos, J.; Ribeiro, D.; Calçada, R.; Todd, M.D. Online unsupervised detection of structural changes using train–induced dynamic responses. Mech. Syst. Signal Process. 2022, 165, 108268. [Google Scholar] [CrossRef]
- Shi, S.; Du, D.; Mercan, O.; Kalkan, E.; Wang, S. A novel unsupervised real-time damage detection method for structural health monitoring using machine learning. Struct. Control Health Monit. 2022, 29, e3042. [Google Scholar] [CrossRef]
- Soleimani-Babakamali, M.H.; Sepasdar, R.; Nasrollahzadeh, K.; Lourentzou, I.; Sarlo, R. Toward a general unsupervised novelty detection framework in structural health monitoring. Comput.-Aided Civ. Infrastruct. Eng. 2022, 37, 1128–1145. [Google Scholar] [CrossRef]
- Sony, S.; Sadhu, A. Multivariate empirical mode decomposition–based structural damage localization using limited sensors. J. Vib. Control 2022, 28, 2155–2167. [Google Scholar] [CrossRef]
- Wang, Q.A.; Dai, Y.; Ma, Z.G.; Ni, Y.Q.; Tang, J.Q.; Xu, X.Q.; Wu, Z.Y. Towards probabilistic data-driven damage detection in SHM using sparse Bayesian learning scheme. Struct. Control Health Monit. 2022, 29, e3070. [Google Scholar] [CrossRef]
- Yan, W.-J.; Chronopoulos, D.; Yuen, K.-V.; Zhu, Y.-C. Structural anomaly detection based on probabilistic distance measures of transmissibility function and statistical threshold selection scheme. Mech. Syst. Signal Process. 2022, 162, 108009. [Google Scholar] [CrossRef]
- Zhang, Y.; Xie, X.; Li, H.; Zhou, B. An unsupervised tunnel damage identification method based on convolutional variational auto-encoder and wavelet packet analysis. Sensors 2022, 22, 2412. [Google Scholar] [CrossRef] [PubMed]
- Eltouny, K.A.; Liang, X. Bayesian-optimized unsupervised learning approach for structural damage detection. Comput.-Aided Civ. Infrastruct. Eng. 2021, 36, 1249–1269. [Google Scholar] [CrossRef]
- Jiang, K.; Han, Q.; Du, X.; Ni, P. A decentralized unsupervised structural condition diagnosis approach using deep auto-encoders. Comput.-Aided Civ. Infrastruct. Eng. 2021, 36, 711–732. [Google Scholar] [CrossRef]
- Li, S.; Niu, J.; Li, Z. Novelty detection of cable-stayed bridges based on cable force correlation exploration using spatiotemporal graph convolutional networks. Struct. Health Monit. 2021, 20, 2216–2228. [Google Scholar] [CrossRef]
- Ma, Z.; Yun, C.B.; Wan, H.P.; Shen, Y.; Yu, F.; Luo, Y. Probabilistic principal component analysis-based anomaly detection for structures with missing data. Struct. Control Health Monit. 2021, 28, e2698. [Google Scholar] [CrossRef]
- Mao, J.; Wang, H.; Spencer Jr, B.F. Toward data anomaly detection for automated structural health monitoring: Exploiting generative adversarial nets and autoencoders. Struct. Health Monit. 2021, 20, 1609–1626. [Google Scholar] [CrossRef]
- Mousavi, M.; Holloway, D.; Olivier, J.; Gandomi, A.H. Beam damage detection using synchronisation of peaks in instantaneous frequency and amplitude of vibration data. Measurement 2021, 168, 108297. [Google Scholar] [CrossRef]
- Movsessian, A.; Cava, D.G.; Tcherniak, D. An artificial neural network methodology for damage detection: Demonstration on an operating wind turbine blade. Mech. Syst. Signal Process. 2021, 159, 107766. [Google Scholar] [CrossRef]
- Sarmadi, H.; Yuen, K.V. Early damage detection by an innovative unsupervised learning method based on kernel null space and peak-over-threshold. Comput.-Aided Civ. Infrastruct. Eng. 2021, 36, 1150–1167. [Google Scholar] [CrossRef]
- Sarmadi, H.; Entezami, A.; Saeedi Razavi, B.; Yuen, K.V. Ensemble learning-based structural health monitoring by Mahalanobis distance metrics. Struct. Control Health Monit. 2021, 28, e2663. [Google Scholar] [CrossRef]
- Silva, M.F.; Santos, A.; Santos, R.; Figueiredo, E.; Costa, J.C. Damage-sensitive feature extraction with stacked autoencoders for unsupervised damage detection. Struct. Control Health Monit. 2021, 28, e2714. [Google Scholar] [CrossRef]
- Son, H.; Jang, Y.; Kim, S.-E.; Kim, D.; Park, J.-W. Deep learning-based anomaly detection to classify inaccurate data and damaged condition of a cable-stayed bridge. IEEE Access 2021, 9, 124549–124559. [Google Scholar] [CrossRef]
- Wang, Z.; Cha, Y.-J. Unsupervised deep learning approach using a deep auto-encoder with a one-class support vector machine to detect damage. Struct. Health Monit. 2021, 20, 406–425. [Google Scholar] [CrossRef]
- Yuan, Z.; Zhu, S.; Chang, C.; Yuan, X.; Zhang, Q.; Zhai, W. An unsupervised method based on convolutional variational auto-encoder and anomaly detection algorithms for light rail squat localization. Constr. Build. Mater. 2021, 313, 125563. [Google Scholar] [CrossRef]
- Rastin, Z.; Ghodrati Amiri, G.; Darvishan, E. Unsupervised structural damage detection technique based on a deep convolutional autoencoder. Shock Vib. 2021, 2021, 6658575. [Google Scholar] [CrossRef]
- Entezami, A.; Sarmadi, H.; Behkamal, B.; Mariani, S. Big data analytics and structural health monitoring: A statistical pattern recognition-based approach. Sensors 2020, 20, 2328. [Google Scholar] [CrossRef]
- Entezami, A.; Shariatmadar, H.; Mariani, S. Early damage assessment in large-scale structures by innovative statistical pattern recognition methods based on time series modeling and novelty detection. Adv. Eng. Softw. 2020, 150, 102923. [Google Scholar] [CrossRef]
- Entezami, A.; Sarmadi, H.; Mariani, S. An unsupervised learning approach for early damage detection by time series analysis and deep neural network to deal with output-only (big) data. Eng. Proc. 2020, 2, 17. [Google Scholar]
- Ma, X.; Lin, Y.; Nie, Z.; Ma, H. Structural damage identification based on unsupervised feature-extraction via Variational Auto-encoder. Measurement 2020, 160, 107811. [Google Scholar] [CrossRef]
- Mousavi, A.A.; Zhang, C.; Masri, S.F.; Gholipour, G. Structural damage localization and quantification based on a CEEMDAN Hilbert transform neural network approach: A model steel truss bridge case study. Sensors 2020, 20, 1271. [Google Scholar] [CrossRef]
- Ni, F.; Zhang, J.; Noori, M.N. Deep learning for data anomaly detection and data compression of a long-span suspension bridge. Comput.-Aided Civ. Infrastruct. Eng. 2020, 35, 685–700. [Google Scholar] [CrossRef]
- Nie, Z.; Guo, E.; Li, J.; Hao, H.; Ma, H.; Jiang, H. Bridge condition monitoring using fixed moving principal component analysis. Struct. Control Health Monit. 2020, 27, e2535. [Google Scholar] [CrossRef]
- Soman, R. Semi-automated methodology for damage assessment of a scaled wind turbine tripod using enhanced empirical mode decomposition and statistical analysis. Int. J. Fatigue 2020, 134, 105475. [Google Scholar] [CrossRef]
- Tomé, E.S.; Pimentel, M.; Figueiras, J. Damage detection under environmental and operational effects using cointegration analysis–application to experimental data from a cable-stayed bridge. Mech. Syst. Signal Process. 2020, 135, 106386. [Google Scholar] [CrossRef]
- Tran, T.T.; Ozer, E. Automated and model-free bridge damage indicators with simultaneous multiparameter modal anomaly detection. Sensors 2020, 20, 4752. [Google Scholar] [CrossRef]
- Xu, X.; Ren, Y.; Huang, Q.; Fan, Z.-Y.; Tong, Z.-J.; Chang, W.-J.; Liu, B. Anomaly detection for large span bridges during operational phase using structural health monitoring data. Smart Mater. Struct. 2020, 29, 045029. [Google Scholar] [CrossRef]
- Bull, L.; Worden, K.; Fuentes, R.; Manson, G.; Cross, E.; Dervilis, N. Outlier ensembles: A robust method for damage detection and unsupervised feature extraction from high-dimensional data. J. Sound Vib. 2019, 453, 126–150. [Google Scholar] [CrossRef]
- de Almeida Cardoso, R.; Cury, A.; Barbosa, F. Automated real-time damage detection strategy using raw dynamic measurements. Eng. Struct. 2019, 196, 109364. [Google Scholar] [CrossRef]
- Entezami, A.; Shariatmadar, H. Structural health monitoring by a new hybrid feature extraction and dynamic time warping methods under ambient vibration and non-stationary signals. Measurement 2019, 134, 548–568. [Google Scholar] [CrossRef]
- Entezami, A.; Shariatmadar, H.; Karamodin, A. Data-driven damage diagnosis under environmental and operational variability by novel statistical pattern recognition methods. Struct. Health Monit. 2019, 18, 1416–1443. [Google Scholar] [CrossRef]
- Han, T.; Liu, Q.; Zhang, L.; Tan, A.C. Fault feature extraction of low speed roller bearing based on Teager energy operator and CEEMD. Measurement 2019, 138, 400–408. [Google Scholar] [CrossRef]
- Ozdagli, A.I.; Koutsoukos, X. Machine learning based novelty detection using modal analysis. Comput.-Aided Civ. Infrastruct. Eng. 2019, 34, 1119–1140. [Google Scholar] [CrossRef]
- Sousa Tomé, E.; Pimentel, M.; Figueiras, J. Online early damage detection and localisation using multivariate data analysis: Application to a cable-stayed bridge. Struct. Control Health Monit. 2019, 26, e2434. [Google Scholar] [CrossRef]
- Anaissi, A.; Makki Alamdari, M.; Rakotoarivelo, T.; Khoa, N.L.D. A tensor-based structural damage identification and severity assessment. Sensors 2018, 18, 111. [Google Scholar] [CrossRef]
- Cha, Y.-J.; Wang, Z. Unsupervised novelty detection–based structural damage localization using a density peaks-based fast clustering algorithm. Struct. Health Monit. 2018, 17, 313–324. [Google Scholar] [CrossRef]
- Entezami, A.; Shariatmadar, H. An unsupervised learning approach by novel damage indices in structural health monitoring for damage localization and quantification. Struct. Health Monit. 2018, 17, 325–345. [Google Scholar] [CrossRef]
- Rafiei, M.H.; Adeli, H. A novel unsupervised deep learning model for global and local health condition assessment of structures. Eng. Struct. 2018, 156, 598–607. [Google Scholar] [CrossRef]
- Vamvoudakis-Stefanou, K.J.; Sakellariou, J.S.; Fassois, S.D. Vibration-based damage detection for a population of nominally identical structures: Unsupervised Multiple Model (MM) statistical time series type methods. Mech. Syst. Signal Process. 2018, 111, 149–171. [Google Scholar] [CrossRef]
- Zhou, Y.-L.; Maia, N.M.; Abdel Wahab, M. Damage detection using transmissibility compressed by principal component analysis enhanced with distance measure. J. Vib. Control 2018, 24, 2001–2019. [Google Scholar] [CrossRef]
- Alamdari, M.M.; Rakotoarivelo, T.; Khoa, N.L.D. A spectral-based clustering for structural health monitoring of the Sydney Harbour Bridge. Mech. Syst. Signal Process. 2017, 87, 384–400. [Google Scholar] [CrossRef]
- Gres, S.; Ulriksen, M.D.; Döhler, M.; Johansen, R.J.; Andersen, P.; Damkilde, L.; Nielsen, S.A. Statistical methods for damage detection applied to civil structures. Procedia Eng. 2017, 199, 1919–1924. [Google Scholar] [CrossRef]
- Gu, J.; Gul, M.; Wu, X. Damage detection under varying temperature using artificial neural networks. Struct. Control Health Monit. 2017, 24, e1998. [Google Scholar] [CrossRef]
- Langone, R.; Reynders, E.; Mehrkanoon, S.; Suykens, J.A. Automated structural health monitoring based on adaptive kernel spectral clustering. Mech. Syst. Signal Process. 2017, 90, 64–78. [Google Scholar] [CrossRef]
- Neves, A.C.; Gonzalez, I.; Leander, J.; Karoumi, R. Structural health monitoring of bridges: A model-free ANN-based approach to damage detection. J. Civ. Struct. Health Monit. 2017, 7, 689–702. [Google Scholar] [CrossRef]
- Santos, A.; Figueiredo, E.; Silva, M.; Santos, R.; Sales, C.; Costa, J.C. Genetic-based EM algorithm to improve the robustness of Gaussian mixture models for damage detection in bridges. Struct. Control Health Monit. 2017, 24, e1886. [Google Scholar] [CrossRef]
- Xia, Q.; Cheng, Y.; Zhang, J.; Zhu, F. In-service condition assessment of a long-span suspension bridge using temperature-induced strain data. J. Bridge Eng. 2017, 22, 04016124. [Google Scholar] [CrossRef]
- Zhou, Y.-L.; Maia, N.M.; Sampaio, R.P.; Wahab, M.A. Structural damage detection using transmissibility together with hierarchical clustering analysis and similarity measure. Struct. Health Monit. 2017, 16, 711–731. [Google Scholar] [CrossRef]
- Amezquita-Sanchez, J.P.; Adeli, H. Synchrosqueezed wavelet transform-fractality model for locating, detecting, and quantifying damage in smart highrise building structures. Smart Mater. Struct. 2015, 24, 065034. [Google Scholar] [CrossRef]
- Avci, O.; Abdeljaber, O. Self-organizing maps for structural damage detection: A novel unsupervised vibration-based algorithm. J. Perform. Constr. Facil. 2016, 30, 04015043. [Google Scholar] [CrossRef]
- Diez, A.; Khoa, N.L.D.; Makki Alamdari, M.; Wang, Y.; Chen, F.; Runcie, P. A clustering approach for structural health monitoring on bridges. J. Civ. Struct. Health Monit. 2016, 6, 429–445. [Google Scholar] [CrossRef]
- Mohammadi Ghazi, R.; Büyüköztürk, O. Damage detection with small data set using energy-based nonlinear features. Struct. Control Health Monit. 2016, 23, 333–348. [Google Scholar] [CrossRef]
- Santos, J.P.; Crémona, C.; Calado, L.; Silveira, P.; Orcesi, A.D. On-line unsupervised detection of early damage. Struct. Control Health Monit. 2016, 23, 1047–1069. [Google Scholar] [CrossRef]
- Silva, M.; Santos, A.; Figueiredo, E.; Santos, R.; Sales, C.; Costa, J.C. A novel unsupervised approach based on a genetic algorithm for structural damage detection in bridges. Eng. Appl. Artif. Intell. 2016, 52, 168–180. [Google Scholar] [CrossRef]
- Tibaduiza, D.A.; Mujica, L.E.; Rodellar, J.; Güemes, A. Structural damage detection using principal component analysis and damage indices. J. Intell. Mater. Syst. Struct. 2016, 27, 233–248. [Google Scholar] [CrossRef]
- Ulriksen, M.D.; Damkilde, L. Structural damage localization by outlier analysis of signal-processed mode shapes–Analytical and experimental validation. Mech. Syst. Signal Process. 2016, 68, 1–14. [Google Scholar] [CrossRef]
- Alves, V.; Cury, A.; Roitman, N.; Magluta, C.; Cremona, C. Novelty detection for SHM using raw acceleration measurements. Struct. Control Health Monit. 2015, 22, 1193–1207. [Google Scholar] [CrossRef]
- Dervilis, N.; Worden, K.; Cross, E. On robust regression analysis as a means of exploring environmental and operational conditions for SHM data. J. Sound Vib. 2015, 347, 279–296. [Google Scholar] [CrossRef]
- Shahidi, S.G.; Nigro, M.B.; Pakzad, S.N.; Pan, Y. Structural damage detection and localisation using multivariate regression models and two-sample control statistics. Struct. Infrastruct. Eng. 2015, 11, 1277–1293. [Google Scholar] [CrossRef]
- Döhler, M.; Mevel, L.; Hille, F. Subspace-based damage detection under changes in the ambient excitation statistics. Mech. Syst. Signal Process. 2014, 45, 207–224. [Google Scholar] [CrossRef]
- Figueiredo, E.; Radu, L.; Worden, K.; Farrar, C.R. A Bayesian approach based on a Markov-chain Monte Carlo method for damage detection under unknown sources of variability. Eng. Struct. 2014, 80, 1–10. [Google Scholar] [CrossRef]
- Nigro, M.; Pakzad, S.N.; Dorvash, S. Localized structural damage detection: A change point analysis. Comput.-Aided Civ. Infrastruct. Eng. 2014, 29, 416–432. [Google Scholar] [CrossRef]
- Figueiredo, E.; Cross, E. Linear approaches to modeling nonlinearities in long-term monitoring of bridges. J. Civ. Struct. Health Monit. 2013, 3, 187–194. [Google Scholar] [CrossRef]
- Kunwar, A.; Jha, R.; Whelan, M.; Janoyan, K. Damage detection in an experimental bridge model using Hilbert–Huang transform of transient vibrations. Struct. Control Health Monit. 2013, 20, 1–15. [Google Scholar] [CrossRef]
- Laory, I.; Trinh, T.N.; Posenato, D.; Smith, I.F. Combined model-free data-interpretation methodologies for damage detection during continuous monitoring of structures. J. Comput. Civ. Eng. 2013, 27, 657–666. [Google Scholar] [CrossRef]
- Sankararaman, S.; Mahadevan, S. Bayesian methodology for diagnosis uncertainty quantification and health monitoring. Struct. Control Health Monit. 2013, 20, 88–106. [Google Scholar] [CrossRef]
- Yu, L.; Zhu, J.-h.; Yu, L.-l. Structural damage detection in a truss bridge model using fuzzy clustering and measured FRF data reduced by principal component projection. Adv. Struct. Eng. 2013, 16, 207–217. [Google Scholar] [CrossRef]
- Kesavan, K.N.; Kiremidjian, A.S. A wavelet-based damage diagnosis algorithm using principal component analysis. Struct. Control Health Monit. 2012, 19, 672–685. [Google Scholar] [CrossRef]
- Meredith, J.; González, A.; Hester, D. Empirical mode decomposition of the acceleration response of a prismatic beam subject to a moving load to identify multiple damage locations. Shock Vib. 2012, 19, 845–856. [Google Scholar] [CrossRef]
- Maeck, J.; De Roeck, G. Description of Z24 Benchmark. Mech. Syst. Signal Process. 2003, 17, 127–131. [Google Scholar] [CrossRef]
- Krämer, C.; De Smet, C.A.M.; De Roeck, G. Z24 bridge damage detection tests. In Proceedings of the 17th International Modal Analysis Conference (IMAC XVII), Kissimmee, FL, USA, 8–11 February 1999; Society for Experimental Mechanics: Bethel, CT, USA,, 1999; pp. 1023–1029. [Google Scholar]
- Cross, E.J.; Koo, K.Y.; Brownjohn, J.M.W.; Worden, K. Long-term monitoring and data analysis of the Tamar Bridge. Mech. Syst. Signal Process. 2013, 35, 16–34. [Google Scholar] [CrossRef]
- Döhler, M.; Hille, F.; Mevel, L.; Rücker, W. Structural health monitoring with statistical methods during progressive damage test of S101 Bridge. Eng. Struct. 2014, 69, 183–193. [Google Scholar] [CrossRef]
- VCE. Progressive Damage Test S101 Flyover Reibersdorf (Draft); Tech. Report 08/2308; VIenna Consulting Engineers: Vienna, Austira, 2009. [Google Scholar]
- Abdeljaber, O.; Avci, O.; Kiranyaz, S.; Gabbouj, M.; Inman, D.J. Real-time vibration-based structural damage detection using one-dimensional convolutional neural networks. J. Sound Vib. 2017, 388, 154–170. [Google Scholar] [CrossRef]
- Avci, O. Qatar University Grandstand Simulator (QUGS). Available online: http://onur-avci.com/benchmark/ (accessed on 22 January 2023).
- Figueiredo, E.; Park, G.; Figueiras, J.; Farrar, C.; Worden, K. Structural Health Monitoring Algorithm Comparisons Using Standard Data Sets; Los Alamos National Lab. (LANL): Los Alamos, NM, USA, 2009.
- Johnson, E.A.; Lam, H.-F.; Katafygiotis, L.S.; Beck, J.L. Phase I IASC-ASCE structural health monitoring benchmark problem using simulated data. J. Eng. Mech. 2004, 130, 3–15. [Google Scholar] [CrossRef]
- Dyke, S.; Bernal, J.; Beck, C.; Ventura, C. An experimental benchmark problem in structural health monitoring. In Proceedings of the Third International Workshop on Structural Health Monitoring, Stanford, CA, USA, 12–14 September 2001. [Google Scholar]
- Dyke, S.J.; Bernal, D.; Beck, J.; Ventura, C. Experimental phase II of the structural health monitoring benchmark problem. In Proceedings of the 16th ASCE Engineering Mechanics Conference, Seattle, WA, USA, 16–18 July 2003. [Google Scholar]
- Allahdadian, S.; Döhler, M.; Ventura, C.; Mevel, L. Towards robust statistical damage localization via model-based sensitivity clustering. Mech. Syst. Signal Process. 2019, 134, 106341. [Google Scholar] [CrossRef]
- Li, S.; Li, H.; Liu, Y.; Lan, C.; Zhou, W.; Ou, J. SMC structural health monitoring benchmark problem using monitored data from an actual cable-stayed bridge. Struct. Control Health Monit. 2014, 21, 156–172. [Google Scholar] [CrossRef]
- Li, H. Replacement of Cable Stays in Yonghe Bridge in Tianjin, China. Adv. Civ. Eng. 2020, 2020, 6650393. [Google Scholar] [CrossRef]
- Tomé, E.S.; Pimentel, M.; Figueiras, J. Structural response of a concrete cable-stayed bridge under thermal loads. Eng. Struct. 2018, 176, 652–672. [Google Scholar] [CrossRef]
- Pearson, K. LIII. On lines and planes of closest fit to systems of points in space. Lond. Edinb. Dublin Philos. Mag. J. Sci. 1901, 2, 559–572. [Google Scholar] [CrossRef]
- Hotelling, H. Analysis of a complex of statistical variables into principal components. J. Educ. Psychol. 1933, 24, 417. [Google Scholar] [CrossRef]
- Nair, K.K.; Kiremidjian, A.S. Time series based structural damage detection algorithm using Gaussian mixtures modeling. J. Dyn. Syst. Meas. Control. 2006, 129, 285–293. [Google Scholar] [CrossRef]
- Posenato, D.; Lanata, F.; Inaudi, D.; Smith, I.F. Model-free data interpretation for continuous monitoring of complex structures. Adv. Eng. Inform. 2008, 22, 135–144. [Google Scholar] [CrossRef]
- Foley, D.H.; Sammon, J.W. An optimal set of discriminant vectors. IEEE Trans. Comput. 1975, 100, 281–289. [Google Scholar] [CrossRef]
- Lu, Y.; Gao, F. A novel time-domain auto-regressive model for structural damage diagnosis. J. Sound Vib. 2005, 283, 1031–1049. [Google Scholar] [CrossRef]
- Omenzetter, P.; William Brownjohn, J.M. Application of time series analysis for bridge monitoring. Smart Mater. Struct. 2006, 15, 129–138. [Google Scholar] [CrossRef]
- Nair, K.K.; Kiremidjian, A.S.; Law, K.H. Time series-based damage detection and localization algorithm with application to the ASCE benchmark structure. J. Sound Vib. 2006, 291, 349–368. [Google Scholar] [CrossRef]
- Zheng, H.; Mita, A. Localized Damage Detection of Structures Subject to Multiple Ambient Excitations Using Two Distance Measures for Autoregressive Models. Struct. Health Monit. 2009, 8, 207–222. [Google Scholar] [CrossRef]
- Fassois, S.D.; Sakellariou, J.S. Time-series methods for fault detection and identification in vibrating structures. Philos. Trans. R. Soc. A Math. Phys. Eng. Sci. 2007, 365, 411–448. [Google Scholar] [CrossRef]
- Worden, K.; Manson, G. The application of machine learning to structural health monitoring. Philos. Trans. R. Soc. A Math. Phys. Eng. Sci. 2007, 365, 515–537. [Google Scholar] [CrossRef] [PubMed]
- Ni, Y.; Zhou, X.; Ko, J. Experimental investigation of seismic damage identification using PCA-compressed frequency response functions and neural networks. J. Sound Vib. 2006, 290, 242–263. [Google Scholar] [CrossRef]
- Huang, N.E.; Shen, Z.; Long, S.R.; Wu, M.C.; Shih, H.H.; Zheng, Q.; Yen, N.-C.; Tung, C.C.; Liu, H.H. The empirical mode decomposition and the Hilbert spectrum for nonlinear and non-stationary time series analysis. Proc. R. Soc. Lond. Ser. A Math. Phys. Eng. Sci. 1998, 454, 903–995. [Google Scholar] [CrossRef]
- Lei, Y.; Lin, J.; He, Z.; Zuo, M.J. A review on empirical mode decomposition in fault diagnosis of rotating machinery. Mech. Syst. Signal Process. 2013, 35, 108–126. [Google Scholar] [CrossRef]
- Civera, M.; Surace, C. A comparative analysis of signal decomposition techniques for structural health monitoring on an experimental benchmark. Sensors 2021, 21, 1825. [Google Scholar] [CrossRef]
- Barbosh, M.; Singh, P.; Sadhu, A. Empirical mode decomposition and its variants: A review with applications in structural health monitoring. Smart Mater. Struct. 2020, 29, 093001. [Google Scholar] [CrossRef]
- Torres, M.E.; Colominas, M.A.; Schlotthauer, G.; Flandrin, P. A complete ensemble empirical mode decomposition with adaptive noise. In Proceedings of the 2011 IEEE International Conference on Acoustics, Speech and Signal Processing (ICASSP), Prague, Czech Republic, 22–27 May 2011; pp. 4144–4147. [Google Scholar]
- Dragomiretskiy, K.; Zosso, D. Variational Mode Decomposition. IEEE Trans. Signal Process. 2014, 62, 531–544. [Google Scholar] [CrossRef]
- Hochreiter, S.; Schmidhuber, J. Long short-term memory. Neural Comput. 1997, 9, 1735–1780. [Google Scholar] [CrossRef]
- Gers, F.A.; Schmidhuber, J.; Cummins, F. Learning to forget: Continual prediction with LSTM. Neural Comput. 2000, 12, 2451–2471. [Google Scholar] [CrossRef]
- Schölkopf, B.; Williamson, R.C.; Smola, A.; Shawe-Taylor, J.; Platt, J. Support vector method for novelty detection. In Proceedings of the 12th International Conference on Neural Information Processing Systems (NIPS’99), Cambridge, MA, USA, 30 November–4 December 1999; pp. 582–588. [Google Scholar]
- Tax, D.M.; Duin, R.P. Support vector data description. Mach. Learn. 2004, 54, 45–66. [Google Scholar] [CrossRef]
- Xu, D.; Tian, Y. A comprehensive survey of clustering algorithms. Ann. Data Sci. 2015, 2, 165–193. [Google Scholar] [CrossRef]
- Chawla, S.; Gionis, A. k-means–: A unified approach to clustering and outlier detection. In Proceedings of the 2013 SIAM International Conference on Data Mining, Austin, TX, USA, 2–4 May 2013; pp. 189–197. [Google Scholar]
- Dunn, J.C. A fuzzy relative of the ISODATA process and its use in detecting compact well-separated clusters. J. Cybern. 1973, 3, 32–57. [Google Scholar] [CrossRef]
- Bezdek, J. Pattern Recognition with Fuzzy Objective Function Algorithms; Plenum Press: New York, NY, USA, 1981. [Google Scholar]
- Jeffreys, H. The Theory of Probability; OUP Oxford: Oxford, UK, 1998. [Google Scholar]
- Angelov, P.P.; Gu, X. Empirical Approach to Machine Learning; Springer: Cham, Switzerland, 2019. [Google Scholar]
- Farrar, C.R.; Doebling, S.W. An Overview of Modal-Based Damage Identification Methods. In Proceedings of the DAMAS ‘97, Sheffield, UK, 30 June–2 July 1997. [Google Scholar]
- Sohn, H.; Dzwonczyk, M.; Straser, E.G.; Kiremidjian, A.S.; Law, K.H.; Meng, T. An experimental study of temperature effect on modal parameters of the Alamosa Canyon Bridge. Earthq. Eng. Struct. Dyn. 1999, 28, 879–897. [Google Scholar] [CrossRef]
- Liu, C.; Dobson, J.; Cawley, P. Efficient generation of receiver operating characteristics for the evaluation of damage detection in practical structural health monitoring applications. Proc. R. Soc. A Math. Phys. Eng. Sci. 2017, 473, 20160736. [Google Scholar] [CrossRef] [PubMed]
- Deng, J.; Dong, W.; Socher, R.; Li, L.-J.; Li, K.; Li, F.-F. Imagenet: A large-scale hierarchical image database. In Proceedings of the 2009 IEEE Conference on Computer Vision and Pattern Recognition, Miami, FL, USA, 20–25 June 2009; pp. 248–255. [Google Scholar]
- Ionescu, C.; Papava, D.; Olaru, V.; Sminchisescu, C. Human3.6m: Large scale datasets and predictive methods for 3d human sensing in natural environments. IEEE Trans. Pattern Anal. Mach. Intell. 2013, 36, 1325–1339. [Google Scholar] [CrossRef]
- Yano, M.O.; da Silva, S.; Figueiredo, E.; Villani, L.G.G. Damage quantification using transfer component analysis combined with Gaussian process regression. Struct. Health Monit. 2023, 22, 1290–1307. [Google Scholar] [CrossRef]
- Bull, L.; Gardner, P.; Dervilis, N.; Papatheou, E.; Haywood-Alexander, M.; Mills, R.; Worden, K. On the transfer of damage detectors between structures: An experimental case study. J. Sound Vib. 2021, 501, 116072. [Google Scholar] [CrossRef]
- Gardner, P.; Bull, L.; Dervilis, N.; Worden, K. On the application of kernelised Bayesian transfer learning to population-based structural health monitoring. Mech. Syst. Signal Process. 2022, 167, 108519. [Google Scholar] [CrossRef]
- Zhang, B.; Hong, X.; Liu, Y. Distribution adaptation deep transfer learning method for cross-structure health monitoring using guided waves. Struct. Health Monit. 2022, 21, 853–871. [Google Scholar] [CrossRef]
- Sun, S.; Wang, T.; Yang, H.; Chu, F. Condition monitoring of wind turbine blades based on self-supervised health representation learning: A conducive technique to effective and reliable utilization of wind energy. Appl. Energy 2022, 313, 118882. [Google Scholar] [CrossRef]


| Authors | Year | Feature Extraction | Classifier | Test Structure |
|---|---|---|---|---|
| Eltouny and Liang [58] | 2023 | CNN-LSTM hybrid | EVT-based test | Numerical multi-story multi-bay structure |
| Li et al. [59] | 2023 | Power cepstral coefficients, GAE | MSD-based outlier analysis | Z-24 Bridge, numerical 8 DOF model |
| Sadeghi et al. [60] | 2023 | VMD | - | Laboratory-scale bridge |
| Soleimani-Babakamali et al. [61] | 2023 | FFT | GAN (CNN, LSTM) | QUGS, IASC-ASCE benchmark |
| Entezami et al. [62] | 2022 | Empirical machine learning | EVT-based test | Z-24 bridge, Tianjin Yonghe bridge |
| Fernandez-Navamuel et al. [63] | 2022 | AE-PCA hybrid | Percentile | Beltran bridge, Infante Dom Henrique bridge |
| Giglioni et al. [64] | 2022 | AE, ensemble learning | Percentile | Z-24 Bridge |
| Kim and Song [65] | 2022 | Flexibility matrices, CVAE | - | Numerical steel structure |
| Lucà et al. [66] | 2022 | Modal frequencies | GMM | Tie-rods |
| Meixedo et al. [67] | 2022 | ARX, PCA | k-means | Sado Bridge |
| Shi et al. [68] | 2022 | ANN, CNN | SVDD | IASC–ASCE benchmark (numerical), three-story masonry frame |
| Soleimani-Babakamali et al. [69] | 2022 | FFT | GAN (CNN, LSTM) | QUGS, IASC-ASCE benchmark |
| Sony and Sadhu [70] | 2022 | Multivariate EMD | Significance test | Z-24 bridge, numerical 10-DOF model |
| Wang et al. [71] | 2022 | NExT, sparse Bayesian learning | Bayesian hypothesis test | Tianjin Yonghe Bridge |
| Yan et al. [72] | 2022 | Transmissibility | KL divergence, Bayesian inference | S101 bridge, lab beams, numerical 10-story building |
| Zhang et al. [73] | 2022 | WT, Convolutional VAE | Significance test | Laboratory-scale tunnel model |
| Eltouny and Liang [74] | 2021 | CIM, PCA | Bayesian-optimized KDME, EVT-based test | Numerical RC frame, numerical high-rise structure, three-story masonry frame |
| Jiang et al. [75] | 2021 | AE | Predefined threshold | QUGS, LANL three-story structure |
| Li et al. [76] | 2021 | CNN-GCN hybrid | Significance test | Cable-stayed bridge |
| Ma et al. [77] | 2021 | PPCA | Q-statistic and T2-statistic anomaly detection | Numerical auditorium |
| Mao et al. [78] | 2021 | GAF, GAN, CAE | CUSUM | Cable-stayed bridge |
| Mousavi et al. [79] | 2021 | VMD | - | Numerical beam |
| Movsessian et al. [80] | 2021 | MD, ANN | ROC | Wind turbine |
| Sarmadi and Yuen [81] | 2021 | KNFST | EVT-based test | Z-24 bridge, Wooden bridge |
| Sarmadi et al. [82] | 2021 | Sequential ensemble (UMD, MSD, local MSD) | EVT-based test | Z24 bridge, wooden bridge |
| Silva et al. [83] | 2021 | Stacked AE | GMM | Z-24 bridge |
| Son et al. [84] | 2021 | LSTM | Significance test | Cable-stayed bridge |
| Wang and Cha [85] | 2021 | AE | OCSVM | Laboratory-scale steel bridge, numerical shelf structure |
| Yuan et al. [86] | 2021 | CVAE | Elliptic envelope, OCSVM | Laboratory vehicle-track, numerical vehicle-track |
| Rastin et al. [87] | 2021 | CAE | Significance test | Tianjin Yonghe Bridge, numerical IASC-ASCE benchmark, numerical grid structure |
| Entezami et al. [88] | 2020 | ARMA | ESD-PKLD hybrid with nearest neighbor | Tianjin Yonghe Bridge |
| Entezami et al. [89] | 2020 | ARX | MSD-PKLD hybrid | Tianjin Yonghe Bridge |
| Entezami et al. [90] | 2020 | ARMA, AE | MD, EVT-based | Tianjin Yonghe Bridge |
| Ma et al. [91] | 2020 | CVAE | - | Laboratory steel bridge |
| Mousavi et al. [92] | 2020 | HHT, ANN | - | Laboratory steel truss bridge |
| Ni et al. [93] | 2020 | - | CNN | Suspension bridge |
| Nie et al. [94] | 2020 | Fixed MPCA | - | Suspension bridge, laboratory beam, numerical beam |
| Soman [95] | 2020 | EEMD | POD analysis | Laboratory offshore tripod |
| Tomé et al. [96] | 2020 | Johansen test | Hotelling T2 control charts | Numerical Corgo Viaduct |
| Tran et al. [97] | 2020 | SRIM | Hierarchical clustering, univariate outlier analysis | Laboratory bridge, Steel pedestrian bridge |
| Xu et al. [98] | 2020 | WT | EVT-based | Numerical Xihoumen suspension bridge |
| Bull et al. [99] | 2019 | Transmissibility | MSD-based outlier ensemble | Z-24 bridge, Gnat aircraft |
| de Almeida Cardoso et al. [100] | 2019 | TF-IQRM | k-medoids, student’s t-test | IASC-ASCE benchmark, PI-57 bridge |
| Entezami and Shariatmadar [101] | 2019 | EEMD, AR, ARX, DTW, PCA | Hotelling T2 control charts, QRE, significance test | IASC-ASCE benchmark |
| Entezami et al. [102] | 2019 | AR | PKLD, significance test | LANL three-story structure, wooden bridge |
| Han et al. [103] | 2019 | TKEO, CEEMD | - | Scaled wind turbine |
| Ozdagli and Koutsoukos [104] | 2019 | NExT/ERA, PCA, AE | Euclidean distance | LANL three-story structure, numerical beam |
| Sousa Tomé et al. [105] | 2019 | Multilinear regression, PCA | Hotelling T2 control charts | Numerical Corgo Viaduct |
| Anaissi et al. [106] | 2018 | CANDECOMP/PARAFAC Tensor Decomposition | OCSVM | Cable-stayed bridge, laboratory replica of SHB jack arch |
| Cha and Wang [107] | 2018 | CWT, crest factor | density peaks-based fast clustering | Laboratory-scale steel structure |
| Entezami and Shariatmadar [108] | 2018 | AR | PAC, RRC, significance test | LANL three-story structure, IASC-ASCE benchmark |
| Rafiei and Adeli [109] | 2018 | SWT, FFT | Deep RBM | Laboratory-scale 38-story concrete building |
| Vamvoudakis-Stefanou et al. [110] | 2018 | MM learning (PCA, AR) | KL-divergence | Composite beams |
| Zhou et al. [111] | 2018 | Transmissibility, PCA | - | IASC-ASCE benchmark, numerical beam |
| Alamdari et al. [112] | 2017 | Spectral moments | k-means−− | SHB |
| Gres et al. [113] | 2017 | Hankel matrix, MD | Significance test, Hotelling T2 control charts | S101 bridge, numerical offshore support structure |
| Gu et al. [114] | 2017 | AE w/temperature input | Euclidean distance | Steel grid structure |
| Langone et al. [115] | 2017 | Modal frequencies | Adaptive KSC | Z-24 bridge |
| Neves et al. [116] | 2017 | ANN | MD, GP | Numerical bridge |
| Santos et al. [117] | 2017 | Modal frequencies | GA-EM-GMM | Z-24 bridge |
| Xia et al. [118] | 2017 | EEMD | - | Jiangyin suspension Bridge |
| Zhou et al. [119] | 2017 | Transmissibility | Hierarchical clustering | Numerical 10-story structure, Laboratory beam |
| Amezquita-Sanchez and Adeli [120] | 2016 | SWT, FD | Significance test | Laboratory-scale 38-story concrete building |
| Avci and Abdeljaber [121] | 2016 | SOM | - | IASC-ASCE benchmark |
| Diez et al. [122] | 2016 | FFT | KNN, k-means | SHB |
| Mohammadi Ghazi and Büyüköztürk [123] | 2016 | HHT | MSD-based outlier analysis | Laboratory steel structure |
| Santos et al. [124] | 2016 | ANN | k-means, Gowda–Diday dissimilarity | Numerical Guadiana International Bridge |
| Silva et al. [125] | 2016 | Modal frequencies | GA-clustering | Z-24 Bridge, Tamar Bridge |
| Tibaduiza et al. [126] | 2016 | PCA | T2-statistic, Q-statistic, combined index, I2 index | Wind turbine blade |
| Ulriksen and Damkilde [127] | 2016 | CWT, GDTKEO | MSD-based outlier analysis | Numerical beam, Wind turbine blade |
| Alves et al. [128] | 2015 | Symbolic analysis | Dynamic clouds, FCM, hierarchical clustering | Laboratory steel beam, PI-57 bridge |
| Dervilis et al. [129] | 2015 | LTS | MCD | Z-24 Bridge, Tamar bridge |
| Shahidi et al. [130] | 2015 | SVR, CR, AR, ARX | Significance test | Laboratory steel frame |
| Döhler et al. [131] | 2014 | Subspace identification | GLR | Numerical mass-spring chain, numerical truss, numerical beam |
| Figueiredo et al. [132] | 2014 | Modal frequencies | MCMC-GMM, MSD-based outlier analysis | Z-24 Bridge |
| Nigro et al. [133] | 2014 | Time series modeling, CUSUM, EWMA, MSE | Bootstrapping, Fisher Criterion- MSD significance test | Laboratory steel frame |
| Figueiredo and Cross [134] | 2013 | GMM | MSD-based outlier analysis | Z-24 Bridge |
| Kunwar et al. [135] | 2013 | HHT | - | Laboratory bridge |
| Laory et al. [136] | 2013 | MPCA | Significance test | The Ricciolo viaduct, numerical concrete frame |
| Sankararaman and Mahadevan [137] | 2013 | Bond graph model residuals | Bayesian hypothesis test | Numerical frame |
| Yu et al. [138] | 2013 | FRF, PCA, KPCA | FCM | Experimental truss bridge |
| Kesavan and Kiremidjian [139] | 2012 | WT, PCA | k-means | IASC-ASCE Benchmark (numerical) |
| Meredith et al. [140] | 2012 | EMD | - | Numerical Euler–Bernoulli beam |
| Abbreviation | Definition | Abbreviation | Definition |
|---|---|---|---|
| AE | Autoencoder | KNFST | Kernel Null Foley–Sammon Transform |
| ANN | Artificial Neural Network | KNN | K-Nearest Neighbor |
| ARMA | Autoregressive Moving Average | KPCA | Kernel Principal Component Analysis |
| ARX | Autoregressive-Exogenous | KSC | Kernel Spectral Clustering |
| ASCE | American Society of Civil Engineering | LANL | Los Alamos National Laboratory |
| CAE | Convolutional Autoencoder | LSTM | Long Short-Term Memory |
| CEEMD | Complementary Ensemble Empirical Mode Decomposition | LTS | Least Trimmed Squares |
| CIM | Cumulative Intensity Measure | MCD | Minimum Covariance Determinant |
| CNN | Convolutional Neural Network | MCMC | Monte Carlo Markov Chain |
| CR | Collinear Regression | MD | Mahalanobis Distance |
| CUSUM | Cumulative Sum | MM | Multiple-Model |
| CVAE | Convolutional Variational Autoencoder | MPCA | Moving Principal Component Analysis |
| CWT | Continuous Wavelet Transform | MSD | Mahalanobis Square Distance |
| DTW | Dynamic Time Warping | NExT | Natural Excitation Technique |
| EEMD | Ensemble Empirical Mode Decomposition | OCSVM | One-Class Support Vector Machine |
| EM | Expected-Maximization | PAC | Parametric Assurance Criterion |
| EMD | Empirical Mode Decomposition | PCA | Principal Component Analysis |
| ESD | Euclidean Square Distance | PKLD | Partition-Based Kullback–Leibler Divergence |
| EVT | Extreme Value Theory | POD | Probability of Detection |
| EWMA | Exponentially Weighted Moving Average | PPCA | Probabilistic Principal Component Analysis |
| FCM | Fuzzy C-Means | QRE | Q-Reconstruction Error |
| FD | Fractal Dimension | QUGS | Qatar University Grandstand Simulator |
| FFT | Fast Fourier Transform | RBM | Restricted Boltzmann Machine |
| FRF | Frequency Response Function | RC | Reinforced Concrete |
| GA | Genetic Algorithm | RRC | Residual Reliability Criterion |
| GAE | Generalized Autoencoder | SHB | Sydney Harbor Bridge |
| GAF | Gramian Angular Field | SOM | Self-Organizing Maps |
| GAN | Generative Adversarial Network | SRIM | System Realization Using Information Matrix |
| GCN | Graph Convolutional Networks | SVDD | Support Vector Data Description |
| GDTKEO | Generalized Discrete Teager–Kaiser Energy Operator | SVR | Single-Variate Regression |
| GLR | Generalized Likelihood Ratio | SWT | Synchrosqueezed Wavelet Transform |
| GMM | Gaussian Mixture Models | TF-IQRM | Time–Frequency Interquartile Range-Median |
| GP | Gaussian Process | TKEO | Teager–Kaiser Energy Operator |
| HHT | Hilbert–Huang Transform | UMD | Univariate Mahalanobis Distance |
| IASC | International Association For Structural Control | VAE | Variational Autoencoder |
| KDME | Kernel Density Maximum Entropy | VMD | Variational Mode Decomposition |
| KL | Kullback–Leibler | WT | Wavelet Transform |
Disclaimer/Publisher’s Note: The statements, opinions and data contained in all publications are solely those of the individual author(s) and contributor(s) and not of MDPI and/or the editor(s). MDPI and/or the editor(s) disclaim responsibility for any injury to people or property resulting from any ideas, methods, instructions or products referred to in the content. |
© 2023 by the authors. Licensee MDPI, Basel, Switzerland. This article is an open access article distributed under the terms and conditions of the Creative Commons Attribution (CC BY) license (https://creativecommons.org/licenses/by/4.0/).
Share and Cite
Eltouny, K.; Gomaa, M.; Liang, X. Unsupervised Learning Methods for Data-Driven Vibration-Based Structural Health Monitoring: A Review. Sensors 2023, 23, 3290. https://doi.org/10.3390/s23063290
Eltouny K, Gomaa M, Liang X. Unsupervised Learning Methods for Data-Driven Vibration-Based Structural Health Monitoring: A Review. Sensors. 2023; 23(6):3290. https://doi.org/10.3390/s23063290
Chicago/Turabian StyleEltouny, Kareem, Mohamed Gomaa, and Xiao Liang. 2023. "Unsupervised Learning Methods for Data-Driven Vibration-Based Structural Health Monitoring: A Review" Sensors 23, no. 6: 3290. https://doi.org/10.3390/s23063290
APA StyleEltouny, K., Gomaa, M., & Liang, X. (2023). Unsupervised Learning Methods for Data-Driven Vibration-Based Structural Health Monitoring: A Review. Sensors, 23(6), 3290. https://doi.org/10.3390/s23063290