
Behavior and Task Classification Using Wearable Sensor Data: A Study across Different Ages †

 , , , and
Abstract
1. Introduction
- Q1: Can physiological data, acquired with wearable sensors, be useful to define binary classification models that allow discriminating between young adults and older adults while they perform various tasks?
- Q2: Can a binary classification model, trained on two tasks of different cognitive load, be sufficiently generalizable to classify a new set of different binary tasks?
- Q3: Can physiological data be useful to discriminate contemporaneously among different tasks and ages?
- Q4: Can physiological data, potentially affected by movement noise, reveal the different behavior of subjects with respect to their age and walking activities?
2. State of the Art
3. Material and Methods
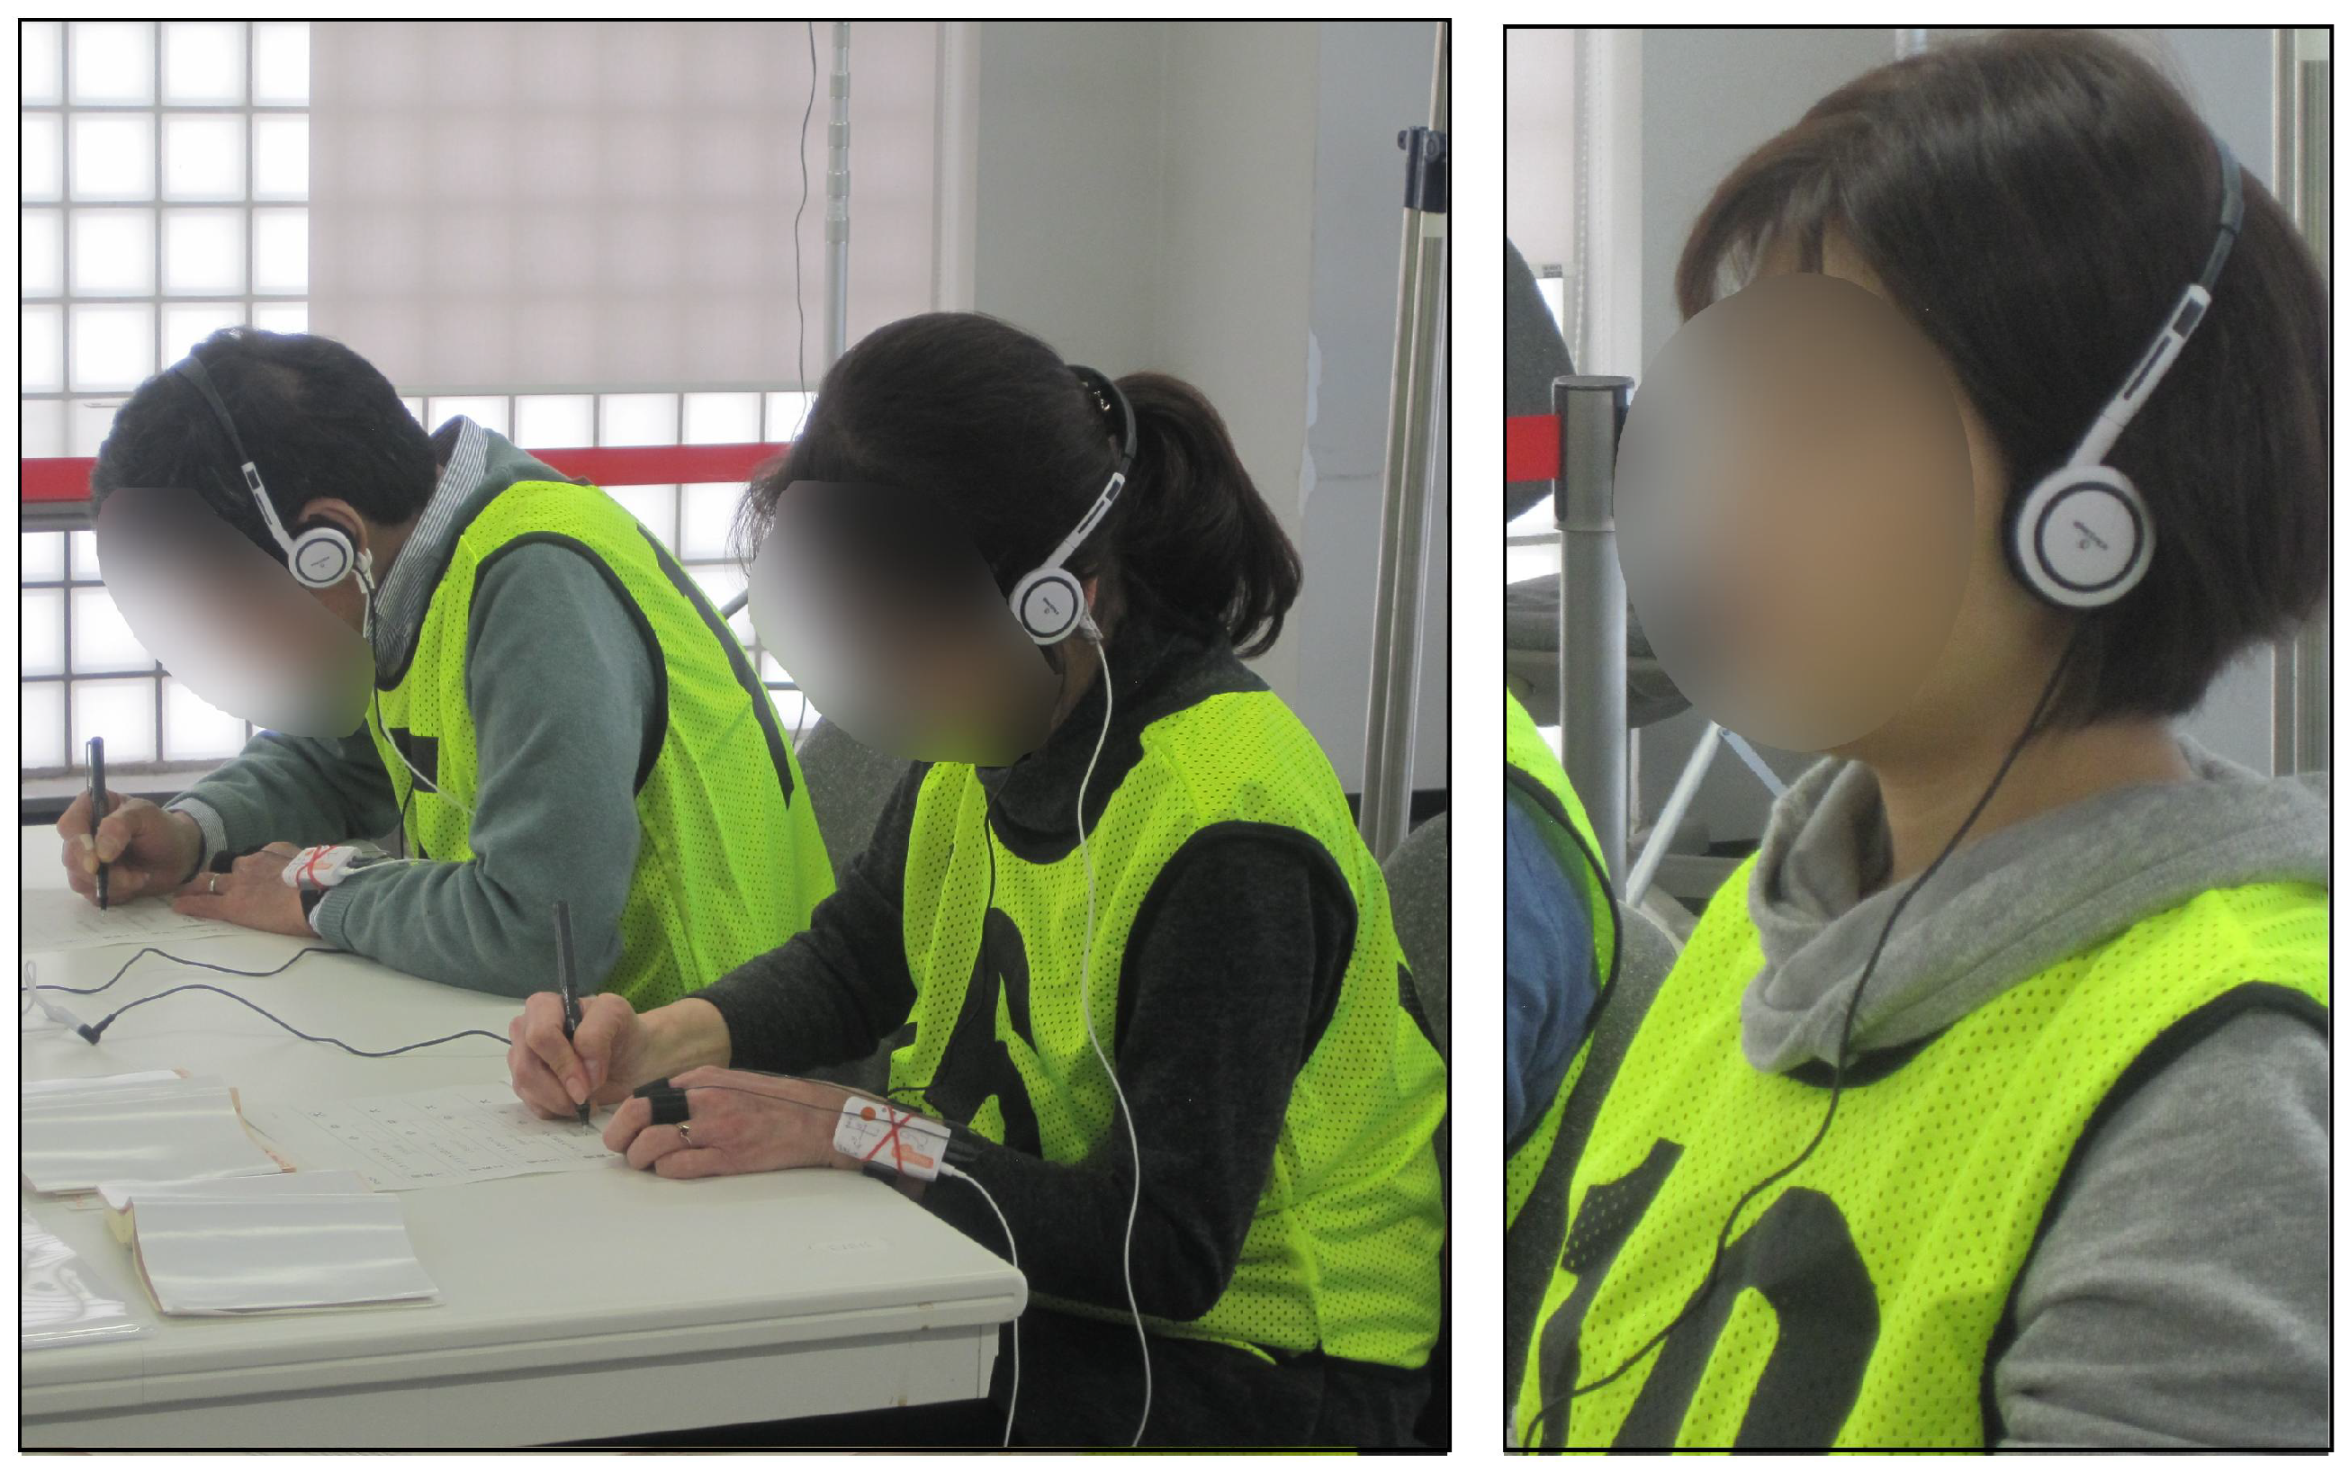
3.1. Experimental Protocol
- Subject’s profiling carried out filling the STAI questionnaires [54], 3 min.
- Reading and comprehension (R, C) tasks. Two different texts are proposed: a Fairy-tale (“The Wolf and the Seven Little Kids”) and a philosophy text (“Kant’s Critique of Pure Reason”). The subjects have 2 min to read each text on a piece of paper and 1 min to answer self-assessment and reading comprehension questions, 6 min.
- Audio listening and math calculation (AL, MC) tasks composed of six repetitions of a two-step sequence consisting of:The audio tracks and the calculations proposed are the same for each subject but change according to the iteration, 15 min.
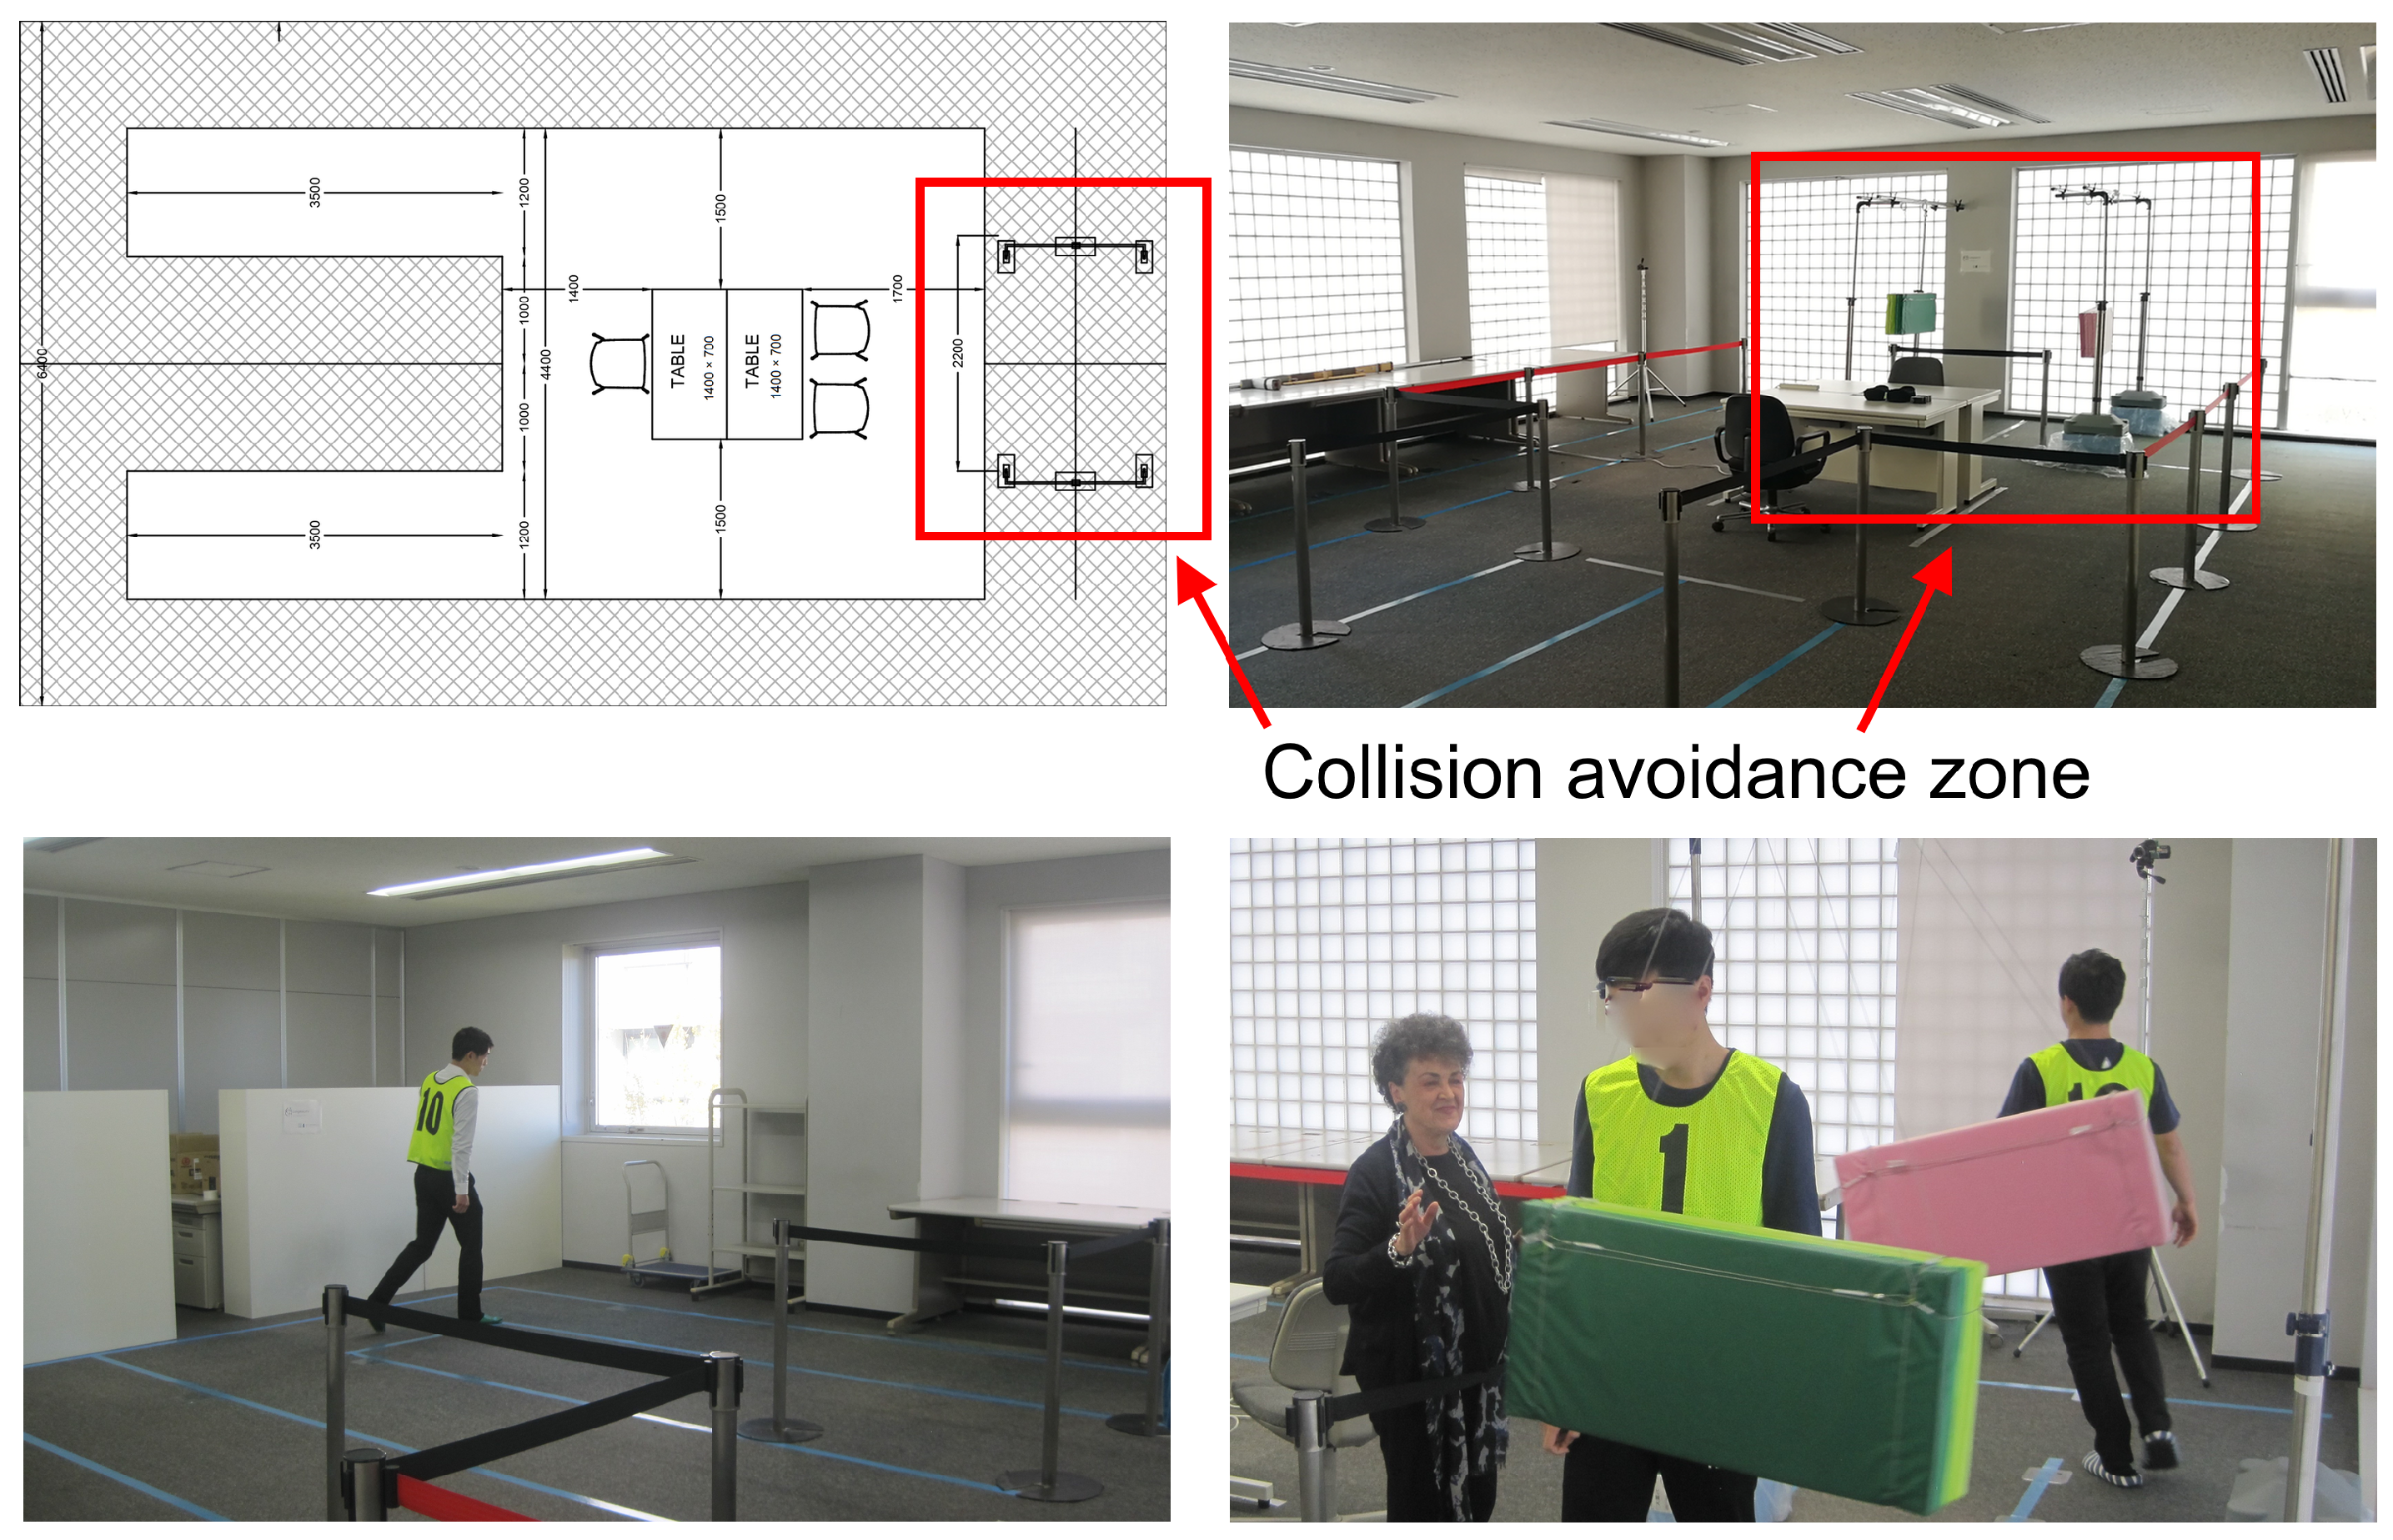
- Collision avoidance: two subjects, at the same time, walk with their own pace along a U path (Figure 2 top left). At about half of the path, they reach the collision avoidance zone where they have to avoid the collisions with both the obstacles (Obs) and the other subject (Figure 2 top and bottom right). Then, they complete the U path, with their natural pace (WO), and go back in the opposite direction repeating the same actions. The obstacle is a moving pendulum composed of a swinging mattress activated manually by one of the experimenters.
- Free walk (FW): the participants walk freely, without constraints, following their own pace.
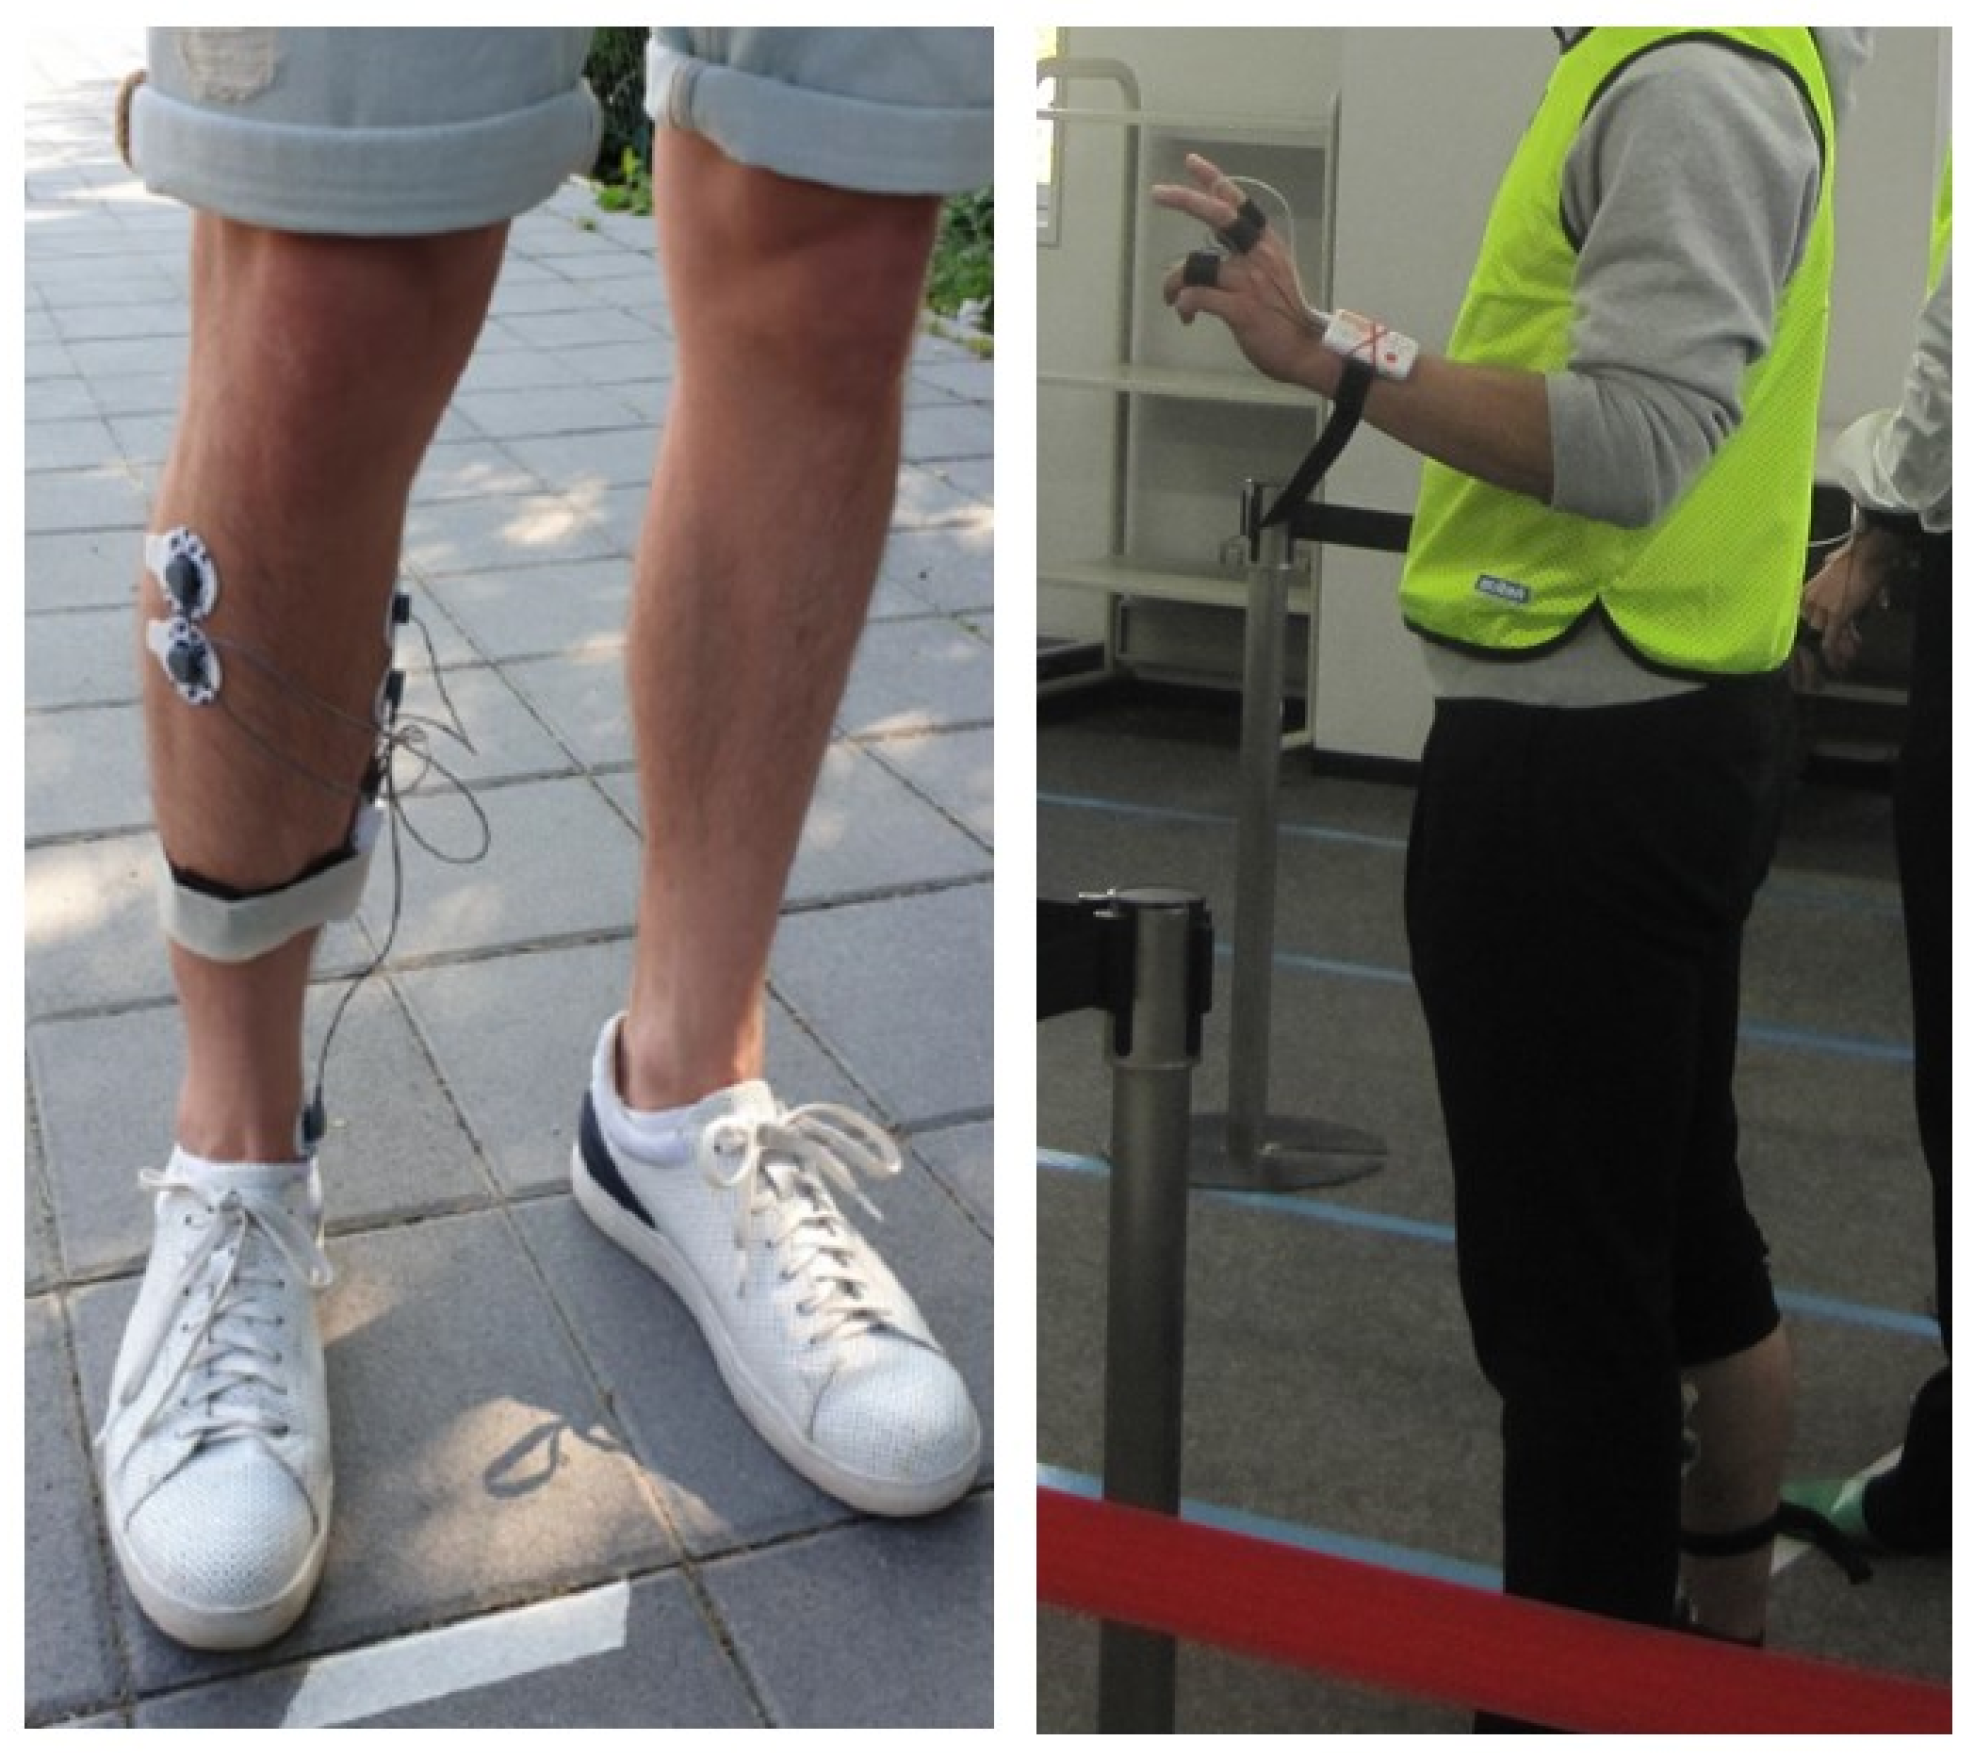
3.2. Physiological Signals Acquired
4. Data Analysis
4.1. Data Processing
- Signal denoising: each signal can be affected by different types of noise and artifacts related to both the characteristics of the environment (for instance, temperature or electromagnetic interference) or the experimental conditions (for instance, uncontrolled movements of the subjects, or low-quality contact of the sensor with the subjects’ skin). Thus, in Section 4.1.1 the proper denoising for each physiological signal is reported.
- Subject normalization: physiological signals not only depend on the induced stimulus, but also on subject’s characteristics. A proper normalization process is performed to reduce both inter- and intra-subject heterogeneity, as described in Section 4.1.2.
- Signal segmentation: data are acquired continuously; thus, a proper segmentation is applied, adopting the markers introduced during the acquisition through Consensys Pro, the proprietary software of the Shimmer devices.
- PPG frequency normalization: in order to take into account frequency differences in subjects’ heartbeat, a frequency normalization strategy is applied to segmented data.
- Data augmentation: to balance the cardinality of the instances per classes, a proper data augmentation step is applied as described in Section 4.1.5.
4.1.1. Signal Denoising
4.1.2. Amplitude Normalization
4.1.3. Signal Segmentation in Task
4.1.4. PPG Frequency Normalization
4.1.5. Data Augmentation
4.2. Classification Strategies and Performance Evaluation
4.2.1. Feature Extraction
- Four statistical features (minimum, maximum, mean and variance of the signal)
- Three peak related features:
- –
- Peak rate, representing the mean number of peaks of each 128 subject-Normalized sample;
- –
- Inter-beat interval (IBI), representing the mean distance between two peaks in a row;
- –
- Root mean square of successive distance (RMSSD) representing the quadratic mean of the distance between two peaks [70].
- Phasic Component: eight statistical and peak-related features:
- –
- Maximum, mean and variance of the phasic component of the signal
- –
- Peak rate, representing the mean number of peaks per second
- –
- Peak area and peak area per second, representing, respectively, the mean area under the peaks and the mean area under the peaks evaluated per second.
- –
- Peak height representing the mean height of the peak detected on the phasic component.
- –
- Tonic component: the Regression coefficient is considered as representative of the signal slope.
- The mean power of the signal, calculated by the Root Mean Square [75]where is the amplitude of the n-th sample of the EMG signal, and N is the total number of samples.
- The walking frequency, known as the Stride Frequency, evaluated in terms of the number of steps per second. This feature is calculated as deeply described in [76] and here summarized by the following steps: (i) the root mean square upper envelope is calculated with 200 sample windows, (ii) the mean value is subtracted to rescale the signal, (iii) the envelope signal frequencies in the band [0.2, 1.4] Hz are considered, as representative of human pace frequencies and (iv) the max peak of the periodogram of the envelope is extracted.
4.2.2. Classification Models
4.2.3. Evaluation Metrics
5. Results
- Q1: Can physiological responses discriminate between young adults and older adults while they perform different tasks?
- Q2: How much is a binary classification model driven on physiological data able to generalize on data collected while performing different tasks?
- Q3: Is it possible to define a multi-class classifier, driven on physiological data, that recognizes both the tasks and the age of the subjects simultaneously?
- Q4: Can physiological data, potentially affected by movement noise, reveal the different behavior of subjects with respect to their age and walking activities?
- Population age classification using PPG and GSR signals. Four binary classifiers are proposed to discriminate between young adults and older adults, performing four different activities (Section 5.1.1). This analysis tries to answer research question Q1. A multi-class model is also developed to distinguish among six classes, obtained considering two population ages and three activities. This issue tries to solve research question Q3.
- Cognitive task classification. A classification model is trained on data acquired during math calculations and the relaxing audio listening (Section 5.1.2).
- Binary classification of new cognitive tasks using the previously trained model (Section 5.1.3). These last two items try to answer research question Q2.
- Different walking behavior recognition through muscle activities and PPG analysis (Section 5.2.1 and Section 5.2.2).
- Classification of different walking tasks, with similar walking pace (Section 5.2.3).
5.1. Cognitive Load Session
5.1.1. Population Age Classification Using PPG and GSR Signals
5.1.2. Cognitive Task Classification: Math Calculation vs. Audio Listening
5.1.3. Arousal Classification of New Cognitive Tasks Using Pre-Trained Binary Classifiers
5.2. Walking Session
5.2.1. Walking Behavior Studying EMG Data
5.2.2. Walking Behavior Studying Ppg Data
5.2.3. Classification of Different Walking Tasks
6. Discussion
7. Conclusions
Author Contributions
Funding
Institutional Review Board Statement
Informed Consent Statement
Data Availability Statement
Acknowledgments
Conflicts of Interest
Abbreviations
| PPG | Photopletysmography |
| GSR | Galvanic Skin Response |
| EMG | Elettromyography |
| HAR | Human Activity Recognition |
| MA | Motion Artifact |
| CLAWDAS dataset | Cognitive Load and Affective Walkability in Different Age Subjects dataset |
| R | Reading task |
| C | Comprehension task |
| AL | Audio Listening task |
| MC | Math Calculations task |
| Baseline collected during Cognitive load session | |
| Obs | obstacle crossing |
| WO | Free Walk before and after the collision avoidance zone |
| F1 | Metronome Forced Speed task (70 bpm) |
| F2 | Metronome Forced Speed task (85 bpm) |
| F3 | Metronome Forced Speed task (100 bpm) |
| FW | Pure Free Walk task |
| Baseline collected during walking session | |
| SWT | Stationary Wavelet Transform |
| MODWT | Maximal Overlap Discrete Wavelet Transform |
| SND | Subject Normalized discrete Domain |
| IBI | Inter Beat Interval |
| RMSSD | Root Mean Square of Successive Distance |
| RMS | Roor Mean Square |
| Cart | Classification and Regression Tree |
| SVM | Support Vector Machine |
| SVM-Linear | Support Vector Machine with Linear kernel |
| SVM-Gauss | Support Vector Machine with Gaussian kernel |
| SVM-Cubic | Support Vector Machine with polynomial cubic kernel |
| LOSO | Leave One Subject Out cross validation strategy |
| Acc. | Accuracy |
| F1-score | |
| W-F1 | weighted F1-score metric |
| Yng | Young adults |
| Old | Older adults |
References
- Lundgren, V.M.; Habibovic, A.; Andersson, J.; Lagström, T.; Nilsson, M.; Sirkka, A.; Fagerlönn, J.; Fredriksson, R.; Edgren, C.; Krupenia, S.; et al. Will there be new communication needs when introducing automated vehicles to the urban context? In Advances in Human Aspects of Transportation: Proceedings of the AHFE 2016 International Conference on Human Factors in Transportation, Walt Disney World®, Orlando, FL, USA, 31–27 July 2016; Springer: Berlin, Germany, 2017; pp. 485–497. [Google Scholar]
- Florentine, E.; Ang, M.A.; Pendleton, S.D.; Andersen, H.; Ang, M.H., Jr. Pedestrian notification methods in autonomous vehicles for multi-class mobility-on-demand service. In Proceedings of the Fourth International Conference on Human Agent Interaction, Singapore, 4–7 October 2016; pp. 387–392. [Google Scholar]
- Sorrenti, D.G.; Gasparini, F.; D’Elia, F.; Ballini, A.; Fontana, S.; Di Lauro, F.; Grossi, A.; Dessena, S.; Bandini, S. Pedestrian and autonomous vehicle interaction: Towards affective. In Proceedings of the 2nd Workshop on Social Robots for Personalized, Continuous and Adaptive Assistance (ALTRUIST), Florence, Italy, 16 December 2022. [Google Scholar]
- Rasouli, A.; Tsotsos, J.K. Autonomous vehicles that interact with pedestrians: A survey of theory and practice. IEEE Trans. Intell. Transp. Syst. 2019, 21, 900–918. [Google Scholar] [CrossRef]
- Fernández-Aguilar, L.; Ricarte, J.; Ros, L.; Latorre, J.M. Emotional differences in young and older adults: Films as mood induction procedure. Front. Psychol. 2018, 9, 1110. [Google Scholar] [CrossRef]
- Gasparini, F.; Grossi, A.; Nishinari, K.; Bandini, S. Age-Related Walkability Assessment: A Preliminary Study Based on the EMG. In Proceedings of the International Conference of the Italian Association for Artificial Intelligence, Virtual, 25–27 November 2020; Springer: Berlin, Germany, 2020; pp. 423–438. [Google Scholar]
- Getzmann, S.; Arnau, S.; Karthaus, M.; Reiser, J.E.; Wascher, E. Age-related differences in pro-active driving behavior revealed by EEG measures. Front. Hum. Neurosci. 2018, 12, 321. [Google Scholar] [CrossRef] [PubMed]
- Doiphode Rupali, S.; Vinchurkar Aruna, S. A Comparative Study of Auditory and Visual Reaction Time in Young and Elderly Males. Int. J. Health Sci. Res. 2020, 10, 333–337. [Google Scholar]
- Hertzum, M.; Hornbæk, K. How age affects pointing with mouse and touchpad: A comparison of young, adult, and elderly users. Int. J.-Hum.-Comput. Interact. 2010, 26, 703–734. [Google Scholar] [CrossRef]
- Shin, H.k.; Lee, H.C. Characteristics of driving reaction time of elderly drivers in the brake pedal task. J. Phys. Ther. Sci. 2012, 24, 567–570. [Google Scholar] [CrossRef]
- Can, Y.S.; Arnrich, B.; Ersoy, C. Stress detection in daily life scenarios using smart phones and wearable sensors: A survey. J. Biomed. Inform. 2019, 92, 103139. [Google Scholar] [CrossRef]
- Gasparini, F.; Giltri, M.; Bandini, S. Discriminating affective state intensity using physiological responses. Multimed. Tools Appl. 2020, 79, 35845–35865. [Google Scholar] [CrossRef]
- Subramanian, R.; Wache, J.; Abadi, M.K.; Vieriu, R.L.; Winkler, S.; Sebe, N. ASCERTAIN: Emotion and personality recognition using commercial sensors. IEEE Trans. Affect. Comput. 2016, 9, 147–160. [Google Scholar] [CrossRef]
- Markova, V.; Ganchev, T.; Kalinkov, K. Clas: A database for cognitive load, affect and stress recognition. In Proceedings of the 2019 International Conference on Biomedical Innovations and Applications (BIA), Varna, Bulgaria, 8–9 November 2019; IEEE: Piscataway, NJ, USA, 2019; pp. 1–4. [Google Scholar]
- Yetisen, A.K.; Martinez-Hurtado, J.L.; Ünal, B.; Khademhosseini, A.; Butt, H. Wearables in medicine. Adv. Mater. 2018, 30, 1706910. [Google Scholar] [CrossRef]
- Bandini, S.; Gasparini, F. Towards Affective Walkability for Healthy Ageing in the Future of the Cities. In Proceedings of the AI* AAL@ AI* IA, Rende, Italy, 19–22 November 2019; pp. 1–9. [Google Scholar]
- Birenboim, A.; Dijst, M.; Scheepers, F.E.; Poelman, M.P.; Helbich, M. Wearables and location tracking technologies for mental-state sensing in outdoor environments. Prof. Geogr. 2019, 71, 449–461. [Google Scholar] [CrossRef]
- Dzedzickis, A.; Kaklauskas, A.; Bucinskas, V. Human emotion recognition: Review of sensors and methods. Sensors 2020, 20, 592. [Google Scholar] [CrossRef] [PubMed]
- Shu, L.; Xie, J.; Yang, M.; Li, Z.; Li, Z.; Liao, D.; Xu, X.; Yang, X. A review of emotion recognition using physiological signals. Sensors 2018, 18, 2074. [Google Scholar] [CrossRef] [PubMed]
- De Nadai, S.; D’Incà, M.; Parodi, F.; Benza, M.; Trotta, A.; Zero, E.; Zero, L.; Sacile, R. Enhancing safety of transport by road by on-line monitoring of driver emotions. In Proceedings of the 2016 11th System of Systems Engineering Conference (SoSE), Kongsberg, Norway, 12–16 June 2016; IEEE: Piscataway, NJ, USA, 2016; pp. 1–4. [Google Scholar]
- Guo, R.; Li, S.; He, L.; Gao, W.; Qi, H.; Owens, G. Pervasive and unobtrusive emotion sensing for human mental health. In Proceedings of the 2013 7th International Conference on Pervasive Computing Technologies for Healthcare and Workshops, Venice, Italy, 5–8 May 2013; IEEE: Piscataway, NJ, USA, 2013; pp. 436–439. [Google Scholar]
- Verschuere, B.; Crombez, G.; Koster, E.; Uzieblo, K. Psychopathy and physiological detection of concealed information: A review. Psychol. Belg. 2006, 46, 99–116. [Google Scholar] [CrossRef]
- Bartolomé-Tomás, A.; Sánchez-Reolid, R.; Fernández-Sotos, A.; Latorre, J.M.; Fernández-Caballero, A. Arousal detection in elderly people from electrodermal activity using musical stimuli. Sensors 2020, 20, 4788. [Google Scholar] [CrossRef] [PubMed]
- Lee, M.S.; Lee, Y.K.; Pae, D.S.; Lim, M.T.; Kim, D.W.; Kang, T.K. Fast emotion recognition based on single pulse PPG signal with convolutional neural network. Appl. Sci. 2019, 9, 3355. [Google Scholar] [CrossRef]
- Choi, E.J.; Kim, D.K. Arousal and valence classification model based on long short-term memory and deap data for mental healthcare management. Healthc. Inform. Res. 2018, 24, 309–316. [Google Scholar] [CrossRef] [PubMed]
- Gellatly, I.R.; Meyer, J.P. The effects of goal difficulty on physiological arousal, cognition, and task performance. J. Appl. Psychol. 1992, 77, 694. [Google Scholar] [CrossRef]
- Li, P.; Li, Y.; Yao, Y.; Wu, C.; Nie, B.; Li, S.E. Sensitivity of Electrodermal Activity Features for Driver Arousal Measurement in Cognitive Load: The Application in Automated Driving Systems. IEEE Trans. Intell. Transp. Syst. 2021, 23, 14954–14967. [Google Scholar] [CrossRef]
- Mudassar, M.; Kalatian, A.; Farooq, B. Analysis of pedestrian stress level using GSR sensor in virtual immersive reality. arXiv 2021, arXiv:2111.11492. [Google Scholar] [CrossRef]
- Saitis, C.; Kalimeri, K. Identifying urban mobility challenges for the visually impaired with mobile monitoring of multimodal biosignals. In Proceedings of the International Conference on Universal Access in Human-Computer Interaction, Toronto, ON, Canada, 17–22 July 2016; Springer: Berlin, Germany, 2016; pp. 616–627. [Google Scholar]
- Kalimeri, K.; Saitis, C. Exploring multimodal biosignal features for stress detection during indoor mobility. In Proceedings of the 18th ACM International Conference on Multimodal Interaction, Tokyo, Japan, 12–16 November 2016; pp. 53–60. [Google Scholar]
- Yates, H.; Chamberlain, B.; Norman, G.; Hsu, W.H. Arousal detection for biometric data in built environments using machine learning. In Proceedings of the IJCAI 2017 Workshop on Artificial Intelligence in Affective Computing, Melbourne, Australia, 19–25 August 2017; PMLR: London, UK, 2017; pp. 58–72. [Google Scholar]
- Setz, C.; Arnrich, B.; Schumm, J.; La Marca, R.; Tröster, G.; Ehlert, U. Discriminating stress from cognitive load using a wearable EDA device. IEEE Trans. Inf. Technol. Biomed. 2009, 14, 410–417. [Google Scholar] [CrossRef]
- Karthikeyan, P.; Murugappan, M.; Yaacob, S. A review on stress inducement stimuli for assessing human stress using physiological signals. In Proceedings of the 2011 IEEE 7th International Colloquium on Signal Processing and its Applications, Penang, Malaysia, 4–6 March 2011; IEEE: Piscataway, NJ, USA, 2011; pp. 420–425. [Google Scholar]
- Nourbakhsh, N.; Wang, Y.; Chen, F.; Calvo, R.A. Using galvanic skin response for cognitive load measurement in arithmetic and reading tasks. In Proceedings of the 24th Australian Computer-Human Interaction Conference, Melbourne, Australia, 26–30 November 2012; pp. 420–423. [Google Scholar]
- Hussain, S.; Chen, S.; Calvo, R.A.; Chen, F. Classification of cognitive load from task performance & multichannel physiology during affective changes. In Proceedings of the Conference on Multimodal Interaction, Alicante, Spain, 14–18 November 2011; pp. 1–4. [Google Scholar]
- Zhou, J.; Arshad, S.Z.; Luo, S.; Yu, K.; Berkovsky, S.; Chen, F. Indexing cognitive load using blood volume pulse features. In Proceedings of the 2017 CHI Conference Extended Abstracts on Human Factors in Computing Systems, Denver, CO, USA, 6–11 May 2017; pp. 2269–2275. [Google Scholar]
- Nourbakhsh, N.; Wang, Y.; Chen, F. GSR and blink features for cognitive load classification. In Proceedings of the IFIP Conference on Human-Computer Interaction, Cape Town, South Africa, 2–6 September 2013; Springer: Berlin, Germany, 2013; pp. 159–166. [Google Scholar]
- Meteier, Q.; Capallera, M.; Ruffieux, S.; Angelini, L.; Abou Khaled, O.; Mugellini, E.; Widmer, M.; Sonderegger, A. Classification of drivers’ workload using physiological signals in conditional automation. Front. Psychol. 2021, 12, 268. [Google Scholar] [CrossRef]
- Jafari, M.J.; Zaeri, F.; Jafari, A.H.; Payandeh Najafabadi, A.T.; Al-Qaisi, S.; Hassanzadeh-Rangi, N. Assessment and monitoring of mental workload in subway train operations using physiological, subjective, and performance measures. Hum. Factors Ergon. Manuf. Serv. Ind. 2020, 30, 165–175. [Google Scholar] [CrossRef]
- Wilson, G.F. An analysis of mental workload in pilots during flight using multiple psychophysiological measures. Int. J. Aviat. Psychol. 2002, 12, 3–18. [Google Scholar] [CrossRef]
- Wang, H.; Jiang, N.; Pan, T.; Si, H.; Li, Y.; Zou, W. Cognitive Load Identification of Pilots Based on Physiological-Psychological Characteristics in Complex Environments. J. Adv. Transp. 2020, 2020. [Google Scholar] [CrossRef]
- Brophy, E.; Veiga, J.J.D.; Wang, Z.; Ward, T.E. A machine vision approach to human activity recognition using photoplethysmograph sensor data. In Proceedings of the 2018 29th Irish Signals and Systems Conference (ISSC), Belfast, UK, 21–22 June 2018; IEEE: Piscataway, NJ, USA, 2018; pp. 1–6. [Google Scholar]
- Arunkumar, K.; Bhaskar, M. Heart rate estimation from wrist-type photoplethysmography signals during physical exercise. Biomed. Signal Process. Control 2020, 57, 101790. [Google Scholar] [CrossRef]
- Chan, K.; Zhang, Y. Adaptive reduction of motion artifact from photoplethysmographic recordings using a variable step-size LMS filter. In Proceedings of the SENSORS, 2002 IEEE, Orlando, FL, USA, 12–14 June 2002; IEEE: Piscataway, NJ, USA, 2002; Volume 2, pp. 1343–1346. [Google Scholar]
- Ram, M.R.; Madhav, K.V.; Krishna, E.H.; Komalla, N.R.; Reddy, K.A. A novel approach for motion artifact reduction in PPG signals based on AS-LMS adaptive filter. IEEE Trans. Instrum. Meas. 2011, 61, 1445–1457. [Google Scholar] [CrossRef]
- Boukhechba, M.; Cai, L.; Wu, C.; Barnes, L.E. ActiPPG: Using deep neural networks for activity recognition from wrist-worn photoplethysmography (PPG) sensors. Smart Health 2019, 14, 100082. [Google Scholar] [CrossRef]
- Ji, X.; Li, H.; Lu, Z.; Wang, Z.; Chai, X. Research on the Electrodermal Activity during Walking and Running. In Proceedings of the 2019 4th International Conference on Control and Robotics Engineering (ICCRE), Nanjing, China, 20–23 April 2019; IEEE: Piscataway, NJ, USA, 2019; pp. 179–183. [Google Scholar]
- Parkka, J.; Ermes, M.; Korpipaa, P.; Mantyjarvi, J.; Peltola, J.; Korhonen, I. Activity classification using realistic data from wearable sensors. IEEE Trans. Inf. Technol. Biomed. 2006, 10, 119–128. [Google Scholar] [CrossRef] [PubMed]
- Fernández-Aguilar, L.; Latorre, J.M.; Martínez-Rodrigo, A.; Moncho-Bogani, J.V.; Ros, L.; Latorre, P.; Ricarte, J.J.; Fernández-Caballero, A. Differences between young and older adults in physiological and subjective responses to emotion induction using films. Sci. Rep. 2020, 10, 1–13. [Google Scholar]
- Santos, M.A.A.; Sousa, A.C.S.; Reis, F.P.; Santos, T.R.; Lima, S.O.; Barreto-Filho, J.A. Does the aging process significantly modify the Mean Heart Rate? Arq. Bras. Cardiol. 2013, 101, 388–398. [Google Scholar] [CrossRef] [PubMed]
- Wood, R.; Maraj, B.; Lee, C.M.; Reyes, R. Short-term heart rate variability during a cognitive challenge in young and older adults. Age Ageing 2002, 31, 131–135. [Google Scholar] [CrossRef]
- Verrel, J.; Lövdén, M.; Schellenbach, M.; Schaefer, S.; Lindenberger, U. Interacting effects of cognitive load and adult age on the regularity of whole-body motion during treadmill walking. Psychol. Aging 2009, 24, 75. [Google Scholar] [CrossRef] [PubMed]
- Fernández-Aguilar, L.; Martínez-Rodrigo, A.; Moncho-Bogani, J.; Fernández-Caballero, A.; Latorre, J.M. Emotion detection in aging adults through continuous monitoring of electro-dermal activity and heart-rate variability. In Proceedings of the International Work-Conference on the Interplay Between Natural and Artificial Computation, Almeria, Spain, 3–7 June 2019; Springer: Berlin, Germany, 2019; pp. 252–261. [Google Scholar]
- Spielberger, C.D. State-Trait Anxiety Inventory for Adults; APA: Washington, DC, USA, 1983. [Google Scholar]
- Gorrini, A.; Shimura, K.; Bandini, S.; Ohtsuka, K.; Nishinari, K. Experimental investigation of pedestrian personal space: Toward modeling and simulation of pedestrian crowd dynamics. Transp. Res. Rec. 2014, 2421, 57–63. [Google Scholar] [CrossRef]
- Yanagisawa, D.; Tomoeda, A.; Nishinari, K. Influence of Rhythm and Velocity Variance on Pedestrian Flow. In Pedestrian and Evacuation Dynamics 2012; Springer: Berlin, Germany, 2014; pp. 1291–1303. [Google Scholar]
- Burns, A.; Doheny, E.P.; Greene, B.R.; Foran, T.; Leahy, D.; O’Donovan, K.; McGrath, M.J. SHIMMER™: An extensible platform for physiological signal capture. In Proceedings of the 2010 Annual International Conference of the IEEE Engineering in Medicine and Biology, Buenos Aires, Argentina, 31 August–4 September 2010; IEEE: Piscataway, NJ, USA, 2010; pp. 3759–3762. [Google Scholar]
- Sweeney, K.T.; Ward, T.E.; McLoone, S.F. Artifact removal in physiological signals—Practices and possibilities. IEEE Trans. Inf. Technol. Biomed. 2012, 16, 488–500. [Google Scholar] [CrossRef]
- Biswas, A.; Roy, M.S.; Gupta, R. Motion artifact reduction from finger photoplethysmogram using discrete wavelet transform. In Recent Trends in Signal and Image Processing; Springer: Berlin, Germany, 2019; pp. 89–98. [Google Scholar]
- Nason, G.P.; Silverman, B.W. The stationary wavelet transform and some statistical applications. In Wavelets and Statistics; Springer: Berlin, Germany, 1995; pp. 281–299. [Google Scholar]
- Donoho, D.L.; Johnstone, J.M. Ideal spatial adaptation by wavelet shrinkage. Biometrika 1994, 81, 425–455. [Google Scholar] [CrossRef]
- Holschneider, M.; Kronland-Martinet, R.; Morlet, J.; Tchamitchian, P. A real-time algorithm for signal analysis with the help of the wavelet transform. In Wavelets; Springer: Berlin, Germany, 1990; pp. 286–297. [Google Scholar]
- Chen, W.; Jaques, N.; Taylor, S.; Sano, A.; Fedor, S.; Picard, R.W. Wavelet-based motion artifact removal for electrodermal activity. In Proceedings of the 2015 37th Annual International Conference of the IEEE Engineering in Medicine and Biology Society (EMBC), Milan, Italy, 25–29 August 2015; IEEE: Piscataway, NJ, USA, 2015; pp. 6223–6226. [Google Scholar]
- Phinyomark, A.; Limsakul, C.; Phukpattaranont, P. A comparative study of wavelet denoising for multifunction myoelectric control. In Proceedings of the 2009 International Conference on Computer and Automation Engineering, Bangkok, Thailand, 8–10 March 2009; IEEE: Piscataway, NJ, USA, 2009; pp. 21–25. [Google Scholar]
- Wei, G.; Tian, F.; Tang, G.; Wang, C. A wavelet-based method to predict muscle forces from surface electromyography signals in weightlifting. J. Bionic Eng. 2012, 9, 48–58. [Google Scholar] [CrossRef]
- Ganapathy, N.; Veeranki, Y.R.; Swaminathan, R. Convolutional neural network based emotion classification using electrodermal activity signals and time-frequency features. Expert Syst. Appl. 2020, 159, 113571. [Google Scholar] [CrossRef]
- Halaki, M.; Ginn, K. Normalization of EMG signals: To normalize or not to normalize and what to normalize to. In Computational Intelligence in Electromyography Analysis—A Perspective on Current Applications and Future Challenges; BoD—Books on Demand: Norderstedt, Germany, 2012; pp. 175–194. [Google Scholar]
- Avram, R.; Tison, G.H.; Aschbacher, K.; Kuhar, P.; Vittinghoff, E.; Butzner, M.; Runge, R.; Wu, N.; Pletcher, M.J.; Marcus, G.M.; et al. Real-world heart rate norms in the Health eHeart study. NPJ Digit. Med. 2019, 2, 1–10. [Google Scholar] [CrossRef]
- Gasparini, F.; Grossi, A.; Giltri, M.; Bandini, S. Personalized PPG Normalization Based on Subject Heartbeat in Resting State Condition. Signals 2022, 3, 249–265. [Google Scholar] [CrossRef]
- Stein, P.K.; Bosner, M.S.; Kleiger, R.E.; Conger, B.M. Heart rate variability: A measure of cardiac autonomic tone. Am. Heart J. 1994, 127, 1376–1381. [Google Scholar] [CrossRef] [PubMed]
- Greco, A.; Valenza, G.; Lanata, A.; Scilingo, E.P.; Citi, L. cvxEDA: A convex optimization approach to electrodermal activity processing. IEEE Trans. Biomed. Eng. 2015, 63, 797–804. [Google Scholar] [CrossRef] [PubMed]
- Citi, L. Cvx EDA. 2022. Available online: http:/github.com/lciti/cvxEDA (accessed on 23 February 2022).
- Braithwaite, J.J.; Watson, D.G.; Jones, R.; Rowe, M. A guide for analysing electrodermal activity (EDA) & skin conductance responses (SCRs) for psychological experiments. Psychophysiology 2013, 49, 1017–1034. [Google Scholar]
- Boucsein, W. Principles of electrodermal phenomena. In Electrodermal Activity; Springer: Berlin, Germany, 2012; pp. 1–86. [Google Scholar]
- Phinyomark, A.; Limsakul, C.; Phukpattaranont, P. A novel feature extraction for robust EMG pattern recognition. arXiv 2009, arXiv:0912.3973. [Google Scholar]
- Gasparini, F.; Grossi, A.; Nishinari, K.; Bandini, S. EMG for walkability assessment: A comparison between elderly and young adults. In Proceedings of the Workshop on Artificial Intelligence for an Ageing Society (AIxAS 2020), Online, 25–27 November 2020; AI*IA Series, CEUR-WS. Volume 2804. [Google Scholar]
- Breiman, L.; Friedman, J.; Olshen, R.A.; Stone, C.J. Classification and Regression Trees; Chapman & Hall: New York, NY, USA, 1984. [Google Scholar]
- Cortes, C.; Vapnik, V. Support-vector networks. Mach. Learn. 1995, 20, 273–297. [Google Scholar] [CrossRef]
- Schmidt, P.; Reiss, A.; Dürichen, R.; Laerhoven, K.V. Wearable-based affect recognition—A review. Sensors 2019, 19, 4079. [Google Scholar] [CrossRef]
- Bishop, C.M. Pattern Recognition and Machine Learning; Springer: Berlin, Germany, 2006. [Google Scholar]
- Hammerla, N.Y.; Halloran, S.; Plötz, T. Deep, convolutional, and recurrent models for human activity recognition using wearables. arXiv 2016, arXiv:1604.08880. [Google Scholar]
- Gasparini, F.; Grossi, A.; Bandini, S. Population Age classification based on subject’s physiological responses. In Proceedings of the Workshop on Artificial Intelligence for an Ageing Society (AIxAS 2021), Milan, Italy, 29 November 2021; AI*IA Series, CEUR-WS. Volume 3108. [Google Scholar]
- Martínez-Rodrigo, A.; Zangróniz, R.; Pastor, J.M.; Fernández-Caballero, A. Arousal level classification in the ageing adult by measuring electrodermal skin conductivity. In Proceedings of the Ambient Intelligence for Health, Puerto Varas, Chile, 1–4 December 2015; Springer: Berlin, Germany, 2015; pp. 213–223. [Google Scholar]
- Ji, T.; Pachi, A. Frequency and velocity of people walking. Struct. Eng. 2005, 84, 36–40. [Google Scholar]
- Kruskal, W.H.; Wallis, W.A. Use of ranks in one-criterion variance analysis. J. Am. Stat. Assoc. 1952, 47, 583–621. [Google Scholar] [CrossRef]
- Ghosh, A.; Danieli, M.; Riccardi, G. Annotation and prediction of stress and workload from physiological and inertial signals. In Proceedings of the 2015 37th Annual International Conference of the IEEE Engineering in Medicine and Biology Society (EMBC), Milan, Italy, 25–29 August 2015; IEEE: Piscataway, NJ, USA, 2015; pp. 1621–1624. [Google Scholar]
- Beh, W.K.; Wu, Y.H.; Wu, A.Y.A. Robust PPG-based Mental Workload Assessment System using Wearable Devices. IEEE J. Biomed. Health Inform. 2021; Early access. [Google Scholar] [CrossRef]
- Giannakakis, G.; Grigoriadis, D.; Giannakaki, K.; Simantiraki, O.; Roniotis, A.; Tsiknakis, M. Review on psychological stress detection using biosignals. IEEE Trans. Affect. Comput. 2019, 13, 440–460. [Google Scholar] [CrossRef]
- Di Lascio, E.; Gashi, S.; Santini, S. Laughter recognition using non-invasive wearable devices. In Proceedings of the 13th EAI International Conference on Pervasive Computing Technologies for Healthcare, Trento, Italy, 20–23 May 2019; pp. 262–271. [Google Scholar]
- Schmidt, P.; Reiss, A.; Duerichen, R.; Van Laerhoven, K. Wearable affect and stress recognition: A review. arXiv 2018, arXiv:1811.08854. [Google Scholar]
- Shukla, J.; Barreda-Angeles, M.; Oliver, J.; Nandi, G.; Puig, D. Feature extraction and selection for emotion recognition from electrodermal activity. IEEE Trans. Affect. Comput. 2021, 12, 857–869. [Google Scholar] [CrossRef]
- Akbani, R.; Kwek, S.; Japkowicz, N. Applying support vector machines to imbalanced datasets. In Proceedings of the European Conference on Machine Learning, Pisa, Italy, 20–24 September 2004; Springer: Berlin, Germany, 2004; pp. 39–50. [Google Scholar]
- Abdu-Aljabar, R.D.; Awad, O.A. A comparative analysis study of lung cancer detection and relapse prediction using XGBoost classifier. In Proceedings of the IOP Conference Series: Materials Science and Engineering; IOP Publishing: Bristol, UK, 2021; Volume 1076, p. 012048. [Google Scholar]
- Gasparini, F.; Giltri, M.; Bandini, S. Safety perception and pedestrian dynamics: Experimental results towards affective agents modeling. AI Commun. 2021, 34, 5–19. [Google Scholar] [CrossRef]


| Cognitive Load Session | Walking Session | |||||||||||||
|---|---|---|---|---|---|---|---|---|---|---|---|---|---|---|
| BC | R | C | MC | AL | BW | F1 | F2 | F3 | FW | WO | Obs | WO + Obs | ||
| Young Adults | PPG, GSR | 46 | 32 | 32 | 96 | 96 | 109 | 46 | 46 | 46 | - | - | - | 46 |
| Gastrocn. EMG, Tibial EMG | - | - | - | - | - | 55 | 23 | 23 | 23 | - | - | - | 23 | |
| PPG, GSR (augmented) | 46 | 96 | 64 | 96 | 96 | 109 | 46 | 46 | 46 | - | - | - | 46 | |
| Older Adlults | PPG, GSR | 60 | 40 | 40 | 120 | 120 | 129 | 57 | 57 | 57 | 57 | 160 | 104 | - |
| Gastrocn. EMG, Tibial EMG | - | - | - | - | - | 65 | 28 | 27 | 28 | 28 | 77 | 50 | - | |
| PPG, GSR (augmented) | 60 | 120 | 80 | 120 | 120 | 129 | 57 | 57 | 57 | 114 | 160 | 104 | - | |
| R Task | C Task | MC Task | AL Task | ||||||||||||||
|---|---|---|---|---|---|---|---|---|---|---|---|---|---|---|---|---|---|
| Classifier | Yng | Old | Yng | Old | Yng | Old | Yng | Old | |||||||||
| Acc. | W- | Acc. | W- | Acc. | W- | Acc. | W- | ||||||||||
| PPG | SVM Linear | 63% | 0.53 | 0.69 | 62% | 69% | 0.55 | 0.76 | 67% | 74% | 0.68 | 0.78 | 73% | 60% | 0.44 | 0.69 | 58% |
| SVM Cubic | 64% | 0.59 | 0.68 | 64% | 62% | 0.60 | 0.64 | 62% | 70% | 0.68 | 0.72 | 70% | 64% | 0.62 | 0.65 | 64% | |
| SVM Gauss | 66% | 0.61 | 0.70 | 66% | 65% | 0.41 | 0.75 | 60% | 71% | 0.65 | 0.75 | 71% | 56% | 0.39 | 0.66 | 54% | |
| Cart | 56% | 0.54 | 0.59 | 57% | 59% | 0.56 | 0.62 | 59% | 73% | 0.68 | 0.76 | 73% | 50% | 0.46 | 0.52 | 50% | |
| Random | 50% | 0.47 | 0.52 | 50% | 50% | 0.44 | 0.55 | 50% | 50% | 0.47 | 0.52 | 50% | 50% | 0.47 | 0.52 | 50% | |
| GSR | SVM Linear | 63% | 0.54 | 0.70 | 63% | 66% | 0.63 | 0.69 | 66% | 64% | 0.59 | 0.68 | 64% | 67% | 0.60 | 0.72 | 67% |
| SVM Cubic | 58% | 0.53 | 0.62 | 58% | 58% | 0.53 | 0.61 | 58% | 66% | 0.61 | 0.70 | 66% | 58% | 0.51 | 0.63 | 58% | |
| SVM Gauss | 62% | 0.54 | 0.68 | 62% | 65% | 0.59 | 0.70 | 65% | 62% | 0.55 | 0.67 | 62% | 59% | 0.49 | 0.66 | 58% | |
| Cart | 59% | 0.52 | 0.64 | 59% | 63% | 0.57 | 0.67 | 62% | 54% | 0.49 | 0.59 | 54% | 57% | 0.54 | 0.61 | 58% | |
| Random | 50% | 0.47 | 0.52 | 50% | 50% | 0.44 | 0.55 | 50% | 50% | 0.47 | 0.52 | 50% | 50% | 0.47 | 0.52 | 50% | |
| PPG and GSR | SVM Linear | 75% | 0.71 | 0.77 | 74% | 69% | 0.67 | 0.72 | 70% | 78% | 0.75 | 0.81 | 78% | 65% | 0.59 | 0.69 | 65% |
| SVM Cubic | 64% | 0.62 | 0.66 | 64% | 61% | 0.56 | 0.65 | 61% | 69% | 0.64 | 0.72 | 68% | 64% | 0.58 | 0.69 | 64% | |
| SVM Gauss | 72% | 0.67 | 0.67 | 72% | 61% | 0.56 | 0.65 | 61% | 71% | 0.68 | 0.74 | 71% | 65% | 0.59 | 0.69 | 65% | |
| Cart | 65% | 0.60 | 0.69 | 65% | 58% | 0.52 | 0.63 | 58% | 67% | 0.63 | 0.70 | 67% | 62% | 0.55 | 0.66 | 61% | |
| Random | 50% | 0.47 | 0.52 | 50% | 50% | 0.44 | 0.55 | 50% | 50% | 0.47 | 0.52 | 50% | 50% | 0.47 | 0.52 | 50% | |
| Predicted Class | |||||||
|---|---|---|---|---|---|---|---|
| MC_Yng | R_Yng | AL_Yng | MC_Old | R_Old | AL_Old | ||
| True class | MC_Yng | 56% | 7% | 3% | 19% | 10% | 4% |
| R_Yng | 4% | 46% | 2% | 5% | 26% | 17% | |
| AL_Yng | 0% | 6% | 50% | 0% | 4% | 40% | |
| MC_Old | 14% | 7% | 1% | 71% | 1% | 7% | |
| R_Old | 2% | 15% | 2% | 3% | 76% | 3% | |
| AL_Old | 2% | 12% | 18% | 2% | 2% | 66% | |
| PPG Features | GSR Features | PPG and GSR Features | |||||||||||
|---|---|---|---|---|---|---|---|---|---|---|---|---|---|
| Classifier | MC | AL | MC | AL | MC | AL | |||||||
| Acc. | W- | Acc. | W- | Acc. | W- | ||||||||
| Young Adults | SVM Linear | 79% | 0.77 | 0.80 | 79% | 93% | 0.93 | 0.94 | 93% | 91% | 0.91 | 0.91 | 91% |
| SVM Cubic | 72% | 0.72 | 0.72 | 72% | 91% | 0.91 | 0.92 | 91% | 80% | 0.80 | 0.79 | 80% | |
| SVM Gauss | 76% | 0.75 | 0.76 | 76% | 91% | 0.90 | 0.91 | 91% | 83% | 0.84 | 0.83 | 83% | |
| Cart | 64% | 0.63 | 0.64 | 64% | 93% | 0.93 | 0.93 | 93% | 91% | 0.91 | 0.91 | 91% | |
| Random | 50% | 0.50 | 0.50 | 50% | 50% | 0.50 | 0.50 | 50% | 50% | 0.50 | 0.50 | 50% | |
| Older Adults | SVM Linear | 80% | 0.80 | 0.81 | 80% | 92% | 0.92 | 0.92 | 92% | 90% | 0.90 | 0.90 | 90% |
| SVM Cubic | 72% | 0.71 | 0.73 | 72% | 90% | 0.90 | 0.91 | 90% | 89% | 0.89 | 0.89 | 89% | |
| SVM Gauss | 78% | 0.78 | 0.78 | 78% | 92% | 0.92 | 0.92 | 92% | 89% | 0.89 | 0.89 | 89% | |
| Cart | 75% | 0.75 | 0.74 | 75% | 88% | 0.88 | 0.89 | 88% | 90% | 0.90 | 0.90 | 90% | |
| Random | 50% | 0.50 | 0.50 | 50% | 50% | 0.50 | 0.50 | 50% | 50% | 0.50 | 0.50 | 50% | |
| PPG | GSR | PPG + GSR | |||||
|---|---|---|---|---|---|---|---|
| % InstancesHigh Arousal | % InstancesLow Arousal | % InstancesHigh Arousal | % InstancesLow Arousal | % InstancesHigh Arousal | % InstancesLow Arousal | ||
| Yng | B | 17% | 83% | 17% | 83% | 17% | 83% |
| R | 34% | 66% | 28% | 72% | 22% | 78% | |
| C | 69% | 31% | 84% | 16% | 75% | 25% | |
| Old | B | 7% | 93% | 10% | 90% | 8% | 93% |
| R | 50% | 50% | 35% | 65% | 40% | 60% | |
| C | 53% | 47% | 83% | 17% | 73% | 27% | |
| Young Adults | Older Adults | |
|---|---|---|
| Metronome | EMG | EMG |
| F1 = 0.58 | 0.59 | 0.66 |
| F2 = 0.70 | 0.72 | 0.76 |
| F3 = 0.83 | 0.85 | 0.85 |
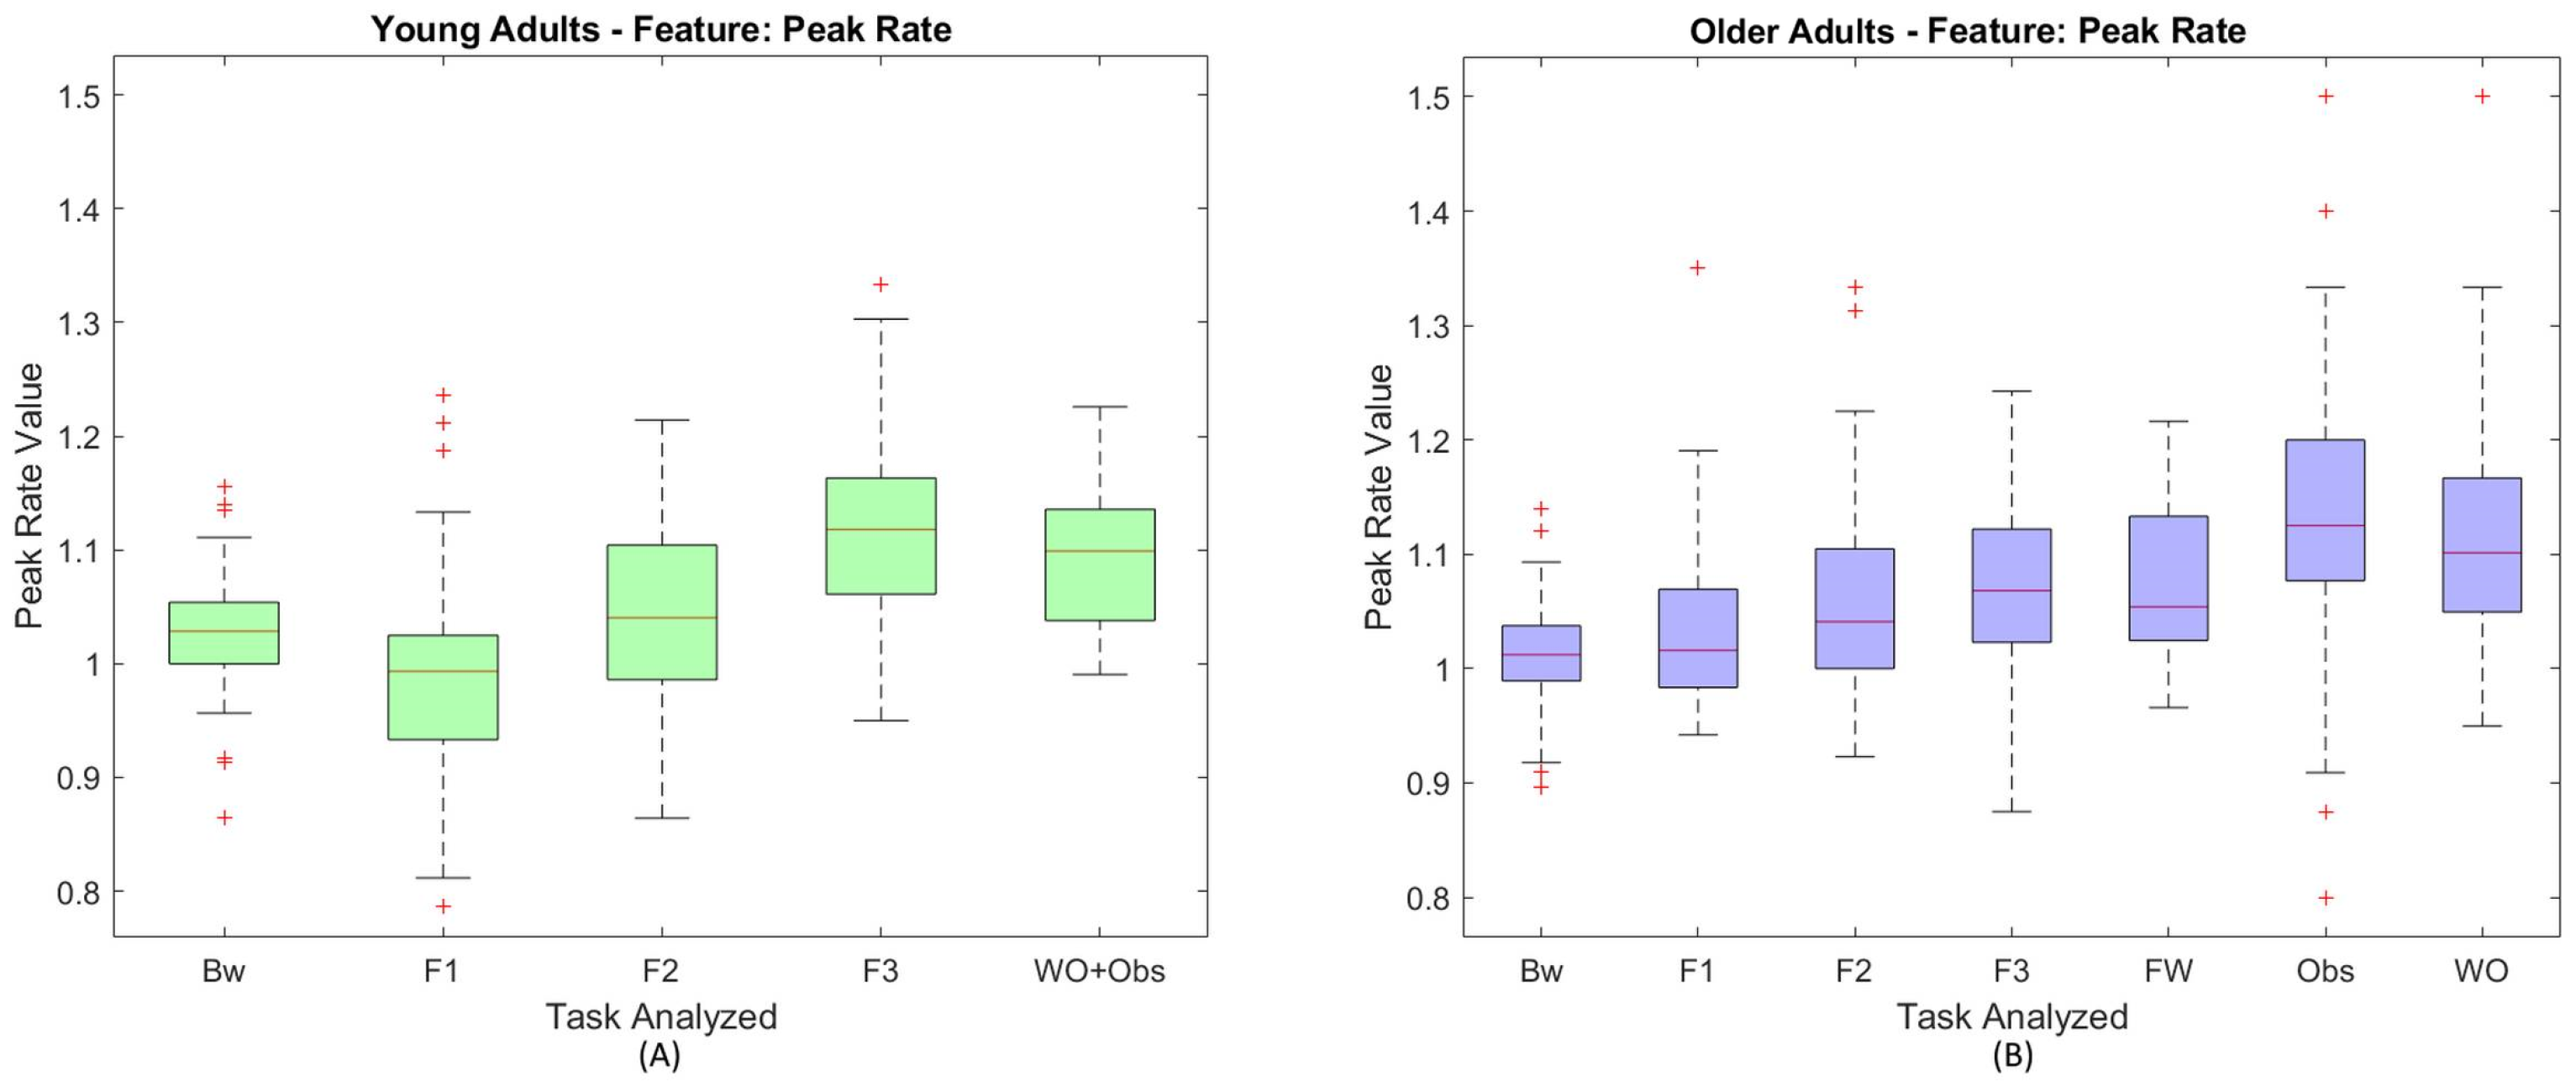
| First Task | Second Task | Maximum | Minimum | Mean | Variance | Peak Rate | IBI | RMSSD |
|---|---|---|---|---|---|---|---|---|
| B | F1 | <0.001 | <0.001 | 0.29 | <0.001 | <0.001 | <0.001 | <0.001 |
| B | F2 | <0.001 | <0.001 | 0.21 | <0.001 | 0.24 | 0.45 | <0.001 |
| B | F3 | <0.001 | <0.001 | 0.03 | <0.001 | <0.001 | <0.001 | <0.001 |
| B | WO + Obs | <0.001 | <0.001 | 0.01 | <0.001 | <0.001 | <0.001 | <0.001 |
| F1 | F2 | 0.58 | 0.66 | 0.80 | 0.64 | <0.001 | <0.001 | 0.14 |
| F1 | F3 | 0.77 | 0.64 | 0.28 | 0.14 | <0.001 | <0.001 | 0.70 |
| F1 | WO + Obs | <0.001 | <0.001 | 0.18 | <0.001 | <0.001 | <0.001 | <0.001 |
| F2 | F3 | 0.51 | 0.91 | 0.42 | 0.37 | <0.001 | <0.001 | 0.08 |
| F2 | WO + Obs | <0.001 | <0.001 | 0.20 | 0.01 | <0.001 | <0.001 | 0.08 |
| F3 | WO + Obs | <0.001 | <0.001 | 0.71 | 0.17 | 0.10 | 0.24 | <0.001 |
| First Task | Second Task | Maximum | Minimum | Mean | Variance | Peak Rate | IBI | RMSSD |
|---|---|---|---|---|---|---|---|---|
| B | F1 | <0.001 | <0.001 | <0.001 | <0.001 | 0.18 | 0.15 | <0.001 |
| B | F2 | <0.001 | <0.001 | <0.001 | <0.001 | <0.001 | <0.001 | <0.001 |
| B | F3 | <0.001 | <0.001 | <0.001 | <0.001 | <0.001 | <0.001 | <0.001 |
| B | FW | <0.001 | <0.001 | 0.20 | <0.001 | <0.001 | <0.001 | <0.001 |
| B | Obs | 0.19 | <0.001 | 0.01 | <0.001 | <0.001 | <0.001 | <0.001 |
| B | WO | <0.001 | <0.001 | <0.001 | <0.001 | <0.001 | <0.001 | <0.001 |
| F1 | F2 | 0.78 | 0.89 | 0.98 | 0.66 | 0.03 | 0.03 | 0.56 |
| F1 | F3 | 0.90 | 0.60 | 0.73 | 0.49 | <0.001 | <0.001 | 0.30 |
| F1 | FW | 0.28 | <0.001 | 0.01 | 0.78 | <0.001 | <0.001 | 0.13 |
| F1 | Obs | 0.07 | 0.49 | 0.88 | 0.10 | <0.001 | <0.001 | 0.13 |
| F1 | WO | 0.38 | 0.74 | 0.01 | 0.08 | <0.001 | <0.001 | 0.31 |
| F2 | F3 | 0.90 | 0.64 | 0.82 | 0.73 | 0.16 | 0.18 | 0.58 |
| F2 | FW | 0.38 | 0.01 | 0.01 | 0.82 | 0.38 | 0.27 | 0.30 |
| F2 | Obs | 0.04 | 0.32 | 0.99 | 0.19 | <0.001 | 0.02 | 0.41 |
| F2 | WO | 0.30 | 0.85 | 0.02 | 0.15 | <0.001 | 0.02 | 0.77 |
| F3 | FW | 0.25 | 0.02 | <0.001 | 0.60 | 0.67 | 0.84 | 0.73 |
| F3 | Obs | 0.07 | 0.19 | 0.92 | 0.35 | <0.001 | 0.23 | 0.91 |
| F3 | WO | 0.36 | 0.82 | 0.04 | 0.33 | 0.03 | 0.36 | 0.66 |
| FW | Obs | 0.01 | <0.001 | 0.05 | 0.14 | <0.001 | 0.14 | 0.77 |
| FW | WO | 0.06 | <0.001 | <0.001 | 0.09 | 0.01 | 0.20 | 0.35 |
| Obs | WO | 0.18 | 0.18 | 0.05 | 0.94 | 0.01 | 0.72 | 0.51 |
| WO vs. FW | FW vs. Obs | WO vs. Obs | |||||||||||
|---|---|---|---|---|---|---|---|---|---|---|---|---|---|
| Classifier | WO | FW | Obs | FW | Obs | WO | |||||||
| Acc. | W- | Acc. | W- | Acc. | W- | ||||||||
| PPG | SVM Linear | 68% | 0.73 | 0.61 | 68% | 83% | 0.80 | 0.85 | 83% | 66% | 0.45 | 0.75 | 63% |
| SVM Cubic | 70% | 0.75 | 0.62 | 70% | 70% | 0.67 | 0.72 | 70% | 55% | 0.37 | 0.65 | 54% | |
| SVM Gauss | 67% | 0.74 | 0.54 | 66% | 76% | 0.71 | 0.80 | 76% | 64% | 0.32 | 0.75 | 58% | |
| Cart | 64% | 0.71 | 0.52 | 63% | 71% | 0.69 | 0.72 | 71% | 55% | 0.40 | 0.64 | 54% | |
| Random | 50% | 0.54 | 0.45 | 50% | 50% | 0.51 | 0.49 | 50% | 50% | 0.55 | 0.44 | 51% | |
| GSR | SVM Linear | 64% | 0.70 | 0.53 | 63% | 77% | 0.74 | 0.79 | 77% | 65% | 0.30 | 0.76 | 58% |
| SVM Cubic | 58% | 0.62 | 0.54 | 59% | 80% | 0.79 | 0.82 | 80% | 64% | 0.50 | 0.72 | 63% | |
| SVM Gauss | 62% | 0.69 | 0.51 | 62% | 81% | 0.79 | 0.82 | 81% | 66% | 0.44 | 0.76 | 63% | |
| Cart | 63% | 0.69 | 0.56 | 63% | 74% | 0.73 | 0.74 | 74% | 58% | 0.47 | 0.65 | 58% | |
| Random | 50% | 0.54 | 0.45 | 50% | 50% | 0.51 | 0.49 | 50% | 50% | 0.55 | 0.44 | 51% | |
| PPG and GSR | SVM Linear | 71% | 0.75 | 0.66 | 71% | 81% | 0.78 | 0.83 | 80% | 67% | 0.46 | 0.77 | 65% |
| SVM Cubic | 66% | 0.71 | 0.59 | 66% | 80% | 0.78 | 0.82 | 80% | 64% | 0.51 | 0.71 | 63% | |
| SVM Gauss | 73% | 0.77 | 0.65 | 72% | 81% | 0.80 | 0.83 | 81% | 68% | 0.52 | 0.76 | 66% | |
| Cart | 64% | 0.71 | 0.53 | 63% | 69% | 0.67 | 0.71 | 69% | 68% | 0.56 | 0.74 | 67% | |
| Random | 50% | 0.54 | 0.45 | 50% | 50% | 0.51 | 0.49 | 50% | 50% | 0.55 | 0.44 | 51% | |
| PPG Features | GSR Features | PPG and GSR Features | ||||||||||
|---|---|---|---|---|---|---|---|---|---|---|---|---|
| Classifier | F3 | WO + Obs | F3 | WO + Obs | F3 | WO + Obs | ||||||
| Acc. | W- | Acc. | W- | Acc. | W- | |||||||
| SVM Linear | 74% | 0.76 | 0.71 | 74% | 65% | 0.61 | 0.69 | 65% | 72% | 0.72 | 0.71 | 72% |
| SVM Cubic | 60% | 0.62 | 0.57 | 60% | 65% | 0.67 | 0.64 | 65% | 62% | 0.65 | 0.59 | 62% |
| SVM Gauss | 72% | 0.75 | 0.68 | 71% | 66% | 0.61 | 0.70 | 66% | 68% | 0.69 | 0.68 | 68% |
| Cart | 63% | 0.67 | 0.58 | 62% | 63% | 0.67 | 0.59 | 63% | 62% | 0.65 | 0.58 | 62% |
| Random | 50% | 0.50 | 0.50 | 50% | 50% | 0.50 | 0.50 | 50% | 50% | 0.50 | 0.50 | 50% |
Disclaimer/Publisher’s Note: The statements, opinions and data contained in all publications are solely those of the individual author(s) and contributor(s) and not of MDPI and/or the editor(s). MDPI and/or the editor(s) disclaim responsibility for any injury to people or property resulting from any ideas, methods, instructions or products referred to in the content. |
© 2023 by the authors. Licensee MDPI, Basel, Switzerland. This article is an open access article distributed under the terms and conditions of the Creative Commons Attribution (CC BY) license (https://creativecommons.org/licenses/by/4.0/).
Share and Cite
Gasparini, F.; Grossi, A.; Giltri, M.; Nishinari, K.; Bandini, S. Behavior and Task Classification Using Wearable Sensor Data: A Study across Different Ages. Sensors 2023, 23, 3225. https://doi.org/10.3390/s23063225
Gasparini F, Grossi A, Giltri M, Nishinari K, Bandini S. Behavior and Task Classification Using Wearable Sensor Data: A Study across Different Ages. Sensors. 2023; 23(6):3225. https://doi.org/10.3390/s23063225
Chicago/Turabian StyleGasparini, Francesca, Alessandra Grossi, Marta Giltri, Katsuhiro Nishinari, and Stefania Bandini. 2023. "Behavior and Task Classification Using Wearable Sensor Data: A Study across Different Ages" Sensors 23, no. 6: 3225. https://doi.org/10.3390/s23063225
APA StyleGasparini, F., Grossi, A., Giltri, M., Nishinari, K., & Bandini, S. (2023). Behavior and Task Classification Using Wearable Sensor Data: A Study across Different Ages. Sensors, 23(6), 3225. https://doi.org/10.3390/s23063225