Article

The Loss-Function of KNL1 Causes Oligospermia and Asthenospermia in Mice by Affecting the Assembly and Separation of the Spindle through Flow Cytometry and Immunofluorescence

1
State Key Laboratory of Genetic Engineering, School of Life Sciences, Fudan University, Shanghai 200000, China
2
Shanghai WeHealth BioMedical Technology Co., Ltd., Shanghai 201318, China
3
NHC Key Laboratory of Birth Defects and Reproductive Health, Chongqing Population and Family Planning Science and Technology Research Institute, Chongqing 404100, China
4
Reproductive Medicine Research Center, Medical Research Institute, Southwest University, Chongqing 400715, China
*
Authors to whom correspondence should be addressed.
These authors contributed equally to this work.
Sensors 2023, 23(5), 2571; https://doi.org/10.3390/s23052571
Submission received: 15 January 2023 / Revised: 13 February 2023 / Accepted: 20 February 2023 / Published: 25 February 2023
(This article belongs to the Special Issue Novel Optical Biosensing Technology)

Abstract

:
KNL1 (kinetochore scaffold 1) has attracted much attention as one of the assembly elements of the outer kinetochore, and the functions of its different domains have been gradually revealed, most of which are associated with cancers, but few links have been made between KNL1 and male fertility. Here, we first linked KNL1 to male reproductive health and the loss-function of KNL1 resulted in oligospermia and asthenospermia in mice (an 86.5% decrease in total sperm number and an 82.4% increase in static sperm number, respectively) through CASA (computer-aided sperm analysis). Moreover, we introduced an ingenious method to pinpoint the abnormal stage in the spermatogenic cycle using flow cytometry combined with immunofluorescence. Results showed that 49.5% haploid sperm was reduced and 53.2% diploid sperm was increased after the function of KNL1 was lost. Spermatocytes arrest was identified at the meiotic prophase I of spermatogenesis, which was induced by the abnormal assembly and separation of the spindle. In conclusion, we established an association between KNL1 and male fertility, providing a guide for future genetic counseling regarding oligospermia and asthenospermia, and a powerful method for further exploring spermatogenic dysfunction by utilizing flow cytometry and immunofluorescence.

1. Introduction

For eukaryotic cells, the process of accurate chromosome separation is described as a delicate instrument that each slight error may cause dysregulation of cell proliferation or even disease phenotype [1,2,3,4]. The kinetochore is a macromolecular protein complex that assembles at centromeres and connects to spindle microtubules [5,6,7]. It also performs several indispensable functions in the cell-division process by linking the centromere and microtubule, providing a platform for the spindle assembly checkpoint (SAC) protein [8,9,10,11]. More than 100 kinetochore proteins from yeast to mammalian cells have been identified [8]. The study of kinetochore compositions is significant and necessary to shed light on this intriguing complex in multiple fields concerning functions, evolutions, and diseases.
KNL1 (also known as CASC5, D40, Blinkin) [12] is one important member required for genomic stability in eukaryotes in the conserved KMN network (KNL1 complex, NDC80 complex, Mis12 complex), constituting the core microtubule-binding site at the kinetochore [13,14,15]. KNL1 regulates cells by coordinating multiple protein–protein interactions through different domains on its protein structure [16]. At the N terminal of KNL1, the KI motif interacts with the Bub complex via TPR domains [17]. At the C terminal, the predicted coiled-coil domain and RWD repeats domain binds to Zwint1 and Mis12, respectively, which are required to associate with the inner kinetochore [18]. As functions of KNL1 complex domains were subsequently revealed [19,20,21], researchers have focused on the link between them and diseases. Defects in KNL1 function have been implicated in genome instability, leukemia, microcephaly, and colorectal cancer [22,23,24,25]. Recently, Wei et al. [26] proved that KNL1 stabilized SAC to ensure timely anaphase entry and accurate chromosome segregation during oocyte meiotic maturation, which stimulated our curiosity about the function of this gene in reproduction. Male reproductive health research is still a hot topic, but there is no association found between KNL1 and male reproduction at the present stage.
Flow cytometry (FCM) is well known for its traits of enabling multi-parameters and rapid quantitative analysis of single cells or other biological particles, and it is widely used in the medical field [27,28,29]. The use of FCM in sperm detection has a long history (Table 1); however, we found that the established methods were based on FCM combined with different fluorescent dyes to detect, which has high requirements for instruments and antibodies. In addition, researchers mainly focused on the abnormal morphology and biochemical indicators of sperm. Less research has focused on cell cycles. Miki et al. detected the obvious differences in the composition of haploid, diploid, and tetraploid cells in spermatogenesis and found additional cell groups in the experiment group by using flow cytometry, but they did not state the problem stages specifically [30]. In this point, we converted the dye-staining signal used for FCM into an immunofluorescence (IF) signal that could be observed by microscopy used for the detection and localization of a wide variety of antigens [31], such as GFRα1, PLZF, C-kit, STRA8, γH2AX, and Sycp3, in the case of single-dye FCM detection to further determine the specific stage of the spermatogenesis cycle.
Here, we first found that the loss of KNL1 caused oligospermia and asthenia in mice and detected the abnormal composition of different ploidy sperm cells by FCM. The knockout of KNL1 could lead to a decrease in the immunofluorescence signal of GFRα1, PLZF, γH2AX, and Sycp3 by employing IF staining, which means the spermatocytes arrested at the meiotic prophase I of spermatogenesis. Moreover, the spindle was unable to maintain its polarity and alignment correctly in spermatocytes in GC-2 cells, which resulted in the assembly separation of the spindle and confirmed that the method of FCM plus IF was useful in detecting the periodic location of spermatogenesis problems. In a word, our study not only provides a powerful method for spermatogenic dysfunction by FCM and IF but also exposes the relationship between KNL1 and reproductive development, which helps to determine genotypic–phenotypic associations as well as improve the diagnosis rate of male infertility.

2. Materials and Methods

2.1. Cell Lines and Cell Culture

GC-2 (CEMC, Sydney NSW, Australia) cells were purchased from the Center for Excellence in Molecular Cells Science and cultured in DMEM (ThermoFisher, Waltham, MA, USA) supplemented with 10% Fetal Bovine Serum (Gibco, Grand Island, Australia) and 1% Penicillin-Streptomycin Solution (Gibco, Grand Island, Australia). All cells used in experiments were cultured at 37 °C in a 5% CO2 incubator.

2.2. Mice Culture

Sexually mature male ICR mice (more than four weeks old) were purchased from Charles River Laboratory Animal Technology CO., Ltd. (Wilmington, MA, USA) The mice were placed in a specific pathogen-free animal room under controlled conditions (temperature, 25 ± 2 °C, humidity (50–60%), and a 12/12 h light/dark cycle. All mice were acclimated to the culture environment for at least one week before formal experiments. After the completion of the operation, the mice were executed after two spermatogenic processes, and the subsequent experiments continued on the mice.

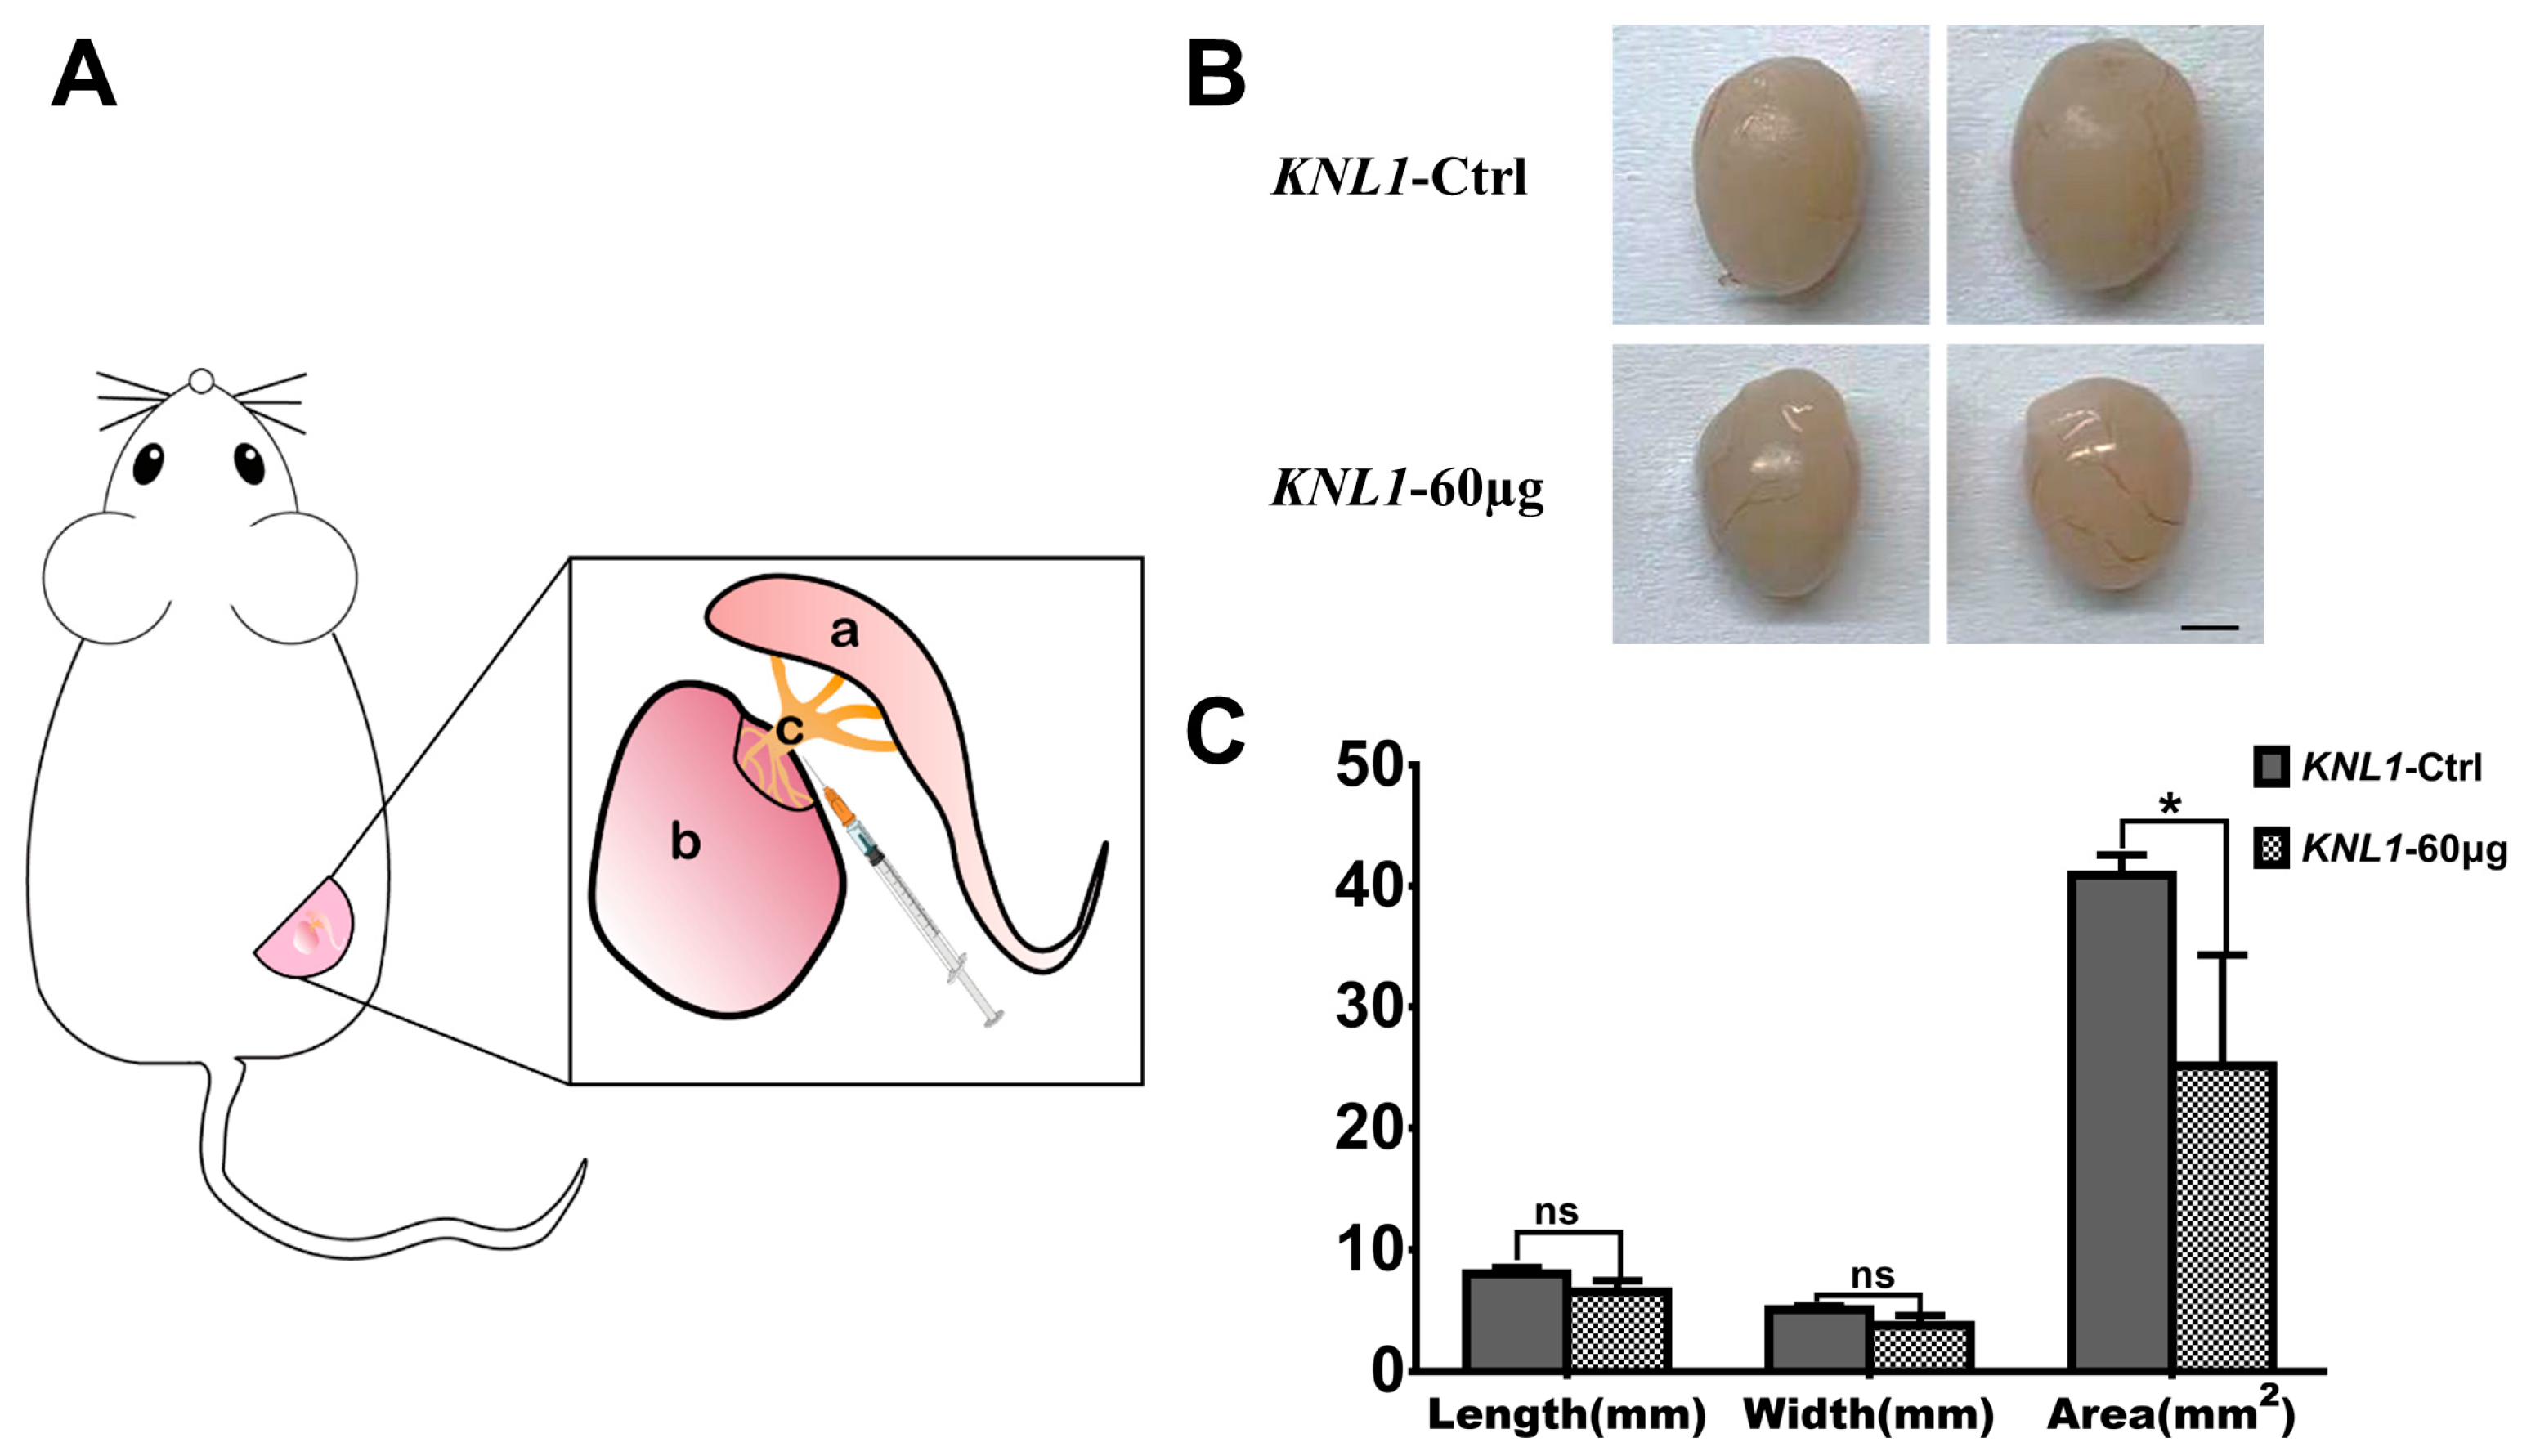
2.3. Seminiferous Tubule Injection Experiment

ICR Mice were anesthetized by intraperitoneal injection (sodium pentobarbital). On the microoperation table, the reproductive organs were exposed with surgical scissors and surgical tweeds, and KNL1 siRNA (60 µg) mixed with Entranster in vivo (Engreen Biosystem, Beijing, China) solution, added with bromophenol blue as an indicator, was injected into the seminiferous tubules of the mice. After completion of the operation, the wounds of the mice were sutured.

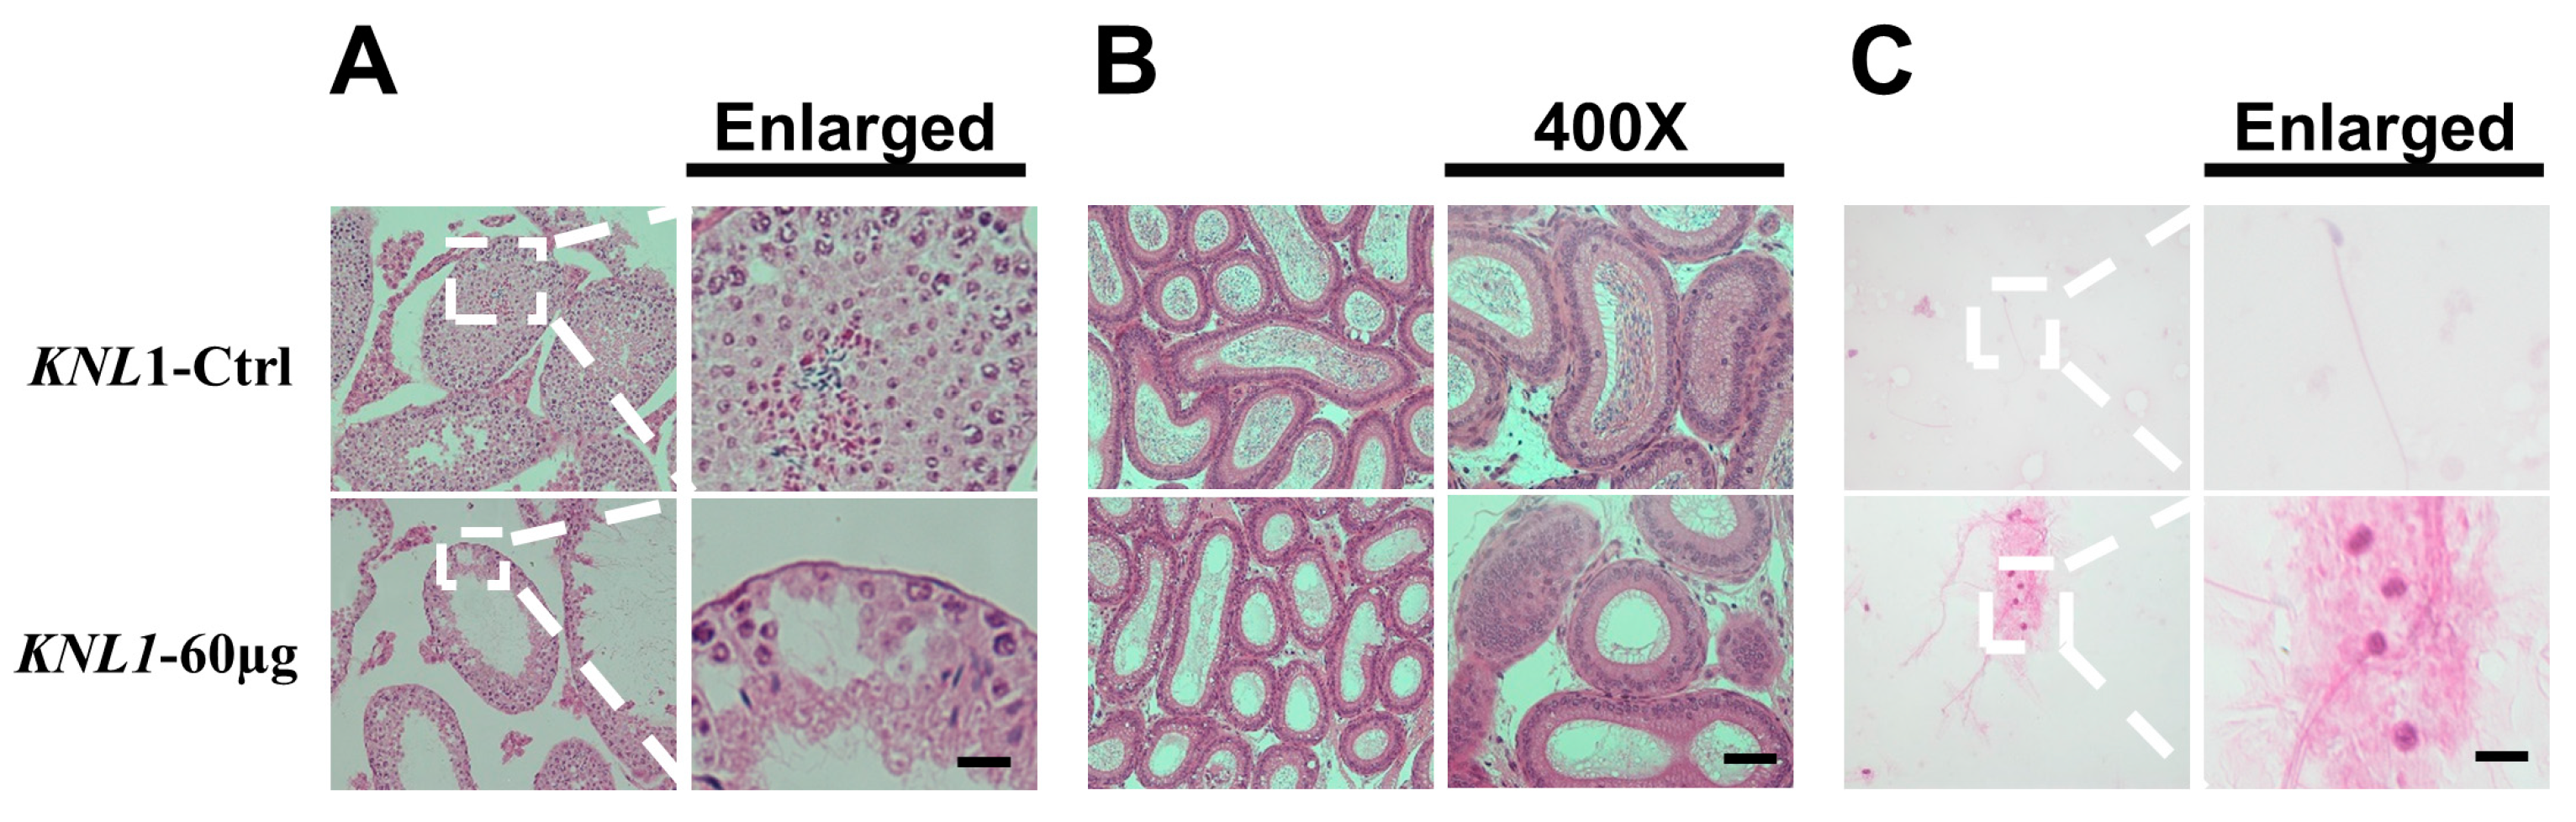
2.4. Sample Processing for HE Staining and CASA

After two spermatogenic cycles, mice were executed and testes were removed for the first recording of phenotypic data such as length, width, and surface area. The testis and epididymis were collected and placed in a fixative solution, sectioned, and stained with HE.
The epididymis was collected and cut, and the sperm was extruded by gently squeezing the epididymis with ophthalmic forceps. Then, the mixture was incubated at 37 °C, 5% CO2, and saturated humidity for 20 min. After the semen was completely liquefied, the mixture was evenly added to the corresponding counting board for detection for CASA detection (Hamilton Thorne, Beverly, MA, USA, TVOS) using the following parameters: VCL cutoff of 36 M/s, VSL cutoff of 5 µm/s, VAP cutoff of 20 µm, progressive minimum PR cutoff of 32%. At least 200 sperm were analyzed, and the results of the two analyses passed the statistical 95% CI. The remaining testes and epididymis tissues, which were left over after the experiment above, were frozen at −20 °C.

2.5. Flow Cytometry Experiment

The testis was dissected out, precooled, and washed once with 1X PBS (Solarbio, Beijing, China). We removed the tunica albuginea of the testis and fully cut up testicular tissue into the EP tube. Type II collagenase (Life-iLab, Shanghai, China) was added in 1 mL DMEM/F12 to a final concentration of 1.5 mg/mL, and the chopped testicular tissue was transferred to 37 °C and digested with 50 r/min shaking for 20 min. Then, the supernatant was removed by centrifugation at 1500 r/min for 5 min. Type II collagenase and hyaluronidase (MERK, Kenilworth, NJ, USA) were added to 0.5% trypsin to a final concentration of 1.5 mg/mL. We added 500 µL to resuspend cell mass and digested for 20–30 min at 37 °C with shaking at 150 r/min. Digestion was terminated by adding 500 µL DMEM/F12 and centrifuging at 1500 r/min for 5 min to remove the supernatant. We added 500 µL PBS (containing RNaseA (50 µg/mL)) and incubated at 37 °C for 30 min, and centrifuged at 1500 r/min for 5 min to remove the supernatant. The samples were washed once with PBS and centrifuged at 1500 r/min for 5 min to remove the supernatant.
The working mixture of Tritonx-100 + PI (biosharp, Shanghai, China) was added: PI to the final concentration of 50 µg/mL, Tritonx-100 (Sigma-Aldrich, Saint Louis, MO, USA) to the final concentration of 0.03%, and cells were drilled and stained for 10 min at room temperature in the dark. After all the treatment, the mixture was filtered with a 200 mesh filter and test on the machine.

2.6. TUNEL and PNA Method

The mice were killed by cervical dislocation, and the needed testicular tissue was removed and cut into a small piece 2–3 mm thick to facilitate the penetration of the fixative. The cut testicular tissue was washed with 1X PBS, fixed in the testicular tissue fixation fluid (Servicebio, Wuhan, China), and sent to the Servicebio Company (Wuhan, China) for TUNEL and PNA detection.

2.7. Immunofluorescence Staining

The sections or cell slides were washed with 1X PBS. They were fixed with 4% paraformaldehyde (Solarbio, Beijing, China) for 30 min at room temperature and washed three times with 1X PBS for 3 min each time. Membranes were permeabilized with Triton X-100 for 30 min at room temperature and washed three times with PBS for 3 min each. The cells were blocked overnight at 4 °C in 3% BSA (Solarbio, Beijing, China). The primary antibody was diluted, incubated at 37 °C for 1 h, and washed three times with 1X PBS for 5 min each time. The secondary antibody was diluted, incubated at 37 °C for 1 h, and washed three times with PBS for 5 min each time. Nuclear staining was performed with DAPI (Beyotime, Shanghai, China) and observed with an Olympus FV 3000.

2.8. siRNA Transfection and Synchronization

The cells were seeded into six-well plates a day earlier to maintain a cell density of 60%–80%. Then, 125 μL DMEM medium without antibiotics and serum was added to the EP tubes, followed by 100 pmol siRNA, blowing and mixing, then 4 μL Lipo8000™ (Beyotime, Shanghai, China) transfection reagent was added, blowing and mixing to mix well, and placed at room temperature for 20 min. Drops were added to six-well plates for cellular siRNA interference. Some cells were used for qRT-PCR to detect the efficiency of KNL1 interference. For synchronization, after 16 h of interference in the above siRNA interference, the cells were cultured with 10 mM thymidine (Tsbiochem, Shanghai, China) for 16 h. Then, we released the thymidine to replace the medium as new and the immunofluorescence observation was performed 10 h later.

2.9. siRNA Sequence and Immunofluorescence Antibody

The siRNA sequence used in the cell interference experiment is Mus-siKNL1(5′–3′: UCGAGUCAGCUUUGCAGAUACUAUA) ordered from GENEray Biotechnology. The qRT-PCR sequence used in the experiment is KNL1-F: CAAAACCGAAAACTGCAGGGC; KNL1-R: TTTGGCTCAAGACAGCTTACC. The immunofluorescence antibody in the experiment was shown in the Supplement data Table S1.

3. Results

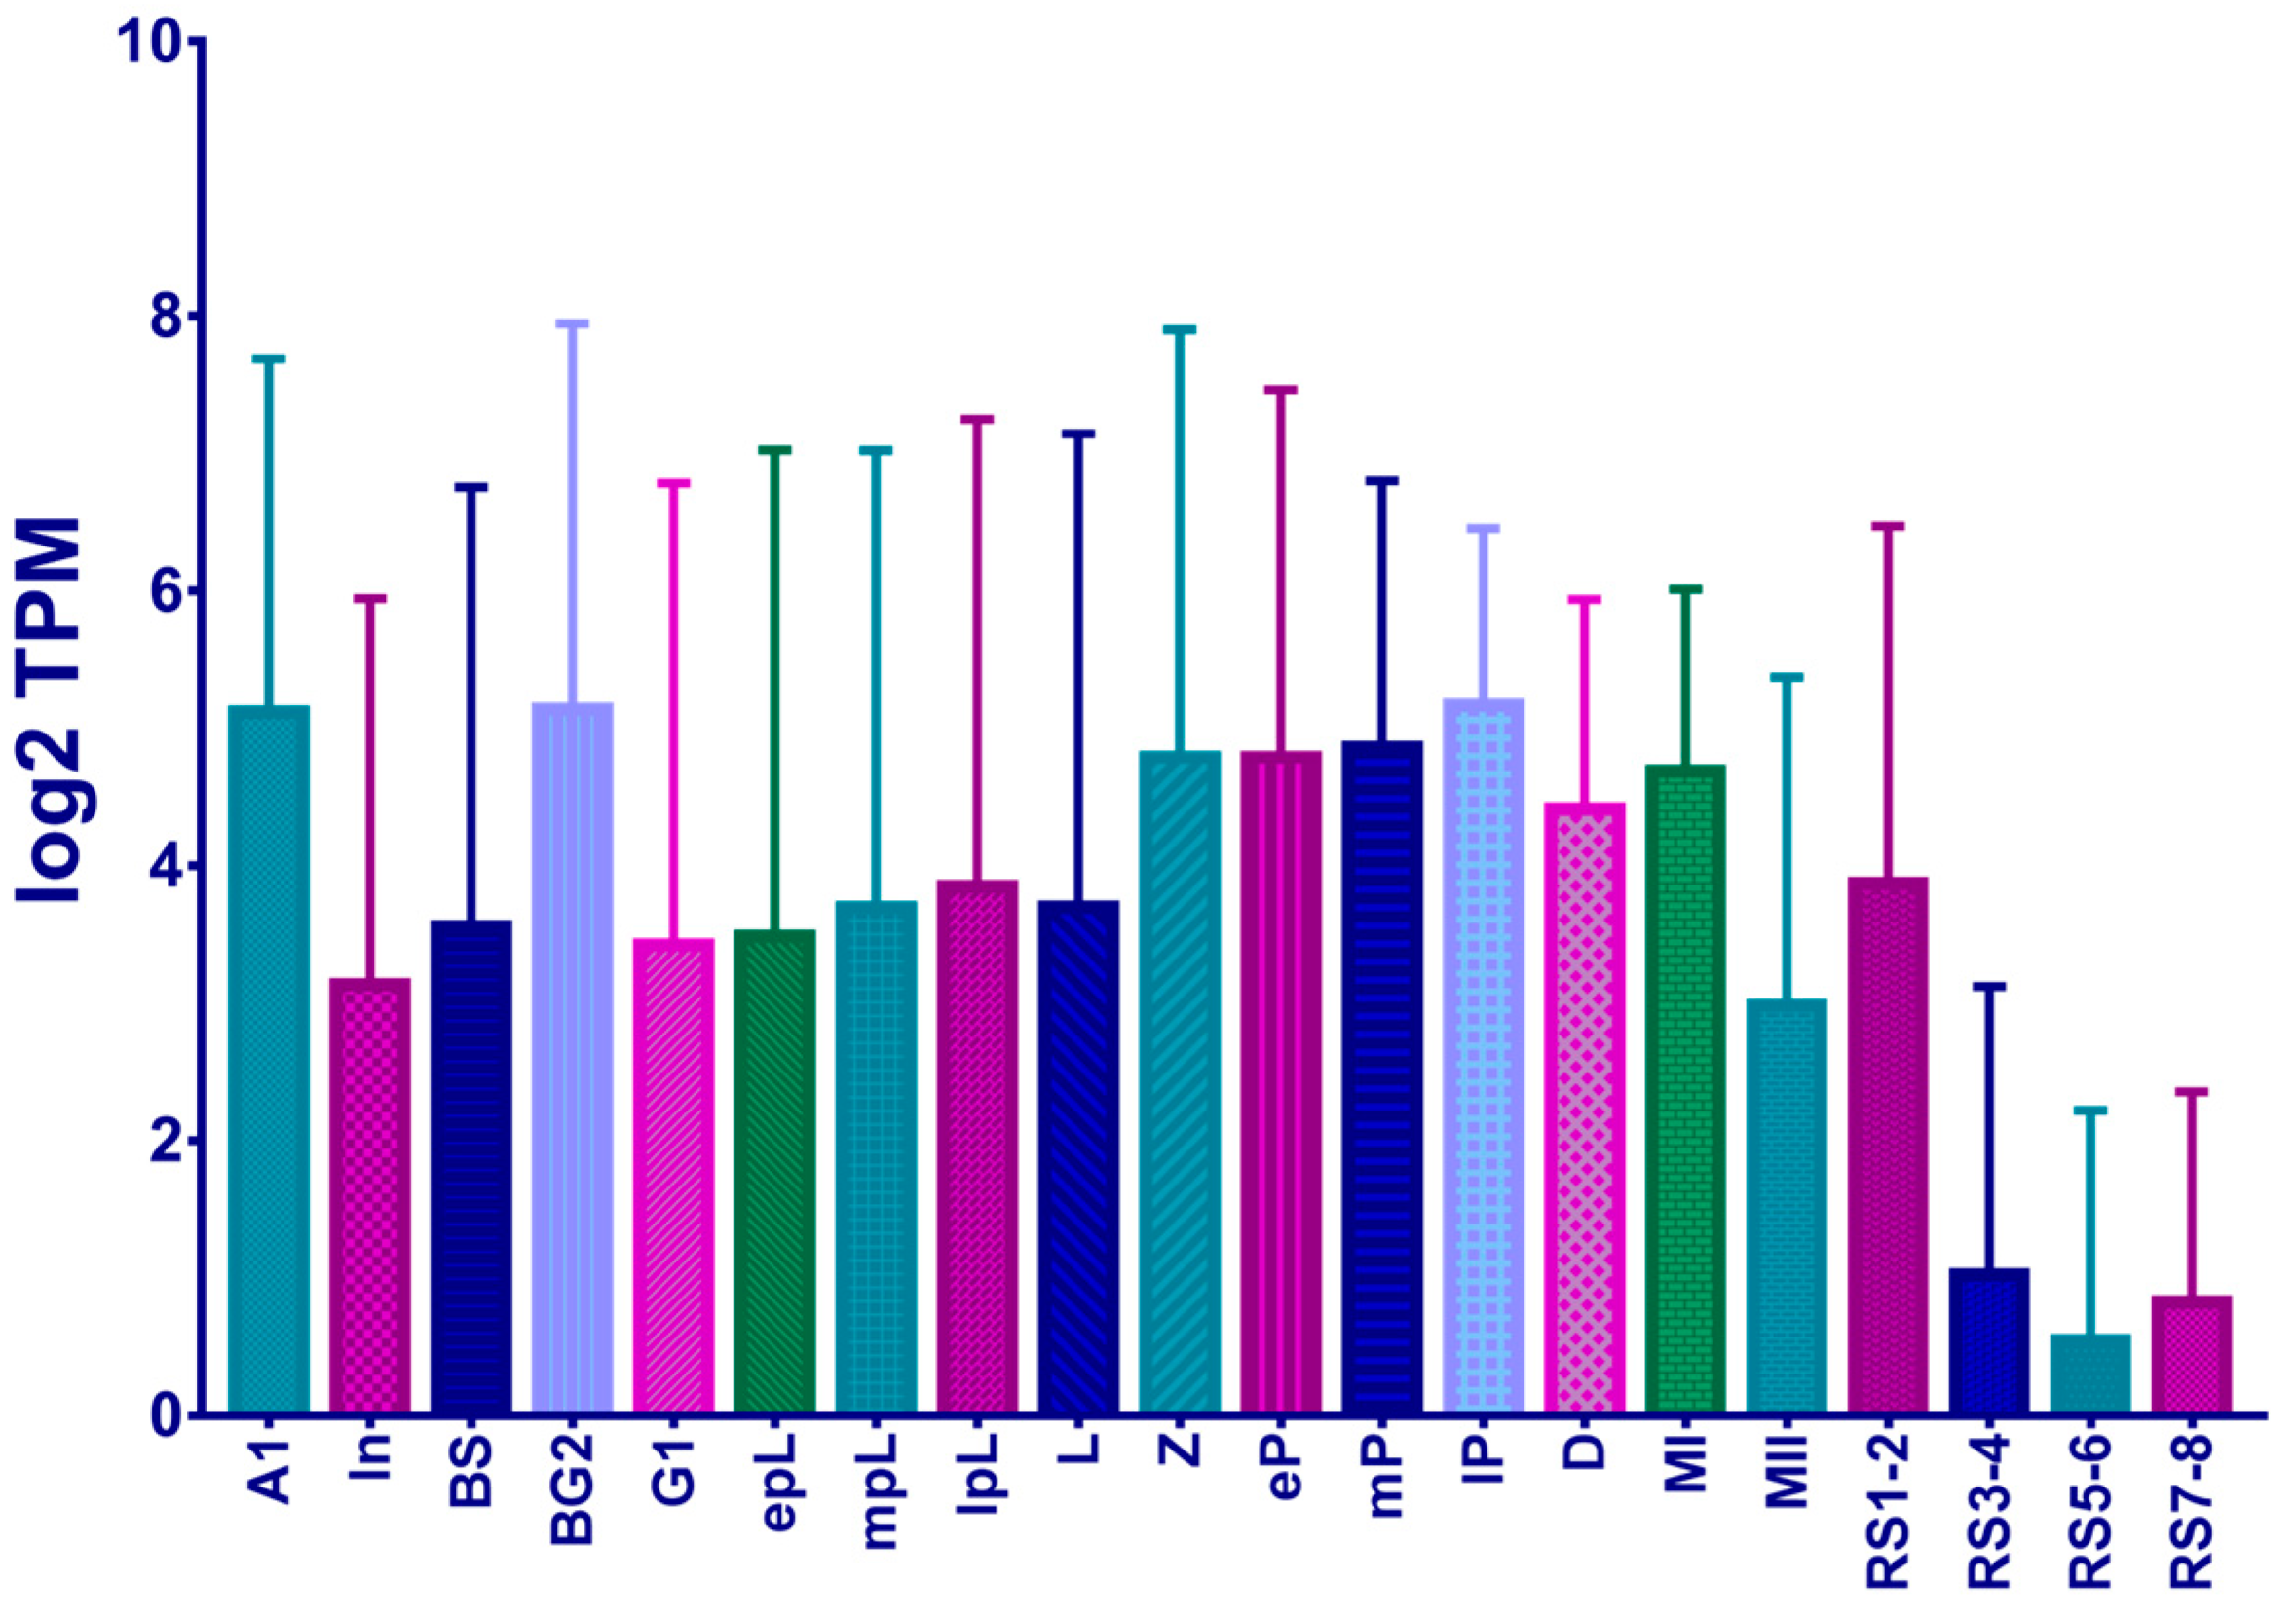
3.1. The Loss-Function of the KNL1 Gene Influences Male Reproductive Phenotype in Mice

We extracted the expression of the KNL1 gene from the single-cell RNA-seq data database provided by Tong’s team, which uncovered dynamic processes in mouse spermatogenesis, revealing extensive and previously uncharacterized dynamic processes and molecular markers in gene expression [37]. Interestingly, we found that the gene KNL1 expression is extremely high during spermatogenesis (Figure 1), implicating that the KNL1 gene might play an important role in spermatogenesis.
We exposed the testis to injected siRNA (60 µg) in seminiferous tubules of ICR mice to influence the KNL1 expression in the testis (Figure 2A). After two whole spermatogenic cycles, we executed mice that received no interference (KNL1-Ctrl mice) and KNL1 experiment mice (KNL1-60 µg mice) to test different phenotype indicators. We found that in KNL1-60 µg mice, the size of the testis tended to decrease a little compared to KNL1-Ctrl mice (Figure 2B,C).
The HE staining section of the testis, testicular biopsy, and sperm between KNL1-Ctrl mice and KNL1-60 µg mice revealed changes in phenotypic characteristics. The testicular biopsy showed the defect of germ cell development in KNL1-60 µg mice compared to KNL1-Ctrl mice (Figure 3A). It was obvious that KNL1-Ctrl mice testis sections showed normal cell populations within the seminiferous epithelium, whereas germ cells lost most of the important developmentally relevant cells in KNL1-60 µg mice testis. Similarly, in the epididymal, HE staining section (Figure 3B), a marked decrease in sperm count was observed in KNL1-60 µg mice. Dramatically, the KNL1-60 µg mice had no mature spermatozoa or round spermatozoa compared with KNL1-Ctrl mice (Figure 3C).

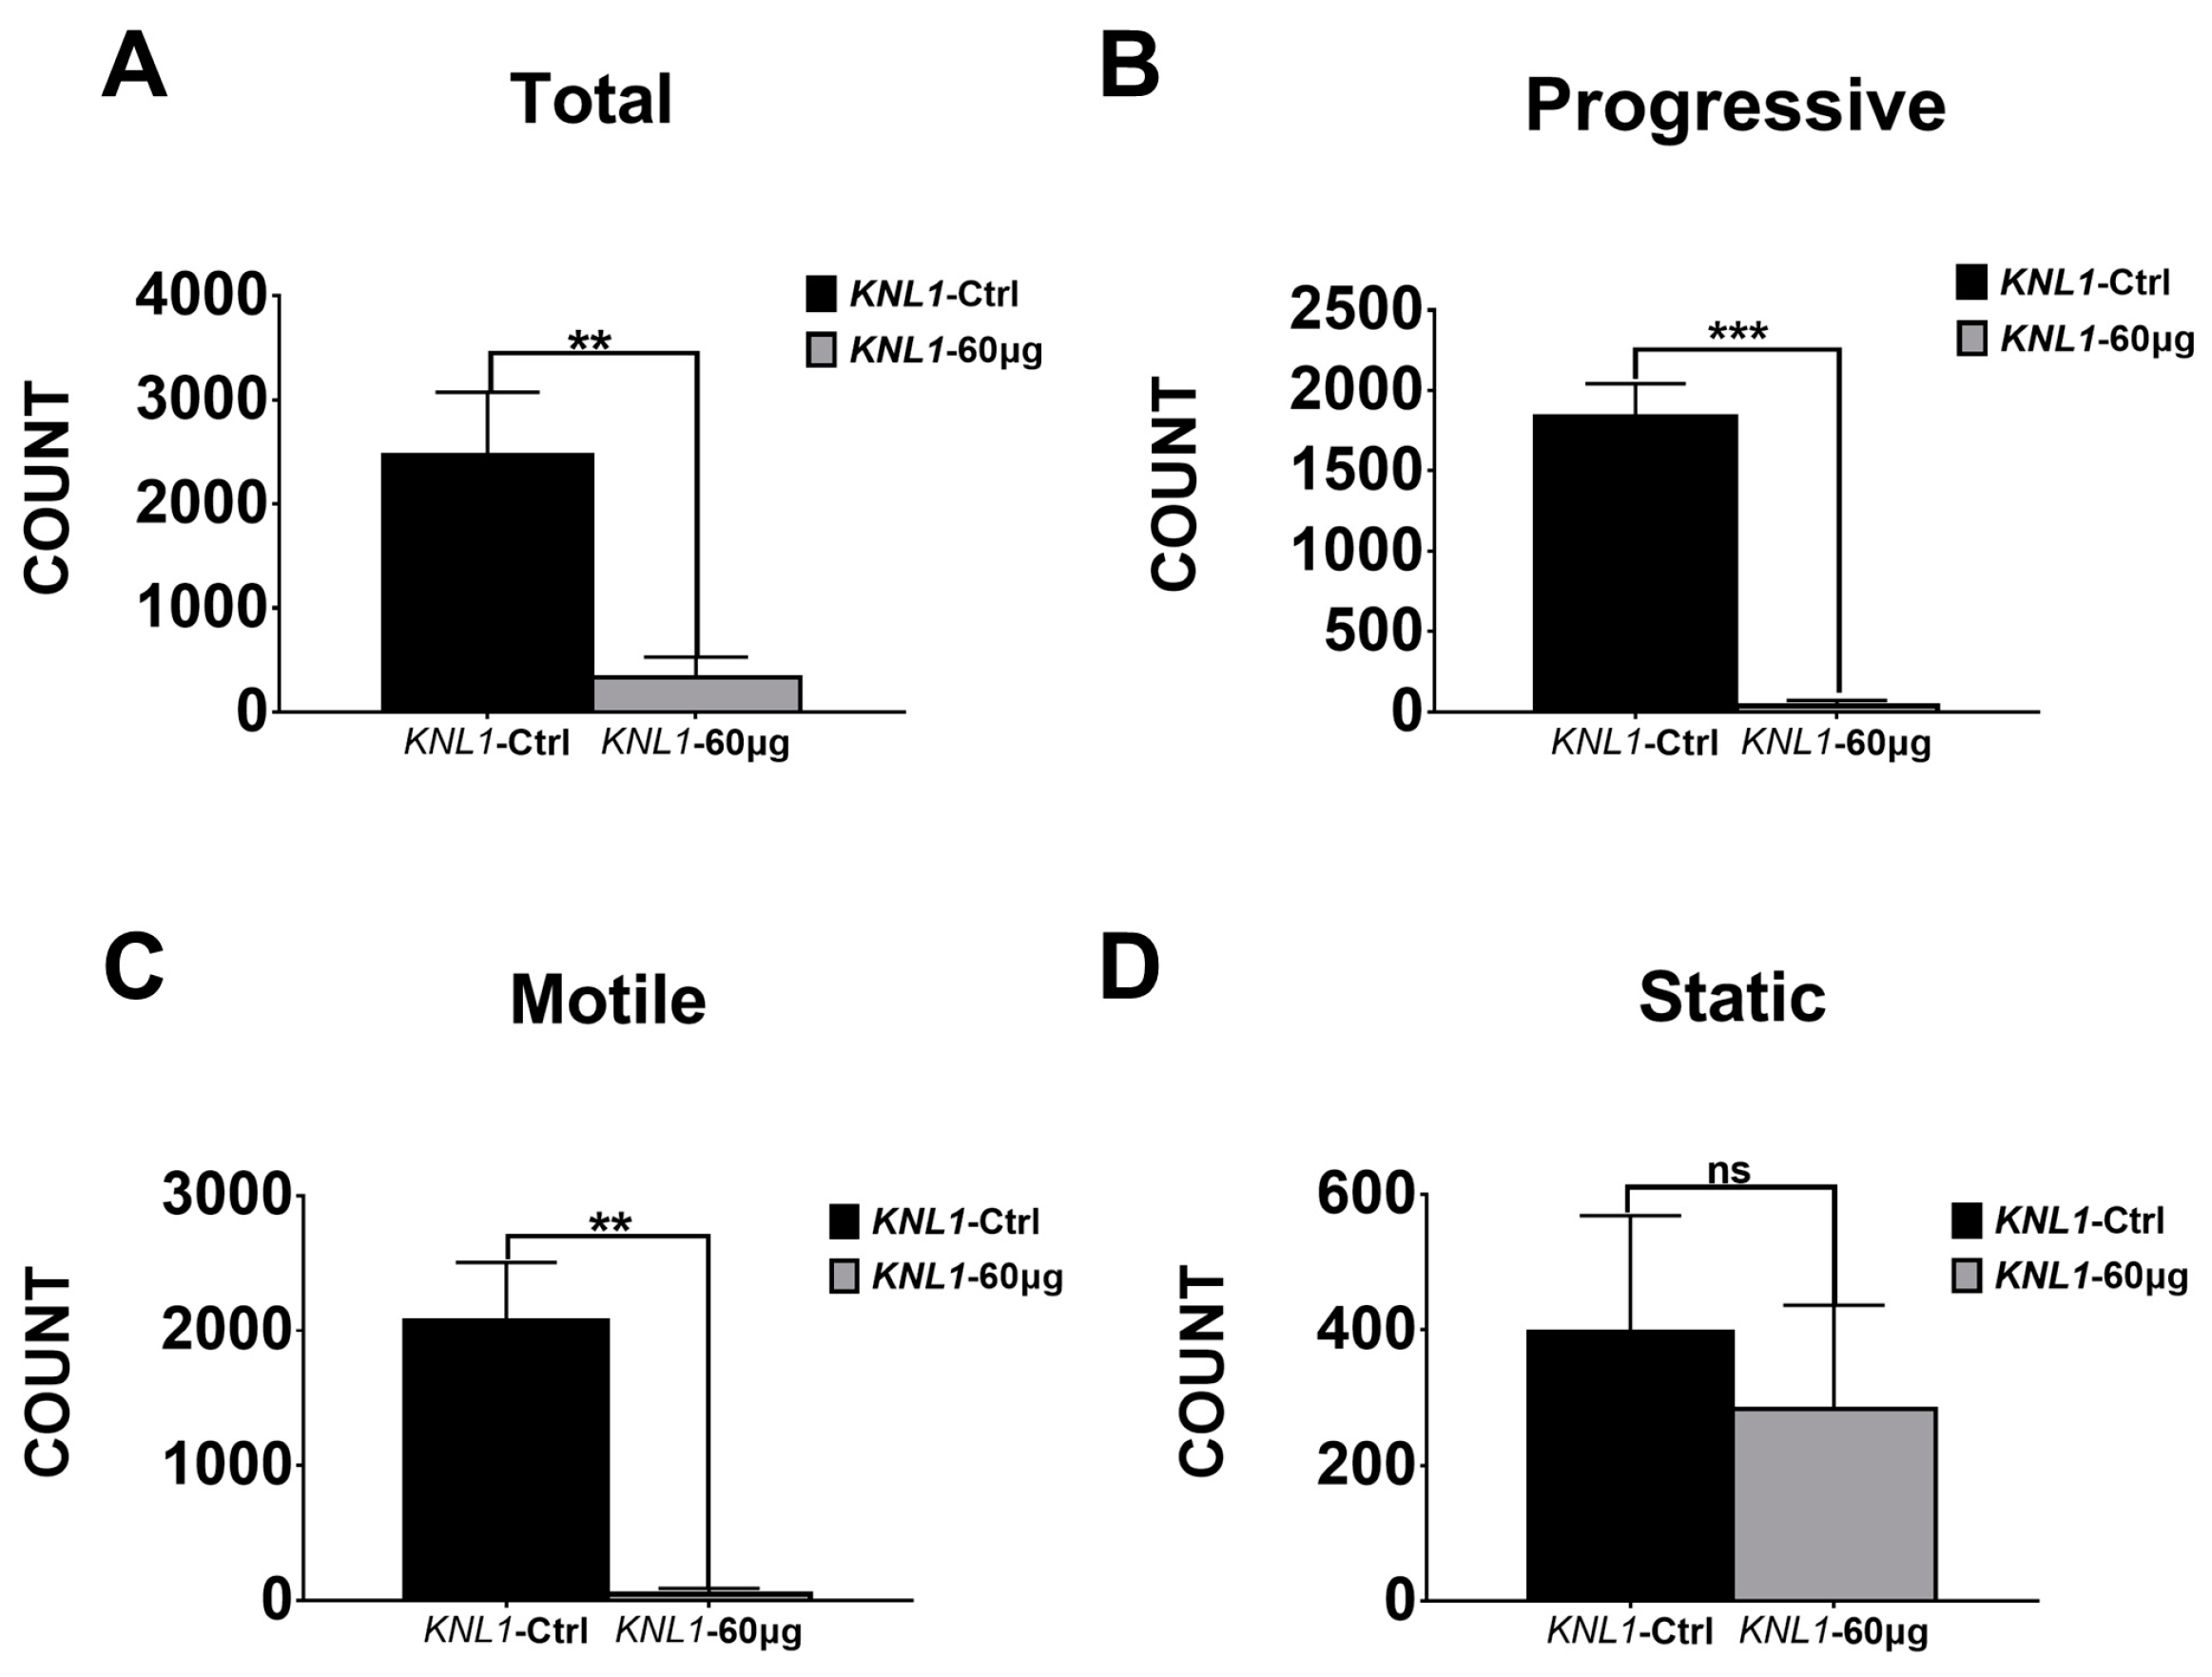
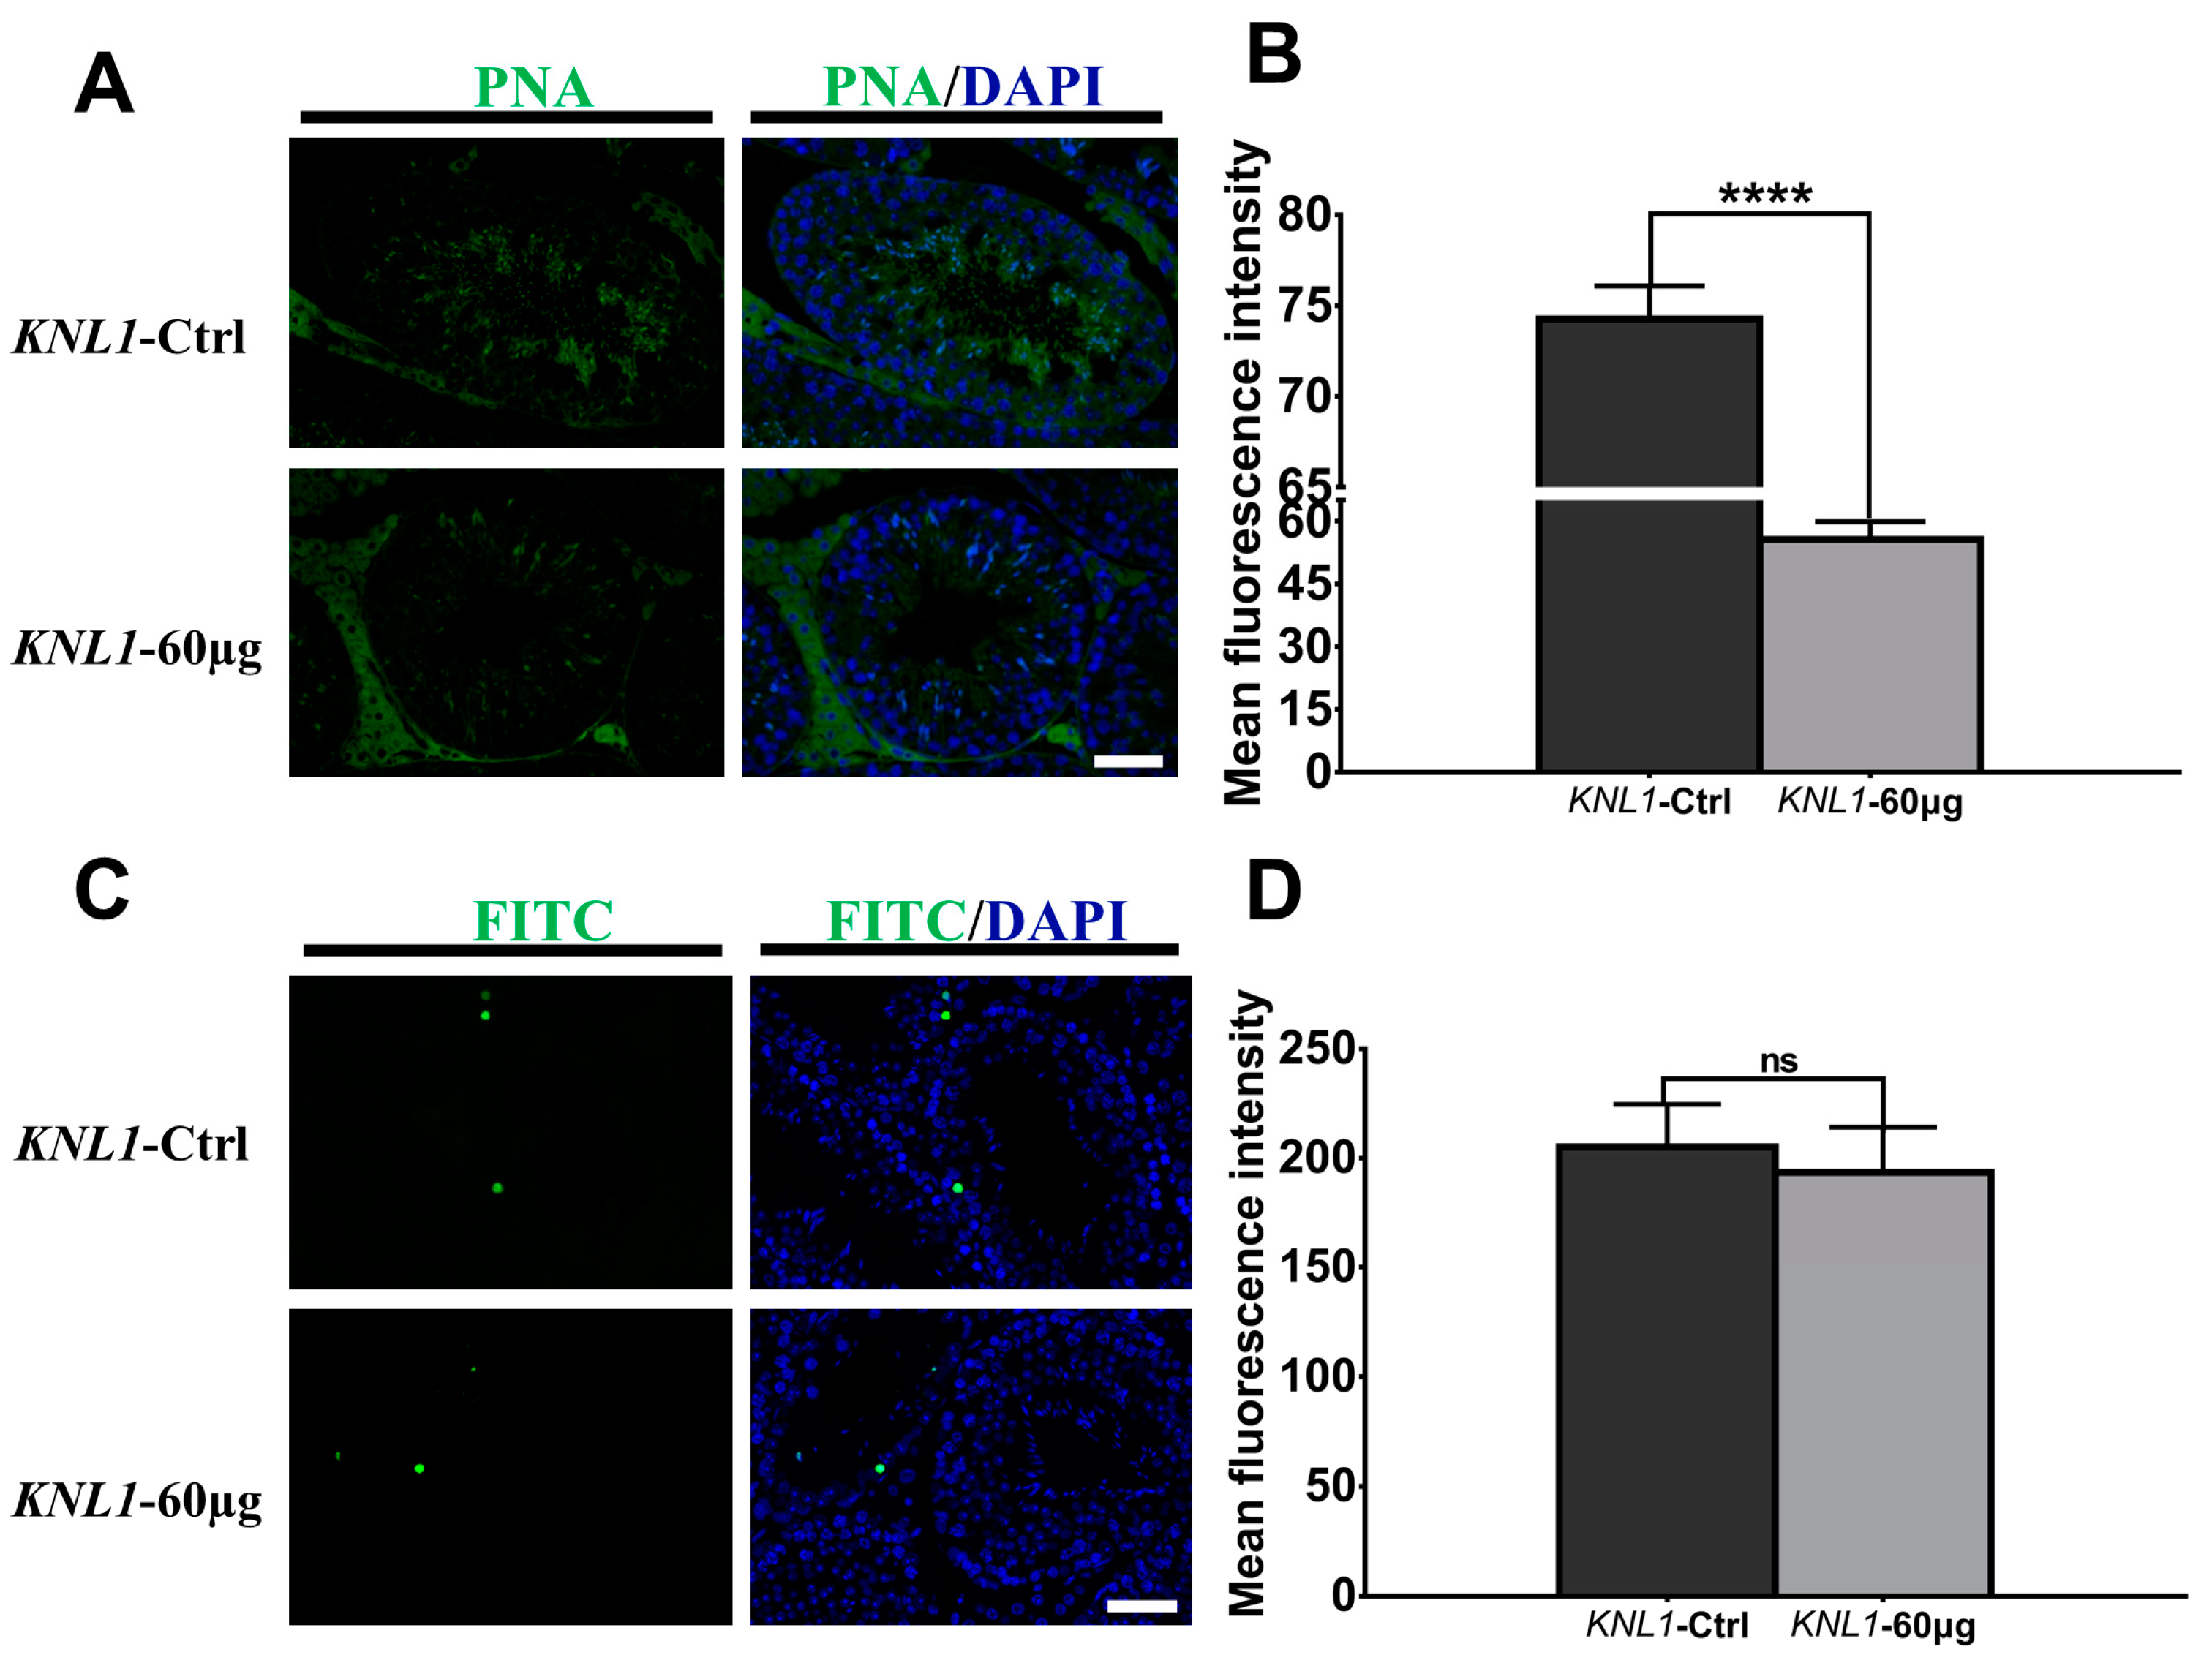
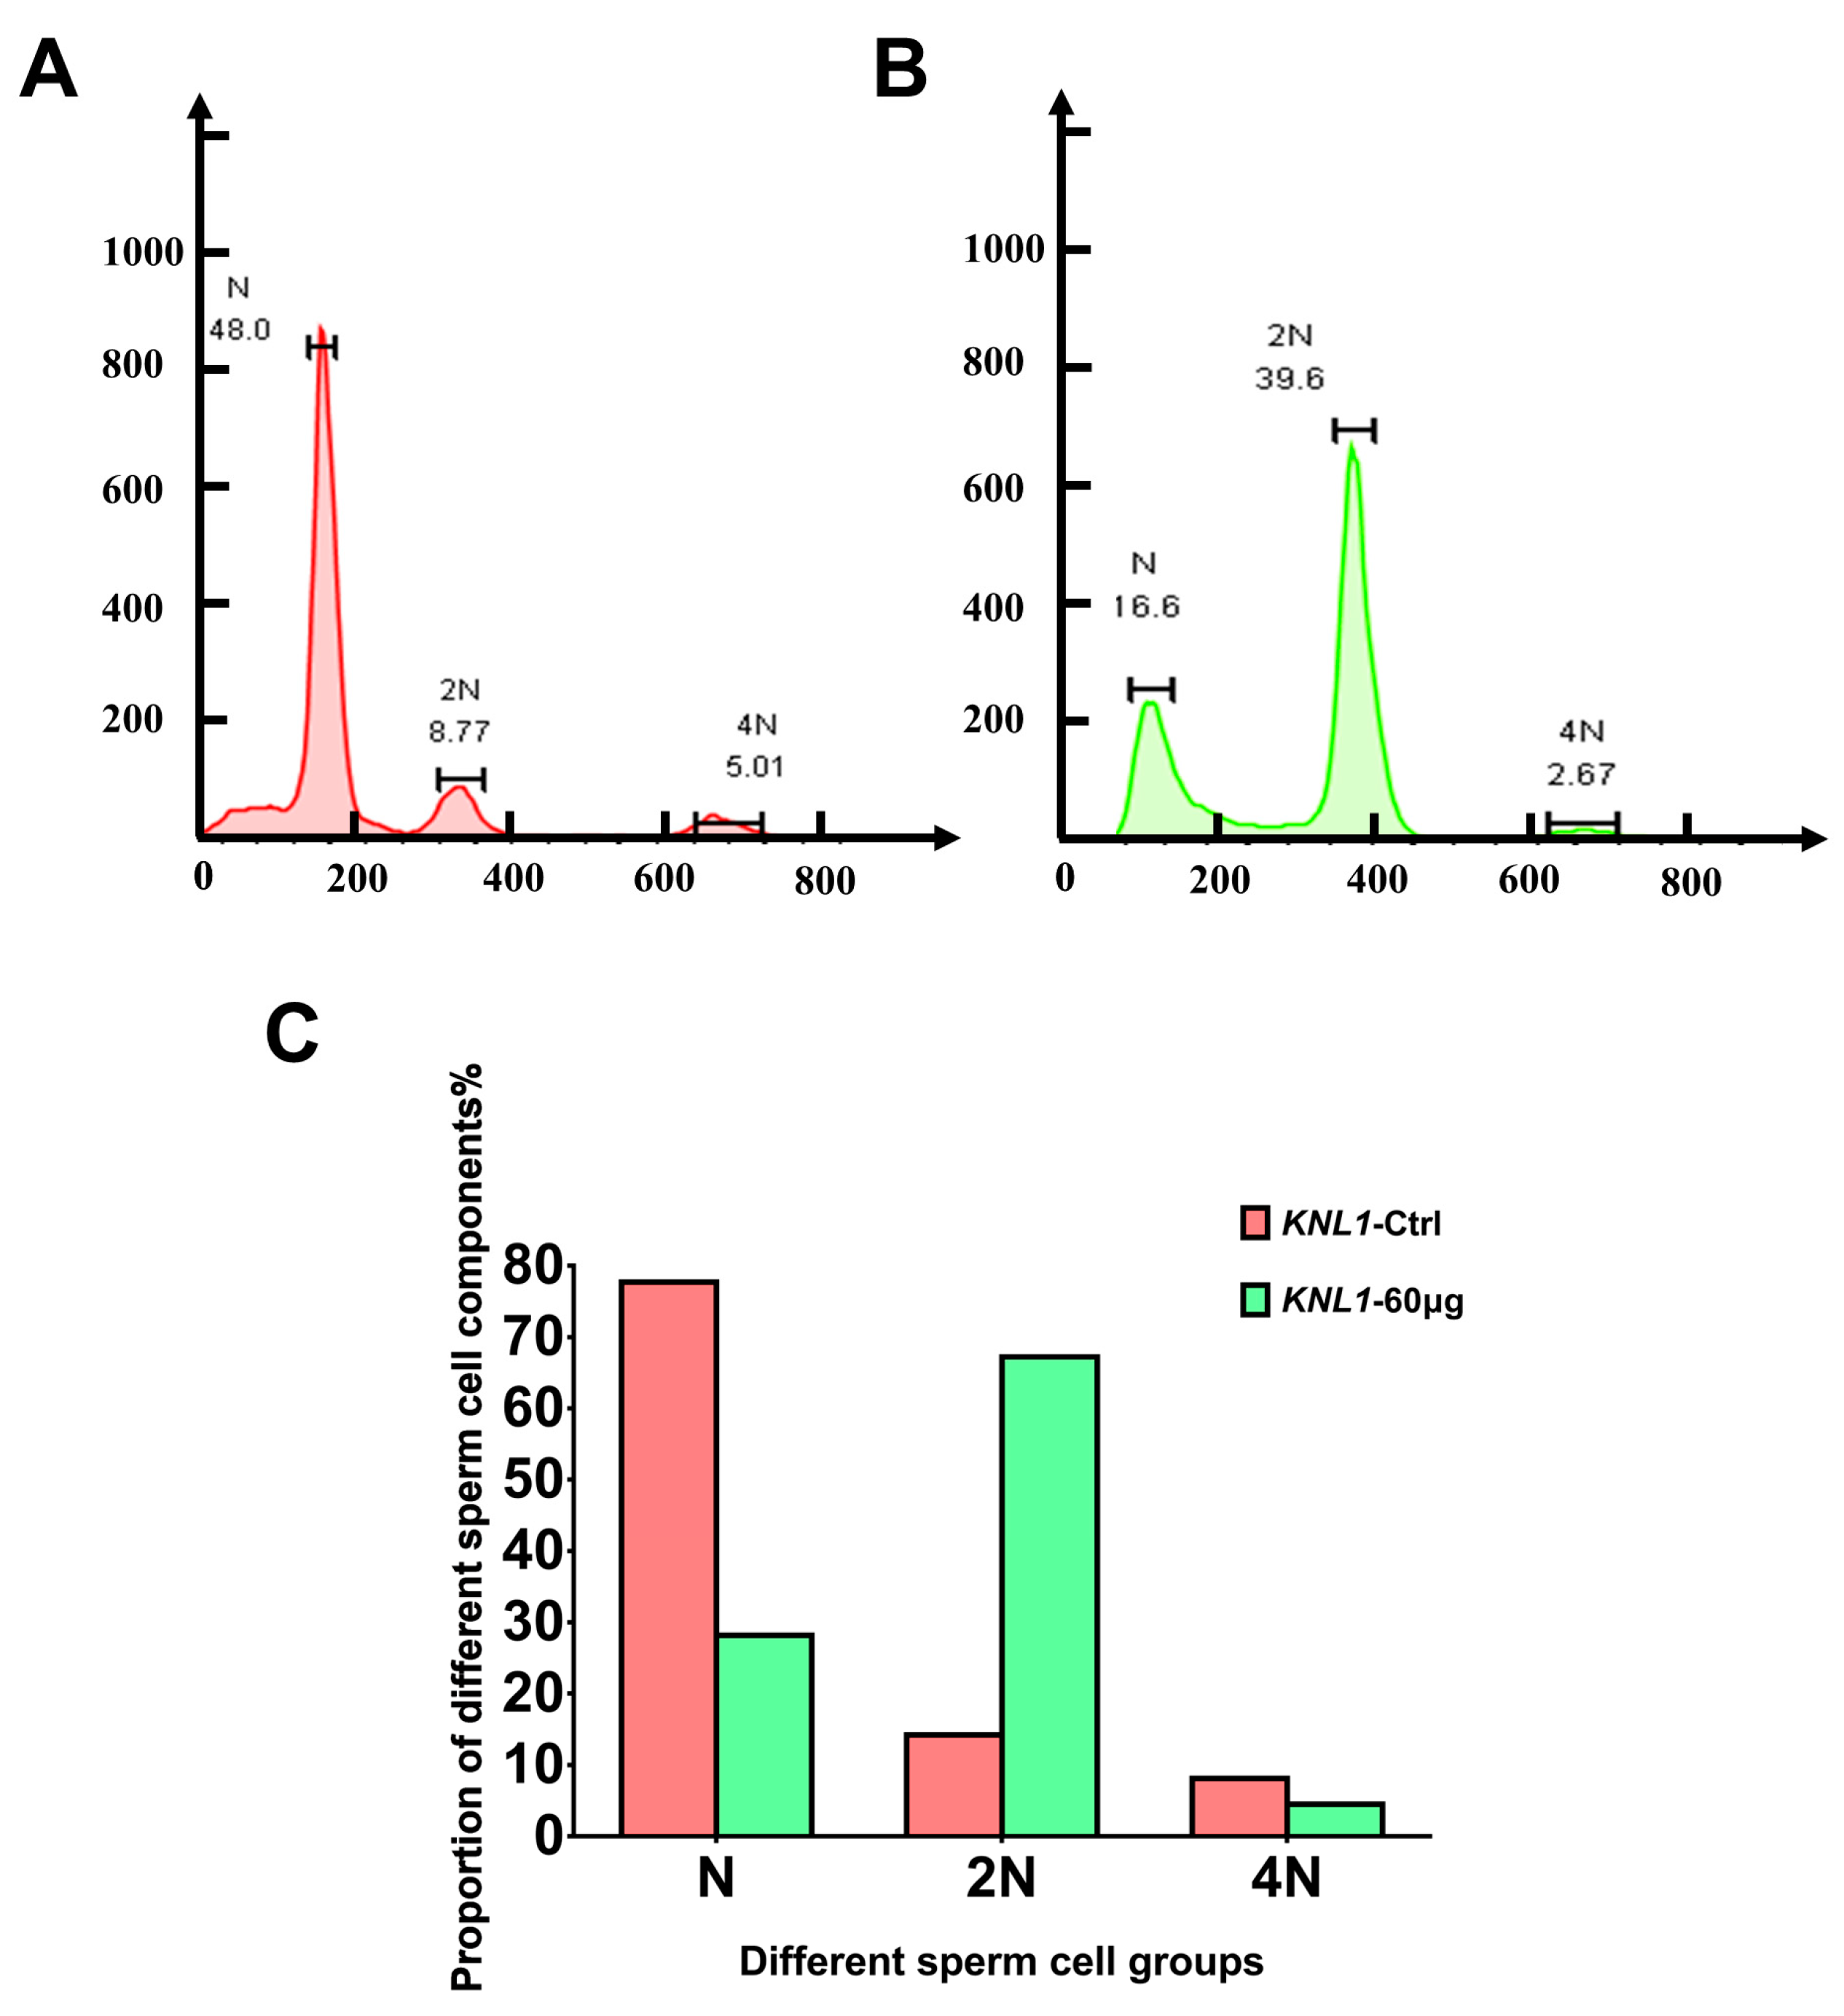
3.2. The Loss-Function of the KNL1 Gene Results in Oligospermia and Asthenospermia in Mice

For further research, we sought to test sperm motility by CASA (computer-aided sperm analysis) detection. The mice CASA result showed the sperm count had a significant decrease in the total count, progressiveness, and motility in the KNL1-60 µg mice (Table 2 and Figure 4A). Although there was no significant difference in the absolute number of static sperm between the two groups (Table 3, Figure 4A,B), there was also a significant increase in percentage (relative to total sperm count), which was harmful to their breeding in the future.
All of these parameters were consistent with the diagnostic criteria for asthenospermia and oligospermia. Thus, it could be summarized the loss-function of KNL1 leads to oligospermia and azoospermia in mice and cause harm to male reproduction.

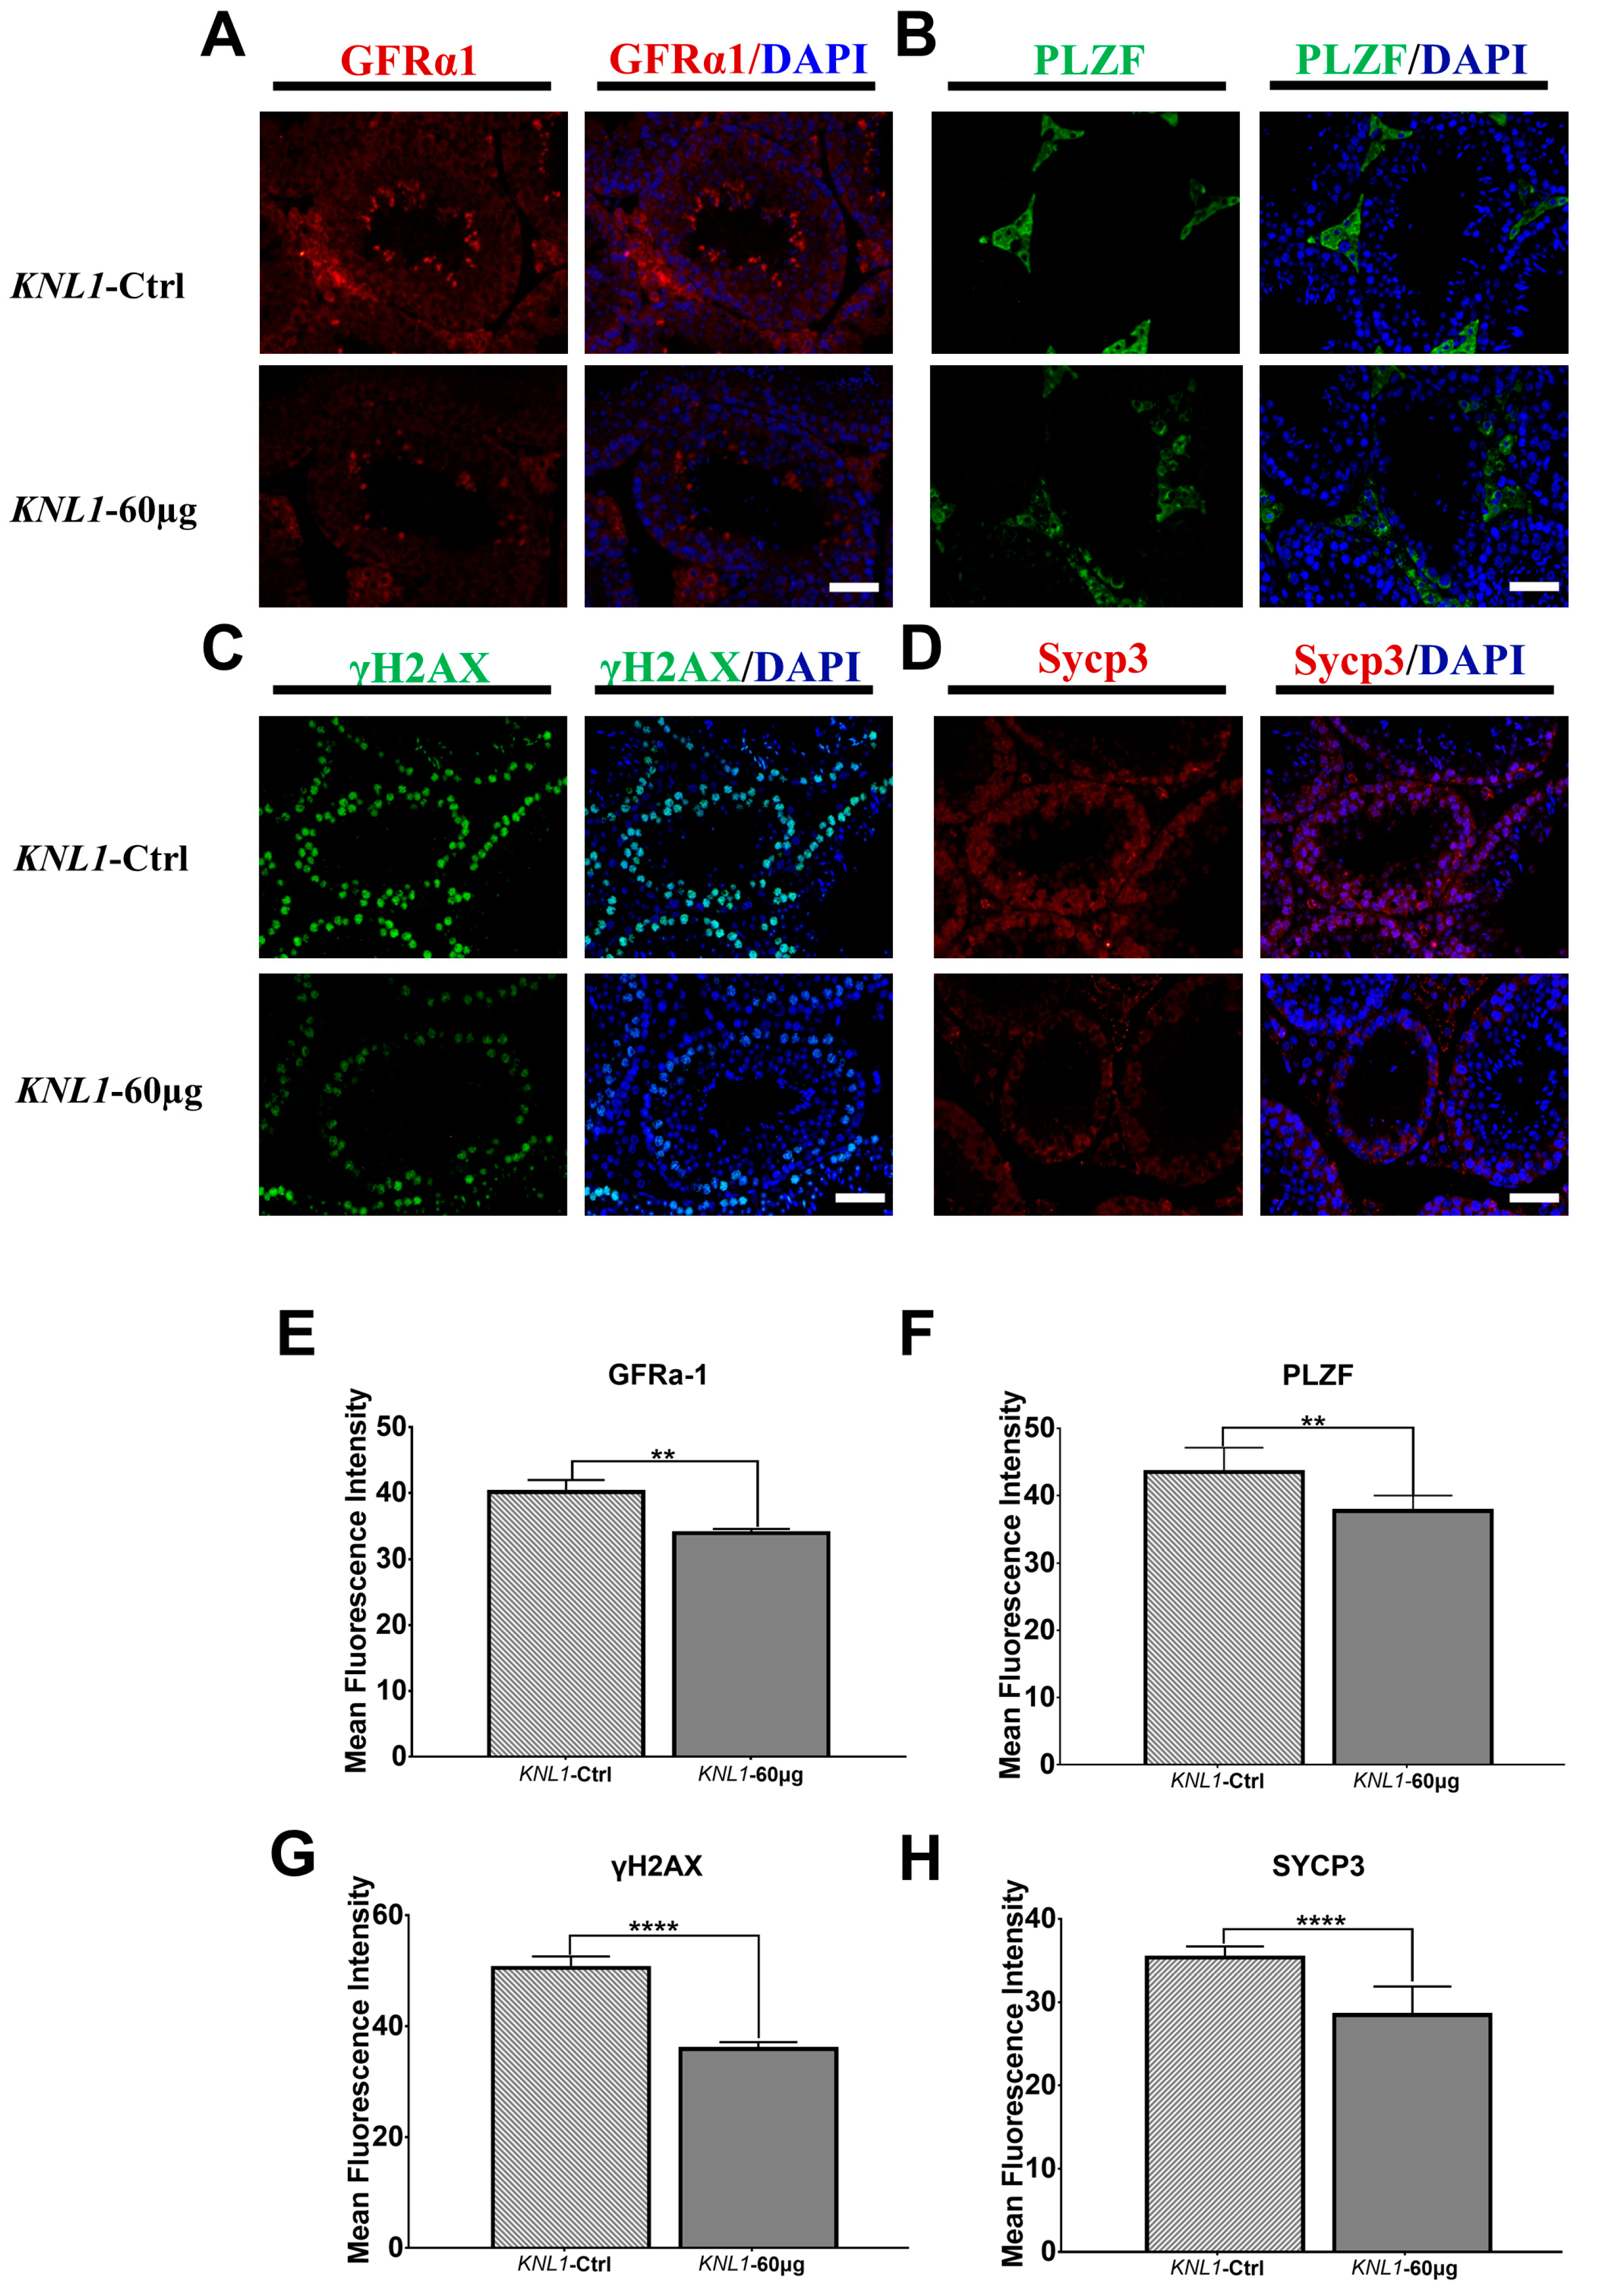
3.3. Loss-Function of KNL1 Causes Spermatocytes Arrest at the Meiotic Prophase I of Spermatogenesis

The above results showed a significant decrease in sperm count and quality. We examined the integrity of sperm acrosomes by detecting peanut lectin (PNA, Figure 5A,B) and the results showed that the integrity of KNL1-60 µg mice sperm acrosome was significantly reduced. Next, we performed the TUNEL experiment on the section of spermatogenic tubules to prove that the degenerative phenotype of reproduction in male mice was related to apoptosis. However, to our surprise, there was no significant difference between the KNL1-Ctrl mice and the KNL1-60 µg mice (Figure 5C,D), which confirmed that apoptosis was not the main factor inducing reproductive degeneration phenotype of oligospermia and azoospermia, as many previously reported [38,39,40].
To further determine how KNL1 blocks spermatogenesis in mice, we performed flow cytometry on their spermatozoa as Miki [30] did. The FC (flow cytometry) results revealed (Figure 6A–C) that there was normal sperm cell composition in KNL1-Ctrl mice and the proportion of haploid sperm cells (N) was the largest part (77.7%, n = 3). However, in the KNL1-60 µg group mice, the proportion of haploid sperm cells decreased significantly. The proportion of haploid sperm cells decreased by 49.5% (n = 3), the proportion of diploid sperm cells (2N) increased by 53.0% (n = 3), and the proportion of tetraploid sperm cells (4N) decreased by 3.6% (n = 3).
Considering the FC results and the spermatogenic process, we speculated that KNL1 influenced the process of meiosis of spermatogenesis, leading to the accumulation of diploid (2N) and tetraploid (4N) sperm cells and the failure of haploid (N) sperm production.
To precisely confirm which stage the KNL1 would affect in the spermatogenic cycle, we chose different fluorescence markers to map the cycle of KNL1 influenced during spermatogenesis. By the detection of fluorescence intensity of different markers such as GFRα1, PLZF, C-kit, STRA8, γH2AX, and Sycp3, we found that GFRα1, PLZF, γH2AX, and Sycp3 had significant differences in mouse testis between the KNL1-60 µg group and KNL1-Ctrl mice (Figure 7A–H and Figure S2).
These results again confirmed that the damage caused by KNL1 deletion to spermatogonia mainly lies in the meiosis stage, especially affecting the transition stage of the meiosis I stage and partially affecting mitosis. We thus put forward the hypothesis that the oligospermia of KNL1 mice mainly resulted from the loss-function of KNL1 on spermatocyte meiosis, resulting in the block of the maturation process of spermatocytes.

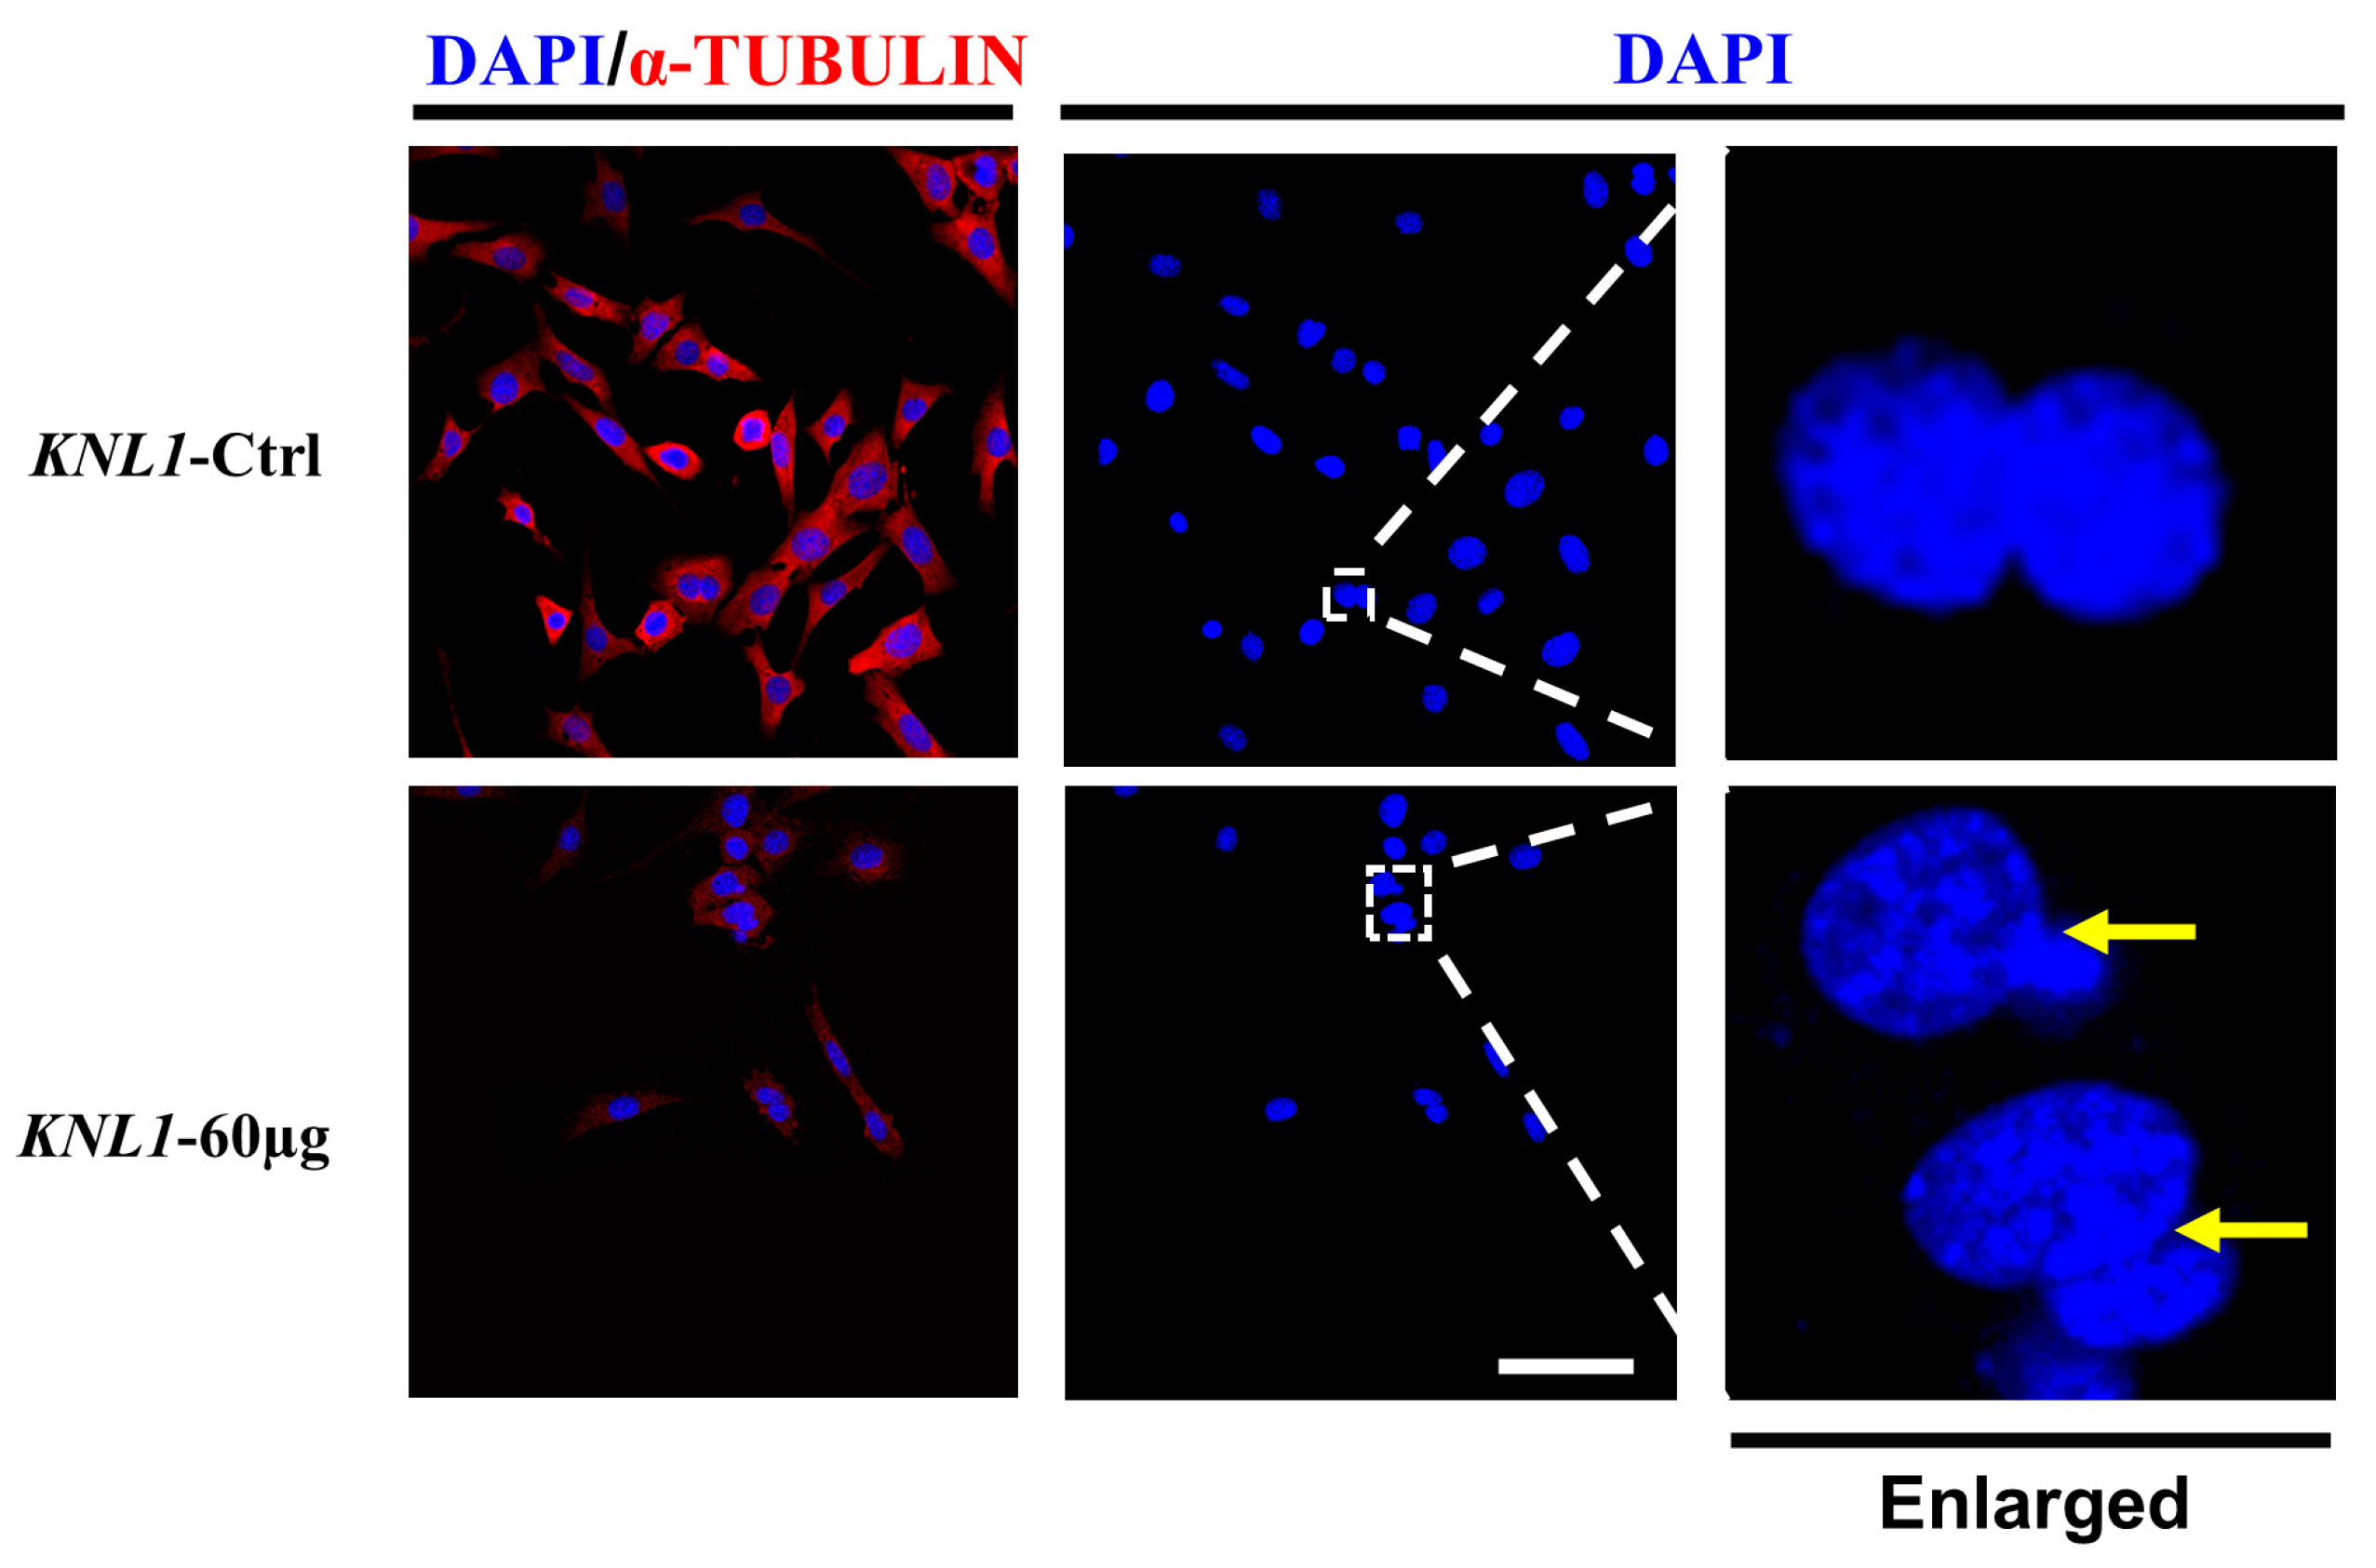
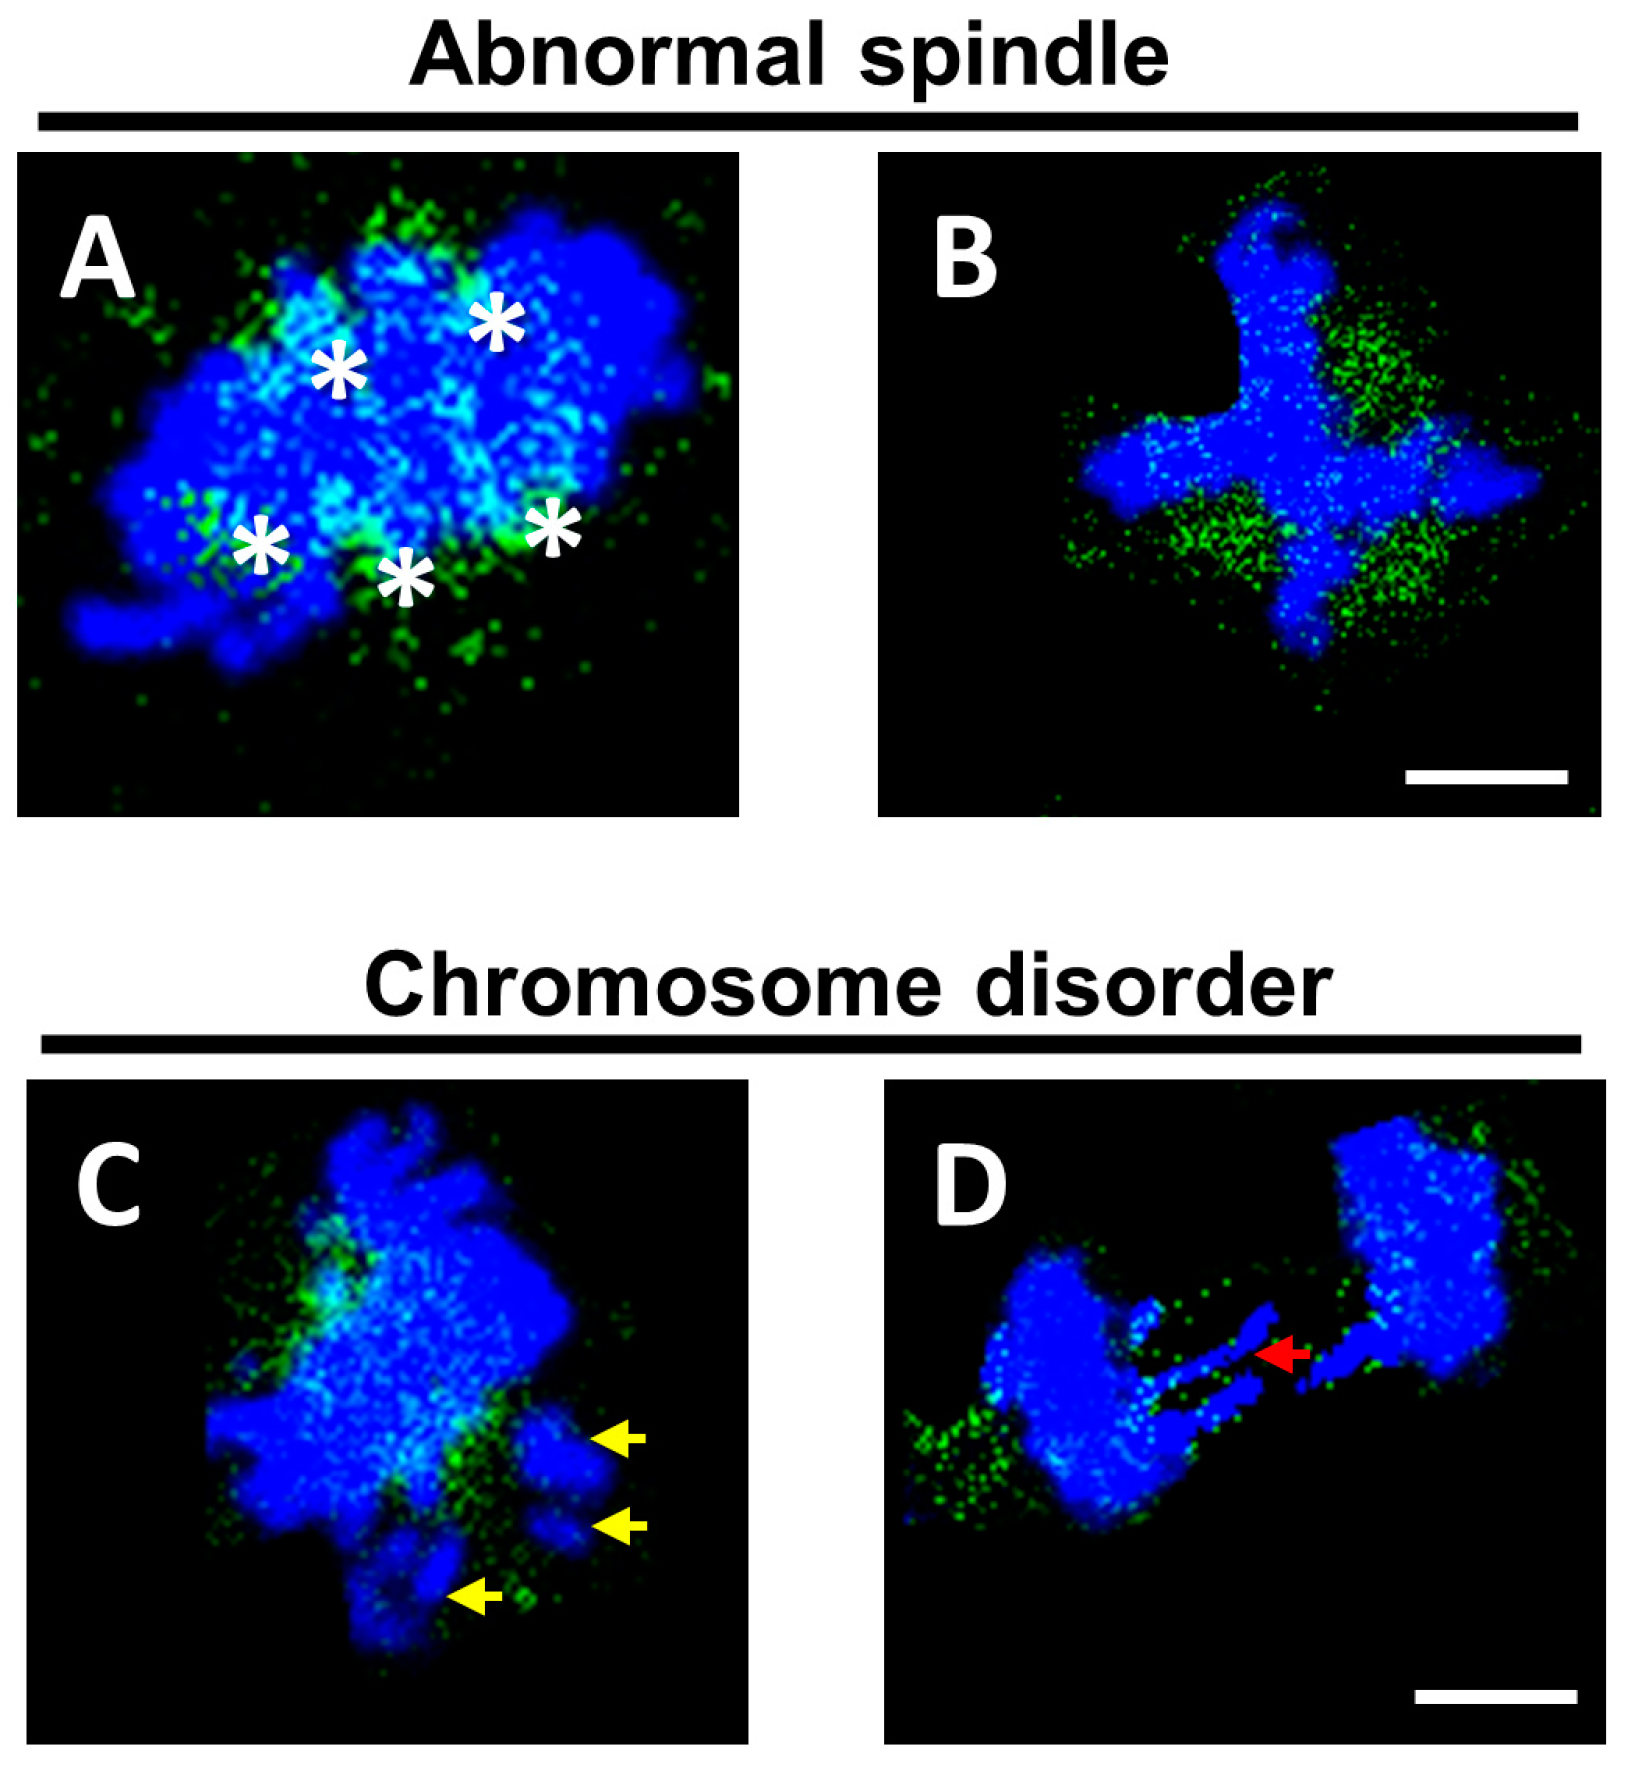
3.4. The Loss-Function of KNL1 Leads to Abnormal Assembly and Separation of the Spindle Resulting in Unequal Cell Segregation

To further investigate the effect of KNL1 on spermatocyte maturation, GC-2 cells that could maintain the stage of spermatocyte were selected for this study. The expression level of KNL1 in GC-2 cells was knocked down by siRNA (Figure S3A), and the GC-2 cells were treated with paving and immunofluorescence after interference. The results showed that GC-2 cells treated with KNL1 siRNA exhibited unequal division compared to normal GC-2 cells (Figure 8).
Considering the previous reports of the KNL1 gene in the literature, we first speculated that KNL1 may lead to unequal division by affecting the spindle. We also transfected cells with siRNA to interfere with the expression of KNL1. Immunofluorescence results showed that compared with the non-interference group, the spindle in the KNL1-60 µg group represented different degrees of abnormality compared to the KNL1-Ctrl group (Figure S3), such as the emergence of multipolar spindles in the metaphase and the failure of spindle formation (Figure 9A,B and Figure S3B,C).
In addition, we also observed the phenomenon of chromosomal abnormalities in interfered cells. Chromosomes were not fully aligned on the equatorial plate in metaphase, and there was a phenomenon of chromosome lag in anaphase (Figure 9C,D).
We inferred that the disorder of the spindle leads to the decline of its ability to regulate chromosomes and the spindle cannot regulate chromosomes as accurately as before, which resulted in the abnormal arrangement of some chromosomes based on the evidence above. The force imbalance causes chromosome lag in the subsequent cell separation and leads to abnormal cell division.

4. Discussion

Maintaining reproductive health is crucial to successful fertility and a healthy relationship between partners, while most cases of infertility originate from the poor production of sperm or eggs [41]. Nowadays, male infertility is a big problem plaguing mankind, which may be caused by genetic factors or an unhealthy lifestyle [42]. There are several factors such as genetic mutations, infections, anatomical change, and pressure involved in the normal development and quality of sperm that stop men from being able to father offspring [43]. The phenotype of nearly 90% of male infertility is mainly reflected in sperm, including sperm quantity, quality, and activity [44].
KNL1 is an essential large scaffold protein for accurate chromosome segregation in eukaryotic cells [16]. It was first recognized as a kinetochore protein in 2004 in human cells [45]. Subsequently, more and more studies have gradually revealed the functions and corresponding connections of different domains and motifs of KNL1 [9,12,46,47,48]. Previous studies have shown that KNL1 plays important roles in several types of cancer, and KNL1 was found to be abnormally expressed in 16 types of cancer [49,50]. However, its relationship with the male reproduction system remains largely unclear.
In our study, the expression of KNL1 in the testis was knocked down by injecting the corresponding siRNA into the seminiferous tubules of the mice to explore the influence on the male reproductive phenotype. To our surprise, no obvious changes in testicular size were observed in NC and KNL1 groups. However, when we detected the internal physiological structure of the testis and epididymis, we found the KNL1 group lost most of the important developmentally relevant cells and there is a significant decrease in the number of sperm (Table 2 and Table 3 and Figure 4A–D). Compared to the control group, the quality and quantity of sperm both have a huge reduction. These phenotypes are consistent with those previous studies concerning oligospermia and asthenospermia due to gene variants, oxidative stress, or stimulation of sexual hormone secretion [51,52,53,54]. In the flow cytometry, we found that the number of diploid cells in the experimental group was significantly accumulated, suggesting that there was a block in the process of spermatogenesis, leading the number of mature sperm to decrease. At this point, these phenotypes were already consistent with the diagnosis of oligospermia and asthenospermia.
Next, the effect and underlying mechanism of this block in spermatogenesis were investigated. Previous researchers found that apoptosis might be one of the important reasons leading to sperm problems [38,39,40]. However, it was surprising to find that apoptosis was not the main factor causing sperm reduction and sperm arrest. Immunofluorescence experiments were performed to detect the markers in each stage of spermatogenesis to precisely locate the problem period and we found that the attenuation of the fluorescence signal was most obvious in the meiotic phase, which combined with the previous flow cytometry results. We believed that the problem of sperm arises in the first meiotic division. GC-2 cell as a cell model was adopted to explore the specific effect and underlying mechanism after KNL1 interference. We found that unequal division of GC-2 cells occurred after the knockdown of KNL1 expression in GC-2 cells. Since previous reports have confirmed the role of KNL1 in the regulation of kinetosomes during cell division, we hypothesized that KNL1 also has a certain effect on the spindle. Consistent with our hypothesis, there was a phenomenon of multipolar spindle and spindle dispersion after observing KNL1 knockdown cells by immunofluorescence. Additionally, chromosome disarrangement and chromosome hysteresis were also observed. Taken together, the knockdown of KNL1 could lead to decreased adhesion to the spindle, resulting in the abnormal spindle and decreased tensile force on the chromosome, abnormal division in cells, and increased probability of aneuploidy in cells. For male reproduction, it can lead to abnormal spermatogenesis, oligospermia, and asthenospermia.
To conclude, we first revealed the association between the KNL1 gene and spermatogenic dysfunction and further explored the mechanism of KNL1 in causing the occurrence of spermatogenic dysfunction. KNL1 can become a potential molecular prognostic and diagnostic marker in some cases while normal phenotypes are easily ignored. What is more, our work not only further reveals the role of the KNL1 gene, but also provides a more accurate tool for detecting the abnormal stages of spermatogenesis by using FCM and IF, as well as expanding the diagnostic pointer pool in the field of male reproduction. As a result, it can improve diagnostic accuracy if coupled with other clinical diagnostic technologies. However, some limitations should be noted. Firstly, although we identified the problem stage in the meiosis I stage, we did not pinpoint the different stages in meiosis such as the leptotene stage, or even the zygotene stage, pachytene stage, diplotene stage, and diakinesis phase. Other innovative technology to further explore more accurate positioning is worth further exploration in our experiment that we should continue to explore. Secondly, establishing an animal model of the cKO mice to explore the mechanism of KNL1 in more detail in subsequent studies should be considered. In addition, to date there has been no reported human case associated with KNL1, and future studies in the reproductive field should be paid attention to establish a strong link between KNL1 and human sperm quality and health.

Supplementary Materials

The following supporting information can be downloaded at https://www.mdpi.com/article/10.3390/s23052571/s1, Figure S1. Immunofluorescence intensity of KNL1 between KNL1-Ctrl and KNL1-60 µg. Figure S2: Immunofluorescence intensity of two markers between KNL1-Ctrl and KNL1-60 µg; Figure S3: siRNA interference efficiency and immunofluorescence image of normal cell division; Table S1: Immunofluorescence antibody used in the experiment.

Author Contributions

Methodology, D.L.; validation, Y.Z. (Yuwei Zhao) and K.L.; formal analysis, J.Y.; data curation, R.Y.; writing—original draft preparation, Y.Z. (Yuwei Zhao); writing—review and editing, Y.T. and K.L.; project administration, D.L.; funding acquisition, Y.Z. (Yijian Zhu). All authors have read and agreed to the published version of the manuscript.

Funding

This work was supported by NHC Key Laboratory of Birth Defects and Reproductive Health (2020cstc-jxj1-01703), the Key Project of Chongqing Natural Science Foundation (cstc2020jcyj-zdxmX0011) and the General Program of Chongqing Natural Science Foundation (cstc2020jcyj-msxmX0012).

Institutional Review Board Statement

The animal study protocol was approved by the Laboratory Animal Ethics Committee, School of Life Sciences, Fudan University (2022JS071 and 18 May 2022) for studies involving animals.

Informed Consent Statement

Not applicable.

Data Availability Statement

The data presented in this study are available on request from the corresponding author. The data are not publicly available due to some experimental research still in progress.

Acknowledgments

We thank Peipei Xu, Ningjing Ou, Yao (Shanghai No. 1 Hospital, China), and Yafei Tian, Zhoukai Long and Zheng Li for providing technical guidance, financial support and assistance.

Conflicts of Interest

The authors declare no conflict of interest.

References

  1. Mora-Bermúdez, F.; Kanis, P.; Macak, D.; Peters, J.; Naumann, R.; Xing, L.; Sarov, M.; Winkler, S.; Oegema, C.E.; Haffner, C.; et al. Longer metaphase and fewer chromosome segregation errors in modern human than Neanderthal brain development. Sci. Adv. 2022, 8, eabn7702. [Google Scholar] [CrossRef]
  2. Lara-Gonzalez, P.; Pines, J.; Desai, A. Spindle assembly checkpoint activation and silencing at kinetochores. Semin. Cell Dev. Biol. 2021, 117, 86–98. [Google Scholar] [CrossRef]
  3. Claeys Bouuaert, C.; Pu, S.; Wang, J.; Oger, C.; Daccache, D.; Xie, W.; Patel, D.J.; Keeney, S. DNA-driven condensation assembles the meiotic DNA break machinery. Nature 2021, 592, 144–149. [Google Scholar] [CrossRef]
  4. Stiff, T.; Echegaray-Iturra, F.R.; Pink, H.J.; Herbert, A.; Reyes-Aldasoro, C.C.; Hochegger, H. Prophase-Specific Perinuclear Actin Coordinates Centrosome Separation and Positioning to Ensure Accurate Chromosome Segregation. Cell Rep. 2020, 31, 107681. [Google Scholar] [CrossRef]
  5. Hinshaw, S.M.; Harrison, S.C. Kinetochore Function from the Bottom Up. Trends Cell Biol. 2018, 28, 22–33. [Google Scholar] [CrossRef]
  6. Ghodgaonkar-Steger, M.; Potocnjak, M.; Zimniak, T.; Fischböck-Halwachs, J.; Solis-Mezarino, V.; Singh, S.; Speljko, T.; Hagemann, G.; Drexler, D.J.; Witte, G.; et al. C-Terminal Motifs of the MTW1 Complex Cooperatively Stabilize Outer Kinetochore Assembly in Budding Yeast. Cell Rep. 2020, 32, 108190. [Google Scholar] [CrossRef]
  7. Musacchio, A.; Desai, A. A Molecular View of Kinetochore Assembly and Function. Biology 2017, 6, 5. [Google Scholar] [CrossRef] [Green Version]
  8. Cheeseman, I.M. The Kinetochore. Cold Spring Harb. Perspect. Biol. 2014, 6, a015826. [Google Scholar] [CrossRef]
  9. Vleugel, M.; Tromer, E.; Omerzu, M.; Groenewold, V.; Nijenhuis, W.; Snel, B.; Kops, G.J.P.L. Arrayed BUB recruitment modules in the kinetochore scaffold KNL1 promote accurate chromosome segregation. J. Cell Biol. 2013, 203, 943–955. [Google Scholar] [CrossRef]
  10. Hara, M.; Fukagawa, T. Dynamics of kinetochore structure and its regulations during mitotic progression. Cell Mol. Life Sci. 2020, 77, 2981–2995. [Google Scholar] [CrossRef]
  11. Cheeseman, I.M.; Chappie, J.S.; Wilson-Kubalek, E.M.; Desai, A. The conserved KMN network constitutes the core microtubule-binding site of the kinetochore. Cell 2006, 127, 983–997. [Google Scholar] [CrossRef] [Green Version]
  12. Cheeseman, I.M.; Hori, T.; Fukagawa, T.; Desai, A. KNL1 and the CENP-H/I/K complex coordinately direct kinetochore assembly in vertebrates. Mol. Biol. Cell 2008, 19, 587–594. [Google Scholar] [CrossRef] [Green Version]
  13. Bock, L.J.; Pagliuca, C.; Kobayashi, N.; Grove, R.A.; Oku, Y.; Shrestha, K.; Alfieri, C.; Golfieri, C.; Oldani, A.; Dal Maschio, M.; et al. Cnn1 inhibits the interactions between the KMN complexes of the yeast kinetochore. Nat. Cell Biol. 2012, 14, 614–624. [Google Scholar] [CrossRef] [Green Version]
  14. Chan, Y.W.; Jeyaprakash, A.A.; Nigg, E.A.; Santamaria, A. Aurora B controls kinetochore-microtubule attachments by inhibiting Ska complex-KMN network interaction. J. Cell Biol. 2012, 196, 563–571. [Google Scholar] [CrossRef] [Green Version]
  15. Su, H.; Liu, Y.; Wang, C.; Liu, Y.; Feng, C.; Sun, Y.; Yuan, J.; Birchler, J.A.; Han, F. Knl1 participates in spindle assembly checkpoint signaling in maize. Proc. Natl. Acad. Sci. USA 2021, 118, e2022357118. [Google Scholar] [CrossRef]
  16. Caldas, G.V.; DeLuca, J.G. KNL1: Bringing order to the kinetochore. Chromosoma 2014, 123, 169–181. [Google Scholar] [CrossRef] [Green Version]
  17. Krenn, V.; Overlack, K.; Primorac, I.; van Gerwen, S.; Musacchio, A. KI Motifs of Human Knl1 Enhance Assembly of Comprehensive Spindle Checkpoint Complexes around MELT Repeats. Curr. Biol. 2014, 24, 29–39. [Google Scholar] [CrossRef] [Green Version]
  18. Petrovic, A.; Mosalaganti, S.; Keller, J.; Mattiuzzo, M.; Overlack, K.; Krenn, V.; De Antoni, A.; Wohlgemuth, S.; Cecatiello, V.; Pasqualato, S.; et al. Modular Assembly of RWD Domains on the Mis12 Complex Underlies Outer Kinetochore Organization. Mol. Cell 2014, 53, 591–605. [Google Scholar] [CrossRef] [Green Version]
  19. Silio, V.; McAinsh, A.D.; Millar, J.B. KNL1-Bubs and RZZ Provide Two Separable Pathways for Checkpoint Activation at Human Kinetochores. Dev. Cell 2015, 35, 600–613. [Google Scholar] [CrossRef] [Green Version]
  20. Caldas, G.V.; DeLuca, K.F.; DeLuca, J.G. KNL1 facilitates phosphorylation of outer kinetochore proteins by promoting Aurora B kinase activity. Mol. Biol. Cell 2013, 203, 957–969. [Google Scholar] [CrossRef]
  21. Petrovic, A.; Keller, J.; Liu, Y.; Overlack, K.; John, J.; Dimitrova, Y.N.; Jenni, S.; van Gerwen, S.; Stege, P.; Wohlgemuth, S.; et al. Structure of the MIS12 Complex and Molecular Basis of Its Interaction with CENP-C at Human Kinetochores. Cell 2016, 167, 1028–1040.e1015. [Google Scholar] [CrossRef] [PubMed] [Green Version]
  22. Zhang, L.; Ouyang, X.; Su, X. The structure and function of kinetochore proteins KNL1 and its disease correlation. Chem. Life 2019, 39, 1147–1152. [Google Scholar]
  23. Bai, T.; Zhao, Y.; Liu, Y.; Cai, B.; Dong, N.; Li, B. Effect of KNL1 on the proliferation and apoptosis of colorectal cancer cells. Technol. Cancer Res. Treat. 2019, 18, 1533033819858668. [Google Scholar] [CrossRef] [Green Version]
  24. Shi, L.; Qalieh, A.; Lam, M.M.; Keil, J.M.; Kwan, K.Y. Robust elimination of genome-damaged cells safeguards against brain somatic aneuploidy following Knl1 deletion. Nat. Commun. 2019, 10, 2588. [Google Scholar] [CrossRef] [Green Version]
  25. Saadi, A.; Verny, F.; Siquier-Pernet, K.; Bole-Feysot, C.; Nitschke, P.; Munnich, A.; Abada-Dendib, M.; Chaouch, M.; Abramowicz, M.; Colleaux, L. Refining the phenotype associated with CASC5 mutation. Neurogenetics 2016, 17, 71–78. [Google Scholar] [CrossRef] [PubMed]
  26. Yue, W.; Wang, Y.; Meng, T.G.; Zhang, H.Y.; Zhang, X.R.; Ouyang, Y.C.; Hou, Y.; Schatten, H.; Wang, Z.B.; Sun, Q.Y. Kinetochore scaffold 1 regulates SAC function during mouse oocyte meiotic maturation. FASEB J. 2022, 36, e22210. [Google Scholar] [CrossRef]
  27. Otsu, M.; Tanabe, Y.; Iwakiri, A.; Arima, K.; Uchiyama, A.; Yamamoto, M.; Ohtani, S.; Endo, H.; Komoto, M.; Miyazaki, K. A report on a modified protocol for flow cytometry-based assessment of blood group erythrocyte antigens potentially suitable for analysis of weak ABO subgroups. Transfusion 2023. [Google Scholar] [CrossRef]
  28. Ding, L.; Zheng, Q.; Lin, Y.; Wang, R.; Wang, H.; Luo, W.; Lu, Z.; Xie, H.; Ren, L.; Lu, H.; et al. Exosome-derived circTFDP2 promotes prostate cancer progression by preventing PARP1 from caspase-3-dependent cleavage. Clin. Transl. Med. 2023, 13, e1156. [Google Scholar] [CrossRef]
  29. Peng, B.Y.; Singh, A.K.; Chan, C.H.; Deng, Y.H.; Li, P.Y.; Su, C.W.; Wu, C.Y.; Deng, W.P. AGA induces sub-G1 cell cycle arrest and apoptosis in human colon cancer cells through p53-independent/p53-dependent pathway. BMC Cancer 2023, 23, 1. [Google Scholar] [CrossRef]
  30. Hara-Yokoyama, M.; Kurihara, H.; Ichinose, S.; Matsuda, H.; Ichinose, S.; Kurosawa, M.; Tada, N.; Iwahara, C.; Terasawa, K.; Podyma-Inoue, K.A.; et al. KIF11 as a Potential Marker of Spermatogenesis Within Mouse Seminiferous Tubule Cross-sections. J. Histochem. Cytochem. 2019, 67, 813–824. [Google Scholar] [CrossRef]
  31. Im, K.; Mareninov, S.; Diaz, M.F.P.; Yong, W.H. An Introduction to Performing Immunofluorescence Staining. Methods Mol. Biol. 2019, 1897, 299–311. [Google Scholar] [CrossRef]
  32. Xiong, X.; Zhang, Y.; Xiong, Y.; Yan, M.; Wu, J.; Hao, Z.; Zhang, H.; Li, J. Study on the establishment of a sorting system for yak X and Y sperm by flow cytometry. J. Anim. Sci. Vet. Med. 2021, 52, 399–407. [Google Scholar]
  33. Llavanera, M.; Mislei, B.; Blanco-Prieto, O.; Baldassarro, V.A.; Mateo-Otero, Y.; Spinaci, M.; Yeste, M.; Bucci, D. Assessment of sperm mitochondrial activity by flow cytometry and fluorescent microscopy: A comparative study of mitochondrial fluorescent probes in bovine spermatozoa. Reprod. Fertil. Dev. 2022, 34, 679–688. [Google Scholar] [CrossRef]
  34. Da Costa, R.; Redmann, K.; Schlatt, S. Simultaneous detection of sperm membrane integrity and DNA fragmentation by flow cytometry: A novel and rapid tool for sperm analysis. Andrology 2021, 9, 1254–1263. [Google Scholar] [CrossRef] [PubMed]
  35. Purdy, P.H.; Graham, J.K.; Azevedo, H.C. Evaluation of boar and bull sperm capacitation and the acrosome reaction using flow cytometry. Anim. Reprod. Sci. 2022, 246, 106846. [Google Scholar] [CrossRef] [PubMed]
  36. Bulkeley, E.; Santistevan, A.C.; Varner, D.; Meyers, S. Imaging flow cytometry to characterize the relationship between abnormal sperm morphologies and reactive oxygen species in stallion sperm. Reprod. Domest. Anim. 2023, 58, 10–19. [Google Scholar] [CrossRef] [PubMed]
  37. Chen, Y.; Zheng, Y.X.; Gao, Y.; Lin, Z.; Yang, S.M.; Wang, T.T.; Wang, Q.; Xie, N.N.; Hua, R.; Liu, M.X.; et al. Single-cell RNA-seq uncovers dynamic processes and critical regulators in mouse spermatogenesis. Cell Res. 2018, 28, 879–896. [Google Scholar] [CrossRef] [Green Version]
  38. Karna, K.K.; Soni, K.K.; You, J.H.; Choi, N.Y.; Kim, H.K.; Kim, C.Y.; Lee, S.W.; Shin, Y.S.; Park, J.K. MOTILIPERM Ameliorates Immobilization Stress-Induced Testicular Dysfunction via Inhibition of Oxidative Stress and Modulation of the Nrf2/HO-1 Pathway in SD Rats. Int. J. Mol. Sci. 2020, 21, 4750. [Google Scholar] [CrossRef]
  39. Li, G.; Zhang, P.; You, Y.; Chen, D.; Cai, J.; Ma, Z.; Huang, X.; Chang, D. Qiangjing Tablets Regulate Apoptosis and Oxidative Stress via Keap/Nrf2 Pathway to Improve the Reproductive Function in Asthenospermia Rats. Front. Pharmacol. 2021, 12, 714892. [Google Scholar] [CrossRef]
  40. Zhang, P.H.; Chen, D.A.; Dong, L.; Li, G.S.; Yin, J.; Qu, X.W.; You, Y.D.; Chang, D.G. Inhibitory effect of Qiangjing Tablets on the Fas/FasL pathway of cell apoptosis in male SD rats with infertility. Zhonghua Nan Ke Xue 2016, 22, 246–251. [Google Scholar]
  41. Hong, T.K.; Song, J.H.; Lee, S.B.; Do, J.T. Germ Cell Derivation from Pluripotent Stem Cells for Understanding In Vitro Gametogenesis. Cells 2021, 10, 1889. [Google Scholar] [CrossRef]
  42. Wu, J.X.; Xia, T.; She, L.P.; Lin, S.; Luo, X.M. Stem Cell Therapies for Human Infertility: Advantages and Challenges. Cell Transplant. 2022, 31, 9636897221083252. [Google Scholar] [CrossRef] [PubMed]
  43. Sheikhansari, G.; Aghebati-Maleki, L.; Nouri, M.; Jadidi-Niaragh, F.; Yousefi, M. Current approaches for the treatment of premature ovarian failure with stem cell therapy. Biomed. Pharmacother. 2018, 102, 254–262. [Google Scholar] [CrossRef]
  44. Leaver, R.B. Male infertility: An overview of causes and treatment options. Br. J. Nurs. 2016, 25, S35–S40. [Google Scholar] [CrossRef]
  45. Cheeseman, I.M.; Niessen, S.; Anderson, S.; Hyndman, F.; Yates, J.R., 3rd; Oegema, K.; Desai, A. A conserved protein network controls assembly of the outer kinetochore and its ability to sustain tension. Genes Dev. 2004, 18, 2255–2268. [Google Scholar] [CrossRef] [PubMed] [Green Version]
  46. Zhang, G.; Lischetti, T.; Nilsson, J. A minimal number of MELT repeats supports all the functions of KNL1 in chromosome segregation. J. Cell Sci. 2014, 127, 871–884. [Google Scholar] [CrossRef] [Green Version]
  47. Krenn, V.; Wehenkel, A.; Li, X.; Santaguida, S.; Musacchio, A. Structural analysis reveals features of the spindle checkpoint kinase Bub1-kinetochore subunit Knl1 interaction. J. Cell Biol. 2012, 196, 451–467. [Google Scholar] [CrossRef] [Green Version]
  48. Petrovic, A.; Pasqualato, S.; Dube, P.; Krenn, V.; Santaguida, S.; Cittaro, D.; Monzani, S.; Massimiliano, L.; Keller, J.; Tarricone, A.; et al. The MIS12 complex is a protein interaction hub for outer kinetochore assembly. J. Cell Biol. 2010, 190, 835–852. [Google Scholar] [CrossRef] [PubMed]
  49. Gao, H.; Pan, Q.-Y.; Wang, Y.-J.; Chen, Q.-F. Impact of KMN network genes on progression and prognosis of non-small cell lung cancer. Anti-Cancer Drugs 2022, 33, E398–E408. [Google Scholar] [CrossRef]
  50. Cui, Y.; Zhang, C.; Ma, S.; Guo, W.; Cao, W.; Guan, F. CASC5 is a potential tumour driving gene in lung adenocarcinoma. Cell Biochem. Funct. 2020, 38, 733–742. [Google Scholar] [CrossRef]
  51. Liu, N.; Wang, Q.; Li, L.; Lu, J. Establishment of a Mouse Asthenospermia Model through Triggering D-Galactose Mediated Oxidative Stress Injury. Endocr. Metab. Immune Disord. Drug Targets 2021, 21, 1634–1640. [Google Scholar] [CrossRef] [PubMed]
  52. Liu, C.; Tu, C.; Wang, L.; Wu, H.; Houston, B.J.; Mastrorosa, F.K.; Zhang, W.; Shen, Y.; Wang, J.; Tian, S.; et al. Deleterious variants in X-linked CFAP47 induce asthenoteratozoospermia and primary male infertility. Am. J. Hum. Genet. 2021, 108, 309–323. [Google Scholar] [CrossRef] [PubMed]
  53. Du, Y.; Liu, H.; Zhang, M.; Zhang, S.; Hu, J.; Wu, G.; Yang, J. Taurine Increases Spermatozoa Quality and Function in Asthenospermia Rats Impaired by Ornidazole. Adv. Exp. Med. Biol. 2019, 1155, 507–520. [Google Scholar] [CrossRef]
  54. Sha, Y.; Liu, W.; Huang, X.; Li, Y.; Ji, Z.; Mei, L.; Lin, S.; Kong, S.; Lu, J.; Kong, L.; et al. EIF4G1 is a novel candidate gene associated with severe asthenozoospermia. Mol. Genet. Genom. Med. 2019, 7, e807. [Google Scholar] [CrossRef] [PubMed] [Green Version]
Figure 1. Log2 TPM values in different spermatogenic stages. A1 represents the type A1 spermatogonia. In represents the Intermediate spermatogonia. BS represents the Type B spermatogonia S phase. BG2 represents the Type B spermatogonia G2M phase. G1 represents the G1 phase of the preleptotene spermatocyte stage. ePL represents the early phase of the preleptotene spermatocyte stage. mPL represents the medium-term phase of the preleptotene spermatocyte stage. IPL represents the late phase of the preleptotene spermatocyte stage. L represents the leptotene stage of meiosis. Z represents the even line stage of meiosis. eP represents the early pachytene of meiosis. mP represents the metaphase pachytene of meiosis. IP represents the late pachytene of meiosis. D represents the double-line stage of meiosis. MI represents the first meiotic division. MII represents the second meiotic division. RS1–2 represents the round spermatid stage 1–2. RS3–4 represents the round spermatid stage 3–4. RS5–6 represents the round spermatid stage 5–6. RS7–8 represents the round spermatid stage 7–8.
Sensors 23 02571 g001
Figure 2. Operation diagram and the loss-function of KNL1 to the testicle phenotype. (A) Surgical model of injecting spermatogenic tubules in mice. a is the epididymis; b is the testis; c is the injection site in spermatogenic tubules. (B) The testicular phenotype of KNL1-Ctrl mice and KNL1-60 µg mice. bar = 1 mm. (C) The degree of difference between the KNL1-Ctrl mice and KNL1-60 µg mice. Data were presented as mean percentages (mean ± SEM) of at least three independent measurements. Asterisk denotes statistical difference level of significance (*, p < 0.05; ns > 0.05).
Sensors 23 02571 g002
Figure 3. HE staining sections of loss-function of KNL1 on the phenotype of male mice. (A) The HE staining of testis sections between KNL1-Ctrl mice and KNL1-60 µg mice. The right represents the magnified portion of the white dashed box in the left line. Bar = 20 µm (B) The HE staining of epididymis sections between KNL1-Ctrl mice and KNL1-60 µg mice. The left is a 200× magnification and the right is a 400× magnification bar = 50 µm. (C) HE staining section of sperm between KNL1-Ctrl and KNL1-60 µg mice. The right represents the magnified portion of the white dashed box in the left line. Bar = 2 µm.
Sensors 23 02571 g003
Figure 4. The CASA data of KNL1-Ctrl and KNL1-60 µg Group mice. (A) CASA total detection of KNL1-Ctrl and KNL1-60 µg. (B) CASA progressive detection of KNL1-Ctrl and KNL1-60 µg. (C) CASA motile detection of KNL1-Ctrl and KNL1-60 µg. (D) CASA static detection of KNL1-Ctrl and KNL1-60 µg. Asterisk denotes statistical difference level of significance (**, p < 0.01; ***, p < 0.001, ns > 0.05).
Sensors 23 02571 g004
Figure 5. Effects of loss-function of KNL1 on acrosome and apoptosis. (A) The PNA immunofluorescence of a section of the testicle. Testis was immunostained with anti-PNA (green). Merge was DAPI (blue) and PNA (green). The top is KNL1-Ctrl mice and the bottom is KNL1-60 µg mice. Bar = 50 µm. (B) Mean immunofluorescence intensity of PNA between KNL1-Ctrl mice and KNL1-60 µg mice. (C) The TUNEL assay of a section of the testicle. The FITC immunofluorescence of a section of the testicle. Testis was immunostained with anti-FITC (green). Merge was DAPI (blue) and FITC (green). The top is KNL1-Ctrl mice and the bottom is KNL1-60 µg mice. Bar = 50 µm. (D) Mean immunofluorescence intensity of TUNEL between KNL1-Ctrl mice and KNL1-60 µg mice. All data were at least measured by three independent experiments. Asterisk denotes statistical difference level of significance (****, p < 0.0001, ns > 0.05).
Sensors 23 02571 g005
Figure 6. Effects of loss-function of KNL1 on the spermatogenic process by FCM. (A) The FCM results of KNL1-Ctrl mice. (B) The FCM results of KNL1-60 µg mice. N, 2N, and 4N represents a different period of sperm in spermatogenesis (A,B). (C) The percentage of sperm with different ploidy. All data were at least measured by three independent experiments.
Sensors 23 02571 g006
Figure 7. Immunofluorescence of four markers between KNL1-Ctrl and KNL1-60 µg. (A) GFRα1 fluorescent images of testis in KNL1-Ctrl and KNL1-60 µg. Testis was immunostained with anti-GFRα1 (red). Merge was DAPI (blue) and GFRα1 (red). (B) PLZF fluorescent images of testis in KNL1-Ctrl and KNL1-60 µg. Testis was immunostained with anti-PLZF (green). Merge was DAPI (blue) and PLZF (green). (C) γH2AX fluorescent images of testis in KNL1-Ctrl and KNL1-60 µg. Testis was immunostained with anti-γH2AX (green). Merge was DAPI (blue) and γH2AX (green). (D) SYCP3 fluorescent images of testis in KNL1-Ctrl and KNL1-60 µg. Testis was immunostained with anti-SYCP3 (red). Merge was DAPI (blue) and SYCP3 (red). (EH) Data were presented as mean percentages (mean ± SEM) of at least three independent measurements. Asterisk denotes statistical difference at a p (**) < 0.0 1, p (****) < 0.0001 level of significance. Bar = 50 µm.
Sensors 23 02571 g007
Figure 8. Effect of depletion of KNL1 on GC-2 cell separation. Fluorescent images of GC-2 cells interfered with by KNL1 siRNA. GC-2 cells were immunostained with anti-α-tubulin (red) and DAPI (blue). Merge was DAPI (blue) and anti-α-tubulin (red). The right represents the magnified portion of the white dashed box in the middle. The yellow arrow shows the cells that divide unequally. Bar = 50 µm.
Sensors 23 02571 g008
Figure 9. Effect of depletion of KNL1 on GC-2 cell spindle assembly and chromosome. (A,B) The abnormal spindle after interfering with KNL1. Asterisks represent different spindle poles. (C,D) The abnormal chromosome arrangements after interfering with KNL1. Yellow arrows represent chromosomes not aligned on the equatorial plate, red arrows represent lagged chromosomes. Green is α-tubulin, and blue is DAPI. Bar = 5 µm.
Sensors 23 02571 g009
Table 1. Part of the literature on the changes of FCM used in sperm detection.
ResearchersYearMethodsMachine TypeDetection
Miki Hara-Yokoyama et al. [30]2019FCM + PIFACSCaliburThe proportion of haploid, diploid, and tetraploid cells during spermatogenesis
Xianrong Xiong et al. [32]2021FCM + Hoechst33342 + Allura RedMoFlo XDPSperm X and Y were sorted out
Marc et al. [33]2022FCM + Simultaneous co-staining (CMA3 and Yo-Pro-1)CytoFLEX cytometerSperm quality parameters (morphology, viability, total and progressive motility)
Raul et al. [34]2021The co-staining LD + AOCytoFLEX SSperm membrane integrity and DNA fragmentation
Phillip et al. [35]2022FCM + a variety of fluorescent dye (PTYR, PDK, FITC-PNA, PI, M540 and Yo-Pro-1)CYAN-ADPSperm capacitation and functions
Evelyn et al. [36]2023FCM + co-staining SytoxGreen™ and dihydroethidium (DHE)Amnis® ImageStream®Certain morphologic abnormalities and ROS
Table 2. The CASA count number data of KNL1-Ctrl and KNL1-60 µg Group mice.
CountKNL1-Ctrl GroupKNL1 Group
Total316420712180109419471
Motile25691776187807475
Progressive20671676177106254
Rapid24961768187507275
Slow7383020
Static595295302109345396
Table 3. The CASA percentage data of KNL1-Ctrl and KNL1-60 µg Group mice.
PercentageKNL1-Ctrl Group (%)KNL1 Group (%)
Motile81.285.886.1017.715.9
Progressive65.380.981.2014.811.4
Rapid78.985.486017.215.9
Slow2.30.30.100.40
Static18.814.213.910082.384.1
Disclaimer/Publisher’s Note: The statements, opinions and data contained in all publications are solely those of the individual author(s) and contributor(s) and not of MDPI and/or the editor(s). MDPI and/or the editor(s) disclaim responsibility for any injury to people or property resulting from any ideas, methods, instructions or products referred to in the content.

