Physiological Synchrony Predict Task Performance and Negative Emotional State during a Three-Member Collaborative Task
Abstract
1. Introduction
2. Materials and Methods
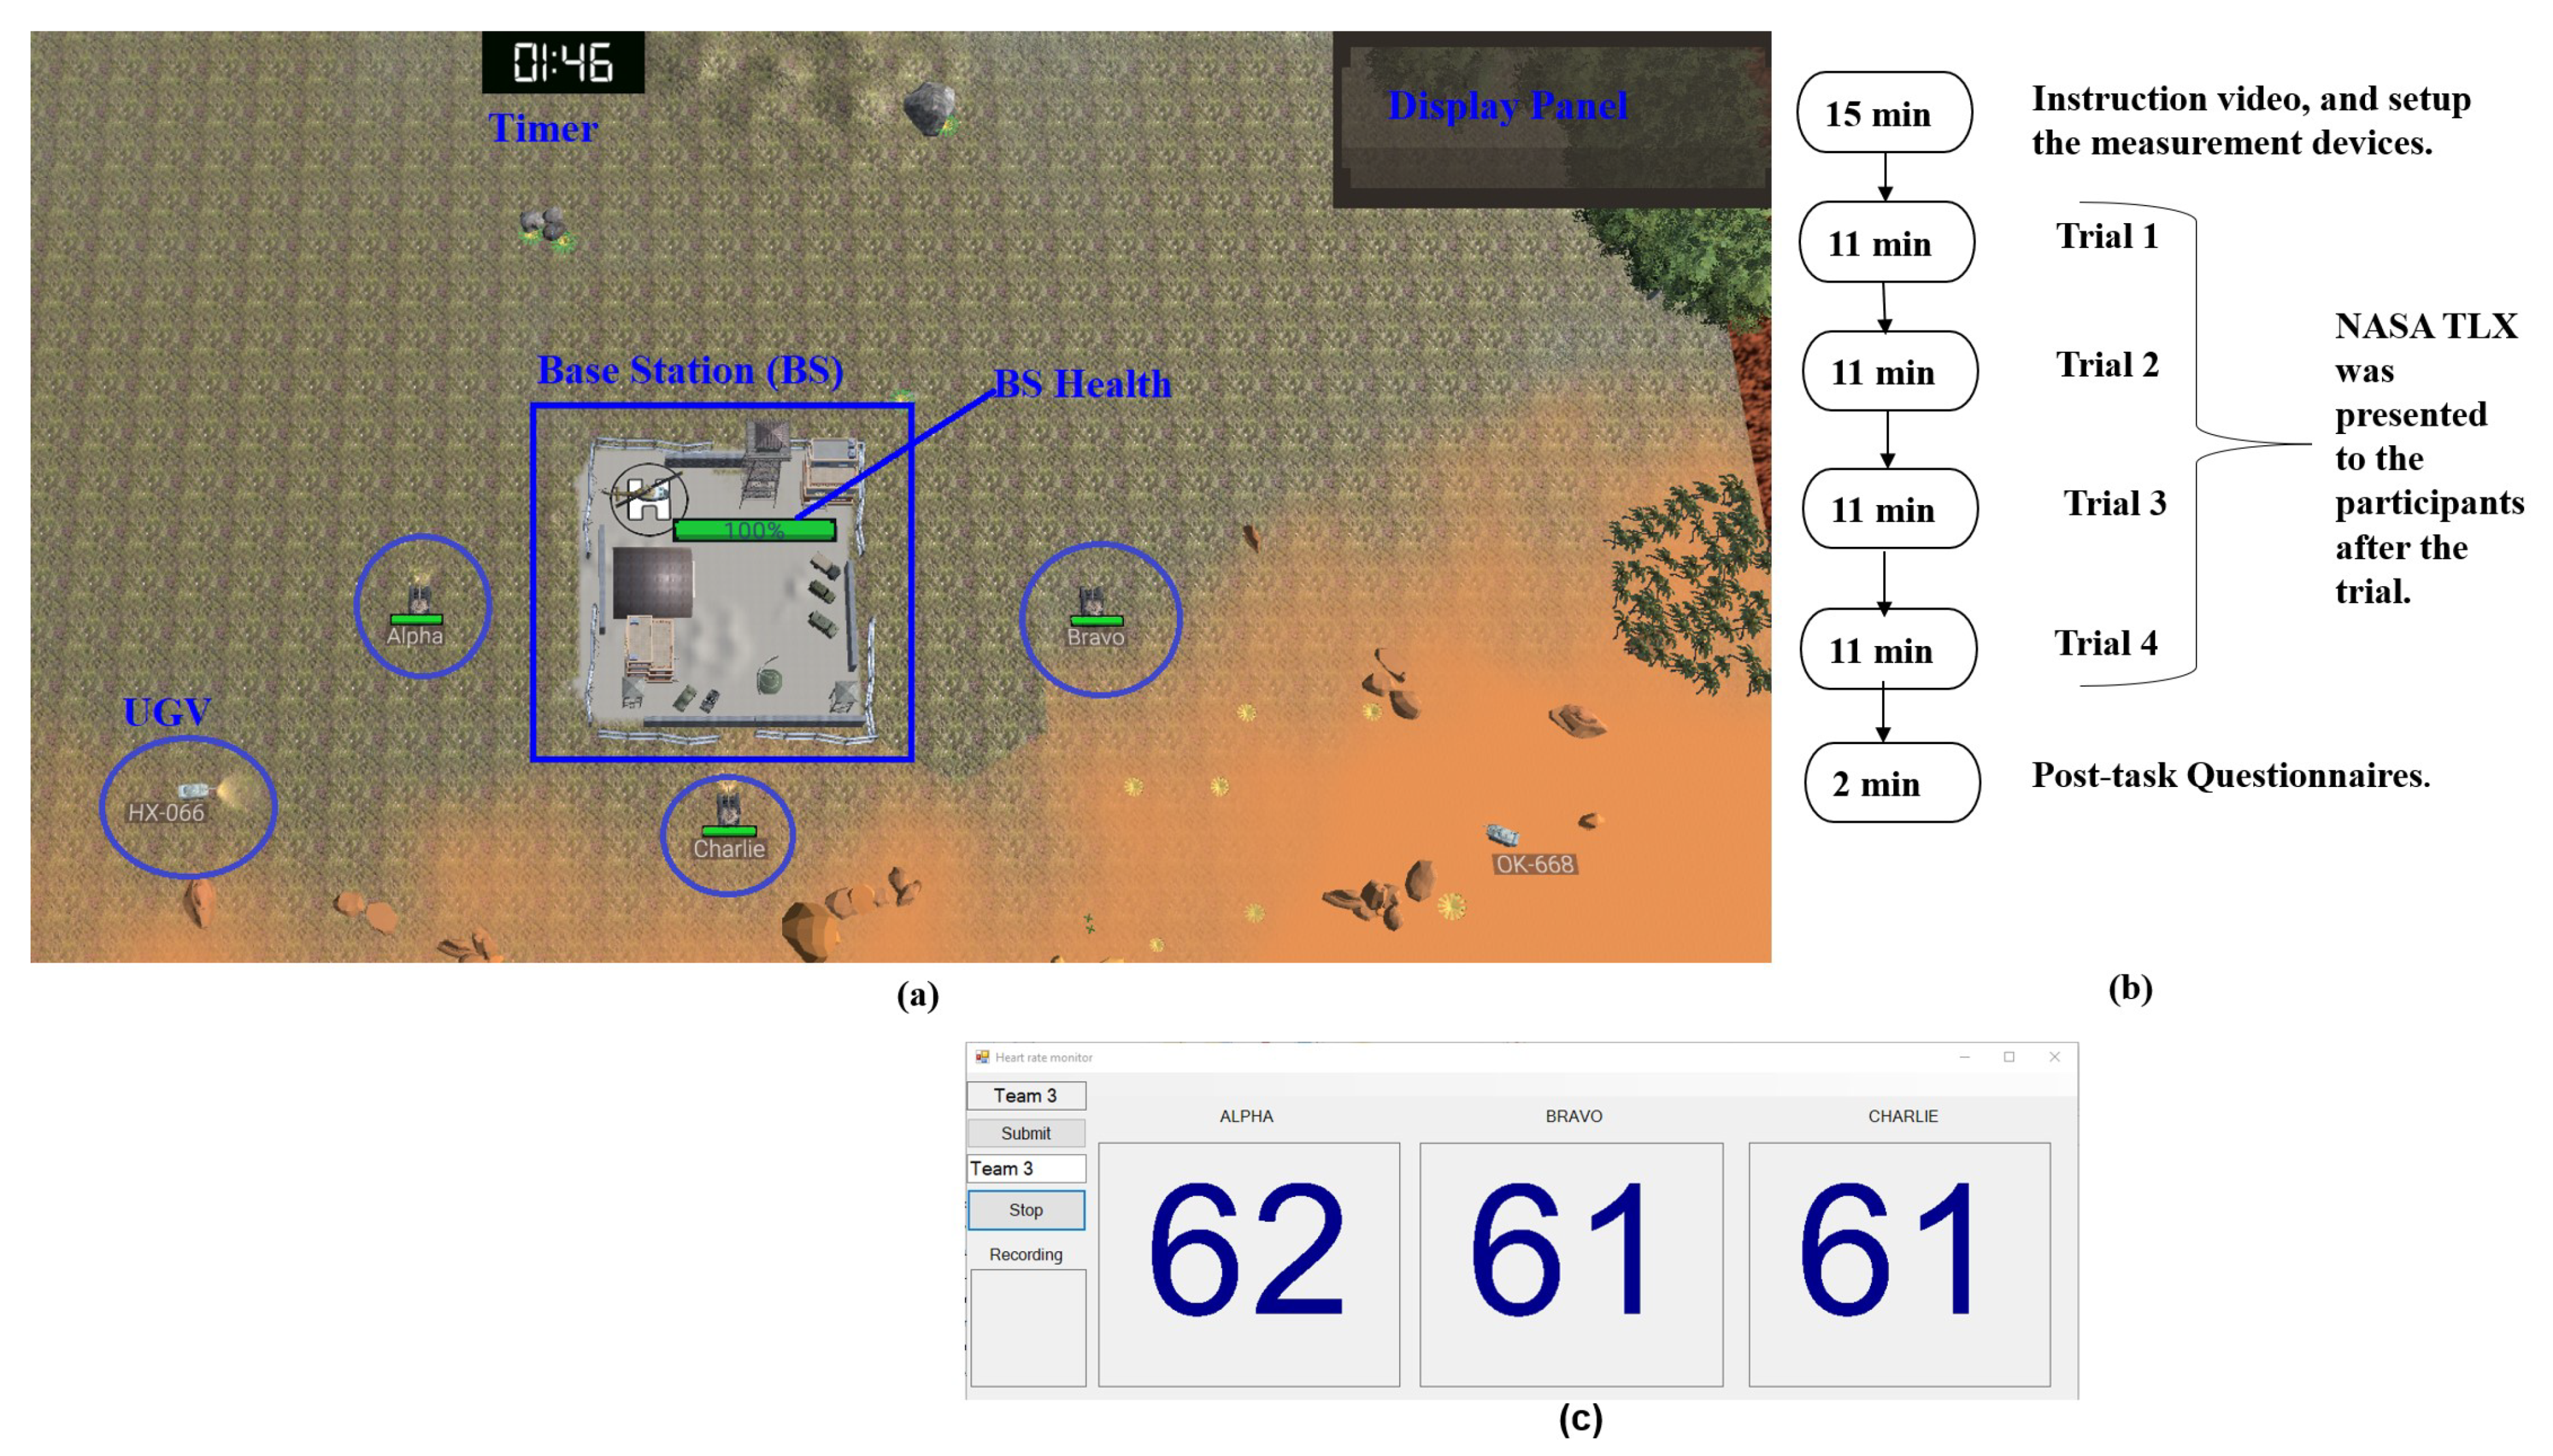
2.1. Tank Battle Team Task
2.2. Participants
2.3. Procedure
2.4. Physiological Data
Data Preparation
3. Measures of Team Performance
3.1. Subjective Measures
NASA Task Load Index
- Physical Demand (PD), M = 2.49, SD = 1.28, (0: not demanded, 10: demanded)
- Temporal Demand (TD), M = 4.65, SD = 1.11, (0: not demanded, 10: demanded)
- Performance (Perf), M = 5.55, SD = 1.28, (0: bad performance, 10: good performance)
- Effort (Eff), M = 5.22, SD = 1.18, (0: no effort needed, 10: effort needed)
- Frustration (Frust), M = 3.69, SD = 1.47, (0: not frustrated, 10: frustrated)
- Mental Demand (MD), M = 5.46, SD = 1.19, (0: not demanded, 10: demanded)
3.2. Physiological Synchrony Calculation
3.2.1. Cross Correlation (CC)
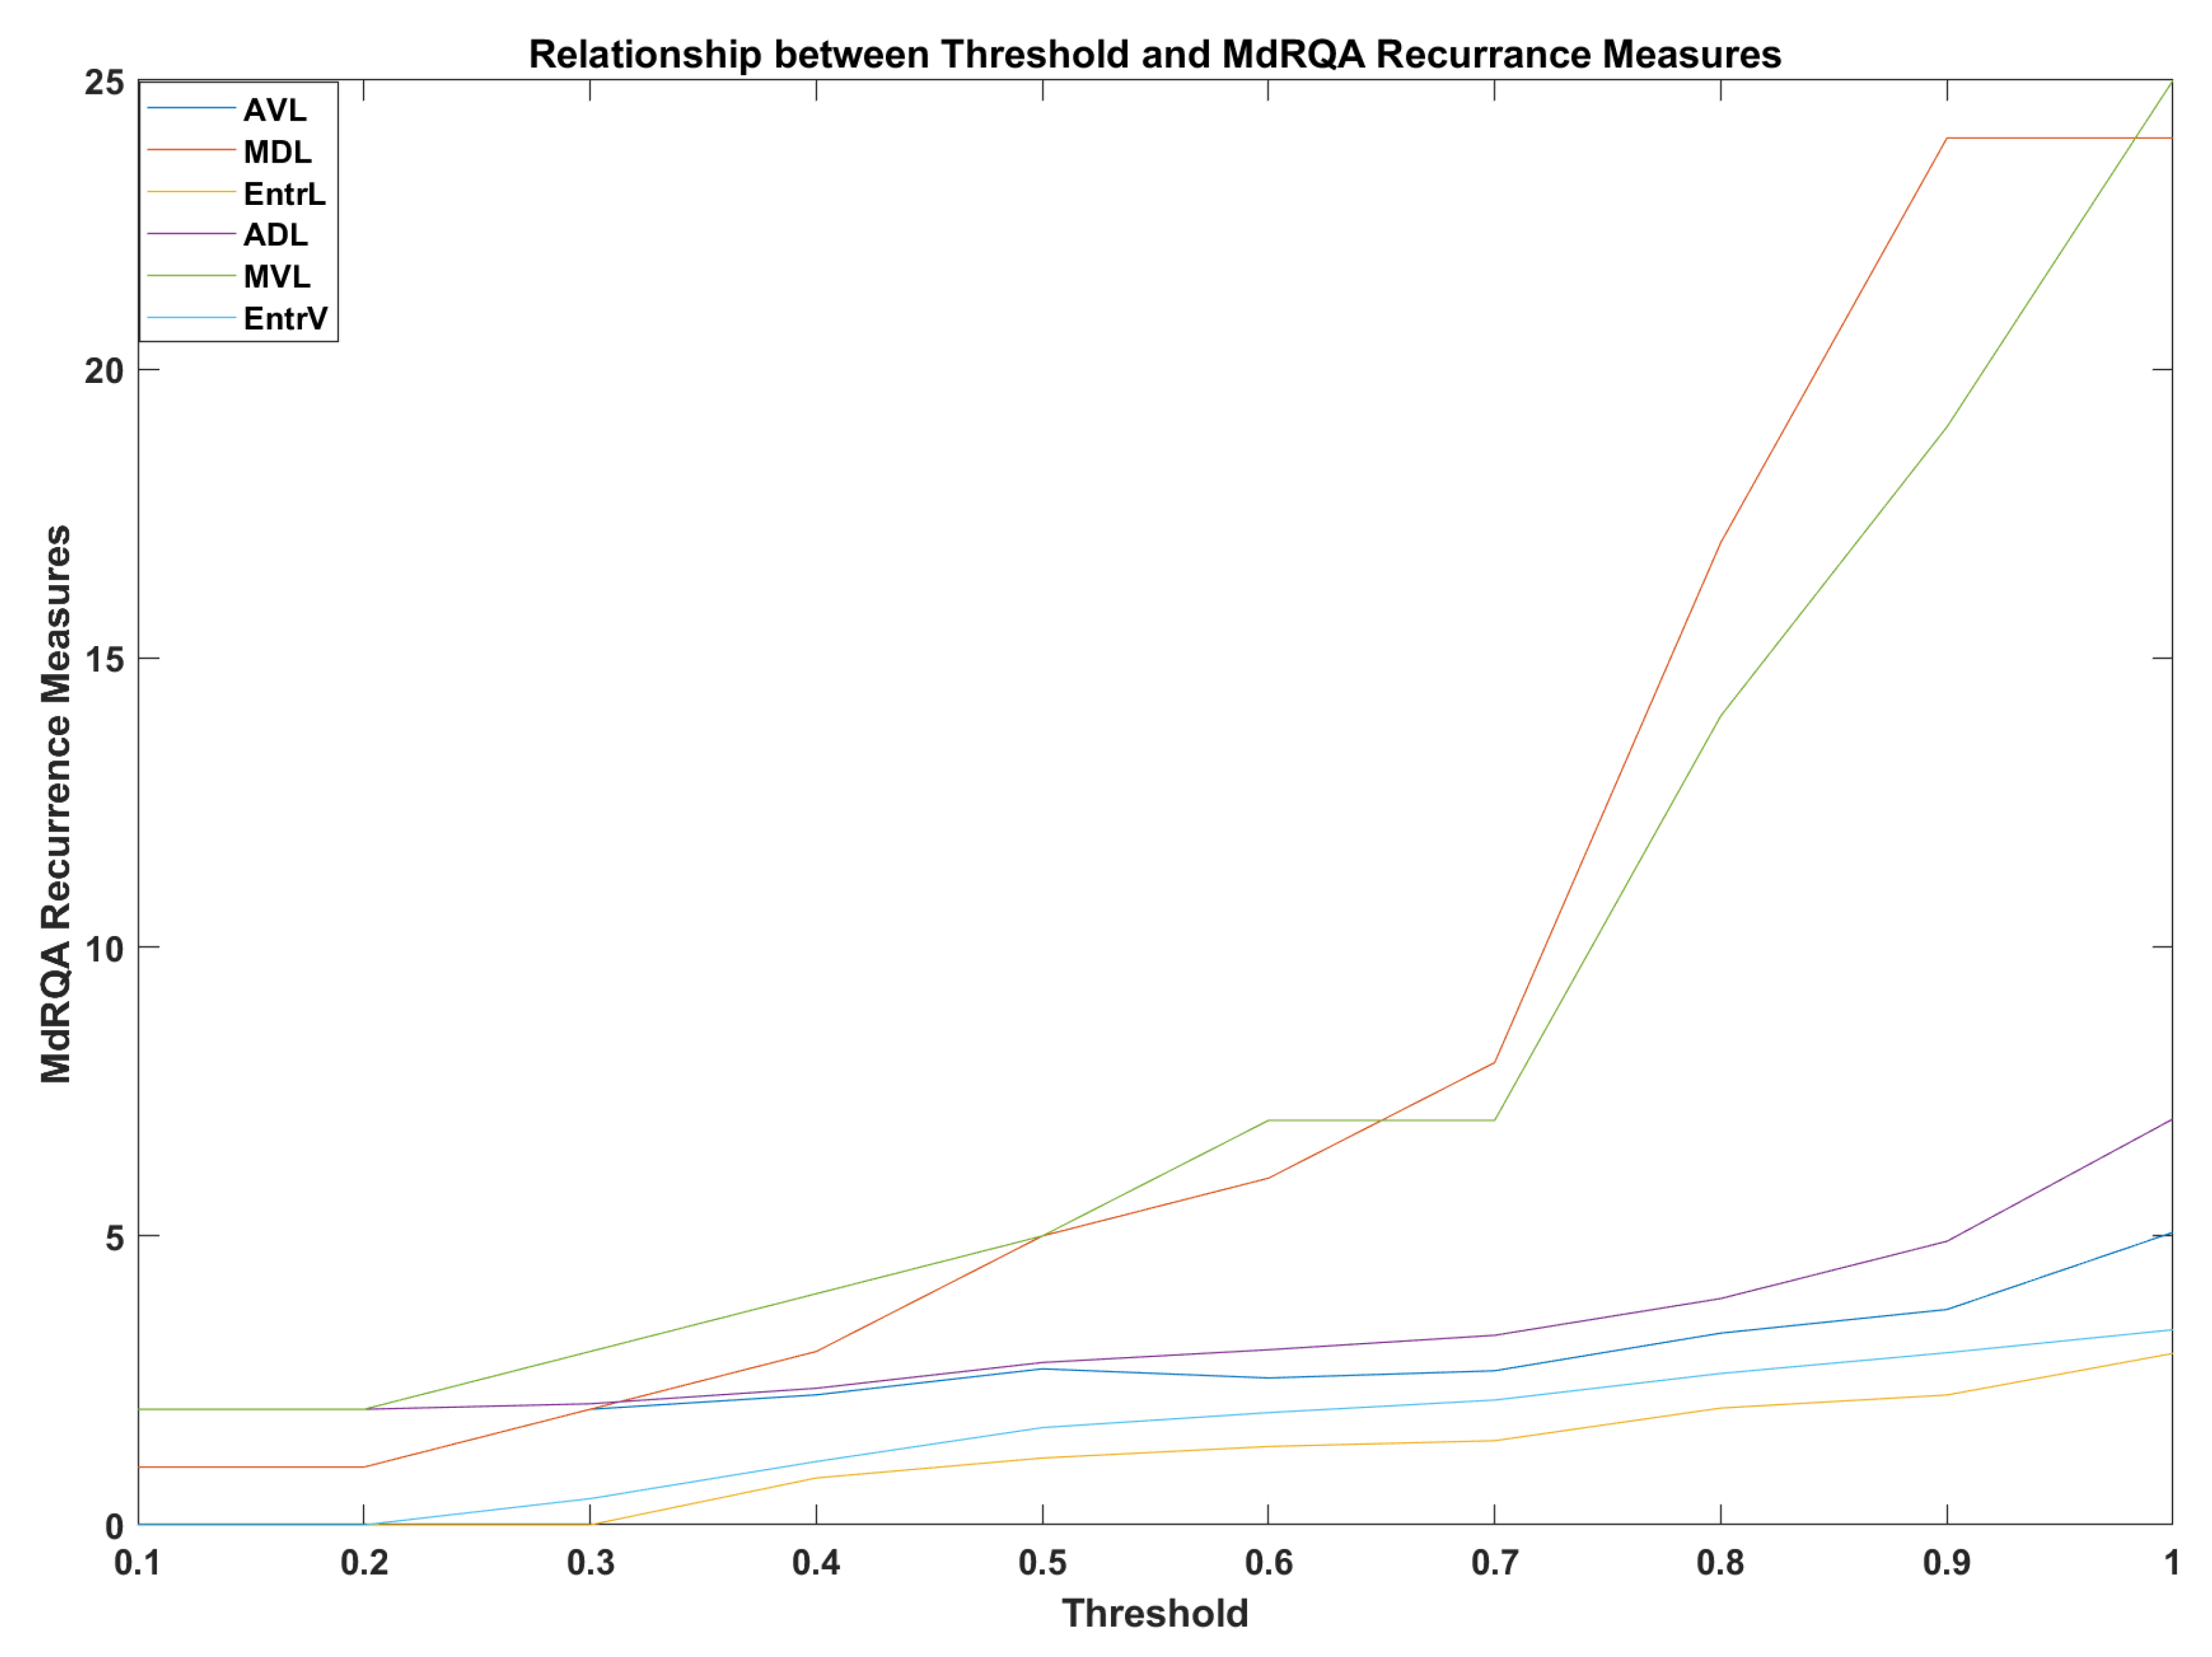
3.2.2. Multidimensional Recurrence Quantification Analysis (MdRQA)
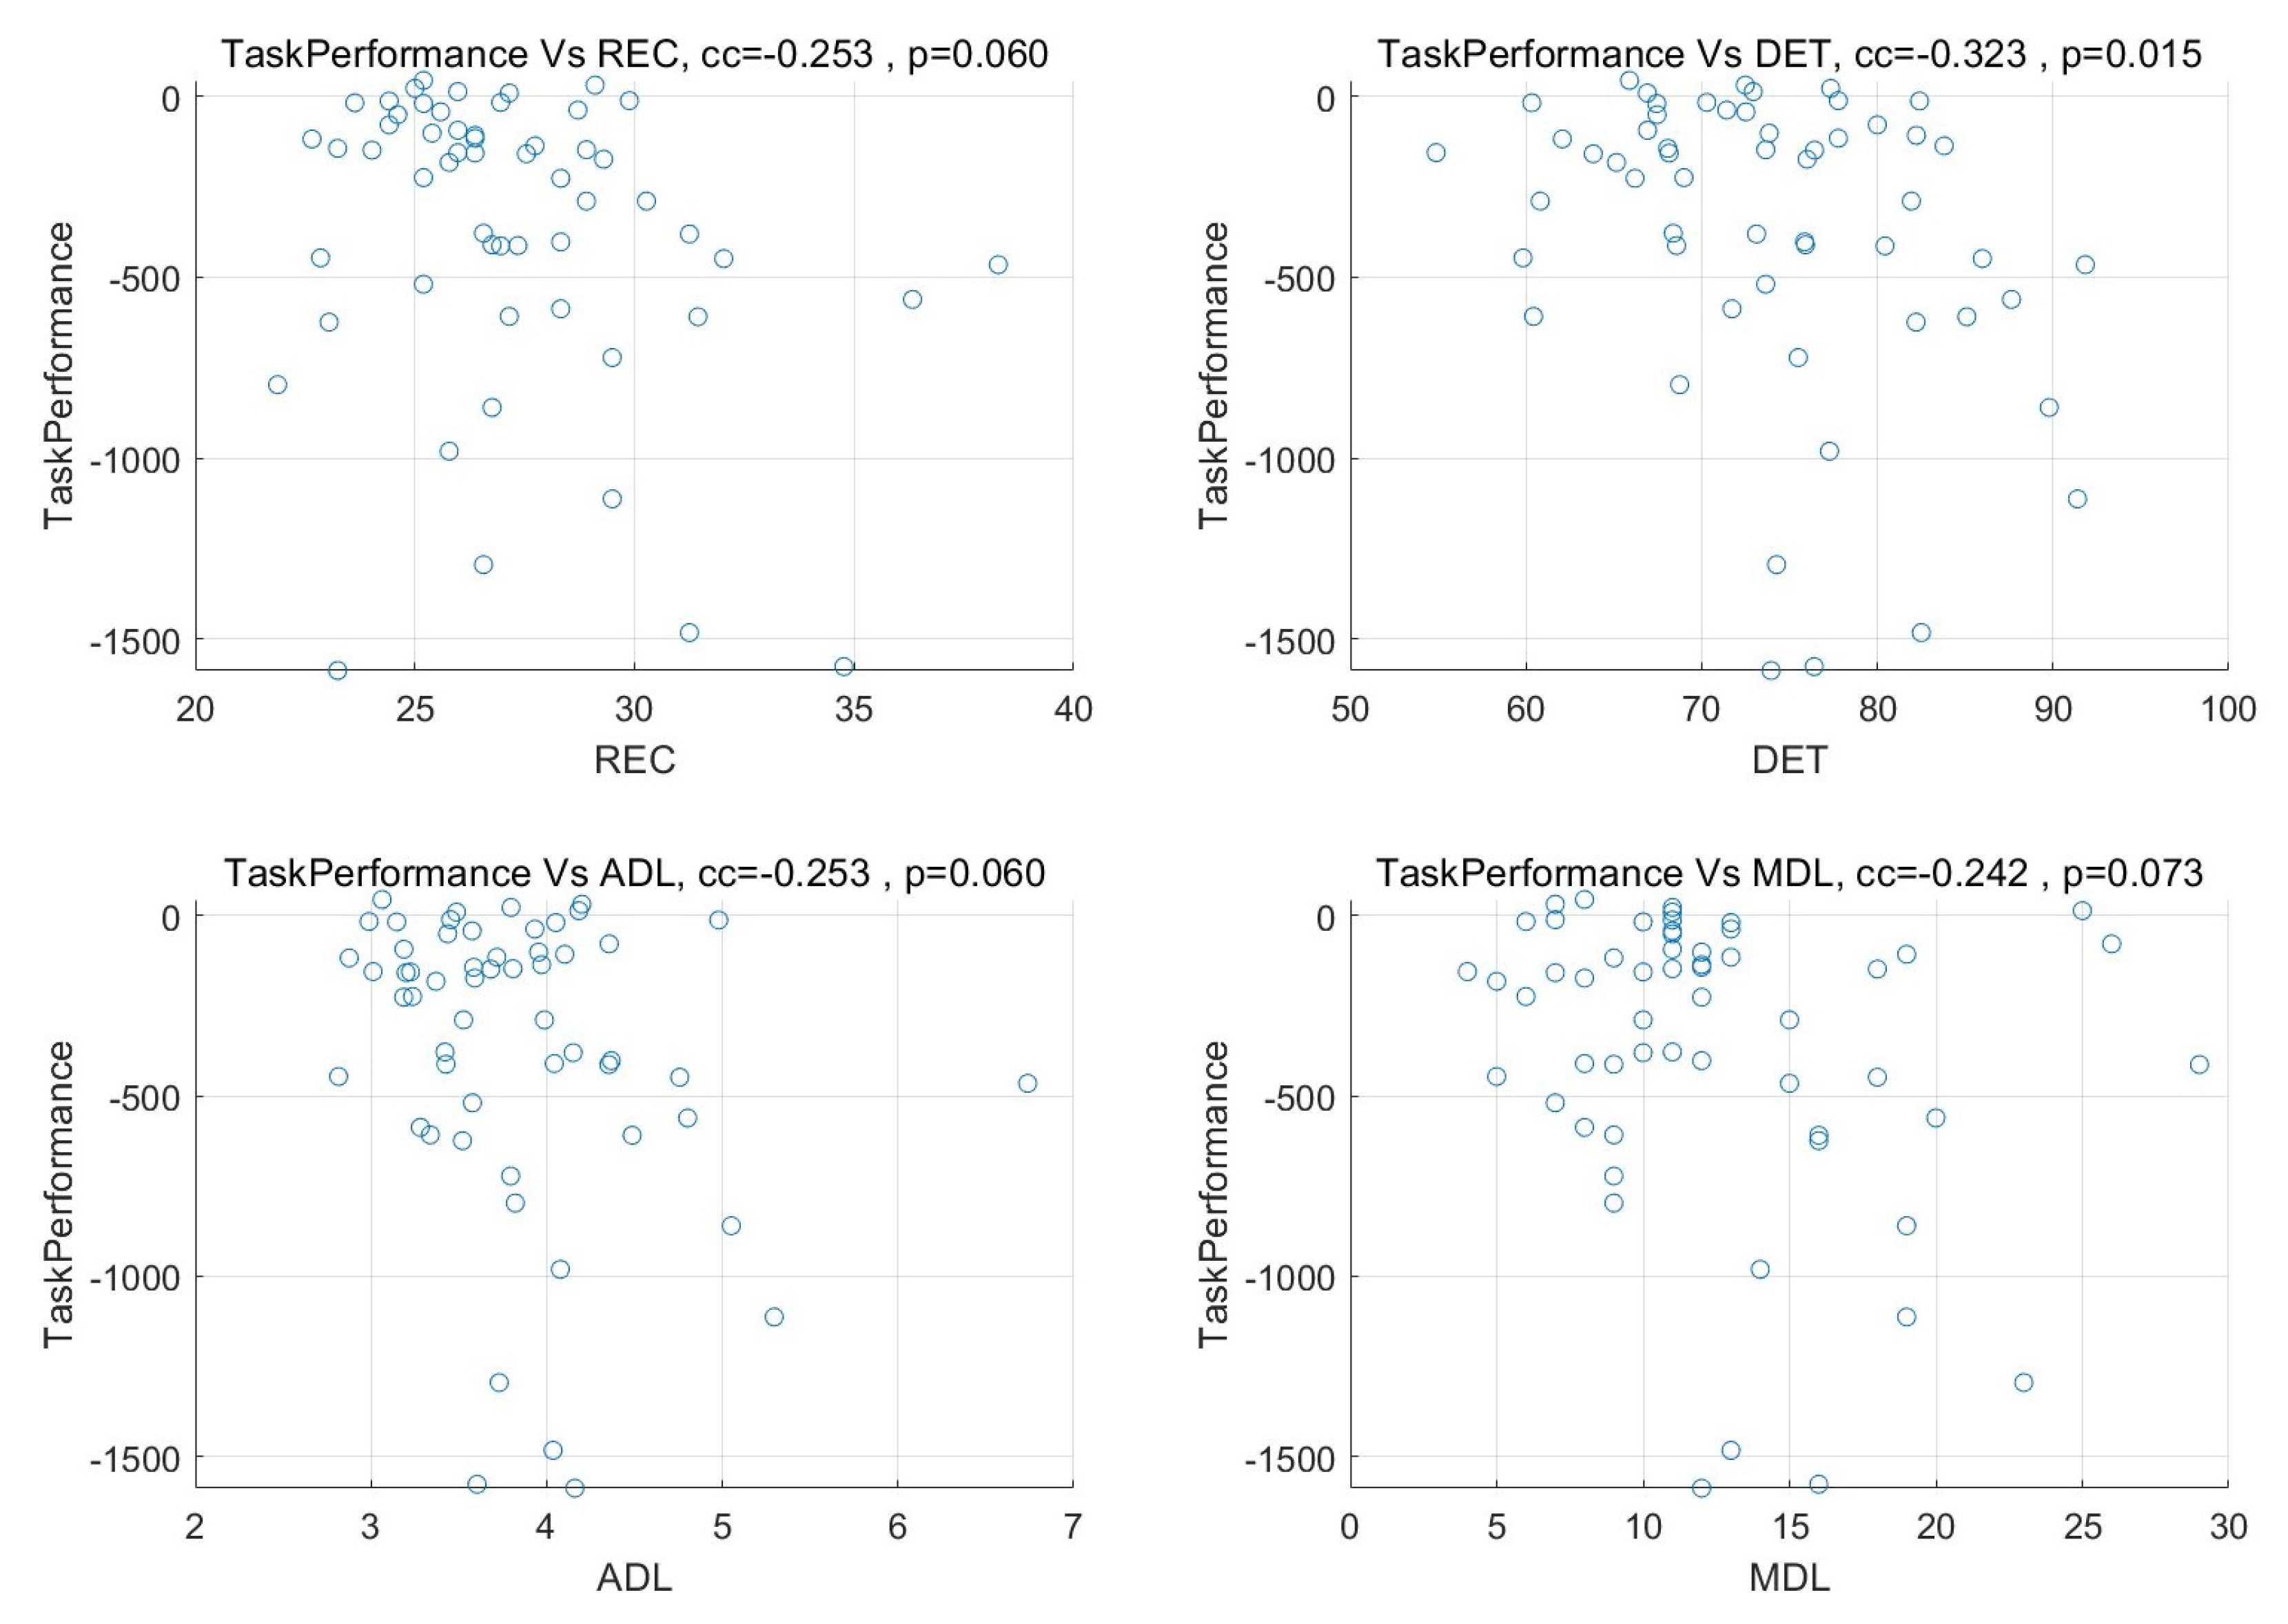
- Recurrence rate (REC)—a key metric in MdRQA that is used to measure the degree of recurrence in a time series. It is defined as the proportion of recurrent points in the phase space. A high recurrence rate indicates that many points in the phase space are recurrent, while a low recurrence rate indicates that few points are recurrent [28].
- Determinism (DET)—used to measure the degree of predictability in a time series. It is defined as the proportion of recurrent points that form diagonal lines in the recurrence plot. A high determinism indicates that the recurrent points form many diagonal lines, which suggests that the time series is highly predictable, while a low determinism indicates that the recurrent points form few diagonal lines, which suggests that the time series is less predictable [29,30].
- Average diagonal line (ADL)—used to measure the average length of diagonal lines in the recurrence plot. It is defined as the average number of points on a diagonal line in a recurrence plot. A high ADL indicates that the recurrent points form long diagonal lines, which suggests that the time series is highly predictable, while a low ADL indicates that the recurrent points form short diagonal lines, which suggests that the time series is less predictable [28,31].
- Maximum diagonal line (MDL)—used to measure the maximum length of diagonal lines in the recurrence plot. It is defined as the highest number of points on a diagonal line in a recurrence plot. A high MDL indicates that the recurrent points form long diagonal lines, which suggests that the time series is highly predictable, while a low MDL indicates that the recurrent points form short diagonal lines, which suggests that the time series is less predictable [28,30].
3.3. MdRQA Parameter Estimation
4. Statistical Analysis
5. Results
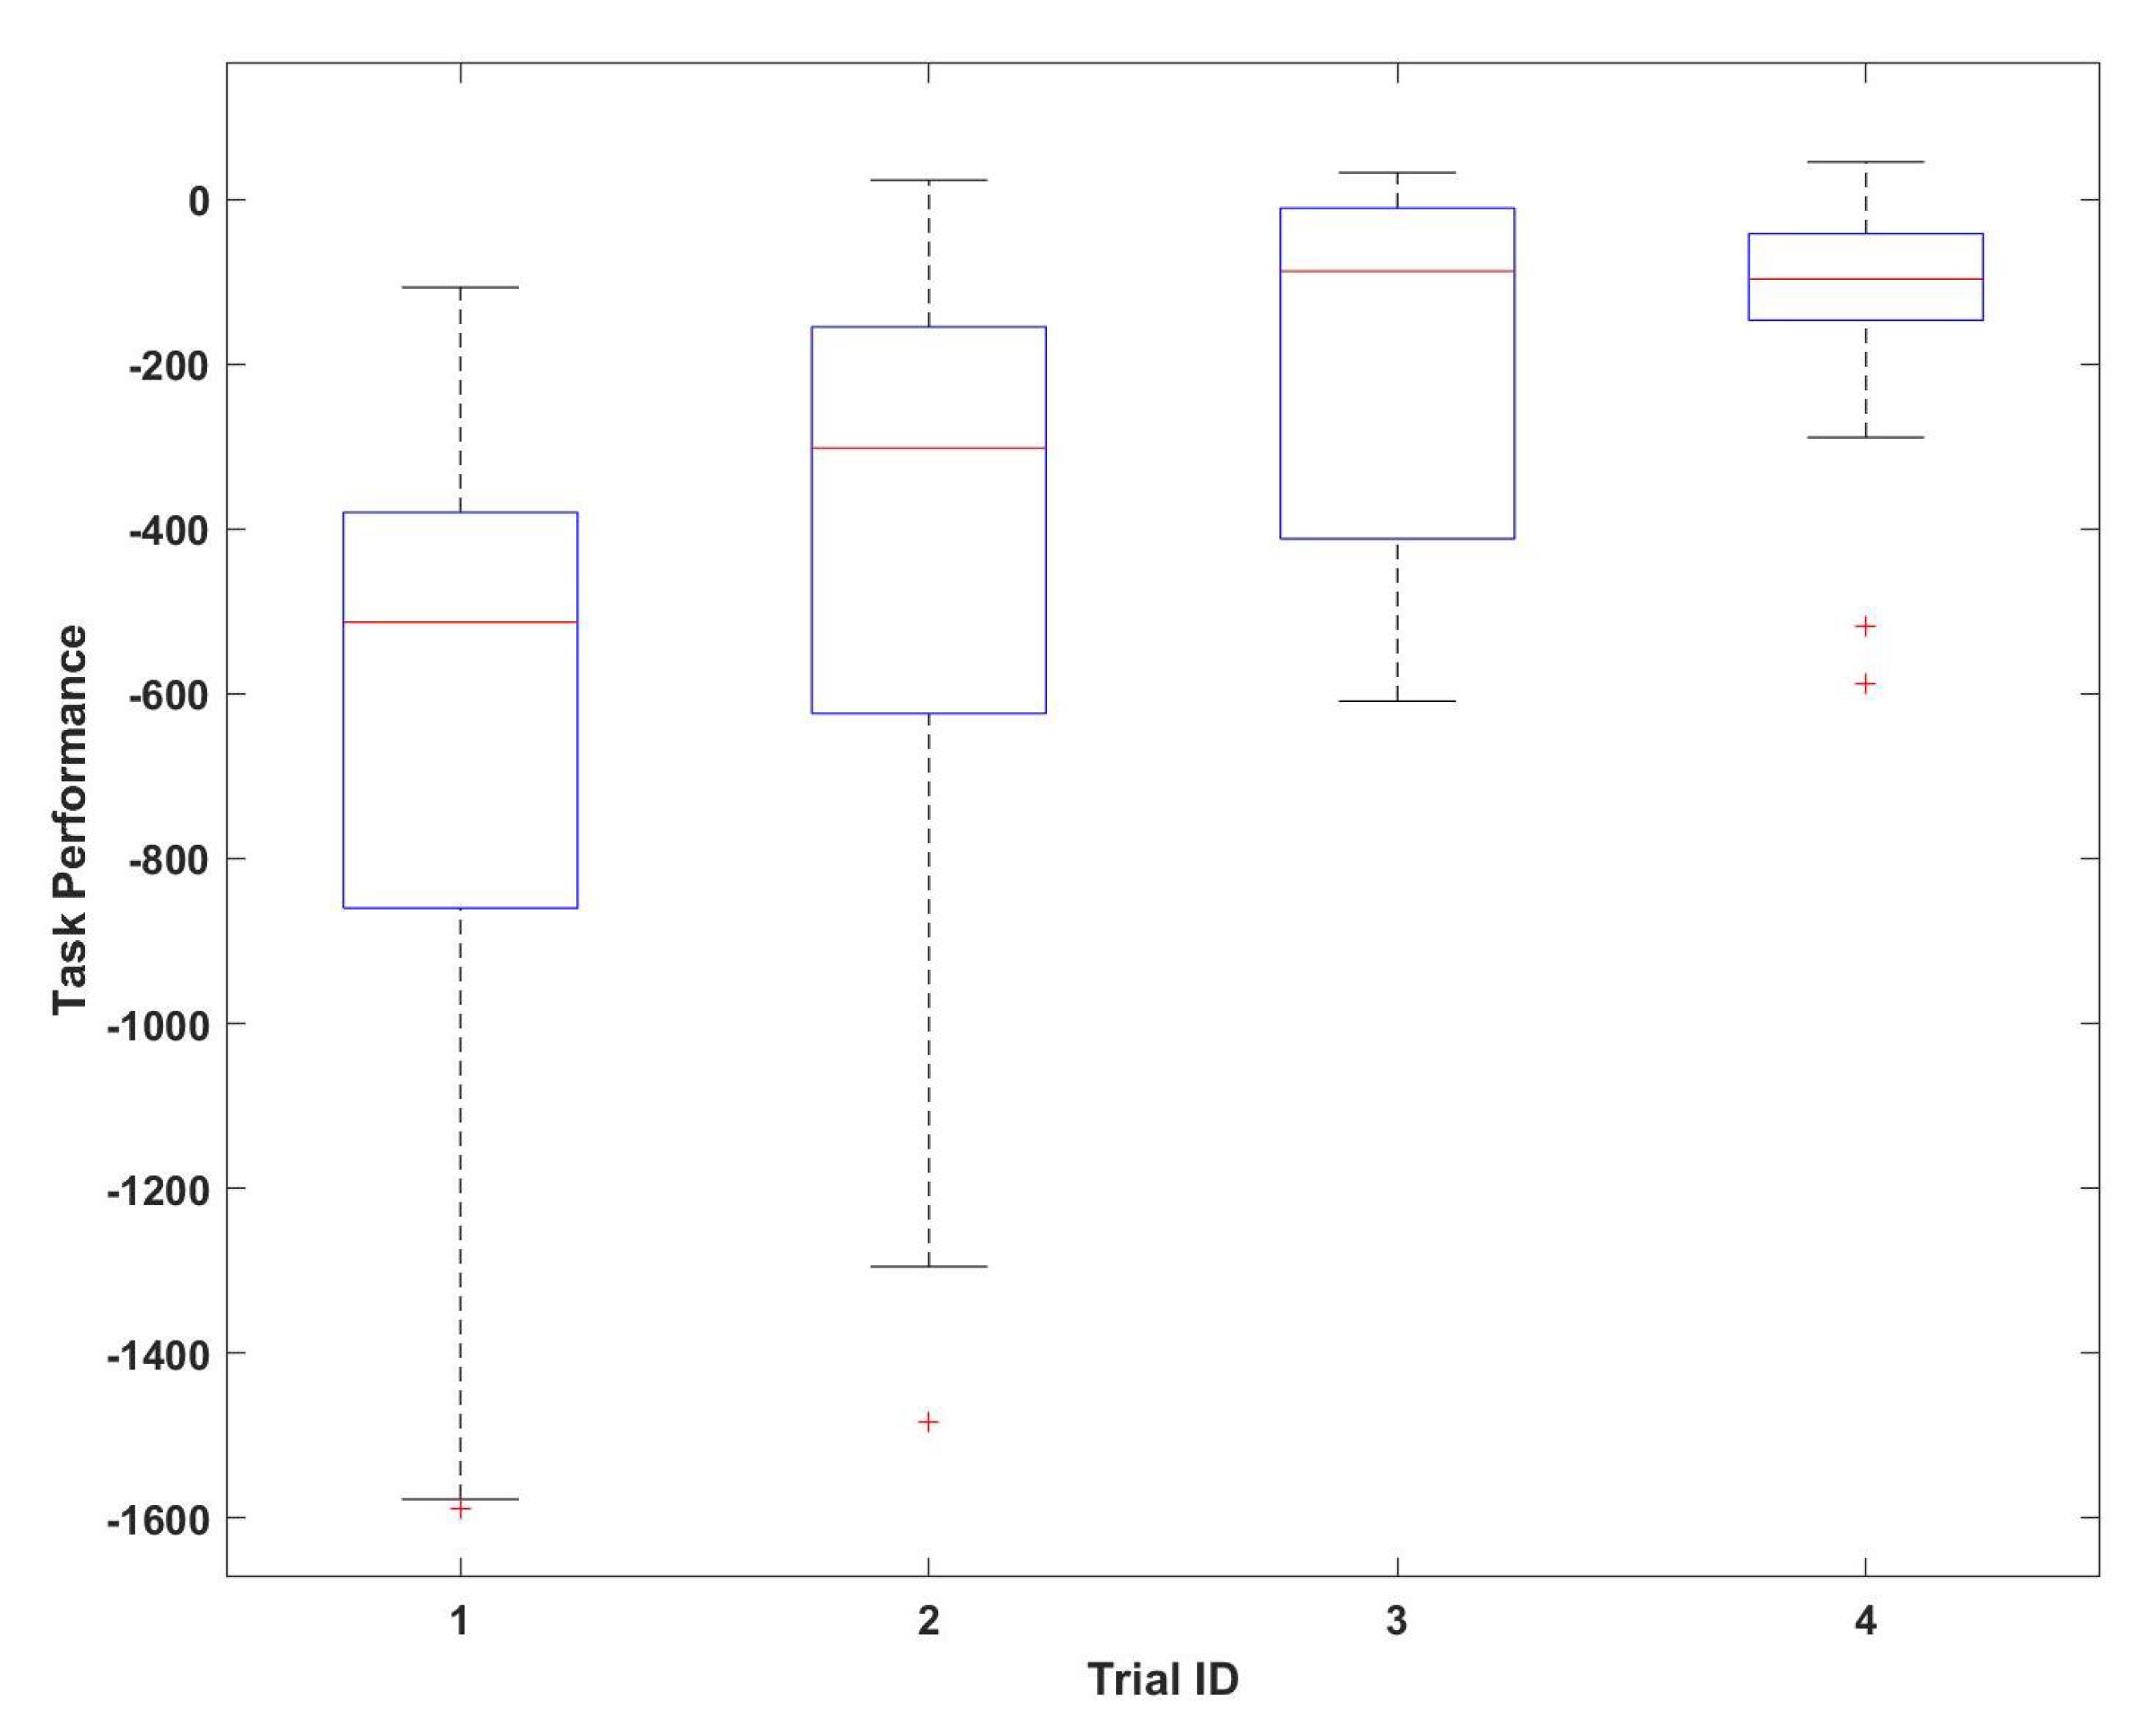
5.1. Relation between Synchrony and Task Performance
5.2. Relation between Synchrony and Subjective Measures
6. Discussion
7. Limitation and Future Work
8. Conclusions
Author Contributions
Funding
Institutional Review Board Statement
Informed Consent Statement
Data Availability Statement
Conflicts of Interest
Appendix A
| HRV Features | Fitted | Est | Std. Err | tStat | p-Value |
|---|---|---|---|---|---|
| DETmRR | Intercept | 76.6 | 6.84 | 11.19 | 0.00 |
| TD | 1.38 | 1.66 | 0.83 | 0.41 | |
| Perf | −0.73 | 0.957 | −0.76 | 0.45 | |
| Eff | −2.27 | 1.66 | −1.36 | 00.17 | |
| Frust | −0.35 | 0.811 | −0.43 | 0.66 | |
| MD | 1.44 | 1.34 | 1.07 | 0.28 | |
| ADLmRR | Intercept | 4.20 | 0.55 | 7.57 | 0.00 |
| TD | 0.043 | 0.13 | 0.31 | 0.75 | |
| Perf | −0.07 | 0.07 | −0.84 | 0.40 | |
| Eff | −0.06 | 0.13 | −0.48 | 0.63 | |
| Frust | −0.09 | 0.06 | −1.4 | 0.16 | |
| MD | 0.08 | 0.11 | 0.79 | 0.42 | |
| MDLmRR | Intercept | 13.65 | 4.44 | 3.07 | 0.00 |
| TD | 0.86 | 1.08 | 0.80 | 0.43 | |
| Perf | −0.19 | 0.62 | −0.31 | 0.75 | |
| Eff | −1.32 | 1.08 | −1.23 | 0.22 | |
| Frust | −0.26 | 0.53 | −0.49 | 0.62 | |
| MD | 0.67 | 0.87 | 0.76 | 0.45 | |
| DETSDNN | Intercept | 77.8 | 8.11 | 9.59 | 0.00 |
| TD | 0.9 | 1.97 | 0.46 | 0.65 | |
| Perf | −1.75 | 1.13 | −1.54 | 0.13 | |
| Eff | −1.99 | 1.97 | −1.01 | 0.31 | |
| Frust | 0.27 | 0.96 | 0.28 | 0.77 | |
| MD | 0.33 | 1.59 | 0.20 | 0.83 | |
| ADLSDNN | Intercept | 4.55 | 1.23 | 3.69 | 0.00 |
| TD | 0.16 | 0.30 | 0.53 | 0.59 | |
| Perf | −0.16 | 0.17 | −0.953 | 0.34 | |
| Eff | −0.13 | 0.29 | −0.45 | 0.64 | |
| Frust | −0.01 | 0.14 | −0.07 | 0.94 | |
| MD | −0.009 | 0.24 | −0.03 | 0.97 | |
| MDLSDNN | Intercept | 13.007 | 3.26 | 3.98 | 0.00 |
| TD | 0.31 | 0.79 | 0.39 | 0.69 | |
| Perf | −0.44 | 0.45 | −0.97 | 0.33 | |
| Eff | −1.79 | 0.79 | −2.25 | 0.03 ** | |
| Frust | 0.23 | 0.38 | 0.61 | 0.54 | |
| MD | 0.94 | 0.64 | 1.47 | 0.14 | |
| DETrMSSD | Intercept | 69.03 | 6.63 | 10.4 | 0.00 |
| TD | 2.07 | 1.61 | 1.28 | 0.21 | |
| Perf | −1.02 | 0.92 | −1.11 | 0.27 | |
| Eff | −1.33 | 1.61 | −0.82 | 0.41 | |
| Frust | −0.54 | 0.78 | −0.69 | 0.49 | |
| MD | 0.88 | 1.30 | 0.68 | 0.49 | |
| ADLrMSSD | Intercept | 3.84 | 1.042 | 3.68 | 0.00 |
| TD | 0.17 | 0.25 | 0.69 | 0.48 | |
| Perf | −0.07 | 0.15 | −0.54 | 0.58 | |
| Eff | −0.09 | 0.25 | −0.37 | 0.71 | |
| Frust | −0.04 | 0.123 | −0.35 | 0.72 | |
| MD | 0.01 | 0.20 | 0.05 | 0.96 | |
| MDLrMSSD | Intercept | 9.71 | 3.71 | 2.61 | 0.01 |
| TD | −0.13 | 0.91 | −0.15 | 0.87 | |
| Perf | −0.37 | 0.52 | −0.72 | 0.47 | |
| Eff | −1.11 | 0.90 | −1.23 | 0.22 | |
| Frust | −0.26 | 0.44 | −0.59 | 0.55 | |
| MD | 1.70 | 0.73 | 2.33 | 0.02 ** |
References
- Kazi, S.; Khaleghzadegan, S.; Dinh, J.V.; Shelhamer, M.J.; Sapirstein, A.; Goeddel, L.A.; Chime, N.O.; Salas, E.; Rosen, M.A. Team physiological dynamics: A critical review. Hum. Factors 2021, 63, 32–65. [Google Scholar] [CrossRef]
- Ekman, I.; Chanel, G.; Järvelä, S.; Kivikangas, J.M.; Salminen, M.; Ravaja, N. Social interaction in games: Measuring physiological linkage and social presence. Simul. Gaming 2012, 43, 321–338. [Google Scholar] [CrossRef]
- Järvelä, S.; Kivikangas, J.M.; Kätsyri, J.; Ravaja, N. Physiological linkage of dyadic gaming experience. Simul. Gaming 2014, 45, 24–40. [Google Scholar] [CrossRef]
- Palumbo, R.V.; Marraccini, M.E.; Weyandt, L.L.; Wilder-Smith, O.; McGee, H.A.; Liu, S.; Goodwin, M.S. Interpersonal autonomic physiology: A systematic review of the literature. Personal. Soc. Psychol. Rev. 2017, 21, 99–141. [Google Scholar] [CrossRef] [PubMed]
- Ahonen, L.; Cowley, B.U.; Hellas, A.; Puolamäki, K. Biosignals reflect pair-dynamics in collaborative work: EDA and ECG study of pair-programming in a classroom environment. Sci. Rep. 2018, 8, 1–16. [Google Scholar] [CrossRef] [PubMed]
- Ahonen, L.; Cowley, B.; Torniainen, J.; Ukkonen, A.; Vihavainen, A.; Puolamäki, K. Cognitive collaboration found in cardiac physiology: Study in classroom environment. PLoS ONE 2016, 11, e0159178. [Google Scholar] [CrossRef] [PubMed]
- Henning, R.A.; Boucsein, W.; Gil, M.C. Social–physiological compliance as a determinant of team performance. Int. J. Psychophysiol. 2001, 40, 221–232. [Google Scholar] [CrossRef] [PubMed]
- Elkins, A.N.; Muth, E.R.; Hoover, A.W.; Walker, A.D.; Carpenter, T.L.; Switzer, F.S. Physiological compliance and team performance. Appl. Ergon. 2009, 40, 997–1003. [Google Scholar] [CrossRef]
- Strang, A.J.; Funke, G.J.; Russell, S.M.; Dukes, A.W.; Middendorf, M.S. Physio-behavioral coupling in a cooperative team task: Contributors and relations. J. Exp. Psychol. Hum. Percept. Perform. 2014, 40, 145. [Google Scholar] [CrossRef]
- Veerabhadrappa, R.; Hettiarachchi, I.T.; Bhatti, A. Using Recurrence Quantification Analysis to Quantify the Physiological Synchrony in Dyadic ECG Data. In Proceedings of the 2021 IEEE International Systems Conference (SysCon), Vancouver, BC, Canada, 15 April–15 May 2021; pp. 1–8. [Google Scholar]
- Moreland, R.L. Are dyads really groups? Small Group Res. 2010, 41, 251–267. [Google Scholar] [CrossRef]
- Dindar, M.; Järvelä, S.; Haataja, E. What does physiological synchrony reveal about metacognitive experiences and group performance? Br. J. Educ. Technol. 2020, 51, 1577–1596. [Google Scholar] [CrossRef]
- Mønster, D.; Håkonsson, D.D.; Eskildsen, J.K.; Wallot, S. Physiological evidence of interpersonal dynamics in a cooperative production task. Physiol. Behav. 2016, 156, 24–34. [Google Scholar] [CrossRef]
- Baranowski-Pinto, G.; Profeta, V.; Newson, M.; Whitehouse, H.; Xygalatas, D. Being in a crowd bonds people via physiological synchrony. Sci. Rep. 2022, 12, 1–10. [Google Scholar] [CrossRef]
- Algumaei, M.; Hettiarachchi, I.; Veerabhadrappa, R.; Bhatti, A. Physiological Compliance during a Three Member Collaborative Computer Task. In Proceedings of the 2022 IEEE International Conference on Systems, Man, and Cybernetics (SMC), Prague, Czech Republic, 9–12 October 2022; pp. 3348–3353. [Google Scholar]
- Fusaroli, R.; Bjørndahl, J.S.; Roepstorff, A.; Tylén, K. A heart for interaction: Shared physiological dynamics and behavioral coordination in a collective, creative construction task. J. Exp. Psychol. Hum. Percept. Perform. 2016, 42, 1297. [Google Scholar] [CrossRef] [PubMed]
- Gordon, I.; Wallot, S.; Berson, Y. Group-level physiological synchrony and individual-level anxiety predict positive affective behaviors during a group decision-making task. Psychophysiology 2021, 58, e13857. [Google Scholar] [CrossRef] [PubMed]
- Hart, S.G.; Staveland, L.E. Development of NASA-TLX (Task Load Index): Results of empirical and theoretical research. In Advances in Psychology; Elsevier: Amsterdam, The Netherlands, 1988; Volume 52, pp. 139–183. [Google Scholar]
- Veerabhadrappa, R.; Hettiarachchi, I.T.; Bhatti, A. Gaze Convergence Based Collaborative Performance Prediction in a 3-Member Joint Activity Setting. In Proceedings of the 2022 IEEE International Systems Conference (SysCon), Montreal, QC, Canada, 25–28 April 2022; pp. 1–7. [Google Scholar]
- Veerabhadrappa, R.; Hettiarachchi, I.T.; Bhatti, A. Using Eye-tracking To Investigate The Effect of Gaze Co-occurrence and Distribution on Collaborative Performance. In Proceedings of the 2022 IEEE International Systems Conference (SysCon), Montreal, QC, Canada, 25–28 April 2022; pp. 1–8. [Google Scholar]
- Polar H10 Heart Rate Monitor + Chest Strap—Black. Available online: https://www.polar.com/au-en/sensors/h10-heart-rate-sensor/ (accessed on 20 March 2021).
- Hettiarachchi, I.T.; Hanoun, S.; Nahavandi, D.; Nahavandi, S. Validation of Polar OH1 optical heart rate sensor for moderate and high intensity physical activities. PLoS ONE 2019, 14, e0217288. [Google Scholar] [CrossRef] [PubMed]
- Bartels, R.; Neumamm, L.; Peçanha, T.; Carvalho, A.R.S. SinusCor: An advanced tool for heart rate variability analysis. Biomed. Eng. Online 2017, 16, 1–15. [Google Scholar] [CrossRef]
- Smith, A.L.; Owen, H.; Reynolds, K.J. Heart rate variability indices for very short-term (30 beat) analysis. Part 1: Survey and toolbox. J. Clin. Monit. Comput. 2013, 27, 569–576. [Google Scholar] [CrossRef]
- Taelman, J.; Vandeput, S.; Spaepen, A.; Van Huffel, S. Influence of mental stress on heart rate and heart rate variability. In Proceedings of the 4th European Conference of the International Federation for Medical and Biological Engineering, Antwerp, Belgium, 23–27 November 2008; Springer: Berlin/Heidelberg, Germany, 2009; pp. 1366–1369. [Google Scholar]
- Camm, A.J.; Malik, M.; Bigger, J.T.; Breithardt, G.; Cerutti, S.; Cohen, R.J.; Coumel, P.; Fallen, E.L.; Kennedy, H.L.; Kleiger, R.; et al. Heart rate variability. Standards of measurement, physiological interpretation, and clinical use. Circulation 1996, 93, 1043–1065. [Google Scholar]
- Hill, S.G.; Iavecchia, H.P.; Byers, J.C.; Bittner, A.C., Jr.; Zaklade, A.L.; Christ, R.E. Comparison of four subjective workload rating scales. Hum. Factors 1992, 34, 429–439. [Google Scholar] [CrossRef]
- Marwan, N.; Romano, M.C.; Thiel, M.; Kurths, J. Recurrence plots for the analysis of complex systems. Phys. Rep. 2007, 438, 237–329. [Google Scholar] [CrossRef]
- Wallot, S.; Roepstorff, A.; Mønster, D. Multidimensional Recurrence Quantification Analysis (MdRQA) for the analysis of multidimensional time-series: A software implementation in MATLAB and its application to group-level data in joint action. Front. Psychol. 2016, 183. [Google Scholar] [CrossRef] [PubMed]
- Donner, R.V.; Small, M.; Donges, J.F.; Marwan, N.; Zou, Y.; Xiang, R.; Kurths, J. Recurrence-based time series analysis by means of complex network methods. Int. J. Bifurc. Chaos 2011, 21, 1019–1046. [Google Scholar] [CrossRef]
- UR Data. Nonlinear Dynamical Systems Analysis for the Behavioral Sciences Using Real Data; CRC Press: Boca Raton, FL, USA, 2011. [Google Scholar]
- Wallot, S.; Mønster, D. Calculation of average mutual information (AMI) and false-nearest neighbors (FNN) for the estimation of embedding parameters of multidimensional time series in matlab. Front. Psychol. 2018, 9, 1679. [Google Scholar] [CrossRef] [PubMed]
- Raaijmakers, S.F.; Baars, M.; Schaap, L.; Paas, F.; Van Gog, T. Effects of performance feedback valence on perceptions of invested mental effort. Learn. Instr. 2017, 51, 36–46. [Google Scholar] [CrossRef]
- Stickel, C.; Ebner, M.; Steinbach-Nordmann, S.; Searle, G.; Holzinger, A. Emotion detection: Application of the valence arousal space for rapid biological usability testing to enhance universal access. In Proceedings of the Universal Access in Human-Computer Interaction. Addressing Diversity: 5th International Conference, UAHCI 2009, Held as Part of HCI International 2009, San Diego, CA, USA, 19–24 July 2009; Proceedings, Part I 5. Springer: Berlin/Heidelberg, Germany, 2009; pp. 615–624. [Google Scholar]
- Wallot, S.; Mitkidis, P.; McGraw, J.J.; Roepstorff, A. Beyond synchrony: Joint action in a complex production task reveals beneficial effects of decreased interpersonal synchrony. PLoS ONE 2016, 11, e0168306. [Google Scholar] [CrossRef]


| mRR | SDNN | rMSSD | |
|---|---|---|---|
| Measures | Task Performance | Task Performance | Task Performance |
| REC | −0.253 * | −0.195 | 0.004 |
| DET | −0.323 ** | −0.324 ** | −0.213 |
| ADL | −0.253 * | −0.119 | −0.090 |
| MDL | −0.242 * | −0.413 ** | −0.113 |
| CC | −0.075 | −0.095 | 0.081 |
| HRV Feature | Fitted | adjR2 | Est | Std. Err | tStat | p-Value |
|---|---|---|---|---|---|---|
| REC | 0.05 | −32.14 | 16.73 | −1.92 | 0.06 * | |
| DET | 0.09 | −15.98 | 6.36 | −2.51 | 0.01 ** | |
| mRR | ADL | 0.05 | −153.32 | 79.93 | −1.92 | 0.06 * |
| MDL | 0.04 | −18.63 | 10.17 | −1.83 | 0.07 * | |
| CC | −0.01 | −159.5 | 290.03 | −0.55 | 0.58 | |
| REC | 0.15 | −23.55 | 16.11 | −1.46 | 0.14 | |
| DET | 0.09 | −13.38 | 5.31 | −2.52 | 0.01 ** | |
| SDNN | ADL | −0.004 | −33.38 | 37.83 | −0.88 | 0.38 |
| MDL | 0.2 | −40.89 | 12.26 | −3.33 | 0.001 ** | |
| CC | −0.009 | −186.87 | 265.7 | −0.70 | 0.48 | |
| REC | −0.02 | 0.462 | 15.10 | 0.03 | 0.97 | |
| DET | 0.03 | −10.76 | 6.72 | −1.60 | 0.11 | |
| rMSSD | ADL | −0.01 | −29.78 | 45.08 | −0.66 | 0.51 |
| MDL | −0.006 | −9.95 | 11.96 | −0.83 | 0.40 | |
| CC | −0.01 | 198.86 | 333.21 | 0.59 | 0.55 |
| HRV Features | Fitted | Est | Std. Err | tStat | p-Value |
|---|---|---|---|---|---|
| RECmRR | Intercept | 28.57 | 2.47 | 11.5 | 0.00 |
| TD | 0.66 | 0.60 | 1.10 | 0.27 | |
| Perf | −0.71 | 0.34 | −2.07 | 0.04 ** | |
| Eff | 0.64 | 0.60 | 1.07 | 0.28 | |
| Frust | −0.57 | 0.29 | −1.95 | 0.05 * | |
| MD | −0.30 | 0.48 | −0.63 | 0.53 | |
| RECSDNN | Intercept | 31.66 | 2.64 | 11.97 | 0.00 |
| TD | 1.20 | 0.64 | 1.86 | 0.06 * | |
| Perf | −0.82 | 0.369 | −2.22 | 0.03 ** | |
| Eff | −1.04 | 0.64 | −1.61 | 0.11 | |
| Frust | −0.04 | 0.31 | −0.14 | 0.88 | |
| MD | −0.04 | 0.52 | −0.07 | 0.94 | |
| RECrMSSD | Intercept | 24.6 | 3.11 | 7.90 | 0.00 |
| TD | 0.60 | 0.75 | 0.79 | 0.42 | |
| Perf | 0.034 | 0.435 | 0.078 | 0.93 | |
| Eff | −0.64 | 0.75 | −0.85 | 0.39 | |
| Frust | 0.18 | 0.369 | 0.497 | 0.62 | |
| MD | 0.25 | 0.612 | 0.41 | 0.67 | |
| CCmRR | Intercept | 0.09 | 0.15 | 0.62 | 0.53 |
| TD | 0.06 | 0.036 | 1.78 | 0.08 * | |
| Perf | 0.01 | 0.02 | 0.84 | 0.4 | |
| Eff | −0.03 | 0.03 | −0.82 | 0.41 | |
| Frust | −0.04 | 0.017 | −2.36 | 0.02 ** | |
| MD | −0.02 | 0.029 | −0.7 | 0.48 | |
| CCSDNN | Intercept | 0.19 | 0.17 | 1.11 | 0.27 |
| TD | 0.07 | 0.04 | 1.9 | 0.06 * | |
| Perf | −0.02 | 0.023 | −0.84 | 0.4 | |
| Eff | −0.03 | 0.04 | −0.85 | 0.39 | |
| Frust | −0.01 | 0.02 | −0.66 | 0.5 | |
| MD | −0.01 | 0.03 | −0.55 | 0.58 | |
| CCrMSSD | Intercept | 0.016 | 0.13 | 0.12 | 0.90 |
| TD | 0.01 | 0.032 | 0.43 | 0.66 | |
| Perf | −0.0007 | 0.01 | −0.04 | 0.96 | |
| Eff | 0.02 | 0.03 | 0.91 | 0.36 | |
| Frust | −0.03 | 0.01 | −2.21 | 0.03 ** | |
| MD | −0.01 | 0.02 | −0.55 | 0.58 |
Disclaimer/Publisher’s Note: The statements, opinions and data contained in all publications are solely those of the individual author(s) and contributor(s) and not of MDPI and/or the editor(s). MDPI and/or the editor(s) disclaim responsibility for any injury to people or property resulting from any ideas, methods, instructions or products referred to in the content. |
© 2023 by the authors. Licensee MDPI, Basel, Switzerland. This article is an open access article distributed under the terms and conditions of the Creative Commons Attribution (CC BY) license (https://creativecommons.org/licenses/by/4.0/).
Share and Cite
Algumaei, M.; Hettiarachchi, I.; Veerabhadrappa, R.; Bhatti, A. Physiological Synchrony Predict Task Performance and Negative Emotional State during a Three-Member Collaborative Task. Sensors 2023, 23, 2268. https://doi.org/10.3390/s23042268
Algumaei M, Hettiarachchi I, Veerabhadrappa R, Bhatti A. Physiological Synchrony Predict Task Performance and Negative Emotional State during a Three-Member Collaborative Task. Sensors. 2023; 23(4):2268. https://doi.org/10.3390/s23042268
Chicago/Turabian StyleAlgumaei, Mohammed, Imali Hettiarachchi, Rakesh Veerabhadrappa, and Asim Bhatti. 2023. "Physiological Synchrony Predict Task Performance and Negative Emotional State during a Three-Member Collaborative Task" Sensors 23, no. 4: 2268. https://doi.org/10.3390/s23042268
APA StyleAlgumaei, M., Hettiarachchi, I., Veerabhadrappa, R., & Bhatti, A. (2023). Physiological Synchrony Predict Task Performance and Negative Emotional State during a Three-Member Collaborative Task. Sensors, 23(4), 2268. https://doi.org/10.3390/s23042268


