


System and Method for Driver Drowsiness Detection Using Behavioral and Sensor-Based Physiological Measures
 , ,
, , 
 and
and 
Abstract
1. Introduction
2. Background
2.1. Drowsiness
2.2. Driver Drowsiness Detection Measures
- Subjective measures (SM)
- Vehicle-based measures (VBM)
- Physiological measures (PM)
- Behavioral measures (BM)
- Hybrid measures (HM)
3. Materials and Methods
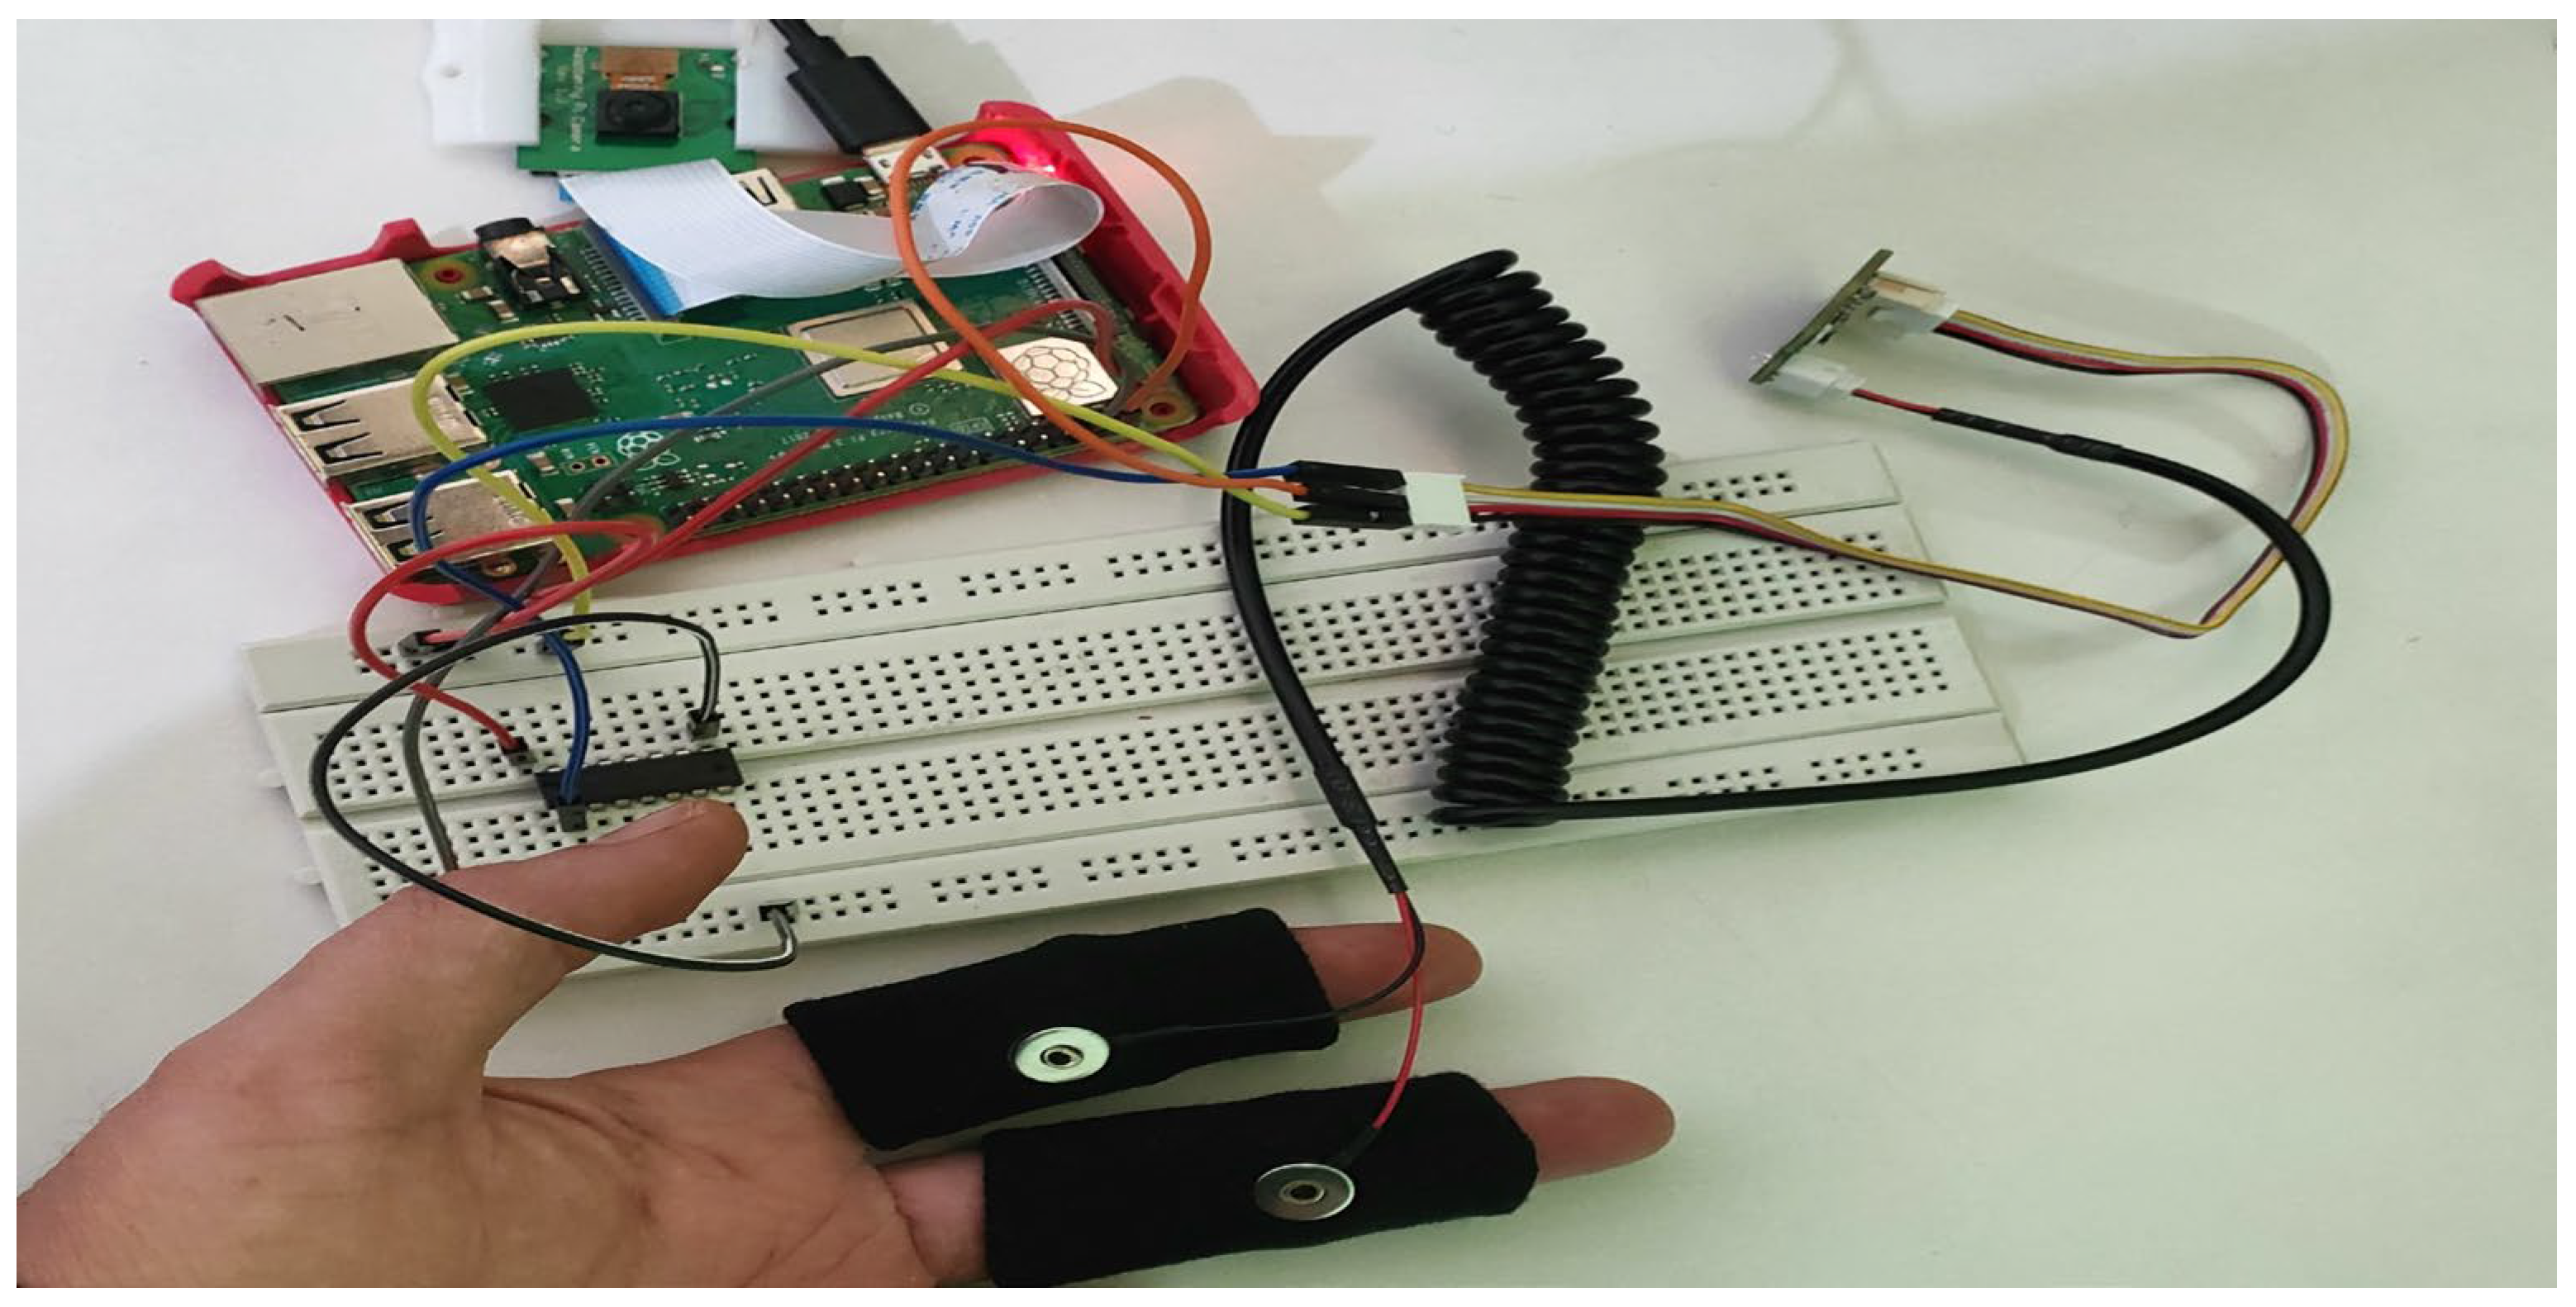
3.1. Hardware Requirements
- Raspberry Pi 3 B+
- Pi Camera v2 8 MP
- GSR Sensor
- Analog-to-digital converter
3.2. Face Detection Techniques
- OpenCV Haar Cascade
- Davis King library (Dlib)
- Multi-task Cascaded Convolutional Neural Network (MTCNN)
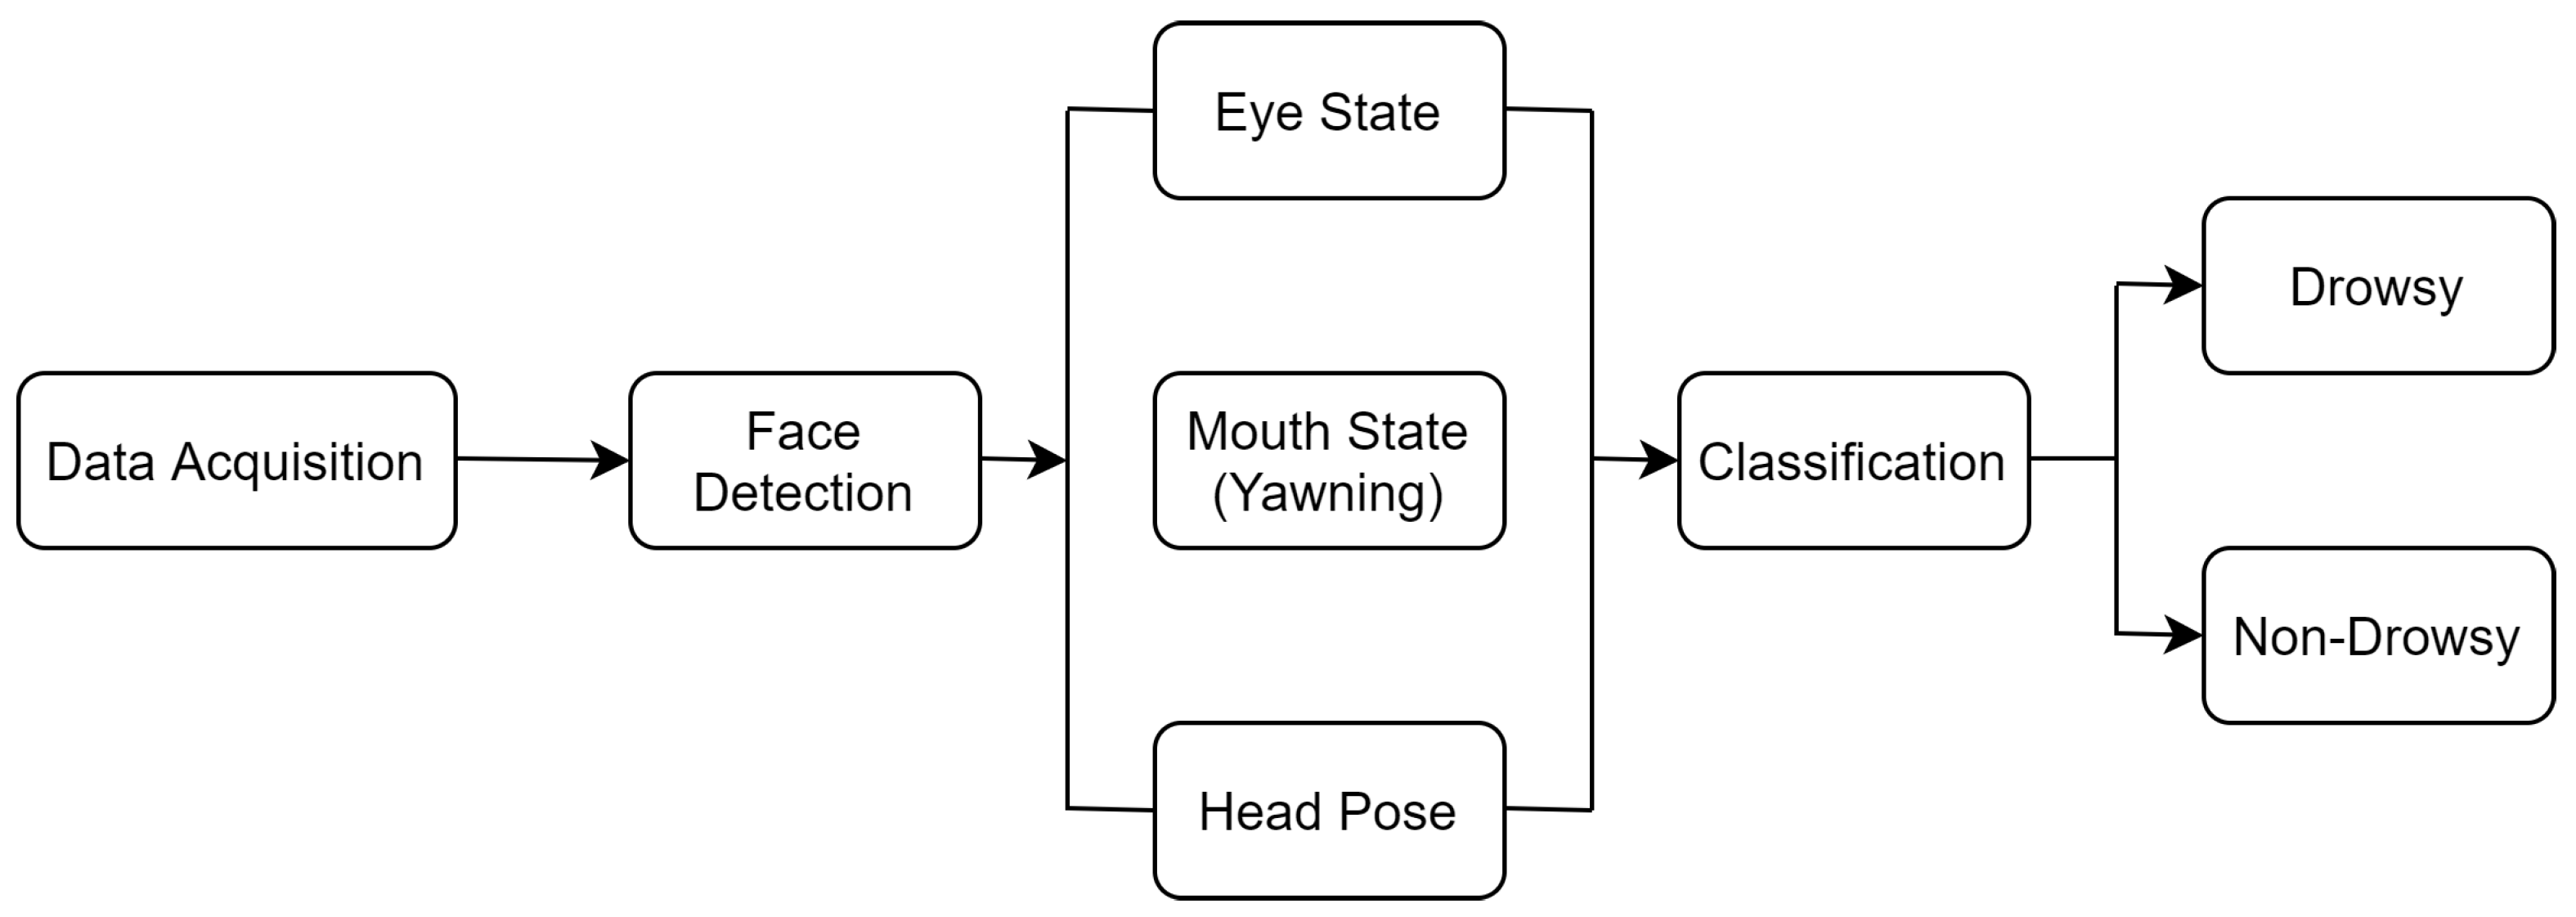
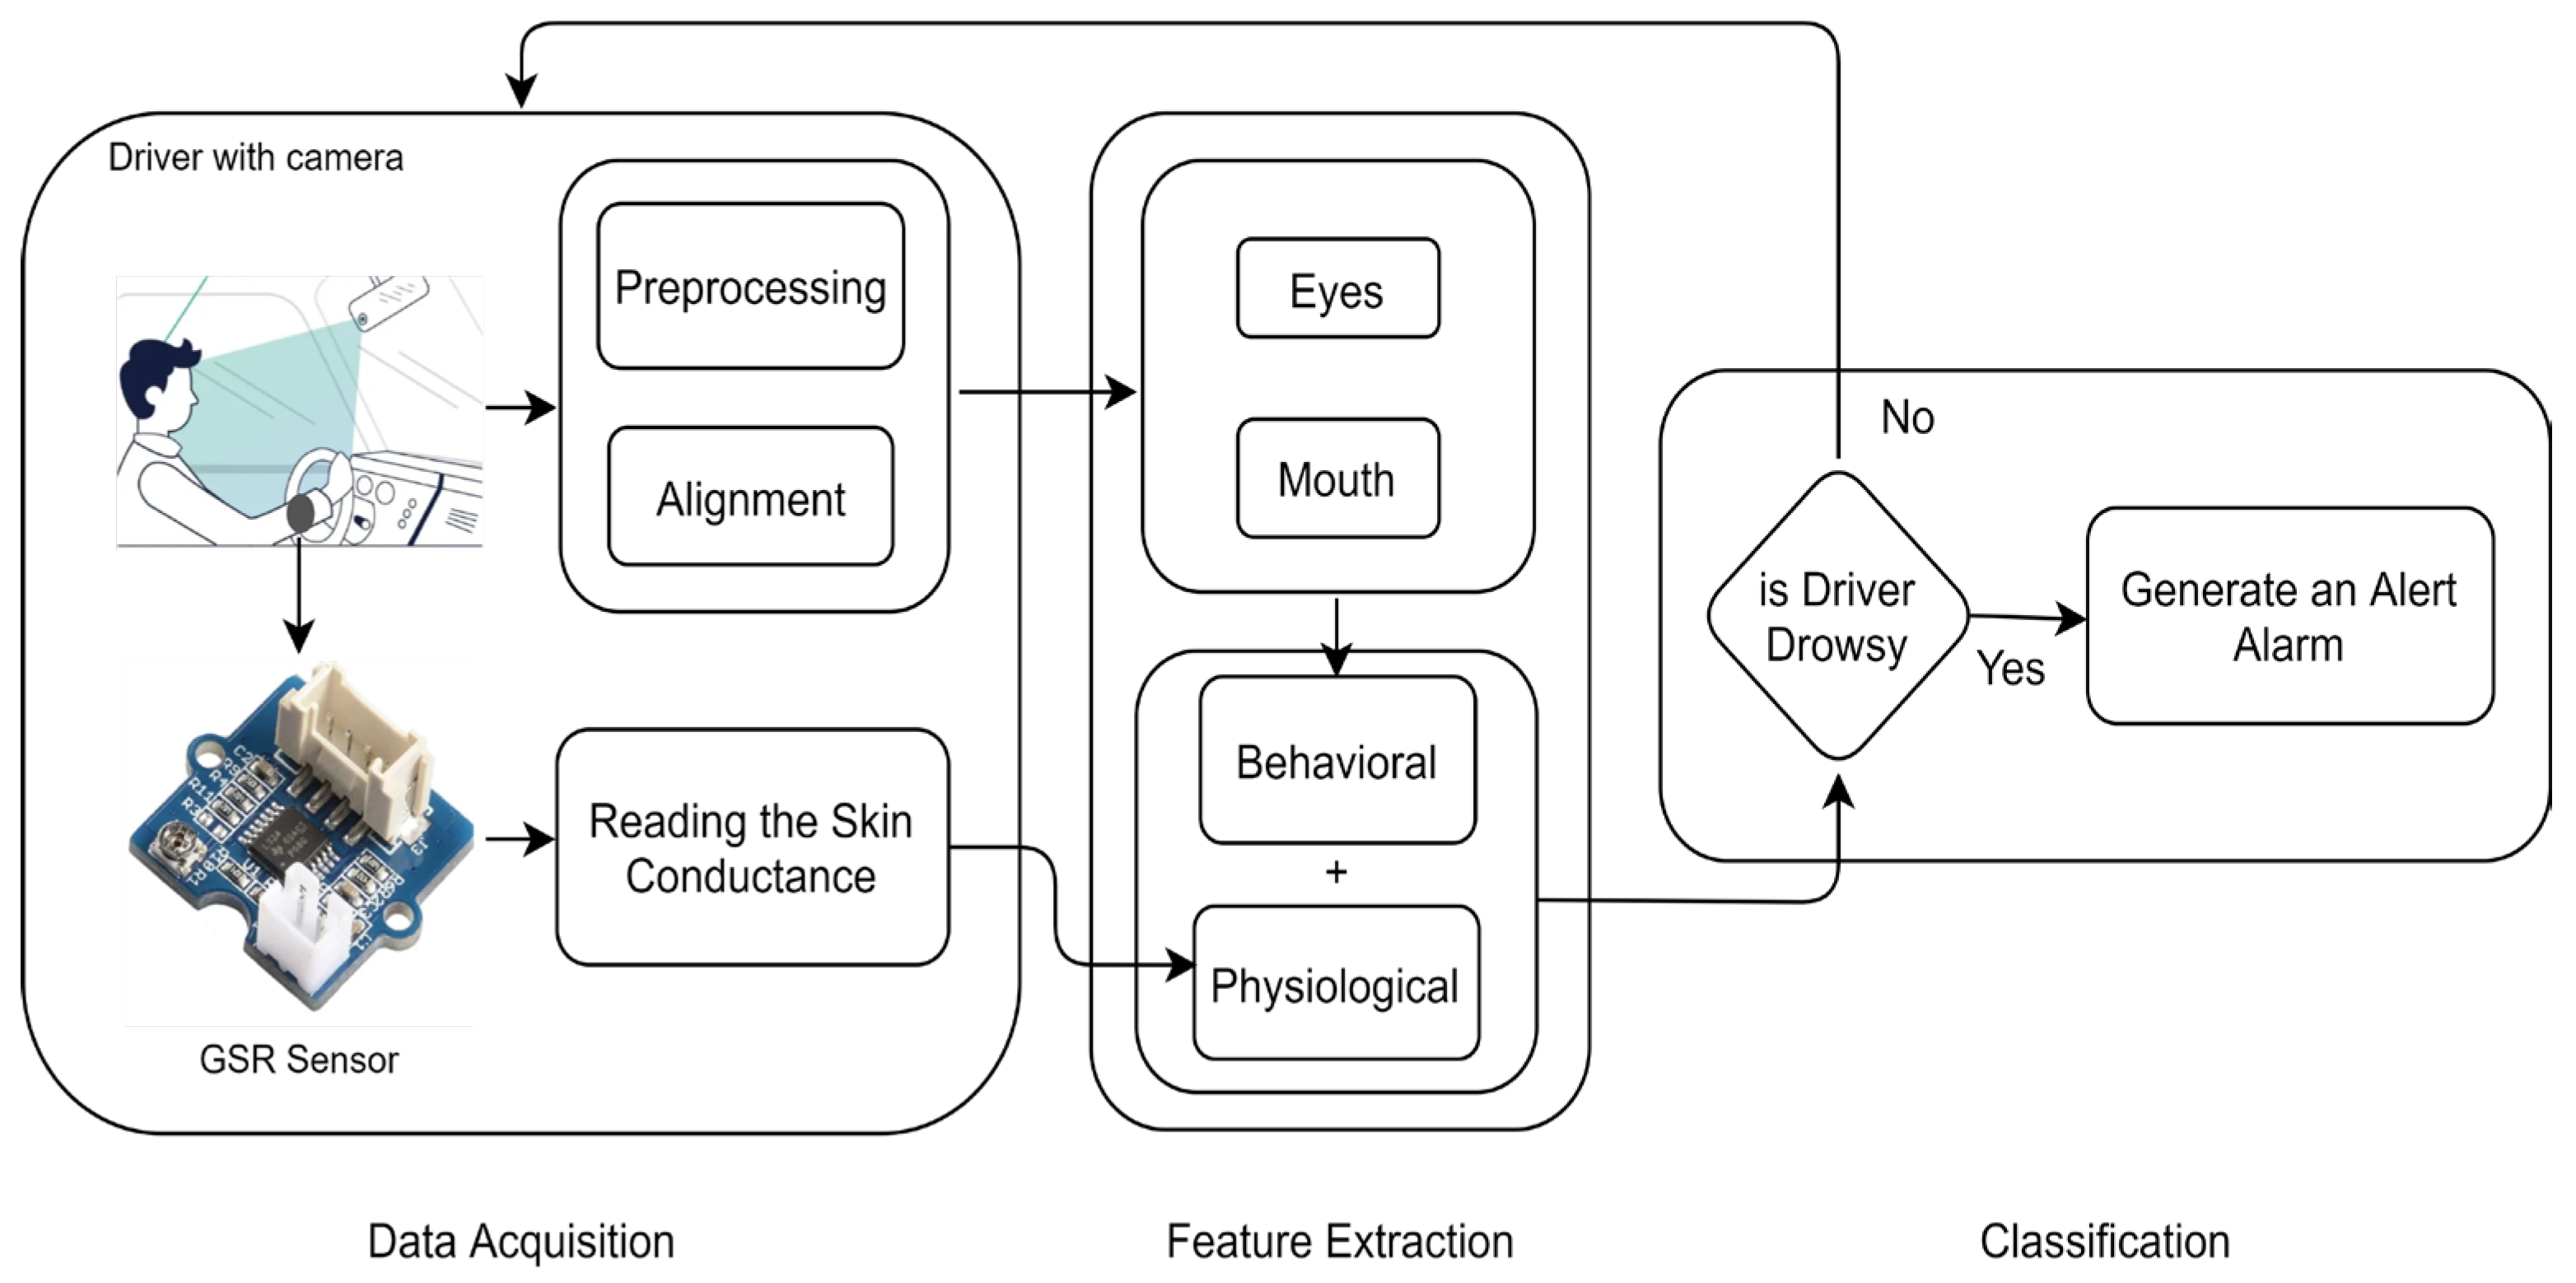
4. Architecture of Hybrid Model
- Data Acquisition
- Feature Extraction
- Classification

| Algorithm 1: Working of Hybrid Model | |
| 1: | Mount a camera on the dashboard of the vehicle and attach a GSR sensor on the fingers of the driver. |
| 2: | Capture the image and collect the reading of the skin conductance of the driver. |
| 3: | Detect the face in the captured images and forward the images to step 4 for feature extraction. |
| 4: | Extract facial features like the eyes and mouth from the images using MTCNN and convert the analog reading of skin conductance into digital form. |
| 5: | Forward the above results to step 6 for classification. |
| 6: | Classify the current state of the driver and forward the result to next step. |
| 7: | Generate an alarm if the driver is drowsy or restart the procedure at step 2. |
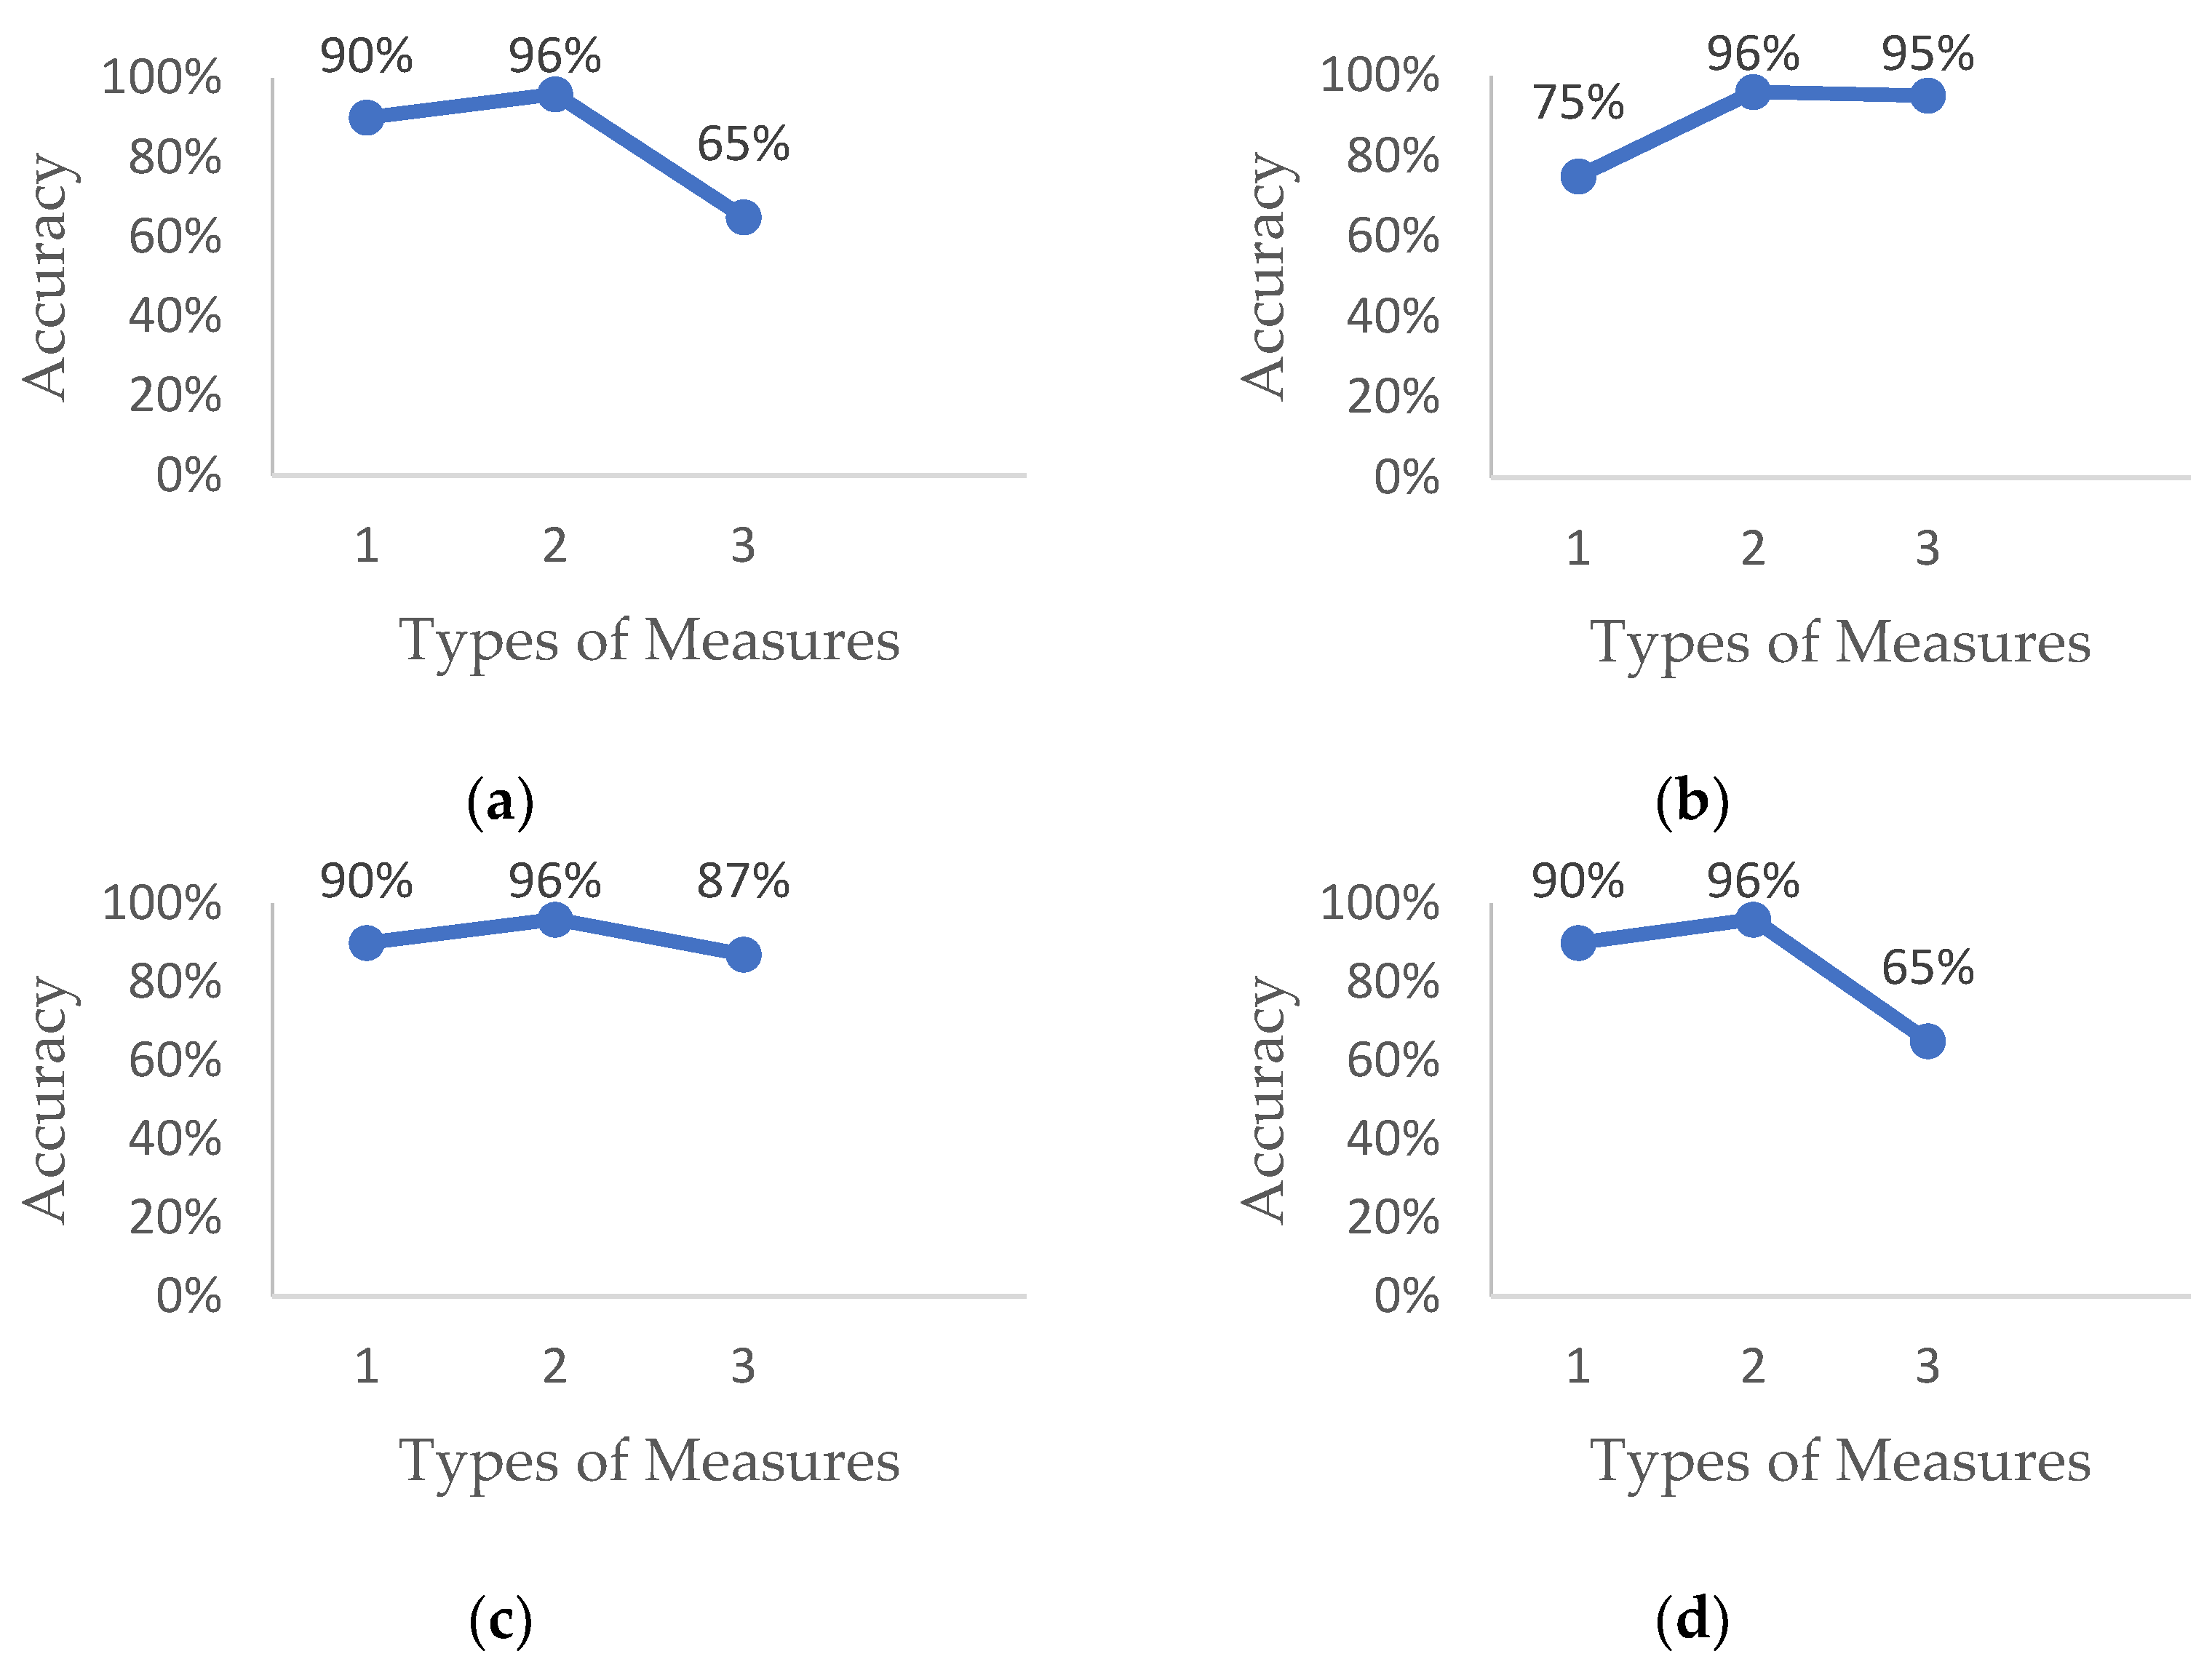
5. Results and Discussion
6. Conclusions
Author Contributions
Funding
Institutional Review Board Statement
Informed Consent Statement
Data Availability Statement
Conflicts of Interest
References
- Road Traffic Injuries. Available online: https://www.who.int/news-room/fact-sheets/detail/road-traffic-injuries (accessed on 19 July 2022).
- Albadawi, M.A.; Takruri, M.; Awad, M. A Review of Recent Developments in Driver Drowsiness Detection Systems. Sensors 2022, 2, 2069. [Google Scholar] [CrossRef] [PubMed]
- Sahayadhas, A.; Sundaraj, K.; Murugappan, M. Detecting Driver Drowsiness Based on Sensors: A Review. Sensors 2012, 12, 16937–16953. [Google Scholar] [CrossRef] [PubMed]
- Bajaj, J.S.; Kumar, N.; Kaushal, R.K. Feasibility Study on Amalgamation of Multiple Measures to Detect Driver Drowsiness. ECS Trans. 2022, 107, 1951. [Google Scholar] [CrossRef]
- Sakshi; Kukreja, V. A dive in white and grey shades of ML and non-ML literature: A multivocal analysis of mathematical expressions. Artif. Intell. Rev. 2022. [Google Scholar] [CrossRef]
- Machaca Arceda, V.E.; Cahuana Nina, J.P.; Fernandez Fabian, K.M. A survey on drowsiness detection techniques. CEUR Workshop Proc. 2020, 2747, 152–161. [Google Scholar]
- Soares, S.; Monteiro, T.; Lobo, A.; Couto, A.; Cunha, L.; Ferreira, S. Analyzing Driver Drowsiness: From Causes to Effects. Sustainability 2020, 12, 1971. [Google Scholar] [CrossRef]
- Doudou, M.; Bouabdallah, A.; Berge-Cherfaoui, V. Driver Drowsiness Measurement Technologies: Current Research, Market Solutions, and Challenges. Int. J. Intell. Transp. Syst. Res. 2019, 18, 297–319. [Google Scholar] [CrossRef]
- Bajaj, J.S.; Kumar, N.; Kaushal, R.K. Comparative Study to Detect Driver Drowsiness. In Proceedings of the 2021 International Conference on Advance Computing and Innovative Technologies in Engineering (ICACITE), Greater Noida, India, 4–5 March 2021; pp. 678–683. [Google Scholar]
- Čolić, A.; Marques, O.; Furht, B. Driver Drowsiness Detection and Measurement Methods. In Driver Drowsiness Detection; SpringerBriefs in Computer Science; Springer: Cham, Switzerland, 2014; pp. 7–18. [Google Scholar]
- Doudou, M.; Bouabdallah, A.; Cherfaoui, V.; Charfaoui, V. A Light on Physiological Sensors for Efficient Driver Drowsiness Detection System. Sens. Transducers J. 2018, 224, 39–50. [Google Scholar]
- Sharma, M.; Kacker, S.; Sharma, M. A Brief Introduction and Review on Galvanic Skin Response. Int. J. Med. Res. Prof. 2016, 2, 13–17. [Google Scholar] [CrossRef]
- Perkins, E.; Sitaula, C.; Burke, M.; Marzbanrad, F. Challenges of Driver Drowsiness Prediction: The Remaining Steps to Implementation. IEEE Trans. Intell. Veh. 2022, PP, 1–20. [Google Scholar] [CrossRef]
- Ngxande, M.; Burke, M. Driver drowsiness detection using Behavioral measures and machine learning techniques: A review of state-of-art techniques. In Proceedings of the 2017 Pattern Recognition Association of South Africa and Robotics and Mechatronics (PRASA-RobMech), Bloemfontein, South Africa, 30 November–1 December 2017; pp. 156–161. [Google Scholar]
- Bajaj, J.S.; Kumar, N.; Kaushal, R.K. AI Based Novel Approach to Detect Driver Drowsiness. ECS Trans. 2022, 107, 4651. [Google Scholar] [CrossRef]
- Murugan, S.; Selvaraj, J.; Sahayadhas, A. Analysis of different measures to detect driver states: A review. In Proceedings of the 2019 IEEE International Conference on System, Computation, Automation and Networking (ICSCAN), Pondicherry, India, 29–30 March 2019; pp. 1–6. [Google Scholar]
- Cheng, B.; Zhang, W.; Lin, Y.; Feng, R.; Zhang, X. Driver drowsiness detection based on multisource information. Hum. Factors Ergon. Manuf. 2012, 22, 450–467. [Google Scholar] [CrossRef]
- Yang, G.; Lin, Y.; Bhattacharya, P. A driver fatigue recognition model based on information fusion and dynamic Bayesian network. Inf. Sci. 2010, 180, 1942–1954. [Google Scholar] [CrossRef]
- Horne, J.A.; Baulk, S.D. Awareness of sleepiness when driving. Psychophysiology 2004, 41, 161–165. [Google Scholar] [CrossRef] [PubMed]
- Gwak, J.; Shino, M.; Hirao, A. Early Detection of Driver Drowsiness Utilizing Machine Learning based on Physiological Signals, Behavioral Measures, and Driving Performance. In Proceedings of the 2018 21st International Conference on Intelligent Transportation Systems (ITSC), Maui, HI, USA, 4–7 November 2018; pp. 1794–1800. [Google Scholar]
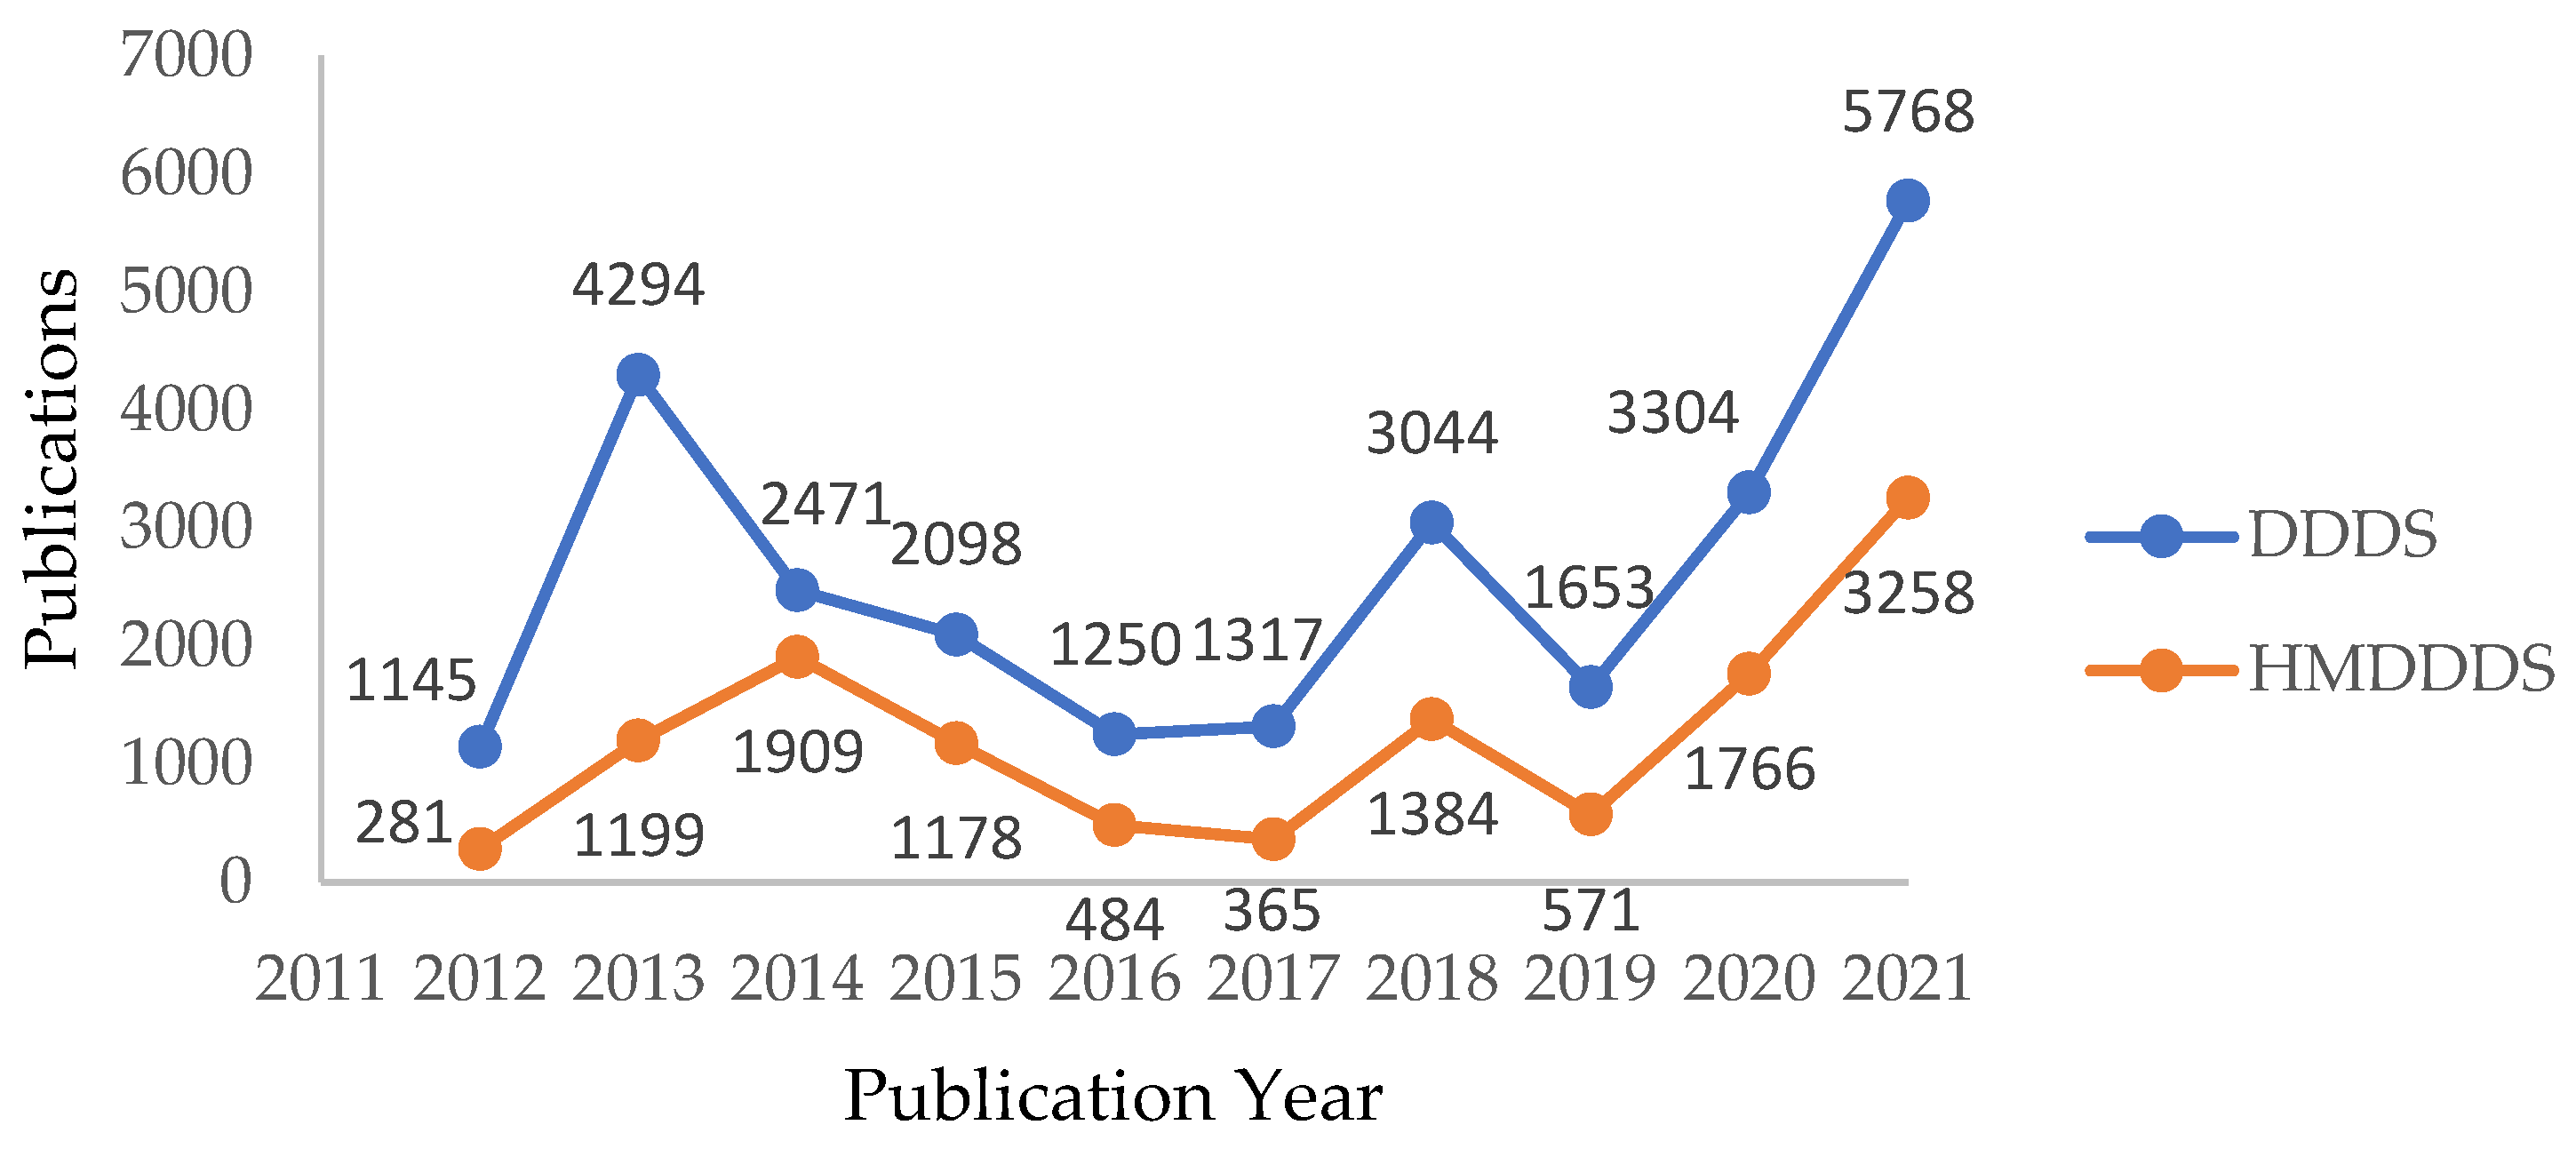
- Timeline—Overview for Hybrid Measures… Publication Year: 2021, 2020, 2019, 2018, 2017, 2016, 2015, 2014, 2013, 2012 in Publications—Dimensions. Available online: https://app.dimensions.ai/analytics/publication/overview/timeline?search_mode=content&or_facet_year=2021&or_facet_year=2020&or_facet_year=2019&or_facet_year=2018&or_facet_year=2017&or_facet_year=2016&or_facet_year=2015&or_facet_year=2014&or_facet_year=201 (accessed on 6 September 2022).
- Buy a Raspberry Pi 3 Model B+—Raspberry Pi. Available online: https://www.raspberrypi.com/products/raspberry-pi-3-model-b-plus/ (accessed on 4 October 2022).
- Buy a Raspberry Pi Camera Module 2—Raspberry Pi. Available online: https://www.raspberrypi.com/products/camera-module-v2/ (accessed on 4 October 2022).
- Grove—GSR Sensor—Seeed Wiki. Available online: https://wiki.seeedstudio.com/Grove-GSR_Sensor/ (accessed on 4 October 2022).
- Dhruba, A.R.; Alam, K.N.; Khan, M.S.; Bourouis, S.; Khan, M.M. Development of an IoT-Based Sleep Apnea Monitoring System for Healthcare Applications. Comput. Math. Methods Med. 2021, 2021, 7152576. [Google Scholar] [CrossRef] [PubMed]
- Austin, R.; Lobo, F.; Rajaguru, S. GSM and Arduino Based Vital Sign Monitoring System. Open Biomed. Eng. J. 2021, 15, 78–89. [Google Scholar] [CrossRef]
- Singh, N.; Brisilla, R.M. Comparison Analysis of Different Face Detecting Techniques. In Proceedings of the 2021 Innovations in Power and Advanced Computing Technologies (i-PACT), Kuala Lumpur, Malaysia, 27–29 November 2021; pp. 1–6. [Google Scholar]
- Eye Blink Detection with OpenCV, Python, and dlib—PyImageSearch. Available online: https://pyimagesearch.com/2017/04/24/eye-blink-detection-opencv-python-dlib/ (accessed on 2 September 2022).
- Shi, W.; Li, J.; Yang, Y. Face Fatigue Detection Method Based on MTCNN and Machine Vision. Adv. Intell. Syst. Comput. 2020, 1017, 233–240. [Google Scholar]
- Viola, P.; Jones, M. Rapid object detection using a boosted cascade of simple features. In Proceedings of the 2001 IEEE Computer Society Conference on Computer Vision and Pattern Recognition, CVPR 2001, Kauai, HI, USA, 8–14 December 2001; Volume 1, p. I. [Google Scholar]
- Deshmukh, A.D.; Nakrani, M.G.; Bhuyar, D.L.; Shinde, U.B. Face Recognition Using OpenCv Based on IoT for Smart Door. In Proceedings of the International Conference on Sustainable Computing in Science, Technology and Management (SUSCOM), Jaipur, India, 26–28 February 2019; pp. 1066–1073. [Google Scholar]
- Yongcun, W.; Jianqiu, D. Online Examination Behavior Detection System for Preschool Education Professional Skills Competition Based on MTCNN. In Proceedings of the 2021 IEEE 2nd International Conference on Big Data, Artificial Intelligence and Internet of Things Engineering (ICBAIE), Nanchang, China, 26–28 March 2021; pp. 999–1005. [Google Scholar]
- Chen, C.S.; Lu, J.; Ma, K.K. Driver Drowsiness Detection via a Hierarchical Temporal Deep Belief Network. Asian Conf. Comput. Vis. 2016, 10116 LNCS, 117–133. [Google Scholar]
- Savaş, B.K.; Becerikli, Y. Real Time Driver Fatigue Detection System Based on Multi-Task ConNN. IEEE Access 2020, 8, 12491–12498. [Google Scholar] [CrossRef]
- Nor Shahrudin, N.S.; Sidek, K.A. Driver drowsiness detection using different classification algorithms. J. Phys. Conf. Ser. 2020, 1502, 12037. [Google Scholar] [CrossRef]
- Liu, W.; Qian, J.; Yao, Z.; Jiao, X.; Pan, J. Convolutional two-stream network using multi-facial feature fusion for driver fatigue detection. Future Internet 2019, 11, 115. [Google Scholar] [CrossRef]
- Jabbar, R.; Al-Khalifa, K.; Kharbeche, M.; Alhajyaseen, W.; Jafari, M.; Jiang, S. Real-time Driver Drowsiness Detection for Android Application Using Deep Neural Networks Techniques. Procedia Comput. Sci. 2018, 130, 400–407. [Google Scholar] [CrossRef]
- Siddiqui, H.U.R.; Saleem, A.A.; Brown, R.; Bademci, B.; Lee, E.; Rustam, F.; Dudley, S. Non-Invasive Driver Drowsiness Detection System. Sensors 2021, 21, 4833. [Google Scholar] [CrossRef] [PubMed]
- Phan, A.C.; Nguyen, N.H.Q.; Trieu, T.N.; Phan, T.C. An efficient approach for detecting driver drowsiness based on deep learning. Appl. Sci. 2021, 11, 8441. [Google Scholar] [CrossRef]


| Ref. | Hybrid Measures | Accuracy | Advantage | Limitation |
|---|---|---|---|---|
| [17] | Behavioral + Vehicle-based | 91% | Ease of use | High false positive detection rate and dependent on geographical conditions |
| [18] | Behavioral + Physiological | 98% | High accuracy | Highly intrusive |
| [19] | Vehicle-based + Physiological | 93% | High accuracy | Extremely intrusive and geographically dependent |
| [20] | Vehicle-based + Physiological + Behavioral | 81% | High accuracy and ease of use | Expensive and more challenging to implement in real driving conditions |
| Name of Component | Specifications |
|---|---|
| Raspberry Pi 3 B+ | 64-bit quad-core processor running at 1.4 GHz, dual-band 2.4 GHz and 5 GHz wireless LAN, and Bluetooth 4.2/BLE |
| Pi Camera v2 | 8 Mega Pixel |
| GSR Sensor | V2.0, 3.3/5 VDC |
| Analog-to-digital converter | MCP3008 |
| Parameters | Face Detection Techniques | ||
|---|---|---|---|
| OpenCV Haar Cascade | DLIB | MTCNN | |
| Work in real-time conditions | ✓ | ✓ | ✓ |
| High accuracy in different conditions | ✓ | ✓ | ✓ |
| High efficiency | ✕ | ✕ | ✓ |
| Detect the sides of faces | ✕ | ✕ | ✓ |
| Less time for training | ✓ | ✓ | ✕ |
| Subjects | S1 | S2 | S3 | S4 | S5 | S6 | S7 | S8 | |
|---|---|---|---|---|---|---|---|---|---|
| Parameters | |||||||||
| PERCLOS | 0.37 | 0.21 | 0.42 | 0.26 | 0.22 | 0.36 | 0.18 | 0.32 | |
| FOM | 0.23 | 0.11 | 0.21 | 0.14 | 0.17 | 0.22 | 0.09 | 0.13 | |
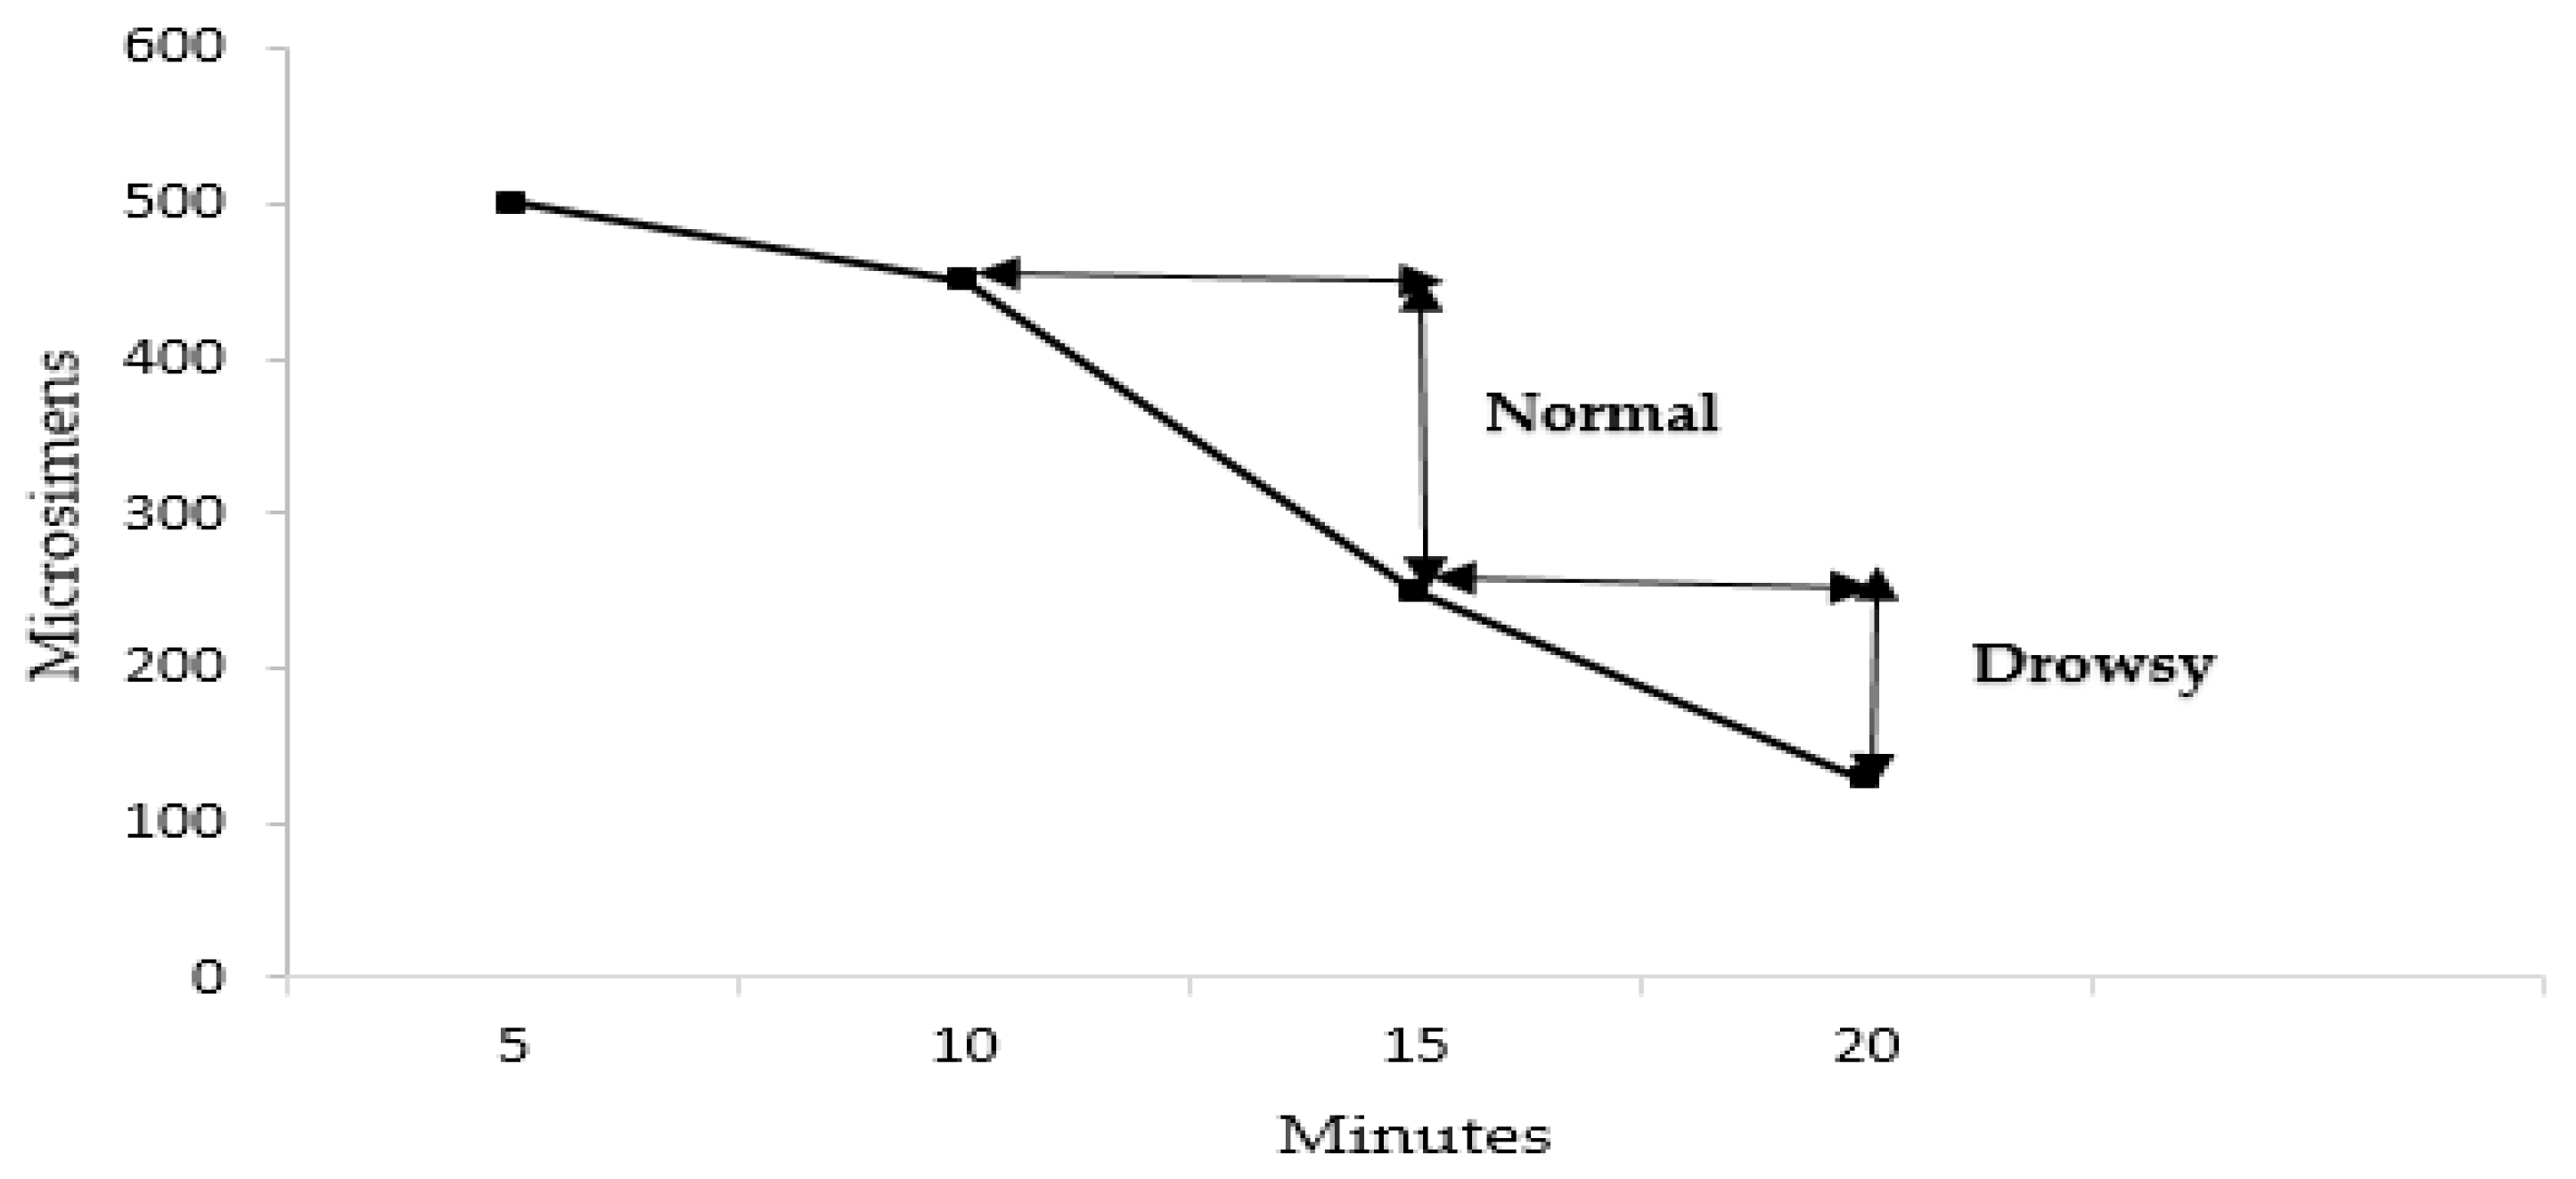
| Skin Conductance | 162.5 | 275.4 | 128.9 | 225.5 | 247.3 | 166.2 | 274.9 | 178.7 | |
| Duration | S1 | S2 | S3 | S4 | S5 | S6 | S7 | S8 |
|---|---|---|---|---|---|---|---|---|
| 5 | 181.81 | 348.2 | 168.88 | 231.03 | 257.42 | 160.54 | 286.88 | 190.23 |
| 10 | 164.87 | 319.35 | 150.03 | 235.47 | 229.85 | 156.47 | 295.23 | 203.13 |
| 15 | 134.34 | 305.41 | 74.22 | 264.67 | 215.49 | 142.79 | 328.34 | 172.82 |
| 20 | 154.95 | 297.13 | 123.25 | 221.74 | 247.89 | 135.38 | 302.18 | 144.51 |
| 25 | 133.82 | 253.77 | 119.51 | 193.13 | 193.55 | 147.9 | 219.76 | 167.26 |
| 30 | 125.21 | 298.82 | 108.08 | 207.18 | 199.38 | 154.27 | 247.34 | 174.17 |
| Reference | Measures | Drowsiness Detection Methods/Sensors | Accuracy | Limitations |
|---|---|---|---|---|
| [3] | Subjective | KSS and SSS | NA | Cannot be used in real driving conditions |
| [8] | Vehicle-Based | SWM and SDLP | 88% | High false positive detection rate |
| [9] | Behavioral | PERCLOS and Yawning | Close to 100% | Does not work in all conditions |
| [4] | Physiological | EEG and EMG | 97–99% | Highly intrusive and cannot be used in real driving conditions |
| [38] | Sensor-Based Physiological | Respiration Rate | 86% | Low accuracy |
| Proposed Hybrid Model | Behavioral + Sensor-Based Physiological | PERCLOS, Yawning and Skin Conductance | 91% | Need more investigation using large number of individuals in real driving conditions |
Disclaimer/Publisher’s Note: The statements, opinions and data contained in all publications are solely those of the individual author(s) and contributor(s) and not of MDPI and/or the editor(s). MDPI and/or the editor(s) disclaim responsibility for any injury to people or property resulting from any ideas, methods, instructions or products referred to in the content. |
© 2023 by the authors. Licensee MDPI, Basel, Switzerland. This article is an open access article distributed under the terms and conditions of the Creative Commons Attribution (CC BY) license (https://creativecommons.org/licenses/by/4.0/).
Share and Cite
Bajaj, J.S.; Kumar, N.; Kaushal, R.K.; Gururaj, H.L.; Flammini, F.; Natarajan, R. System and Method for Driver Drowsiness Detection Using Behavioral and Sensor-Based Physiological Measures. Sensors 2023, 23, 1292. https://doi.org/10.3390/s23031292
Bajaj JS, Kumar N, Kaushal RK, Gururaj HL, Flammini F, Natarajan R. System and Method for Driver Drowsiness Detection Using Behavioral and Sensor-Based Physiological Measures. Sensors. 2023; 23(3):1292. https://doi.org/10.3390/s23031292
Chicago/Turabian StyleBajaj, Jaspreet Singh, Naveen Kumar, Rajesh Kumar Kaushal, H. L. Gururaj, Francesco Flammini, and Rajesh Natarajan. 2023. "System and Method for Driver Drowsiness Detection Using Behavioral and Sensor-Based Physiological Measures" Sensors 23, no. 3: 1292. https://doi.org/10.3390/s23031292
APA StyleBajaj, J. S., Kumar, N., Kaushal, R. K., Gururaj, H. L., Flammini, F., & Natarajan, R. (2023). System and Method for Driver Drowsiness Detection Using Behavioral and Sensor-Based Physiological Measures. Sensors, 23(3), 1292. https://doi.org/10.3390/s23031292