Abstract
The paper presents the validation of an electrochemical procedure for on-site Hg2+ ions determination in wastewater samples using a modified carbon screen-printed electrode (SPE) with a complexing polymeric film based on poly(2,2′-(ethane-1,2-diylbis((2-(azulen-2-ylamino)-2-oxoethyl)azanediyl))diacetic acid) (polyL). Using metal ions accumulation in an open circuit followed by anodic stripping voltammetry, the SPE-polyL electrode presents a linear range in the range of 20 µg/L to 150 µg/L, with a limit of detection (LOD) = 6 µg/L, limit of quantification (LOQ) = 20 µg/L, and an average measurement uncertainty of 26% of mercury ions. The results obtained in situ and in the laboratory using the SPE-polyL modified electrode were compared with those obtained by the atomic absorption spectrometry coupled with the cold vapor generation standardized method, with the average values indicating excellent recovery yields.
1. Introduction
The toxicity of heavy metals imposes increasing concerns because of the effects they produce on human health and the ecological system. Mercury is one of the most toxic metals and at the same time one of the most widespread pollutants in nature, coming from natural and anthropogenic sources [1]. It is an element that does not biodegrade in the environment and is well known for its accumulation in the aquatic ecosystem. This element from the atmosphere contaminates waters (rivers, lakes, oceans) and soils. In the aquatic environment, inorganic mercury is transformed into organic mercury (methylmercury—the most toxic form). Populations that have a diet based especially on seafood or that consumes certain species of fish (king mackerel, shark, tuna, etc.) also have an increased risk of methylmercury poisoning.
Mercury (Hg2+) and its compounds are extremely toxic to the environment. Due to its accumulation in food, it is extremely harmful even at very low amounts. In addition, due to its strong absorption into biological tissues, it exhibits a very slow rate of elimination. Through this bioaccumulation process, mercury easily passes from the aquatic system into the food chain. Exposure and consumption of this element, even at very low concentrations, can cause neurological and movement disorders, kidney failure, cancer, liver dysfunction, and disorders of the endocrine systems [2]. According to the Environmental Protection Agency (EPA), the maximum allowed limit for Hg2+ is less than 10 nM [3]; therefore, monitoring environmental contamination with Hg2+ is of great interest.
Because of the threats related to mercury pollution, a strict control of this element in the environment is necessary, so it follows that the development of quick methods for detecting mercury in the field is also a strict necessity. Although there are several traditional analytical methods, which show great sensitivity and selectivity for its determination, most of them are laborious, voluminous, expensive, and time-consuming. For Hg2+ ions detection, methods such as colorimetry [4], fluorimetry [5], electrochemistry [6], and surface plasmon resonance [7] are used. The most used methods for mercury detection are atomic absorption spectrometry (AAS) with hydride generation, AAS with cold vapors, atomic fluorescence spectrometry, optical emission spectrometry with inductively coupled plasma, and mass spectrometry with inductively coupled plasma [8], but these methods also present some disadvantages, such as the need for a large sample volume, high costs, a long time required for sample pretreatment, and long test duration, which are labor-intensive and requires massive instruments and, therefore, makes their use in on-site and real-time mercury detection impossible. An alternative to traditional analytical methods for the detection of mercury ions is represented by electroanalytical methods based on chemically modified electrodes with suitable characteristics, such as low cost, simplicity of use, high selectivity, and sensitivity, were developed. Moreover, they can be included in portable devices, allowing in situ monitoring of analyzed samples [9]. An inconvenience of the electroanalytical technique is the use of unmodified electrochemical sensors because they have low selectivity, high overpotential, low sensitivity, and lack of reliability [10]. In order to improve the performance of electrochemical sensors for the detection of mercury at the maximum admitted level, certain materials are used such as graphene, nanoparticles, carbon nanotubes, or organo-metallic compounds [11,12,13,14].
For the determination of toxic metal ions in environmental samples, their on-site quantification is an essential and mandatory process in the industry and water treatment processes. Sophisticated instruments or devices cannot be used for in situ detection of metal ions, which is why their analysis using disposable sensors (SPE) is the most widely used in the field of electroanalysis [15,16]. In order to increase the sensitivity and selectivity towards certain analytes, various carbon-based electrode materials were used by modifying their surfaces with substances that have a selective affinity towards the metal ions of interest [17,18]. Several types of carbon materials, including glassy carbon, graphene, carbon nanotubes, carbon paste, carbon fibers, and SPEs, have been reported as substrate materials for the detection of metal ions [19,20,21]. In recent years, screen-printing has been the most used in electroanalysis for the manufacture of sensors and biosensors [22,23,24]. SPEs usually include three electrodes (the working electrode, the counter electrode, and the reference electrode) and have attractive features such as easy to manufacture, low cost, and small sample volume (µL) [25].
Higher selectivity and sensitivity compared to other methods [26,27], low cost, and simplicity of use are a few characteristics of electrochemical sensors based on chemically modified electrodes. These sensors can be included in portable devices, allowing in situ monitoring of the analyzed samples [28]. Recently, a group of researchers from China developed an electrochemical method for the rapid detection of methylmercury in water samples: a method that requires a short sample preparation time and low cost. The developed electrochemical sensor used gold nanoparticles and a glassy carbon electrode modified with zeolitic imidazolate-67, obtaining through this technique a detection limit of 0.05 µg/L [29]. Chemically modified electrodes based on polymeric films were also tested for heavy metals monitoring in water samples [30,31]. Particularly, azulene-based sensors were tested for some heavy metals detection, obtaining adequate results [28]. Therefore, their employment for mercury monitoring may be promoted. Moreover, for the in situ detection of mercury ions, a series of nanomaterials with intrinsic catalytic activity, called nanozymes, were used. These nanozymes show a behavior similar to that of native enzymes, which is why they were applied in the detection of mercury based on color variation [32].
Recently, nanoparticles have been used to remediate soils and waters contaminated with metals. These nanoparticles are used due to their large surface area, high adsorption capacity, fast diffusion speed, and significant chemical reactivity [33,34,35]. In order to prevent environmental pollution with mercury, strategies based on nanomaterials have been developed using graphene oxide, carbon nanotubes, or carboxymethyl cellulose or chitosan as adsorbent material to remove mercury from polluted water [36].
Electroanalytical methods are an alternative solution to the traditional methods of mercury detection in water samples. Despite the fact that numerous studies have been published based on the use of disposable SPEs for monitoring metal contaminants in the environment [37,38], there are only a few studies that employed SPEs to detect mercury levels in the environment [39]. For instance, Joe Wang was the first to employ a SPE gold-based electrode for potentiometric stripping measurements of trace mercury levels, achieving a detection limit of 0.5 µg/L [40]. In order to detect mercury, Bernalte et al. in 2011 employed a commercially available carbon-based SPE electrode enhanced with gold nanoparticles, obtaining a LOD of 1.1 µg/L for testing on samples of water and dust using square-wave anodic stripping voltammetry [41,42,43]. In addition, electrodeposited gold on a SPE was reported by Mandil et al. for mercury detection, achieving a LOD of 1.5 µg/L [44].
This study aimed to validate the electrochemical method for the determination of mercury from wastewater samples using a modified SPE with complexing polymeric film based on polyL (the structure of the monomer is presented in Figure 1.). In addition, the present work intends to make a step further into the development of an electrochemical portable device, with low running costs and easy-to-operate system based on a modified SPE for mercury detection.
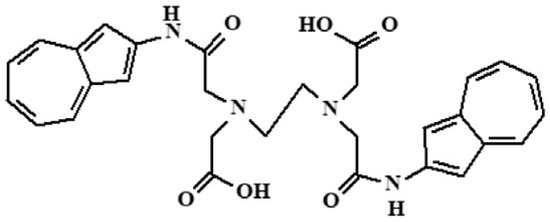
Figure 1.
The structure of (2,2′-(ethane-1,2-diylbis((2-(azulen-2-ylamino)-2-oxoethyl)azanediyl))diacetic acid, (L).
2. Materials and Methods
2.1. Reagents
The monomer 2,2′-(ethane-1,2-diylbis((2-(azulen-2-ylamino)-2-oxoethylazanediyl)diacetic acid (L) (Figure 1) was used to modify the carbon SPE through oxidative polymerization under imposed potential as previously shown [45].
Acetonitrile (Sigma Aldrich, Saint Louis, MO, USA, purity 99.999%), tetrabutyl ammonium perchlorate—TBAP (Sigma Aldrich, Saint Louis, MO, USA, for electrochemical analyses, ≥99.0%), anhydrous glacial acetic acid (Supelco, Saint Louis, MO, USA, 100%), anhydrous sodium acetate (Merck, Darmstadt, Germany, 99.99%), and Hg2+ standard solution, mercury acetate ((CH3CO2)2Hg) (Fischer Chemical, Waltham, MA, USA, quality pa) were used as received.
The reagents used for alternative method were certified reference material, 1001 mg/L Hg in 10% HNO3 (CPAChem, Stara Zagora, Bulgaria), tin (II) chloride dihydrate for analysis (Supelco, Saint Louis, MO, USA), potassium bromide puriss (Sigma Aldrich, Saint Louis, MO, USA), potassium bromate puriss (Sigma Aldrich, Saint Louis, MO, USA), hydrochloric acid 34–37% for trace metal analysis (VWR Chemicals, Radnor, PA, USA), nitric acid suprapur 69% (Supelco, Saint Louis, MO, USA). All solutions were prepared using ultrapure water 18.2 MΩ·cm.
2.2. Equipment
The SPEs were purchased from BVT Technologies (Strazek, Czech Republic). The characteristics of these electrodes are: carbon working electrode (2 mm diameter); auxiliary carbon electrode; Ag/AgCl reference electrode. The dimensions of these electrodes were mass: 0.5 g; length: 25.40 mm; width: 7.26 mm; thickness: 0.63 mm.
PalmSens4 portable potentiostat connected to a laptop and equipped with PSTrace software, capable of processing all the information provided by the potentiostat from the electrochemical cell (EC) and rendering it in the form of graphics on a computer screen. The connection between the EC and the potentiostat was made with the help of a connector from Metrohm DropSens (reference CAC4MMH).
A Thermo M6 spectrometer equipped with cold vapors and a Hg cavity cathode lamp was used to perform the atomic absorption spectrometry with cold vapor generation (AAS-CV) standardized.
A Millipore Direct-Q water purification system from Merck was used a source of purified water.
2.3. Procedures
2.3.1. Electrochemical Procedures for Hg2+ Analysis
The SPE modified electrode was prepared in supporting electrolyte (0.1 M) obtained from acetonitrile and TBAP containing 1.5 mM L using the previously described procedure [45]. An example of successive cyclic voltammograms of L on SPE is presented in Figure S1 (see Supplementary Information), which emphasize an accumulation of polymeric material on the electrode surface during electropolymerization. After its transfer into free monomer electrolyte (Figure S2 from the Supplementary Information), the SPE-polyL modified electrode maintains its electroactivity which confirms the electrodeposition of the complexing polymeric film on these electrodes. The aqueous acetic acid buffer (0.2 M) was obtained from anhydrous glacial acetic acid and anhydrous sodium acetate. For mercury ions detection, an electrochemical measuring cell was used (with acetate buffer concentration 0.1 M) and an ion complexation cell of Hg2+ (Figure 2) at pH = 3.
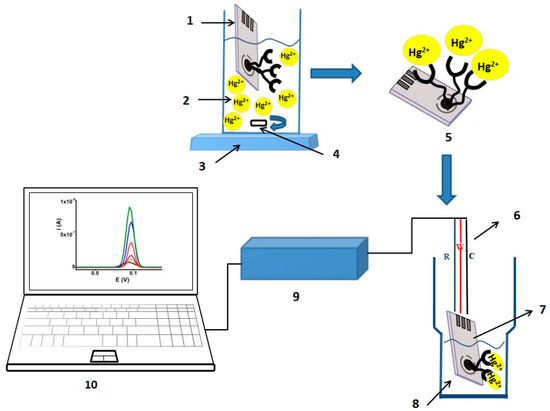
Figure 2.
Principle scheme for the realization of the electrochemical process for the determination of Hg2+ ions in wastewater: 1—electrode with deposited polymer; 2—electrochemical cell with 20 mL 0.05 M acetate buffer solution at pH = 3; 3—magnetic stirrer; 4—Teflon magnet; 5—electrode with complexed Hg2+ ions and uncomplexed Hg2+ ions; 6—three electrical contacts; 7—electrode with complexed Hg2+ ions; 8—electrochemical cell; 9—portable potentiostat; 10—laptop with installed software.
Mercury standards solutions were obtained from mercury acetate in acetate buffer (pH = 3.0). The calibration curve was in the concentration range 20–150 µg/L (20 µg/L; 40 µg/L; 50 µg/L; 60 µg/L; 80 µg/L; 100 µg/L; 150 µg/L). The analytical measurements were carried out at a pH = 3 of the acetate buffer solution both in the electrochemical measurement cell and in the Hg2+ ions complexation cell. The Hg2+ ions detection experiments were carried out in acetate buffer (0.1 M or 0.05 M) at pH = 3. The detection procedure consists of the following successive stages:
- SPE electrodes modified with polyL films (SPE-polyL) are inserted into acetate buffer (0.1 M, pH = 3) and a cyclic voltammetry (CV) between −0.5 V and +1.2 V is performed. In this way, the electroactivity of the polymer film is destroyed, obtaining a lower background current. Before analysis, a differential pulse voltammogram in free analyte solution was recorded to observe the background current. Conditions: DPV: equilibration time 5 s; starting potential 0.5 V; potential vertex 1 −1.3 V; potential vertex 1 0.5 V; potential step 0.01 V; scanning speed 0.024 V/s, number of cycles 1.
- After stage I, the SPE-polyL electrodes are immersed in 20 mL complexation solution (Hg2+ ions in acetate buffer (0.05 M, pH = 3), kept for 20 min under stirring (open circuit complexation).
- After stage II, the SPE-polyL electrodes are removed from the complexation solution and rinsed with ultrapure water to remove traces of uncomplexed Hg2+ ions.
- The electrodes are inserted into the acetate buffer (0.1 M, pH = 3) where the Hg2+ ions retained on the surface of the SPE-polyL electrodes are reduced to zero valence by polarizing the electrodes at −1.3 V for 15 s followed by their reoxidation using DPV under the following conditions: conditioning potential 0 V; conditioning time 0 s; storage time 15 s; storage potential −1.3 V; equilibration time 5 s; start potential −1.3 V; closing potential 1 V; potential step −0.005 V, pulse time 0.05 V; scan speed 0.01 V/s.
This four-stage procedure was applied for the validation of the proposed method for Hg2+ detection (Figure S3 from Supplementary Information), using at this level only standard solutions from mercuric acetate.
To validate the electrochemical method, the following performance parameters of the method were verified: linearity and working range, LOD and LOQ, accuracy, repeatability, intermediate precision, recovery, robustness, and measurement uncertainty.
2.3.2. Alternative Method for Control of Hg2+ in Wastewater Samples
An alternative method used for quality control of the Hg2+ ions in wastewater samples, in order to validate the electrochemical procedures applied in the study, was the EN ISO 12846:2012 standardized method [46]. The technique of this standardized method is AAS-CV.
2.3.3. Wastewater Sampling
Seventeen wastewater samples were collected from an industrial site in order to determine mercury. Duplicate samples were preserved with KBrO3-KBr in hydrochloric acid and transported to the analytical laboratory for mercury determination with the AAS-CV technique. In addition, electrochemical procedures were applied in the laboratory using PalmSens4 portable potentiostat equipment. On-site, the electrochemical procedures were performed and the concentration of Hg2+ ions was determined using the same device.
3. Results
3.1. Electrochemical Performance of SPE-poliL for Hg2+ Analysis
3.1.1. Linearity and Working Range
To establish the linearity of the method, the calibration curve was performed on six points in the concentration range from 20 to 150 µg/L Hg2+ (20 µg/L; 50 µg/L; 60 µg/L; 80 µg/L; 100 µg/L; 150 µg/L). For each concentration level, three replicates were analyzed; statistical parameters were calculated using the average of these three replicates. Good correlation coefficient (R = 0.9996) and determination coefficient (R2 = 0.9993) values were obtained, with the values being close to 1.
The linearity of the regression curve calculated with Equation (1) indicated a value of 99.07%, which falls within the range of ±1% [47]. The value of the method coefficient of variation (1.23%) was less than 2% according to Horwitz function, situating this approach as a good electrochemical method [48].
Linearity = (1 − sb/b) × 100
Figure 3 presents the calibration curve that was used to establish the performance parameters of the method.
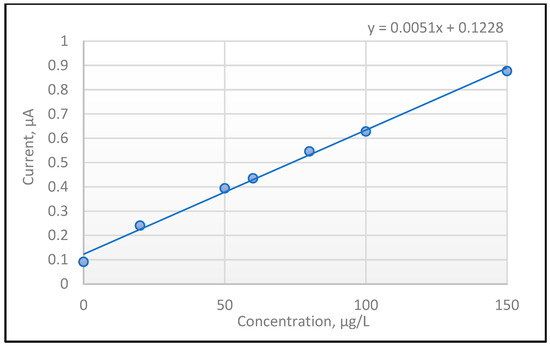
Figure 3.
Linear regression curve for Hg(II) through the DPV technique with SPE-polyL.
3.1.2. LOD, LOQ
For LOD and LOQ, six replicates enriched with 20 µg/L Hg2+ solution were prepared from mercury acetate. The average value of the replicates was X average = 21.9 µg/L. For estimation of LOD and LOQ, Equations (2) and (3) were used.
LOD = 3 × s
LOQ = 10 × s
The standard deviation of the replicates (s = 1.9747 µg/L) was obtained and, according to Equations (2) and (3), 6.0 µg/L (LOD) and 20.0 µg/L (LOQ) were reported.
3.1.3. Accuracy
To determine the accuracy of the method, ten individual replicates were performed at five concentration levels (20 µg/L Hg2+, 50 µg/L Hg2+, 80 µg/L Hg2+, 100 µg/L Hg2+, 150 µg/L Hg2+). The replicates were carried out by a single analyst, in the same day using the same equipment and the same working conditions and method. The obtained results are presented in Table 1.

Table 1.
Accuracy test coefficients.
3.1.4. Repeatability
The repeatability of the method was carried out on ten individual replicates having the concentrations 20 µg/L Hg2+, 50 µg/L Hg2+, 80 µg/L Hg2+, 100 µg/L Hg2+, and 150 µg/L Hg2+. The replicates were realized by a single analyst on the same day using the same equipment and the same work method. The obtained results (standard deviation of the repeatability, repeatability, and the repeatability variation coefficient) are presented in Table 2.
Table 2.
Repeatability test coefficients.
The repeatability and repeatability variation coefficient are presented in the following equations:
*Repeatability (r) = 2.8 × Sr,
**RSDr = (Sr × 100)/Xaverage
3.1.5. Intermediate Precision
To determine the intermediate precision (R), twelve replicates were analyzed at three concentration levels (20 µg/L, 50 µg/L, and 100 µg/L Hg2+). The tests were carried out by two analysts in three days using the same equipment and the same working condition and method. The obtained results (average concentration, standard deviation of the intermediate precision (SR), intermediate precision, and standard deviation of the intermediate precision RSDR) are presented in Table 3.
Table 3.
Intermediate precision test coefficients.
The intermediate precision and intermediate precision variation coefficient are presented in the following equations:
*Intermediate precision (R) = 2.8 × SR,
**RSDR = (SR × 100)/Xaverage
3.1.6. Interference
The selectivity of the polyL material was checked and discussed in our previous paper [45]. In addition, we can say that, as can be seen from Figure S4 (see Supplementary Information), the mercury ions stripping peak current remained at 90% from the initial height even when five mass equivalents of interference ions I (I: (Zn(II), Cd(II), Pb(II), Ni(II), Co(III), and Cu(II)) were added.
3.1.7. Recovery
The recovery test indicates, according to the literature, “the fraction of the analyte added to the test sample (fortified or spiked) prior to analysis which is measured by the method” [48].
Recovery percentages were calculated after analyzing six replicates of standard solutions of 50 µg/L and 100 µg/L. Same standard solutions was added to real samples without Hg2+ (spike matrix sample) and six replicates with same standard solutions added to the blanks (spike blank) with the following equation:
Recovery = (Xspike matrix sample × 100)/Xspike blank,
Recovery test data indicated recovery percentage situated in the range of 98.2% ± 5% (100 µg/L) to 110% ± 7% (50 µg/L).
3.1.8. Robustness
The robustness tests were performed using the Youden and Steiner partial factorial model [49,50]; a model in which three factors can be varied and analyzed with only four experiments. This efficient method can be used for “in-house” validation of the methods. Depending on the procedure used, a high value (+) and a low value (−) are established for each factor, varying by a maximum of 10% the normal value of the factor. The partial factorial model for three factors is presented in Table 4.
Table 4.
The partial factorial model for testing the robustness of the analytical method.
The absolute effect (bias) of each factor from A to C can be evaluated with the following formula:
where: = sum of Y results, where factor A has the high value (+), Y1 + Y3, n = 2; = sum of Y results, where the factor A has the low value (−), Y2 + Y4, n = 2.
Effect A (absolute value) = │(ΣYA+ − ΣYA−)/2│
The effect of a factor can be considered significant if it exceeds the value of 1.4 multiplied by SR, where SR is the standard deviation of the intermediate precision value, according to Equation (10):
Effect A÷C > 1.4 × Sr
This formula could be used in the case of the new method’s “in-house” validation. SR could be replaced with other value, such as standard deviation of the original procedure taken from the last control test.
The relative effects of each factor can be estimated using the following formula:
Effect A(%) = [(ΣYA+ − ΣYA−) × 100]/ΣYA+
The factors selected for testing the robustness of the electrochemical method for the determination of Hg2+ using DPV technique with the SPE-polyL modified electrodes were the parameters that influence the retention of Hg2+ ions on the surface of SPE-polyL electrodes during DPV procedures: pH (pH = 3), reaction time (20 min), acetate buffer concentration (0.05 M).
Each experiment was performed in six replicates so that the Yi value of each experiment represented their average value. The tested concentration was 20 µg/L.
Two robustness tests were performed: one in which all three parameters were modified by 10% compared to the normal value, and the other in which two parameters were modified by 10% (reaction time and acetate buffer concentration), and one was modified by 3.5% (pH value). Table 5 presents the values of the factors for each experiment.
Table 5.
The values of the factors for robustness tests.
Table 6 presents the values of Hg2+ concentration (µg/L) for both tests; values obtained when the pH, reaction time, and acetate buffer concentration were modified according to the data for A, B, and C factors (Table 5).
Table 6.
Hg2+ concentrations (µg/L) in test 1 and test 2 for all experiments, six replicates for each experiment.
Table 7 presents the data obtained in test 1 to verify the robustness of the electrochemical method. The ΣYA+ represents the sum of average values from T1-Y1 and T1-Y3: the experiments where Factor A had the highest value (pH = 3.3). The same ΣYA− represents the sum of average values from T1-Y2 and T1-Y4: the experiments where Factor A had the lowest value (pH = 2.7). The ΣYB+ represent the sum of average values from T1-Y1 and T1-Y2: the experiments where Factor B had the highest value (reaction time = 22 min), while the ΣYB− represents the sum of average values from T1-Y3 and T1-Y4: the experiments where Factor B had the lowest value (reaction time = 18 min). Regarding factor C, the highest value was 0.055 M acetate buffer concentration (the ΣYC+ was obtained from the sum of average values from T1-Y1 and T1-Y3) and the lowest value was 0.045 acetate buffer concentration (the ΣYC− was obtained from the sum of average values from T1-Y2 and T1-Y4). Values for absolute effect and relative effect for each factor were calculated using Equations (9) and (11).
Table 7.
Quantification of the variability of the operating parameters of the Hg2+ determination procedure using DPV technique with SPE-polyL modified electrodes, Test 1.
The comparison value used, according to Equation (11), is 10.5 µg/L, with SR for 20 µg/L being 7.52 µg/L (Table 3).
Table 8 presents the data obtained in test 2 to verify the robustness of the method. The values of the factors and their influence on the method were calculated in the same way as in test 1.
Table 8.
Quantification of the variability of the operating parameters of the Hg2+ determination procedure using DPV technique with SPE-polyL modified electrodes, Test 2.
3.1.9. Uncertainty Budget
In the estimation of the measurement uncertainty, data from the quality certificates of the reagents, the analytical balance, graduated flasks, and pipettes used in the entire procedures, as well as data from the precision and recovery tests, were used. Table 9 presents the values of uncertainty at three different concentrations.
Table 9.
Uncertainty values for electrochemical method.
3.2. Electrochemical Analysis of Hg2+ in Wastewater Samples
To verify the functionality of the electrochemical procedure with SPE modified with polyL films, mercury concentration from wastewater samples was determined in the laboratory and on-site using the portable potentiostat PalmSens4 connected to a laptop and equipped with PSTrace software. The obtained results were compared with those from the AAS-CV standardized method. Table 10 presents the values of Hg2+ concentrations in seventeen wastewater samples.
Table 10.
Hg2+ concentration in wastewater samples using the electrochemical procedure with SPE-polyL modified electrodes and AAS-CV.
4. Discussion
Usually, electrochemical studies report only few descriptive statistics and metrics, such as the standard deviation of the results, and thus complex validations of the proposed methods are not carried out, both in the case of electrochemical methods used to determine metals and pharmaceutical compounds.
In our previous studies, we introduced statistics and metrics other than standard deviation in the experimental tests, such as repeatability, intermediate precision, and measurement uncertainty [51,52].
In the present study, full validation test for a new method was applied in order to offer a solution for Hg2+ ion monitoring in wastewater to the analytical laboratories that do not have expensive equipment and specialized staff for quality control of water.
Thus, from the linearity test it was observed that the variation coefficient of the method is 1.23%, a very good value according to the literature [47]. Regarding repeatability (r) and intermediate precision (R) of the analytical methods, the literature data indicate that at the level from LOQ to 2LOQ, repeatability must be less than 25% and intermediate precision around 30% [47]. Obtained values reported in Table 2 and Table 3 indicated that the r and R values fell within the accepted range. For concentration from 2LOQ to 10 LOQ, r must be lower than 15% and R must be lower than 20% [47]. Repeatability and intermediate precision expressed in terms of percentage for the concentrations between 50 µg/L and 150 µg/L (Table 2 and Table 3) were situated below the admissible values.
Regarding recovery percentage, the literature indicates a recovery range between 80% and 110% for the concentration of 100 µg/L [47]: values in which the recovery tests fall.
From the data obtained in the robustness tests, it can be seen that the pH and the acetate buffer concentration do not significantly influence the electrochemical determination of Hg2+ using the DPV technique with the SPE-polyL modified electrodes. The absolute effects of factors A (pH) and C (acetate buffer concentration) in both tests had lower values than the comparison value of 10.5 µg/L (2.85 µg/L in test 1, 4.84 µg/L in test 2). In terms of relative effect, variation with ± 10% of factors A and C values indicates an influence from 15.4% (test 1) to 31.2% (test 2). The pH value situated in the range 2.7 to 3.3 pH units and acetate buffer concentration from 0.045 M to 0.05 M does not influence the electrochemical procedure.
Instead, in both tests, the absolute effect of factor B (reaction time) had a higher value than the comparison one (14.0 µg/L in test 1, 13.5 µg/L in test 2). In addition, a higher value of relative effect was obtained: 107% (test 1) to 210% (test 2).
The reaction time between the SPE-polyL modified electrode and the solution with Hg2+ ions is crucial for the method. The 10% variation of the reaction time indicates a major change; the values obtained in both tests (Table 7 and Table 8) show that the change of this factor determines a lack of the method robustness.
The “in-house” validated method for the determination of Hg using modified SPE with complexing polymeric film based on polyL leads to precise and accurate results, with a measurement uncertainty of 26% at 50 µg/L Hg2+, which represents the maximum allowed limit for wastewater originating from treatment plants and discharged into natural receptors. For these reasons, the method is suitable for controlling and monitoring on-site of Hg2+ ions in wastewater samples.
The data presented in Table 10 regarding Hg2+ concentration in wastewater samples show comparable results both in the field and in the laboratory using the electrochemical procedure with SPE-polyL modified electrodes. In addition, the electrochemical results (EC lab, EC on-site) were in the same range with those obtained from the AAS-CV technique.
5. Conclusions
The validated method allows the determination of the Hg2+ concentration directly at the pollution source using a method with low complexity and affordable equipment.
The proposed procedure for the determination of Hg2+ using the SPE-polyL modified electrode has a wide linear range, low LOD and LOQ values, suitable repeatability, intermediate precision, and uncertainty values. According to the robustness tests, pH and acetate buffer concentration does not influence the method in the range studied (+10% variation), while reaction time has a strong effect in the procedure. Hence, the last parameter should be carefully considered to obtain adequate results. The results obtained in situ and in the laboratory were compared with those obtained using the standardized method, with the average values indicating very good recovery yields and the Hg2+ concentrations being both in the linear range of the calibration curve and below the quantification limit. The electrochemical procedure for the determination of Hg2+ using the SPE-polyL electrode is suitable for field monitoring of wastewater.
6. Patents
Invention patent application OSIM (Romanian State Office for Patents and Brands) no. A00464/29.07.2022. A method for obtaining a screen-printed electrode modified with polymeric films and an electrochemical procedure for field determination of mercury concentration in wastewater.
Supplementary Materials
The following supporting information can be downloaded at: https://www.mdpi.com/article/10.3390/s23031084/s1, Figure S1: Succesive cyclic voltamograms recorded in 1.5 mM L in 0.1M TBAP, acetonitrile solution at carbon SPE (0.1 V/s); Figure S2: Succesive cyclic voltamograms recorded in 0.1 M TBAP, acetonitrile solution at SPE-polyL modified electrode (0.1 V/s); Figure S3: DPV stripping curves recorded on SPE electrode modified with polyL before and after mercury complexation; the accumulation was performed in acetate buffer at pH 3.0 containing 10-7 M Hg(II) for a time of 20 min; and the reduction was performed at −1.3 V for 15 s; Figure S4: Effect of interfering cations (I: (Zn(II), Cd(II), Pb(II), Ni(II), Co(III), and Cu(II)) on 50 μg Hg(II) detection after open-circuit accumulation of 20 min in acetate buffer (pH = 3). Each interfering ions is at the same specified mass equivalent vs. Hg(II) ions concentration.
Author Contributions
Conceptualization, G.-O.B. and G.-G.V.; methodology, G.-G.V.; software, G.-O.B.; validation, G.-O.B. and G.-G.V.; formal analysis, A.-G.T. and C.D.; investigation, G.-G.V.; resources, G.-G.V.; data curation, G.-O.B. and G.-G.V.; writing—original draft preparation, C.D. and A.-G.T.; writing—review and editing, G.-G.V.; visualization, G.-O.B. and C.D.; supervision, G.-O.B.; project administration, G.-O.B.; funding acquisition, G.-G.V. All authors have read and agreed to the published version of the manuscript.
Funding
Romanian National Authority for Scientific Research, UEFISCDI, under grant PN-III-P2-2.1-PED-2019-0730, contract no. 293PED/2020.
Institutional Review Board Statement
Not applicable.
Informed Consent Statement
Not applicable.
Data Availability Statement
RO-BOPI 11/29.11.2022, pp. 44, https://www.osim.ro/images/Publicatii/Inventii/2022/bopi_11_2022.pdf. (accessed on 21 December 2022).
Acknowledgments
The authors gratefully acknowledge the financial support of the Romanian National Authority for Scientific Research, UEFISCDI, under grant PN-III-P2-2.1-PED-2019-0730, contract no. 293PED/2020.
Conflicts of Interest
The authors declare no conflict of interest. The funders had no role in the design of the study; in the collection, analyses, or interpretation of data; in the writing of the manuscript; or in the decision to publish the results.
References
- Jeromiyas, N.; Elaiyappillai, E.; Kumar, A.S.; Huang, S.-T.; Mani, V. Bismuth nanoparticles decorated graphenated carbon nanotubes modified screen-printed electrode for mercury detection. J. Taiwan Inst. Chem. Eng. 2019, 95, 466–474. [Google Scholar] [CrossRef]
- Chen, G.; Guo, Z.; Zeng, G.; Tang, L. Fluorescent and colorimetric sensors for environmental mercury detection. Analyst 2015, 140, 5400–5443. [Google Scholar] [CrossRef] [PubMed]
- Hu, J.; Li, J.; Qi, J.; Chen, J. Highly selective and effective mercury(ii) fluorescent sensors. New J. Chem. 2015, 39, 843–848. [Google Scholar] [CrossRef]
- Sun, X.; Liu, R.; Liu, Q.; Fei, Q.; Feng, G.; Shan, H.; Huan, Y. Colorimetric sensing of mercury (II) ion based on anti-aggregation of gold nanoparticles in the presence of hexadecyl trimethyl ammonium bromide. Sens. Actuators B Chem. 2018, 260, 998–1003. [Google Scholar] [CrossRef]
- Zhang, J.R.; Huang, W.T.; Zeng, A.L.; Luo, H.Q.; Li, N.B. Ethynyl and π-stacked thymine–Hg2+–thymine base pairs enhanced fluorescence quenching via photoinduced electron transfer and simple and sensitive mercury ion sensing. Biosens. Bioelectron. 2015, 64, 597–604. [Google Scholar] [CrossRef] [PubMed]
- Sánchez-Calvo, A.; Fernández-Abedul, M.; Blanco-López, M.; Costa-García, A. Paper-based electrochemical transducer modified with nanomaterials for mercury determination in environmental waters. Sens. Actuators B Chem. 2019, 290, 87–92. [Google Scholar] [CrossRef]
- Jia, S.; Bian, C.; Sun, J.; Tong, J.; Xia, S. A wavelength-modulated localized surface plasmon resonance (LSPR) optical fiber sensor for sensitive detection of mercury(II) ion by gold nanoparticles-DNA conjugates. Biosens. Bioelectron. 2018, 114, 15–21. [Google Scholar] [CrossRef]
- Duan, J.; Zhan, J. Recent developments on nanomaterials-based optical sensors for Hg2+ detection. Sci. China Mater. 2015, 58, 223–240. [Google Scholar] [CrossRef]
- Yu, L.; Sun, L.; Zhang, Q.; Zhou, Y.; Zhang, J.; Yang, B.; Xu, B.; Xu, Q. Nanomaterials-Based Ion-Imprinted Electrochemical Sensors for Heavy Metal Ions Detection: A Review. Biosensors 2022, 12, 1096. [Google Scholar] [CrossRef]
- Manavalan, S.; Govindasamy, M.; Chen, S.-M.; Rajaji, U.; Chen, T.-W.; Ali, M.A.; Al-Hemaid, F.M.; Elshikh, M.; Farah, M.A. Reduced graphene oxide supported raspberry-like SrWO4 for sensitive detection of catechol in green tea and drinking water samples. J. Taiwan Inst. Chem. Eng. 2018, 89, 215–223. [Google Scholar] [CrossRef]
- Govindasamy, M.; Sriram, B.; Wang, S.-F.; Chang, Y.-J.; Rajabathar, J.R. Highly sensitive determination of cancer toxic mercury ions in biological and human sustenance samples based on green and robust synthesized stannic oxide nanoparticles decorated reduced graphene oxide sheets. Anal. Chim. Acta 2020, 1137, 181–190. [Google Scholar] [CrossRef] [PubMed]
- Butmee, P.; Mala, J.; Damphathik, C.; Kunpatee, K.; Tumcharern, G.; Kerr, M.; Mehmeti, E.; Raber, G.; Kalcher, K.; Samphao, A. A portable selective electrochemical sensor amplified with Fe3O4@Au-cysteamine-thymine acetic acid as conductive mediator for determination of mercuric ion. Talanta 2021, 221, 121669. [Google Scholar] [CrossRef] [PubMed]
- Bohari, N.A.; Siddiquee, S.; Saallah, S.; Misson, M.; Arshad, S.E. Optimization and Analytical Behavior of Electrochemical Sensors Based on the Modification of Indium Tin Oxide (ITO) Using PANI/MWCNTs/AuNPs for Mercury Detection. Sensors 2020, 20, 6502. [Google Scholar] [CrossRef] [PubMed]
- Xiong, C.; Xu, Y.; Bian, C.; Wang, R.; Xie, Y.; Han, M.; Xia, S. Synthesis and Characterization of Ru-MOFs on Microelectrode for Trace Mercury Detection. Sensors 2020, 20, 6686. [Google Scholar] [CrossRef] [PubMed]
- Tapia, M.A.; Pérez-Ràfols, C.; Gusmão, R.; Serrano, N.; Sofer, Z.; Díaz-Cruz, J.M. Enhanced voltammetric determination of metal ions by using a bismuthene-modified screen-printed electrode. Electrochim. Acta 2020, 362, 137144. [Google Scholar] [CrossRef]
- Foster, C.W.; Kadara, R.O.; Banks, C.E. Introduction and Current Applications of Screen-Printed Electrochemical Architectures; Springer Briefs in Applied Sciences and Technology: Berlin, Germany, 2015. [Google Scholar] [CrossRef]
- Niu, X.; Lan, M.; Zhao, H.; Chen, C.; Li, Y.; Zhu, X. Review: Electrochemical Stripping Analysis of Trace Heavy Metals Using Screen-Printed Electrodes. Anal. Lett. 2013, 46, 2479–2502. [Google Scholar] [CrossRef]
- Foster, C.W.; de Souza, A.P.; Metters, J.P.; Bertottib, M.; Banks, C.E. Metallic modified (bismuth, antimony, tin and combinations therof) film carbon electrodes. Analyst 2015, 140, 7598–7612. [Google Scholar] [CrossRef]
- Aguirre, M.; Selva, E.; Hidalgo, M.; Canals, A. Dispersive liquid–liquid microextraction for metals enrichment: A useful strategy for improving sensitivity of laser-induced breakdown spectroscopy in liquid samples analysis. Talanta 2015, 131, 348–353. [Google Scholar] [CrossRef]
- Qi, P.; Qian, W.; Guo, L.; Xue, J.; Zhang, N.; Wang, Y.; Zhang, Z.; Zhang, Z.; Lin, L.; Sun, C.; et al. Sensing with Femtosecond Laser Filamentation. Sensors 2022, 22, 7076. [Google Scholar] [CrossRef]
- Lin, Q.; Bian, F.; Wei, Z.; Wang, S.; Duan, Y. A hydrogel-based solidification method for the direct analysis of liquid samples by laser-induced breakdown spectroscopy. J. Anal. At. Spectrom. 2017, 32, 1412–1419. [Google Scholar] [CrossRef]
- Zhang, Y.; Zhang, T.; Li, H. Application of laser-induced breakdown spectroscopy (LIBS) in environmental monitoring. Spectrochim. Acta Part B 2021, 181, 106218. [Google Scholar] [CrossRef]
- Khan, Z.H.; Ullah, M.H.; Rahman, B.; Talukder, A.I.; Wahadoszamen; Abedin, K.M.; Haider, A.F.M.Y. Laser-Induced Breakdown Spectroscopy (LIBS) for Trace Element Detection: A Review. J. Spectrosc. 2022, 2022, 3887038. [Google Scholar] [CrossRef]
- Wang, X.; Wei, Y.; Lin, Q.; Zhang, J.; Duan, Y. Simple, Fast Matrix Conversion and Membrane Separation Method for Ultrasensitive Metal Detection in Aqueous Samples by Laser-Induced Breakdown Spectroscopy. Anal. Chem. 2015, 87, 5577–5583. [Google Scholar] [CrossRef] [PubMed]
- Casanova, A.; Iniesta, J.; Gomis-Berenguer, A. Recent progress in the development of porous carbon-based electrodes for sensing applications. Analyst 2022, 147, 767–783. [Google Scholar] [CrossRef]
- Buica, G.-O.; Lazar, I.-G.; Saint-Aman, E.; Tecuceanu, V.; Dumitriu, C.; Anton, I.A.; Stoian, A.B.; Ungureanu, E.-M. Ultrasensitive modified electrode based on poly(1H-pyrrole-1-hexanoic acid) for Pb(II) detection. Sens. Actuators B 2017, 246, 434–443. [Google Scholar] [CrossRef]
- Bansod, B.K.; Kumar, T.; Thakur, R.; Rana, S.; Singh, I. A review on various electrochemical techniques for heavy metal ions detection with different sensing platforms. Biosens. Bioelectron. 2017, 94, 443–455. [Google Scholar] [CrossRef]
- Buica, G.-O.; Lazar, I.-G.; Birzan, L.; Lete, C.; Prodana, M.; Enachescu, M.; Tecuceanu, V.; Stoian, A.B.; Ungureanu, E.-M. Azulene-ethylenediaminetetraacetic acid: A versatile molecule for colorimetric and electrochemical sensors for metal ions. Electrochim. Acta 2018, 263, 382–390. [Google Scholar] [CrossRef]
- Liu, Y.; Weerasooriya, R.; Chen, X. The metal-organic framework supported gold nanoparticles as a highly sensitive platform for electrochemical detection of methyl mercury species in the aqueous environment. J. Hazard. Mater. 2022, 431, 128608. [Google Scholar] [CrossRef]
- Zhong, J.; Zhao, H.; Cheng, Y.; Feng, T.; Lan, M.; Zuo, S. A high-performance electrochemical sensor for the determination of Pb(II) based on conductive dopamine polymer doped polypyrrole hydrogel. J. Electroanal. Chem. 2021, 902, 115815. [Google Scholar] [CrossRef]
- Eswaran, M.; Tsai, P.-C.; Wu, M.-T.; Ponnusamy, V.K. Novel nano-engineered environmental sensor based on polymelamine/graphitic-carbon nitride nanohybrid material for sensitive and simultaneous monitoring of toxic heavy metals. J. Hazard. Mater. 2021, 418, 126267. [Google Scholar] [CrossRef]
- Hasan, A.; Nanakali, N.M.Q.; Salihi, A.; Rasti, B.; Sharifi, M.; Attar, F.; Derakhshankhah, H.; Mustafa, I.A.; Abdulqadir, S.Z.; Falahati, M. Nanozyme-based sensing platforms for detection of toxic mercury ions: An alternative approach to conventional methods. Talanta 2020, 215, 120939. [Google Scholar] [CrossRef] [PubMed]
- Araujo, R.; Castro, A.C.M.; Fiuza, A. The Use of Nanoparticles in Soil and Water Remediation Processes. Mater. Today Proc. 2015, 2, 315–320. [Google Scholar] [CrossRef]
- Wang, J.; Shaheen, S.M.; Anderson, C.W.N.; Xing, Y.; Liu, S.; Xia, J.; Feng, X.; Rinklebe, J. Nanoactivated Carbon Reduces Mercury Mobility and Uptake by Oryza sativa L.: Mechanistic Investigation Using Spectroscopic and Microscopic Techniques. Environ. Sci. Technol. 2020, 54, 2698–2706. [Google Scholar] [CrossRef] [PubMed]
- Wang, Z.; Zhang, J.; Wen, T.; Liu, X.; Wang, Y.; Yang, H.; Sun, J.; Feng, J.; Dong, S.; Sun, J. Highly effective remediation of Pb(II) and Hg(II) contaminated wastewater and soil by flower-like magnetic MoS2 nanohybrid. Sci. Total. Environ. 2020, 699, 134341. [Google Scholar] [CrossRef] [PubMed]
- Lu, F.; Astruc, D. Nanomaterials for removal of toxic elements from water. Co-ord. Chem. Rev. 2018, 356, 147–164. [Google Scholar] [CrossRef]
- Honeychurch, K.C. Screen-printed Electrochemical Sensors and Biosensors for Monitoring Metal Pollutants. Insciences J. 2012, 2, 1–51. [Google Scholar] [CrossRef]
- Tchekwagep, P.M.S.; Crapnell, R.D.; Banks, C.E.; Betlem, K.; Rinner, U.; Canfarotta, F.; Lowdon, J.W.; Eersels, K.; van Grinsven, B.; Peeters, M.; et al. A Critical Review on the Use of Molecular Imprinting for Trace Heavy Metal and Micropollutant Detection. Chemosensors 2022, 10, 296. [Google Scholar] [CrossRef]
- Martín-Yerga, D.; González-García, M.B. Electrochemical determination of mercury: A review. Talanta 2013, 116, 1091–1104. [Google Scholar] [CrossRef]
- Wang, J.; Tian, B. Screen-printed electrodes for stripping measurements of trace mercury. Anal. Chim. Acta 1993, 274, 1–6. [Google Scholar] [CrossRef]
- Bernalte, E.; Sánchez, C.M.; Gil, E.P. Gold nanoparticles-modified screen-printed carbon electrodes for anodic stripping voltammetric determination of mercury in ambient water samples. Sens. Actuators 2012, 161, 669–674. [Google Scholar] [CrossRef]
- Bernalte, E.; Sanchez, M.C.; Gil, P.E. Determination of mercury in indoor dust samples by ultrasonic probe microextraction and stripping voltammetry on gold nanoparticles-modified screen-printed electrodes. Talanta 2012, 9, 187–192. [Google Scholar] [CrossRef] [PubMed]
- Bernalte, E.; Sanchez, M.C.; Gil, P.E. Determination of mercury in ambient water samples by anodic stripping voltammetry on screen-printed gold electrodes. Anal. Chim. Acta 2011, 689, 60–64. [Google Scholar] [CrossRef]
- Mandil, A.; Idrissi, L.; Amine, A. Stripping voltammetric determination of mercury (II) and lead (II) using screen-printed electrodes modified with gold films, and metal ion preconcentration with thiol-modified magnetic particles. Microchim. Acta 2010, 170, 299–305. [Google Scholar] [CrossRef]
- Buica, G.-O.; Ivanov, A.A.; Lazar, I.-G.; Tatu, G.-L.; Omocea, C.; Birzan, L.; Ungureanu, E.-M. Colorimetric and voltammetric sensing of mercury ions using 2,2′-(ethane-1,2-diylbis((2-(azulen-2-ylamino)-2-oxoethyl)azanediyl))diacetic acid. J. Electroanal. Chem. 2019, 849, 113351. [Google Scholar] [CrossRef]
- EN ISO 12846:2012; Water Quality—Determination of Mercury—Method Using Atomic Absorption Spectrometry (AAS) with and without Enrichment. ISO: Geneva, Switzerland, 2012.
- Tanase, I.G.; Radu, G.L.; Pana, A.; Buleandra, M. Validation of Analytical Methods; Theoretical Principles and Case Studies; Printech Publishing House: Bucharest, Romania, 2007; pp. 185–199. (In Romanian) [Google Scholar]
- Taverniers, I.; Van Bockstaele, E.; De Loose, M. Analytical Method Validation and Quality Assurance in Pharmaceutical Sciences Encyclopedia: Drug Discovery, Development, and Manufacturing; Shayne, C., Ed.; John Wiley & Sons, Inc.: Hoboken, NJ, USA, 2010; pp. 1–48. [Google Scholar]
- Van Reeuwijk, L.P. Guidelines for Quality Management in Soil and Plant Laboratories; ISRIC 74; FAO Soils Bulletin: Rome, Italy, 1998; pp. 92–96. [Google Scholar]
- Vasile, G.G.; Popa, D.E.; Buleandra, M.; David, I.G. An experimental design for the optimization of the extraction methods of metallic mobile fractions from environmental solid samples. Environ. Monit. Assess. 2018, 190, 609. [Google Scholar] [CrossRef]
- Vasile, G.G.; Arnold, G.L.; Buica, G.O.; Ungureanu, E.M. Determination of lead content in soft water using stripping voltammetry on a modified glassy carbon electrode. Rev. Chim. 2018, 69, 21–26. [Google Scholar] [CrossRef]
- Lazar, I.G.; Diacu, E.; Vasile, G.G.; Ungureanu, E.M.; Ivanov, A.A. Study of analytical parameters of a differential pulse voltammetric method using chemically modified electrodes for lead analysis in water. Rev. Chim. 2018, 69, 2311–2314. [Google Scholar] [CrossRef]


Disclaimer/Publisher’s Note: The statements, opinions and data contained in all publications are solely those of the individual author(s) and contributor(s) and not of MDPI and/or the editor(s). MDPI and/or the editor(s) disclaim responsibility for any injury to people or property resulting from any ideas, methods, instructions or products referred to in the content. |
© 2023 by the authors. Licensee MDPI, Basel, Switzerland. This article is an open access article distributed under the terms and conditions of the Creative Commons Attribution (CC BY) license (https://creativecommons.org/licenses/by/4.0/).