
Robust Epileptic Seizure Detection Using Long Short-Term Memory and Feature Fusion of Compressed Time–Frequency EEG Images


Abstract
:1. Introduction
Contribution
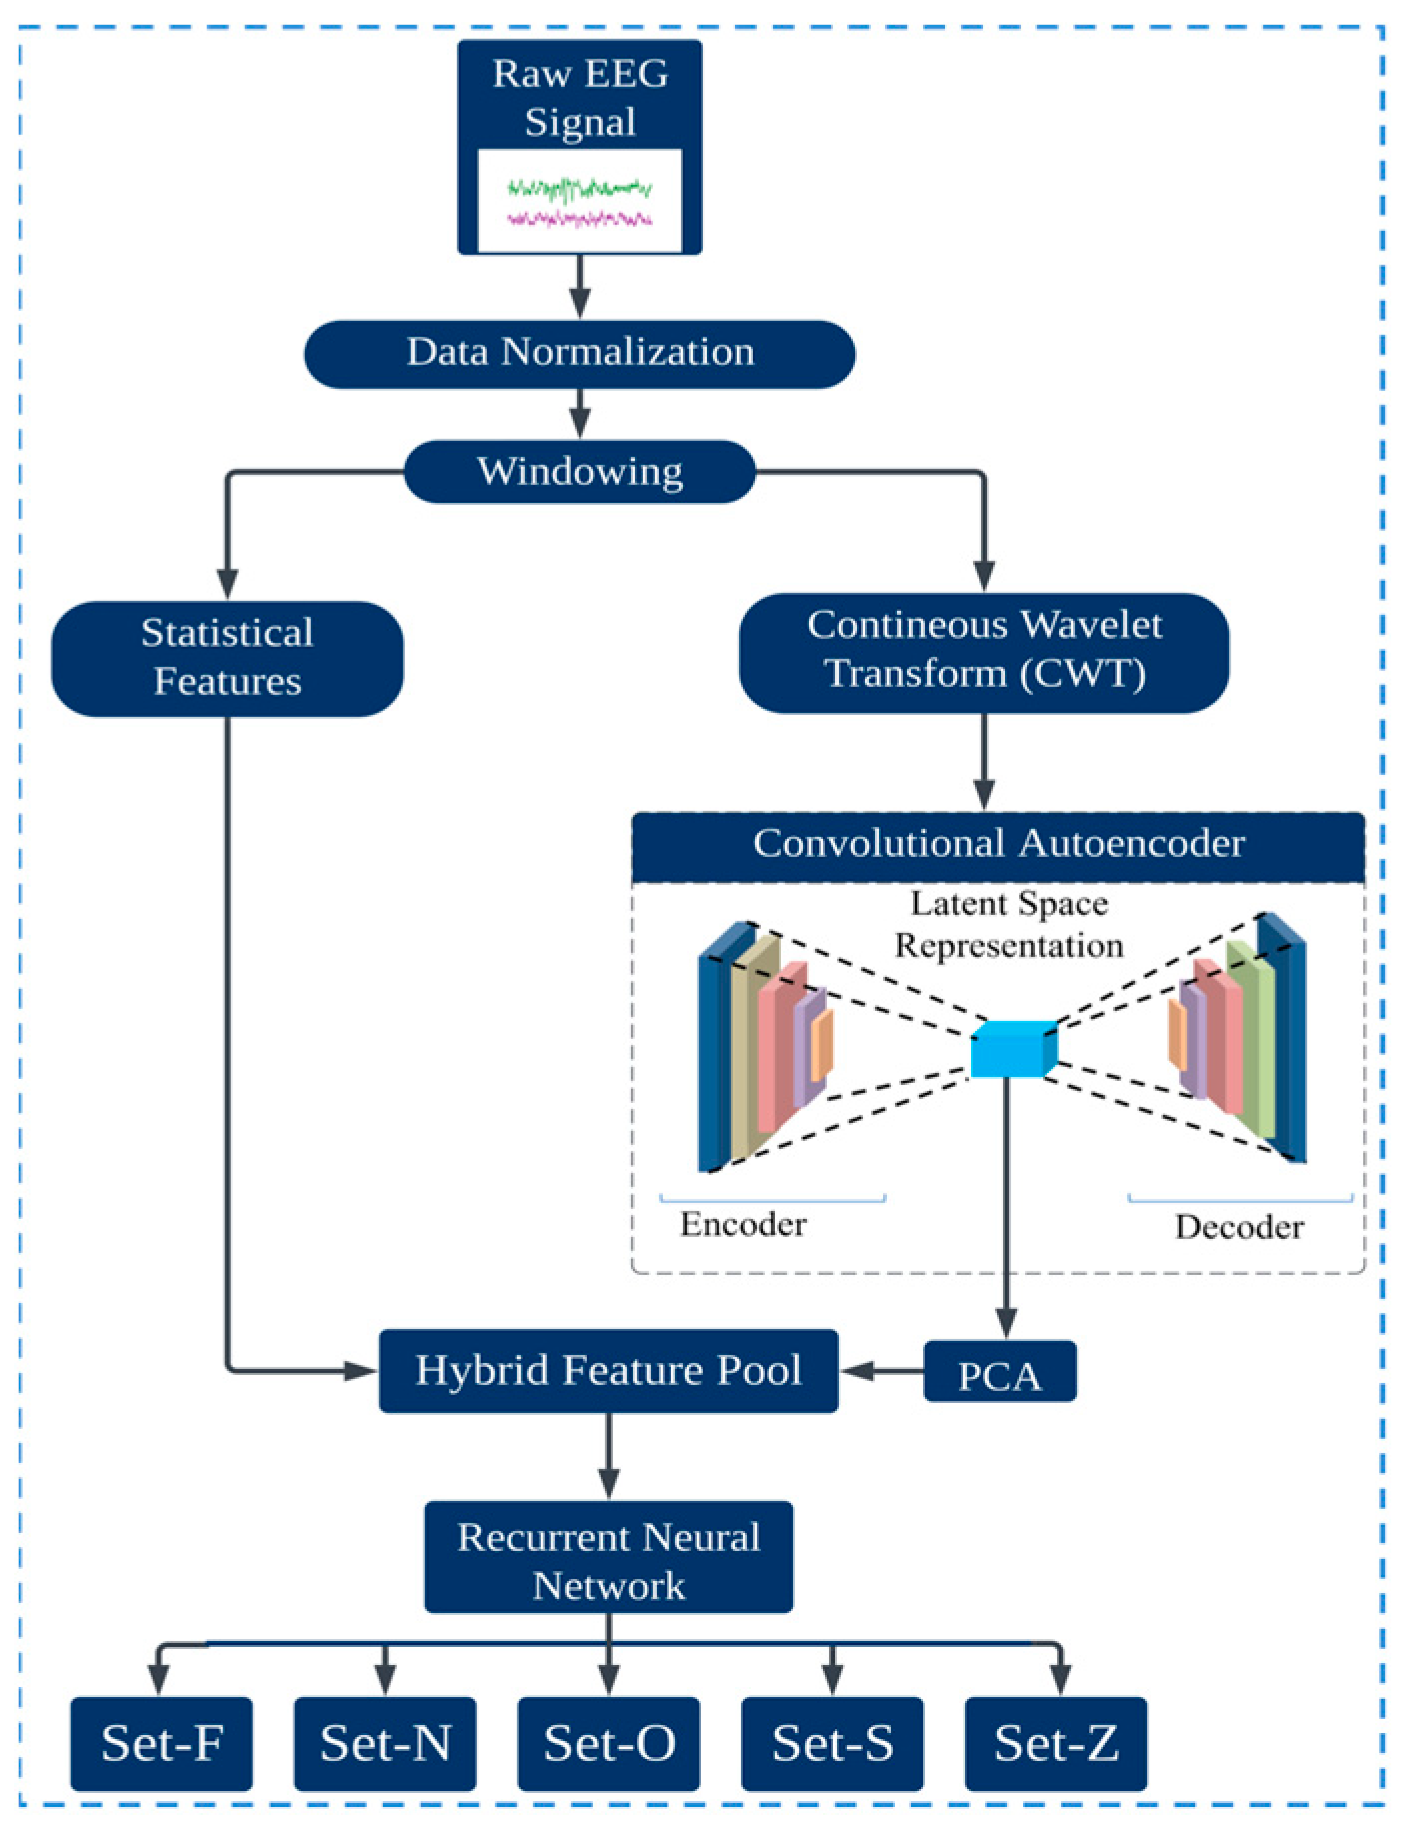
- This study introduces a significant advancement in epileptic seizure detection. The proposed novel deep learning method seamlessly merges the compressed latent space features from the time–frequency domain with statistical attributes of the EEG signal. This integrated feature pool captures time–frequency and statistical information, making this approach different in robustness and accuracy.
- The proposed hybrid model uses an optimal window size for EEG segmentation, ensuring minimal data loss and a set overlap ratio. After rigorous evaluation, this method selects the best window size for maximal data coverage, which is crucial for precise EEG classification. This strategy upholds data integrity, boosting the classification reliability of the model.
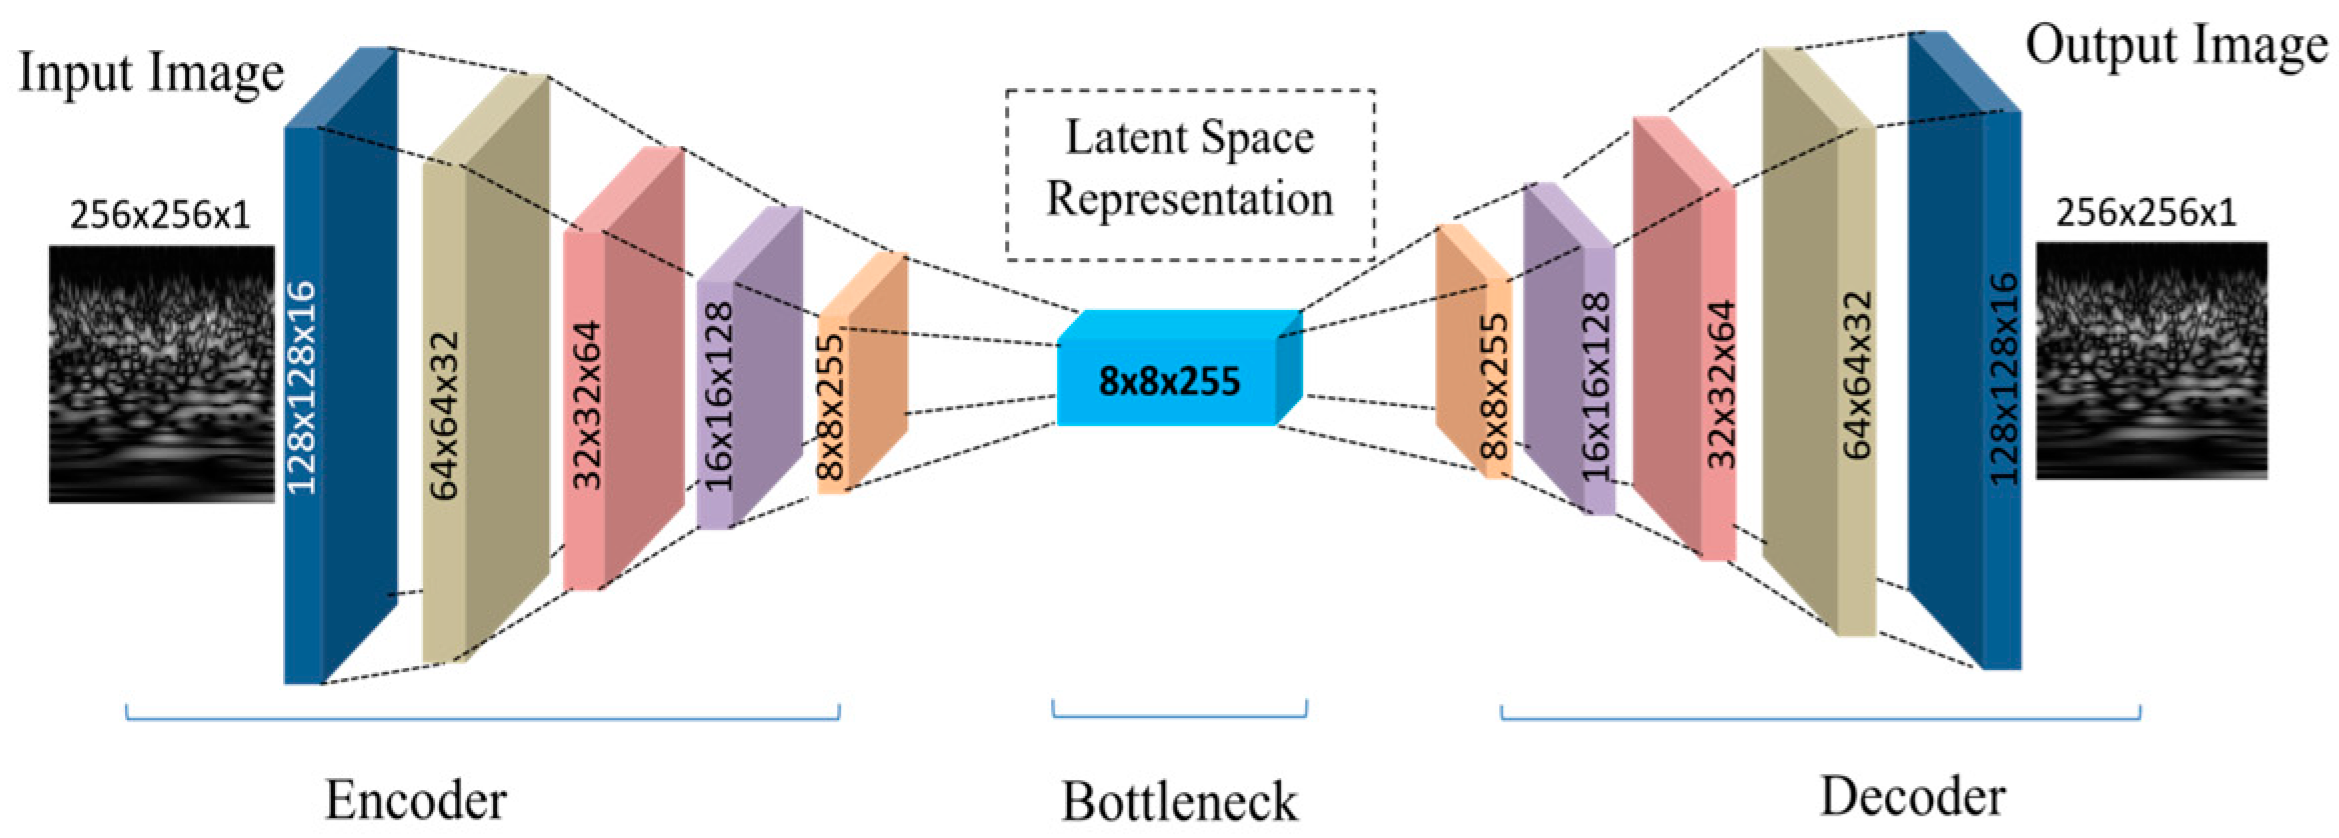
- A CAE was used for feature extraction from CWT images. CAEs excel at handling image data like EEG-based CWT by preserving spatial structures. The CAE retained the most important features and eliminated noise by compressing and reconstructing the image. This method reduced data dimensionality and identified the most vital EEG patterns, enhancing precision and accuracy in subsequent analysis.
- The CAE latent space features still contain some less important features. Principal Component Analysis (PCA) was applied to extract the most relevant features from the latent space, enhancing the classification accuracy.
- LSTM networks were used for classification, capitalizing on their proficiency with time-series data. Given the sequential nature of the EEG signals, LSTMs, with their ability to capture long-term dependencies, provided enhanced accuracy in detecting intricate seizure patterns.
- While many studies evaluate the Bonn dataset for binary classification, some extend to three or four classes, with few tackling a five-class problem. This study encompassed classifications from binary to five class, achieving unprecedented accuracy, i.e., 100% for binary, >95% for three and four classes, and above 93% for the five-class categorization, marking the highest recorded performance in terms of accuracy.
2. Proposed Method
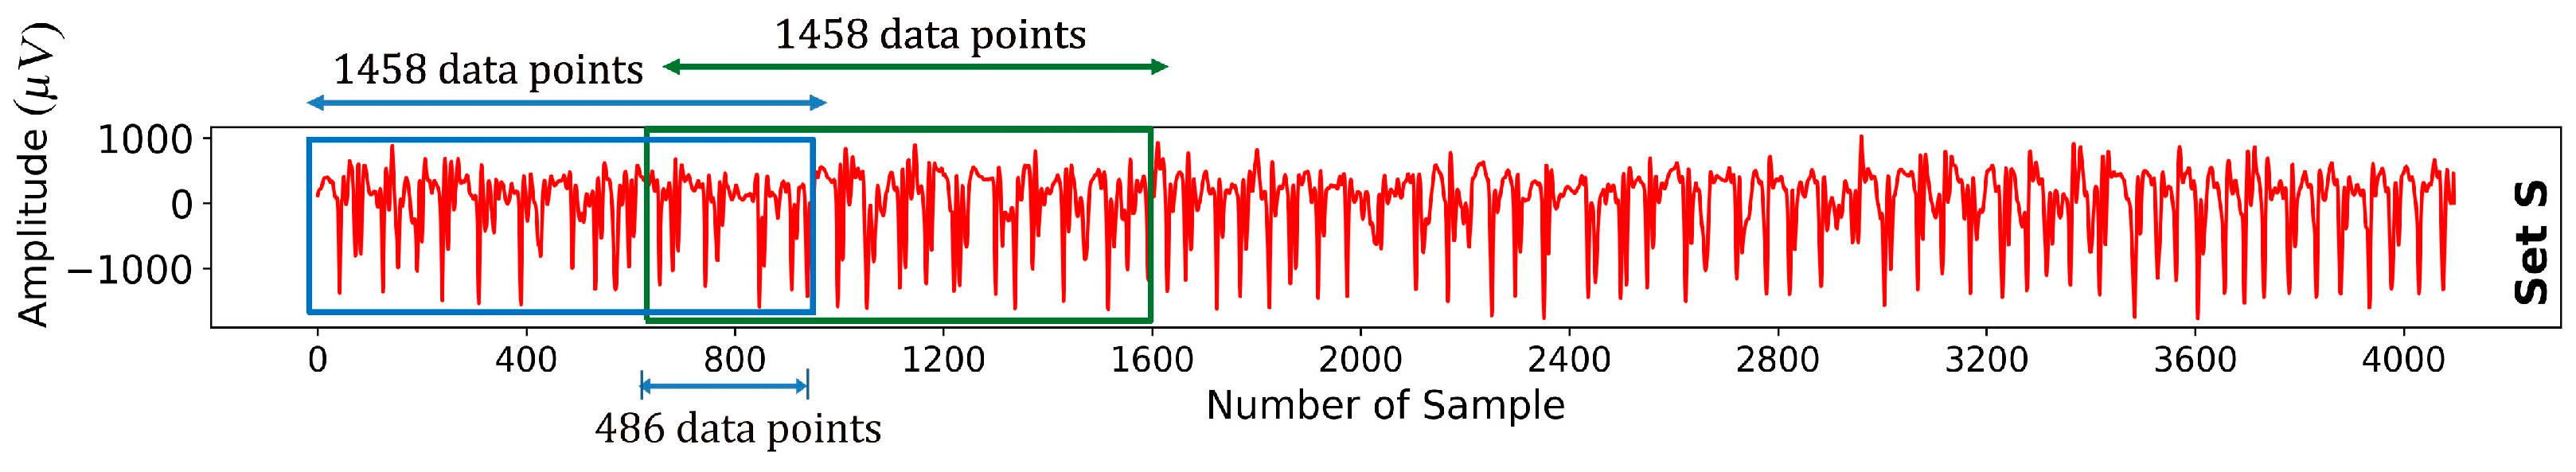
2.1. Windowing
- is the window length, and in this case, .
- is the overlap length, and here, .
- is the window number (e.g., for the first window, for the second, so on).
- It should be always ensured that for the above formulation to be valid.
2.2. Continuous Wavelet Transformation (CWT)
- is called the mother wavelet, which is a short wave-like oscillation.
- is the scaling factor. The function is stretched if or compressed if .
- is the translation factor, which shifts the function in time.
- is the variable of integration, typically representing time.
- The factor is a normalization term that ensures that the wavelet has the same energy at every scale.
2.3. Convolutional Autoencoder
2.3.1. Encoder
2.3.2. Decoder
2.4. Principal Component Analysis
2.5. Statistical Features
2.6. Hybrid Features Pool
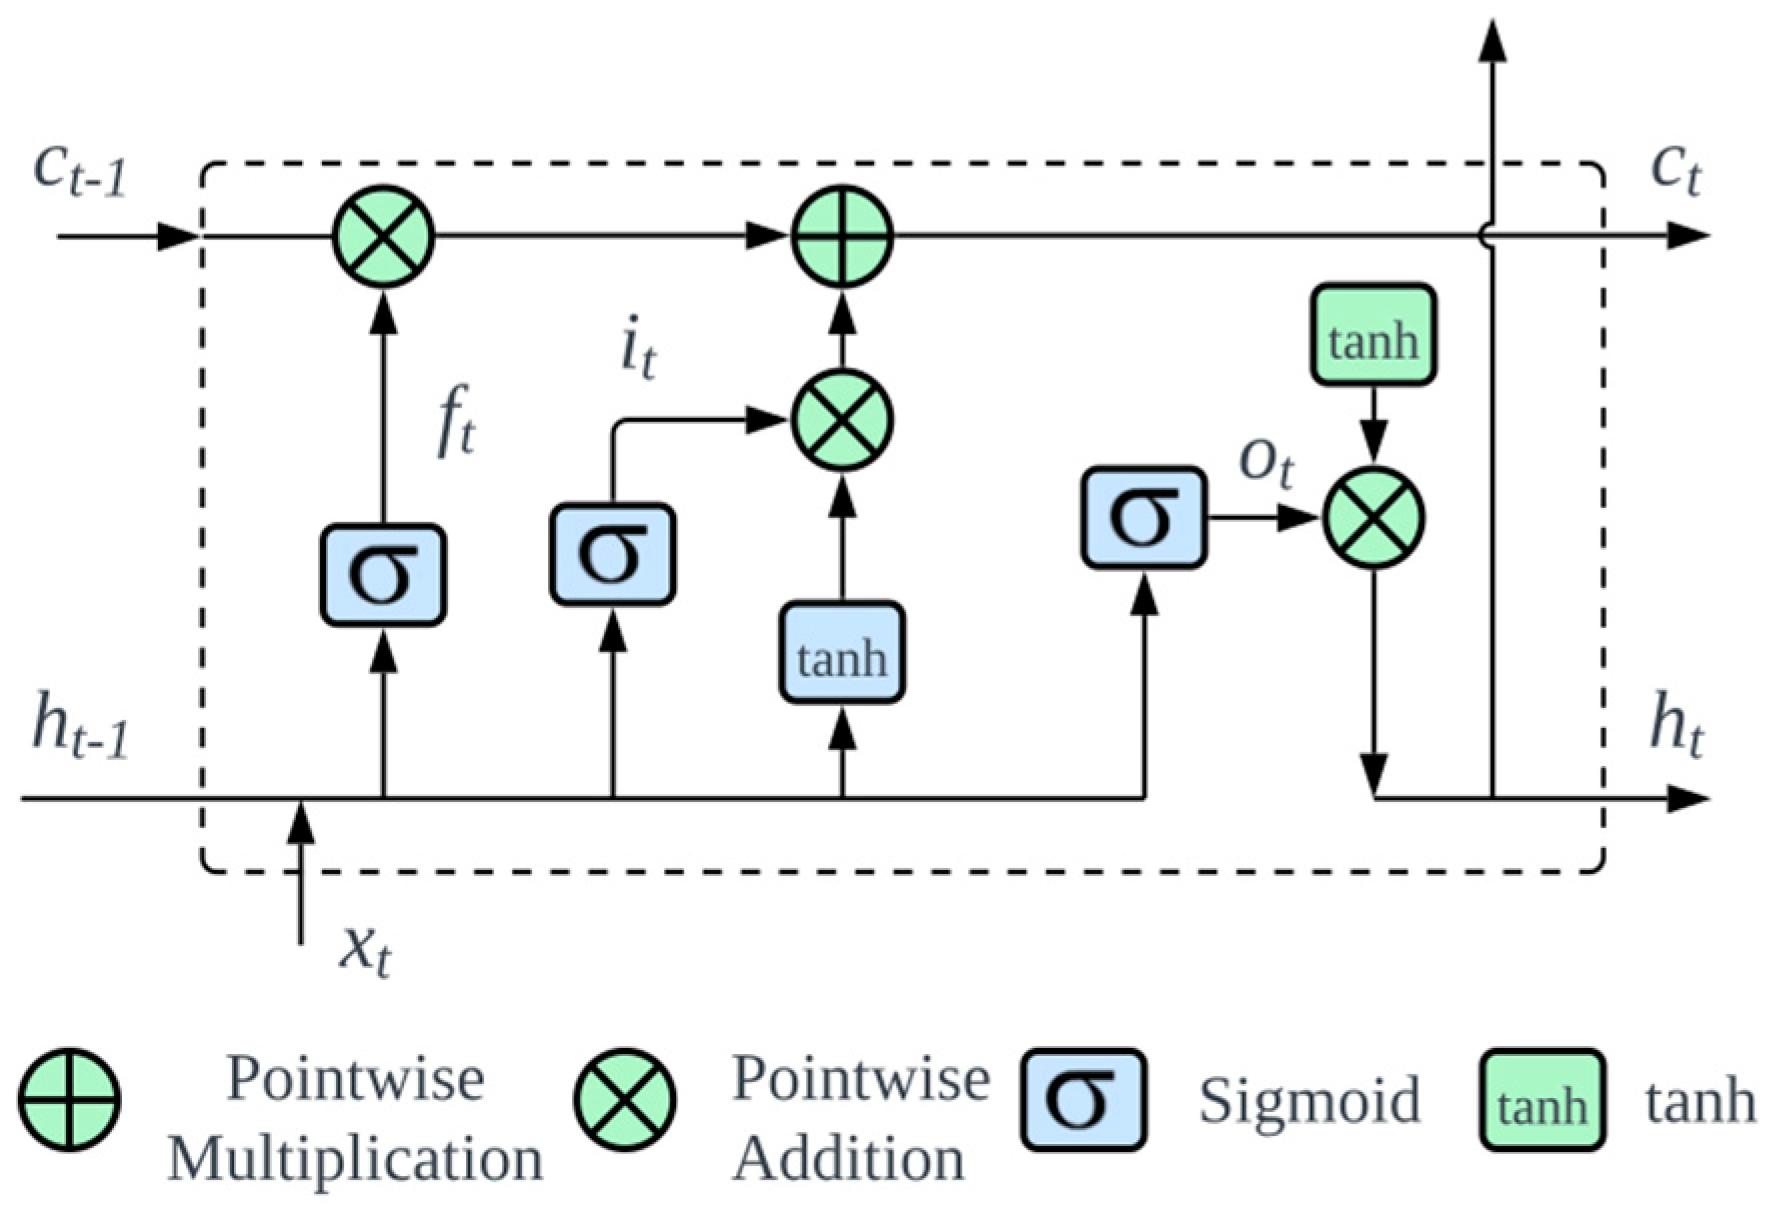
2.7. Long Short-Term Memory
3. Performance Evaluation
3.1. Meta Data
- True Positive (TP): instances confirmed to be positive.
- True Negative (TN): instances confirmed to be negative.
- False Positive (FP): instances incorrectly identified as positive.
- False Negative (FN): positive instances mistakenly identified as negative.
- Binary Classification: N–S, Z–S, O–S, F–S, FN–S, FNZ–S, FNO–S, and NOZ–S.
- Three-Class Classification: F–O–S, N–Z–S, O–Z–S, and FN–OZ–S.
- Four-Class Classification: F–O–Z–S and N–O–Z–S.
- Five-Class Classification: F–N–O–Z–S.
3.2. Binary Classification
3.3. Three-Class Classification
3.4. Four-Class Classification
3.5. Five-Class Classification
4. Discussion
5. Conclusions
Author Contributions
Funding
Institutional Review Board Statement
Informed Consent Statement
Data Availability Statement
Conflicts of Interest
References
- Kuhlmann, L.; Lehnertz, K.; Richardson, M.P.; Schelter, B.; Zaveri, H.P. Seizure prediction—Ready for a new era. Nat. Rev. Neurol. 2018, 14, 618–630. [Google Scholar] [CrossRef]
- Liu, T.; Shah, M.Z.H.; Yan, X.; Yang, D. Unsupervised feature representation based on deep boltzmann machine for seizure detection. IEEE Trans. Neural Syst. Rehabil. Eng. 2023, 31, 1624–1634. [Google Scholar] [CrossRef]
- Rungratsameetaweemana, N.; Lainscsek, C.; Cash, S.S.; Garcia, J.O.; Sejnowski, T.J.; Bansal, K. Brain network dynamics codify heterogeneity in seizure propagation. bioRxiv 2021, 2021-06. [Google Scholar] [CrossRef]
- Larivière, S.; Rodríguez-Cruces, R.; Royer, J.; Caligiuri, M.E.; Gambardella, A.; Concha, L.; Keller, S.S.; Cendes, F.; Yasuda, C.; Bonilha, L.; et al. Network-based atrophy modeling in the common epilepsies: A worldwide ENIGMA study. Sci. Adv. 2020, 6, eabc6457. [Google Scholar] [CrossRef] [PubMed]
- Ahmad, I.; Wang, X.; Javeed, D.; Kumar, P.; Samuel, O.W.; Chen, S. A hybrid deep learning approach for epileptic seizure detection in eeg signals. IEEE J. Biomed. Health Inform. 2023; Online ahead of print. [Google Scholar] [CrossRef]
- Bomela, W.; Wang, S.; Chou, C.-A.; Li, J.-S. Real-time Inference and Detection of Disruptive EEG Networks for Epileptic Seizures. Sci. Rep. 2020, 10, 8653. [Google Scholar] [CrossRef] [PubMed]
- Zhu, G.; Li, Y.; Wen, P.; Wang, S. Classifying epileptic eeg signals with delay permutation entropy and multi-scale k-means. In Signal and Image Analysis for Biomedical and Life Sciences; Springer: Berlin/Heidelberg, Germany, 2015; pp. 143–157. [Google Scholar]
- Raeisi, K.; Khazaei, M.; Croce, P.; Tamburro, G.; Comani, S.; Zappasodi, F. A graph convolutional neural network for the automated detection of seizures in the neonatal EEG. Comput. Methods Programs Biomed. 2022, 222, 106950. [Google Scholar] [CrossRef] [PubMed]
- Akyol, K. Stacking ensemble based deep neural networks modeling for effective epileptic seizure detection. Expert Syst. Appl. 2020, 148, 113239. [Google Scholar] [CrossRef]
- da Silva Lourenc, C.; Tjepkema-Cloostermans, M.C.; van Putten, M.J. Machine learning for detection of interictal epileptiform dis- charges. Clin. Neurophysiol. 2021, 132, 1433–1443. [Google Scholar] [CrossRef]
- Yazid, M.; Fahmi, F.; Sutanto, E.; Shalannanda, W.; Shoalihin, R.; Horng, G.-J.; Aripriharta. Simple detection of epilepsy from eeg signal using local binary pattern transition histogram. IEEE Access 2021, 9, 150252–150267. [Google Scholar] [CrossRef]
- Malekzadeh, A.; Zare, A.; Yaghoobi, M.; Kobravi, H.-R.; Alizadehsani, R. Epileptic seizures detection in eeg signals using fusion handcrafted and deep learning features. Sensors 2021, 21, 7710. [Google Scholar] [CrossRef]
- Aayesha; Afzaal, M.; Qureshi, M.S.; Fayaz, M. Machine learning-based EEG signals classification model for epileptic seizure detection. Multimed. Tools Appl. 2021, 80, 17849–17877. [Google Scholar] [CrossRef]
- Sharmila, A.; Geethanjali, P. DWT based detection of epileptic seizure from eeg signals using naive bayes and k-nn classifiers. IEEE Access 2016, 4, 7716–7727. [Google Scholar] [CrossRef]
- Al-Hadeethi, H.; Abdulla, S.; Diykh, M.; Deo, R.C.; Green, J.H. Adaptive boost ls-svm classification approach for time-series signal classification in epileptic seizure diagnosis applications. Expert Syst. Appl. 2020, 161, 113676. [Google Scholar] [CrossRef]
- Beeraka, S.M.; Kumar, A.; Sameer, M.; Ghosh, S.; Gupta, B. Accuracy enhancement of epileptic seizure detection: A deep learning approach with hardware realization of stft. Circuits Syst. Signal Process. 2021, 41, 461–484. [Google Scholar] [CrossRef]
- Driscoll, N.; Rosch, R.E.; Murphy, B.B.; Ashourvan, A.; Vishnubhotla, R.; Dickens, O.O.; Johnson, A.T.C.; Davis, K.A.; Litt, B.; Bassett, D.S.; et al. Multimodal in vivo recording using transparent graphene microelectrodes illuminates spatiotemporal seizure dynamics at the microscale. Commun. Biol. 2021, 4, 136. [Google Scholar] [CrossRef] [PubMed]
- Omidvar, M.; Zahedi, A.; Bakhshi, H. Eeg signal processing for epilepsy seizure detection using 5-level db4 discrete wavelet transform, ga-based feature selection and ann/svm classifiers. J. Ambient. Intell. Humaniz. Comput. 2021, 12, 10395–10403. [Google Scholar] [CrossRef]
- Gupta, V.; Pachori, R.B. Epileptic seizure identification using entropy of fbse based eeg rhythms. Biomed. Signal Process. Control 2019, 53, 101569. [Google Scholar] [CrossRef]
- Na, J.; Wang, Z.; Lv, S.; Xu, Z. An extended k nearest neighbors-based classifier for epilepsy diagnosis. IEEE Access 2021, 9, 73910–73923. [Google Scholar] [CrossRef]
- Polat, K.; Nour, M. Epileptic seizure detection based on new hybrid models with electroen-cephalogram signals. IRBM 2020, 41, 331–353. [Google Scholar] [CrossRef]
- Miltiadous, A.; Tzimourta, K.D.; Giannakeas, N.; Tsipouras, M.G.; Glavas, E.; Kalafatakis, K.; Tzallas, A.T. Machine learning al- gorithms for epilepsy detection based on published eeg databases: A systematic review. IEEE Access 2023, 11, 564–594. [Google Scholar] [CrossRef]
- Piho, L.; Tjahjadi, T. A mutual information based adaptive windowing of informative eeg for emotion recognition. IEEE Trans. Affect. Comput. 2020, 11, 722–735. [Google Scholar] [CrossRef]
- Yang, X.; Zhao, J.; Sun, Q.; Lu, J.; Ma, X. An effective dual self-attention residual network for seizure prediction. IEEE Trans. Neural Syst. Rehabil. Eng. 2021, 29, 1604–1613. [Google Scholar] [CrossRef]
- Shankar, A.; Dandapat, S.; Barma, S. Seizure types classification by generating input images with in-depth features from decomposed eeg signals for deep learning pipeline. IEEE J. Biomed. Health Inform. 2022, 26, 4903–4912. [Google Scholar] [CrossRef]
- Humairani, A.; Rizal, A.; Wijayanto, I.; Hadiyoso, S.; Fuadah, Y.N. Wavelet-based entropy analysis on eeg signal for detecting seizures. In Proceedings of the 2022 10th International Conference on Information and Communication Technology (ICoICT), Virtual, 2–3 August 2022; pp. 93–98. [Google Scholar]
- Shuvo, S.B.; Ali, S.N.; Swapnil, S.I.; Hasan, T.; Bhuiyan, M.I.H. A lightweight cnn model for detecting respiratory diseases from lung auscultation sounds using emd-cwt-based hybrid scalogram. IEEE J. Biomed. Health Inform. 2021, 25, 2595–2603. [Google Scholar] [CrossRef] [PubMed]
- Bu, R. An algorithm for the continuous morlet wavelet transform. Mech. Syst. Signal Process. 2007, 21, 2970–2979. [Google Scholar]
- Theis, L.; Shi, W.; Cunningham, A.; Husza, F. Lossy image compression with compressive autoencoders. arXiv 2017, arXiv:1703.00395. [Google Scholar]
- Balle, J.; Laparra, V.; Simoncelli, E.P. End-to-end optimized image compression. arXiv 2016, arXiv:1611.01704. [Google Scholar]
- Metzner, C.; Schilling, A.; Traxdorf, M.; Schulze, H.; Tziridis, K.; Krauss, P. Extracting continuous sleep depth from EEG data without machine learning. Neurobiol. Sleep Circadian Rhythm. 2023, 14, 100097. [Google Scholar] [CrossRef] [PubMed]
- Ashraf, M.; Anowar, F.; Setu, J.H.; Chowdhury, A.I.; Ahmed, E.; Islam, A.; Al-Mamun, A. A survey on dimensionality reduction techniques for time-series data. IEEE Access 2023, 11, 42909–42923. [Google Scholar] [CrossRef]
- Ataee, P.; Yazdani, A.; Setarehdan, S.K.; Noubari, H.A. Manifold learning applied on eeg signal of the epileptic patients for detection of normal and pre-seizure states. In Proceedings of the 2007 29th Annual International Conference of the IEEE Engineering in Medicine and Biology Society, Lyon, France, 22–26 August 2007; IEEE: New York, NY, USA, 2007; pp. 5489–5492. [Google Scholar]
- Gu, X.; Cao, Z.; Jolfaei, A.; Xu, P.; Wu, D.; Jung, T.P.; Lin, C.T. EEG-based brain-computer interfaces (BCIs): A survey of recent studies on signal sensing technologies and computational intelligence approaches and their applications. IEEE/ACM Trans. Comput. Biol. Bioinform. 2021, 18, 1645–1666. [Google Scholar] [CrossRef]
- Rabby, M.K.M.; Eshun, R.B.; Belkasim, S.; Islam, A.K. Epileptic seizure detection using eeg signal based lstm models. In Proceedings of the 2021 IEEE Fourth International Conference on Artificial Intelligence and Knowl- edge Engineering (AIKE), Laguna Hills, CA, USA, 1–3 December 2021; pp. 131–132. [Google Scholar]
- Andrzejak, R.G.; Lehnertz, K.; Mormann, F.; Rieke, C.; David, P.; Elger, C.E. Indications of nonlinear deterministic and finite-dimensional structures in time series of brain electrical activity: Dependence on recording region and brain state. Phys. Rev. E 2001, 64, 061907. Available online: https://link.aps.org/doi/10.1103/PhysRevE.64.061907 (accessed on 3 March 2023). [CrossRef]
- Zarei, A.; Asl, B.M. Automatic seizure detection using orthogonal matching pursuit, discrete wavelet transform, and entropy based features of eeg signals. Comput. Biol. Med. 2021, 131, 104250. [Google Scholar] [CrossRef] [PubMed]
- Wang, X.; Gong, G.; Li, N. Automated recognition of epileptic eeg states using a combination of symlet wavelet processing, gradient boosting machine, and grid search optimizer. Sensors 2019, 19, 219. [Google Scholar] [CrossRef] [PubMed]
- Mamli, S.; Kalbkhani, H. Gray-level co-occurrence matrix of fourier synchro-squeezed transform for epileptic seizure detection. Biocybern. Biomed. Eng. 2019, 39, 87–99. [Google Scholar] [CrossRef]
- Bari, M.F.; Fattah, S.A. Epileptic seizure detection in eeg signals using normalized imfs in ceemdan domain and quadratic discrimi- nant classifier. Biomed. Signal Process. Control 2020, 58, 101833. [Google Scholar] [CrossRef]
- Kaur, T.; Gandhi, T.K. Automated diagnosis of epileptic seizures using eeg image representations and deep learning. Neurosci. Inform. 2023, 3, 100139. [Google Scholar] [CrossRef]
- Zhao, X.; Zhang, R.; Mei, Z.; Chen, C.; Chen, W. Identification of epileptic seizures by characterizing instantaneous energy behavior of eeg. IEEE Access 2019, 7, 70059–70076. [Google Scholar] [CrossRef]
- Baykara, M.; Abdulrahman, A. Seizure detection based on adaptive feature extraction by applying extreme learning machines. Trait. Signal 2021, 38, 331–340. [Google Scholar] [CrossRef]
- Türk, Ö.; Özerdem, M.S. Epilepsy detection by using scalogram based convolutional neural network from eeg signals. Brain Sci. 2019, 9, 115. [Google Scholar] [CrossRef]
- Zhang, T.; Han, Z.; Chen, X.; Chen, W. Subbands and cumulative sum of subbands based nonlinear features enhance the performance of epileptic seizure detection. Biomed. Signal Process. Control 2021, 69, 102827. [Google Scholar] [CrossRef]
- Zhou, D.; Li, X. Epilepsy eeg signal classification algorithm based on improved rbf. Front. Neurosci. 2020, 14, 606. [Google Scholar] [CrossRef] [PubMed]


| Encoder | ||
| Layer (type) | Output Shape | Param# |
| Conv2D | (None, 128, 128, 16) | 160 |
| Conv2D | (None, 64, 64, 32) | 4640 |
| Conv2D | (None, 32, 32, 64) | 18,496 |
| Conv2D | (None, 16, 16, 128) | 73,856 |
| Conv2D | (None, 8, 8, 255) | 294,015 |
| Total parameters | 391,167 | |
| Trainable parameters | 391,167 | |
| Non-trainable parameters | 0 | |
| Decoder | ||
| Layer (type) | Output Shape | Param# |
| Conv2D Transpose | (None, 16, 16, 128) | 293,888 |
| Conv2D Transpose | (None, 32, 32, 64) | 73,792 |
| Conv2D Transpose | (None, 64, 64, 32) | 18,464 |
| Conv2D Transpose | (None, 128, 128, 16) | 4624 |
| Conv2D Transpose | (None, 256, 256, 1) | 145 |
| Total parameters | 390,913 | |
| Trainable parameters | 390,913 | |
| Non- trainable parameters | 0 |
| Feature | Mathematical Expression | Feature | Mathematical Expression |
|---|---|---|---|
| Minimum | Range | ||
| Maximum | Energy | ||
| Mean | Clearance Factor | ||
| Standard Deviation | Variance | ||
| Kurtosis | Impulse Factor | ||
| Skewness | Power | ||
| RMS | Peak to RMS | ||
| Crest Factor | Shape Factor |
| Hyperparameter | Fixed Parameters | Values Tested | Accuracies (%) |
|---|---|---|---|
| Number of Neurons | Epochs = 50, Batch Size = 32 | 32, 64, 128, 256 | 90.28, 91.65, 93.25, 92.78 |
| Batch Size | Neurons = 128, Epochs = 50 | 16, 32, 64, 128 | 93.06, 92.22, 93.30, 92.36 |
| Number of Epochs | Neurons = 128, Batch Size = 32 | 20, 30, 40, 50 | 86.25, 89.40, 92.30, 93.35 |
| Patient Stage | Subject Activities | Number of Samples | Length of Segments | Sampling Frequency (Hz) | Duration (s) | |
|---|---|---|---|---|---|---|
| Epileptic | Ictal | Set S (Seizure Activity) | 100 | 4097 | 173.61 | 23.60 |
| Interictal | Set F (Seizure Free) | 100 | 4097 | 173.61 | 23.60 | |
| Set N (Seizure Free) | 100 | 4097 | 173.61 | 23.60 | ||
| Healthy | Normal | Set O (Eyes Closed) | 100 | 4097 | 173.61 | 23.60 |
| Set Z (Eyes Open) | 100 | 4097 | 173.61 | 23.60 |
| Problem | Accuracy (%) | F1-Score (%) | Precision (%) | Sensitivity (%) |
|---|---|---|---|---|
| N–S | 100 | 100 | 100 | Class N: 100 Class S: 100 |
| Z–S | 100 | 100 | 100 | Class Z: 100 Class S: 100 |
| O–S | 100 | 100 | 100 | Class O: 100 Class S: 100 |
| FN–S | 100 | 100 | 100 | Class FN:100 Class S: 100 |
| FNZ–S | 100 | 100 | 100 | Class FNZ: 100 Class S: 100 |
| FNO–S | 100 | 100 | 100 | Class FNO: 100 Class S: 100 |
| NOZ–S | 100 | 100 | 100 | Class NOZ: 100 Class S: 100 |
| F–S | 98.12 | 98.12 | 98.13 | Class FNZ: 97.85 Class S: 98.5 |
| Problem | Accuracy (%) | F1-Score (%) | Precision (%) | Sensitivity (%) |
|---|---|---|---|---|
| F–O–S | 100 | 100 | 100 | Class F: 100 Class O: 100 Class S: 100 |
| N–Z–S | 98.75 | 98.75 | 98.76 | Class Z: 98.76 Class N: 100 Class S: 97.2 |
| O–Z–S | 96.25 | 96.26 | 96.37 | Class O: 93.18 Class Z: 98.60 Class S: 97.53 |
| FN–OZ–S | 98 | 97.93 | 97.98 | Class FN: 96.56 Class OZ: 100 Class S: 97.40 |
| Problem | Accuracy (%) | F1-Score (%) | Precision (%) | Sensitivity (%) |
|---|---|---|---|---|
| N–O–Z–S | 96.60 | 96.57 | 96.70 | Class N: 98.72 Class O: 94.51 Class S: 94.03 Class Z: 98.84 |
| F–O–Z–S | 98.75 | 98.75 | 98.76 | Class F: 98.56 Class O: 95.65 Class S: 97.50 Class Z: 96.25 |
| Training Features | Test Accuracy (%) | F-1 Score (%) | Precision (%) | Sensitivity for Epileptic Class (%) |
|---|---|---|---|---|
| CAE latent space features | 89.50 | 89.57 | 89.83 | 91.78 |
| Statistical features | 78.50 | 78.60 | 79.17 | 82.19 |
| Combined features | 93.25 | 93.21 | 93.23 | 100 |
| Author | Year | Method Used | Classifier | Classification Problem | Results |
|---|---|---|---|---|---|
| Zarei et al. [37] | 2021 | DWT | SVM | Z–S, O–S N–S, F–S | 99.50, 99.75 99.00, 99.50 |
| Wang et al. [38] | 2019 | Symlets wavelets and PCA | SVM | Z–S, O–S N–S, F–S | 100 98.4, 98.1 |
| Yazid et al. [11] | 2023 | DWT, local binary pattern transition histogram, and local binary pattern mean absolute deviation | KNN | Z–S O–S N–S F–S | 99.94 99.86 99.88 99.70 |
| Gupta et al. [18] | 2019 | Fourier Bassel series expansion and weighted multi-scale Renyi permutation entropy | LS-SVM | Z–S O–S N–S F–S | 99.50 99.50 99.50 97.50 |
| Mamli et al. [39] | 2019 | Fourier Synchro-Squeezed Transform and gray level co-occurrence matrix | KNN, SVM | ZO–S FN–S | 99.73 99.59 |
| Mandhouj et al. [26] | 2021 | STFT spectograms | CNN | ZO–S | 98.33 |
| Bari et al. [40] | 2020 | EMD with normalized intrinsic mode function | Quadratic Discriminant Analysis (QDA) | NF–S | 99.00 |
| Kaur et al. [41] | 2023 | Activations from conv5 | SVM | ZNF–S Z–N–S | 99.75 98.00 |
| Zhao et al. [42] | 2019 | Stationary WT and entropy features | Back-Propagation NN | ZO–NF–S | 93.30 |
| Baykara et al. [43] | 2021 | Stockwell Transform, Entropies, and Perservals energy | ELM | ZO–NF–S | 90.00 |
| Turk et al. [44] | 2019 | FFT, STFT, WT Transform | CNN | Z–N–F–S O–N–F–S Z–O–N–F | 90.50 91.50 93.60 |
| Zhang et al. [45] | 2021 | Frequency Slice WT (FSWT), Fuzzy entropy, and Higuchi FD | t-distributed stochastic neighbor embedding (t-SNE) | Z–O–N–F–S | 93.62 |
| Zhou et al. [46] | 2020 | DWT entropy features | RBF NN | Z–O–N–F–S | 78.40 |
| N–S, Z–S, O–S | 100 | ||||
| FN–S, FNZ–S, | |||||
| FNO–S, NOZ–S | 100 | ||||
| F–S | 98.12 | ||||
| F–O–S | 100 | ||||
| This Proposed Study | CWT and statistical features | LSTM | N–Z–S | 98.75 | |
| Bonn Epilepsy dataset | O–Z–S | 96.25 | |||
| FN–OZ–S | 98.00 | ||||
| N–O–Z–S | 96.60 | ||||
| F–O–Z–S | 97.00 | ||||
| F–N–O–Z–S | 93.25 | ||||
| This Proposed Study | |||||
| CHB-MIT-Epilepsy dataset | CWT, Statistical Features | LSTM | Ictal-interictal | 96.45 |
Disclaimer/Publisher’s Note: The statements, opinions and data contained in all publications are solely those of the individual author(s) and contributor(s) and not of MDPI and/or the editor(s). MDPI and/or the editor(s) disclaim responsibility for any injury to people or property resulting from any ideas, methods, instructions or products referred to in the content. |
© 2023 by the authors. Licensee MDPI, Basel, Switzerland. This article is an open access article distributed under the terms and conditions of the Creative Commons Attribution (CC BY) license (https://creativecommons.org/licenses/by/4.0/).
Share and Cite
Khan, S.U.; Jan, S.U.; Koo, I. Robust Epileptic Seizure Detection Using Long Short-Term Memory and Feature Fusion of Compressed Time–Frequency EEG Images. Sensors 2023, 23, 9572. https://doi.org/10.3390/s23239572
Khan SU, Jan SU, Koo I. Robust Epileptic Seizure Detection Using Long Short-Term Memory and Feature Fusion of Compressed Time–Frequency EEG Images. Sensors. 2023; 23(23):9572. https://doi.org/10.3390/s23239572
Chicago/Turabian StyleKhan, Shafi Ullah, Sana Ullah Jan, and Insoo Koo. 2023. "Robust Epileptic Seizure Detection Using Long Short-Term Memory and Feature Fusion of Compressed Time–Frequency EEG Images" Sensors 23, no. 23: 9572. https://doi.org/10.3390/s23239572
APA StyleKhan, S. U., Jan, S. U., & Koo, I. (2023). Robust Epileptic Seizure Detection Using Long Short-Term Memory and Feature Fusion of Compressed Time–Frequency EEG Images. Sensors, 23(23), 9572. https://doi.org/10.3390/s23239572